Embed Size (px)
Citation preview

Washington State Lead
Chemical Action Plan
September 2009 Publication no. 09-07-008

Publication and Contact Information
This report is available on the Department of Ecology’s website at www.ecy.wa.gov/biblio/0907008.html For more information contact: Solid Waste and Financial Assistance Program P.O. Box 47600 Olympia, WA 98504-7600
Phone: 360-407-6900
Washington State Department of Ecology - www.ecy.wa.gov
o Headquarters, Olympia 360-407-6000 o Northwest Regional Office, Bellevue 425-649-7000 o Southwest Regional Office, Olympia 360-407-6300 o Central Regional Office, Yakima 509-575-2490 o Eastern Regional Office, Spokane 509-329-3400 To ask about the availability of this document in a format for the visually impaired, call the Solid Waste and Financial Assistance Program at 360-407-6900. Persons with hearing loss can call 711 for Washington Relay Service. Persons with a speech disability can call 877-833-6341.

Washington State Lead Chemical Action Plan
The Lead Chemical Action Plan Technical Committee contributed to the development of this document. Members include: Washington State Department of Ecology Michael Bergman Office of Communications and Education Tyler Bradley-Hewitt Solid Waste and Financial Assistance Program Laurel Cain Hazardous Waste and Toxics Reduction Program Cathy Carruthers Governmental Relations – Rules Unit Holly Davies, Ph. D. Solid Waste and Financial Assistance Program Damon Delistraty, Ph.D. Hazardous Waste and Toxics Reduction Program Mike Gallagher Solid Waste and Financial Assistance Program Emma Johnson Solid Waste and Financial Assistance Program Norm Peck Toxics Cleanup Program Keith Seiders Environmental Assessment Program Alex Stone, Sc. D. Hazardous Waste and Toxics Reduction Program Tom Todd Air Quality Program Dewey Weaver Water Quality Program Sarah Wilson Governmental Relations – Rules Unit Washington State Department of Health Jim W. White, Ph. D. Office of Environmental Health Assessments
Washington State Department of Labor & Industries Steve Whittaker, Ph. D. Safety & Health Assessment & Research for Prevention Program

This page is purposely left blank

Washington State Department of Health
Washington State Department of Ecology
Dear Washington Resident:
The Washington State Departments of Ecology and Health have jointly produced the attached Lead Chemical Action Plan with the assistance of other state agencies and a diverse group of stakeholders. The action plan is part of our strategy to phase out the releases of, and exposures to, the most toxic chemicals in Washington. This plan identifies current uses of lead, details where it’s found in our environment, describes how people and animals are exposed to lead, and recommends ways to reduce the harm it causes people and the environment. Lead was recognized as a poison more than 2000 years ago. There is no known safe level of lead, and despite several national efforts in the past century to reduce people’s exposure, it is still a hazard for people and the environment in Washington.
While lead is a natural element in the environment, most lead-related health and environmental problems are the result of human activities. Lead was commonly used in products like paint and plumbing materials. These potential sources of lead exposure are still present in many homes. Past industrial emissions and widespread use of lead-containing pesticides have contaminated soil in many parts of the state. Lead is still used in products manufactured today, leaving the potential for exposure to workers, consumers, or the environment.
We’re all exposed to lead, mostly from materials and products in and around our homes. Since exposure comes from many different sources and pathways, it takes a variety of approaches to reduce people’s lead intake. The recommendations presented in this plan represent practical and effective steps to begin reducing the most significant lead exposures and releases in Washington.
While all the recommendations are important, the Departments of Ecology and Health recommend that priority be given to those that focus on reducing exposure to young children, the largest and most vulnerable group affected by lead. In these challenging economic times, we believe that it is most important to address lead-based paint in older homes, the most frequent cause of childhood lead poisoning. Lead-based paint is not the only significant source of lead to children. Lead from many sources can harm children, adults, and wildlife; that is why the other recommendations are also important and should be implemented as opportunities present themselves and resources become available.
Some people believe this action plan is too broad, while others say it doesn’t go far enough. We owe it to ourselves and to future generations to take deliberate steps to reduce or remove sources of human-caused lead exposure so that we can preserve and enhance the unique quality of life in our state.
We want to personally thank those who participated on the Lead Chemical Action Plan Advisory Committee. Their time, interest, and input led to the development of a plan that provides Washington State with a practical strategy to reduce lead in the environment and reduce health risks to its residents.
Jay J. Manning, Director Mary C. Selecky, Secretary Department of Ecology Department of Health

iii
Table of Contents Executive Summary .......................................................................................................... vii
Acronyms and Abbreviations .......................................................................................... xiii
I. Introduction and Purpose of the Document ......................................................................1
II. General Chemical Information ........................................................................................3 Physical and Chemical Properties of Lead ....................................................................3 Historical Perspectives ...................................................................................................4 How Lead Enters the Environment ................................................................................6 Natural and Background Sources of Lead ...................................................................10 Presence of Lead in Washington’s Environment .........................................................14
III. Human Health and Environmental Impacts of Lead ....................................................17 Lead and Human Health ..............................................................................................17
Summary - Lead Toxicity and Exposure .............................................................17 A Brief History of Lead Toxicity and Exposure .................................................18 Lead Toxicity .......................................................................................................19 Exposure to Lead .................................................................................................22 Public health statements and recommendations from agencies and medical groups .............................................................................................................................36 Human Health References ...................................................................................42
Health Effects in Other Organisms ..............................................................................49 Overview .............................................................................................................49 Lead Toxicity .......................................................................................................50 Exposure to Lead .................................................................................................51
Lead in the Food Chain ................................................................................................53
IV. Production, Uses and Releases of Lead .......................................................................55 Historical Uses/ Legacy ...............................................................................................55
Lead-based paint ..................................................................................................56 Soil and sediment ................................................................................................58 Plumbing ..............................................................................................................63
Occupational Uses .......................................................................................................65 Workplace Exposure to Lead ..............................................................................65 Health effects of lead exposure in adults .............................................................66 Workplace regulations .........................................................................................67 Tracking adult lead exposures .............................................................................75
Consumer Products ......................................................................................................81 Toys .....................................................................................................................84 Jewelry .................................................................................................................87 Food and Nutritional Supplements ......................................................................90 Cosmetics and Personal Care Products ...............................................................95 Art Supplies .........................................................................................................97 Vinyl Products .....................................................................................................99 Fishing, Hunting, and Shooting .........................................................................106 General and Electronic Uses of Solder ..............................................................112

iv
Plumbing ............................................................................................................115 Other Alloys ......................................................................................................118 Batteries .............................................................................................................120 Weights ..............................................................................................................123 Leaded fuel ........................................................................................................126 Specialty Glass ..................................................................................................129 Specialty Paint ...................................................................................................132 Decorative and Hobby Uses of Lead .................................................................134
Ongoing Releases.......................................................................................................141 Air ......................................................................................................................142 Water .................................................................................................................145 Soil .....................................................................................................................148 Sediment ............................................................................................................149 Multimedia ........................................................................................................149 Summary ............................................................................................................153
V. Research and Monitoring ............................................................................................154
VI. Current Regulatory and Management Approaches for Lead .....................................157 Introduction ................................................................................................................157 Federal Lead Laws and Regulations ..........................................................................160 Washington State Laws and Regulations ...................................................................168 Local Regulation ........................................................................................................176 Selected Lead Laws and Regulations for other States ...............................................178 International Regulation of Lead ...............................................................................189 Regulation References ...............................................................................................194
VII Recommendations .....................................................................................................213 Reducing Exposure to Children .................................................................................217 Reducing Exposures from Legacy Sources ...............................................................223 Reducing Exposures from Occupational Sources ......................................................231 Reducing Exposures from New Products ..................................................................236 Reducing Exposures from Ongoing Releases ............................................................242
VIII. Implementation Steps ..............................................................................................244 Ecology will focus on the following recommendations: ...........................................244
IX. Performance Measures ...............................................................................................246
X. Economic Analysis of Lead Exposure ........................................................................249 Overview ....................................................................................................................249 Estimate of Costs of Current Lead Exposure .............................................................251
Income Effects from IQ loss in Childhood ........................................................251 Estimate Model Description and Background ...................................................252
Estimates of Costs to Reduce Exposure to Lead .......................................................259 Costs to require remediation in rental homes after a confirmed EBLL ............259 Costs to require assessment of lead hazards in pre-1960 rental homes .............262 Costs for remediation of all lead-based paint in Washington homes ................263 Costs for remediation of all lead contaminated soil in Washington homes ......263

v
Costs for remediation of all homes for paint and soil .......................................265 Costs to switch to non-lead wheel weights, shot and small fishing weights .....265 Costs to Increase Childhood Blood Lead Level Testing ...................................270
XI. General References ....................................................................................................272
Appendices Appendix A 2007 Toy Recalls Appendix B 2007 Jewelry Recalls Appendix C Washington Data on Blood Lead Levels Appendix D IQ Effects from Blood Lead Levels Appendix E Income Effects from Reduced IQ Appendix F 2005 Toxics Release Inventory (TRI) for Washington State Appendix G Facilitator’s Report Appendix H Response to Public Comments Appendix I Public Comments
List of Figures and Tables Figures Figure 1- Naturally Occurring vs. Manmade Lead ....................................................................... 11 Figure 2- Natural Global Lead Cycle ............................................................................................ 11 Figure 3- Life Cycle of Lead and Release into the Environment ................................................. 12 Figure 4- Washington Exceedances of the Marine Sediment Clean Up Level............................. 15 Figure 5- Trends for Lead in Puget Sound Sediments .................................................................. 15 Figure 6- Seattle Area Air Lead Data (2000-2007) ...................................................................... 16 Figure 7- 2005 U.S. Lead Usage (in thousand metric tons) .......................................................... 82 Figure 8- Vinyl Chloride Monomer .............................................................................................. 99 Figure 9- Vinyl Chloride Polymer (PVC) ..................................................................................... 99 Figure 10- Trend in Annual Average Lead Concentrations in Biosolids from the West Point Treatment Plant 1988-2006......................................................................................................... 152 Figure 11- Blood Lead Levels in ug/dL Over Time ................................................................... 254 Tables Table 1- Chemical Properties of Lead ............................................................................................ 3 Table 2- Some Effects of Lead and the Blood Lead Levels at Which They Have Been Observed in People........................................................................................................................................ 21 Table 3- Blood Lead Levels in U.S. Children .............................................................................. 31 Table 4- Blood Lead Levels in the U.S. Population- All Ages..................................................... 31 Table 5- Where Washington State Ranks in Lead Poisoning Risk Factors .................................. 35 Table 6- Prevalence of Lead in U.S. Housing by Age .................................................................. 57

vi
Table 7- IEUBK Predictions for Soil Exposure ............................................................................ 62 Table 8- Summary of the Lead Occupational Regulations: General Industry and Construction . 69 Table 9- Number of Adult Blood Level Tests Reported in Washington State ............................. 76 Table 10- Number of Washington Industries with Three or More Elevated BLL Reports ((≥ 25 μg/dl), January 1 - December 31, 2006 ......................................................................................... 77 Table 11- Top 10 Washington industries with elevated blood lead reports (January 1, 1994 to December 31, 2006) ...................................................................................................................... 80 Table 12- Traditional Remedies Reported to Contain Lead ......................................................... 93 Table 13- Estimates of Lead Fishing Weights Used/Lost in Washington .................................. 108 Table 14- Estimates of Lead Ammunition Used in Washington ................................................ 110 Table 15- Electrical Equipment (SIC 36) ................................................................................... 113 Table 16- Estimates of Lead-Acid Batteries in Washington ...................................................... 122 Table 17- Estimates of Lead Wheel Weights Lost in Washington ............................................. 125 Table 18- Summary of 2005 TRI (lbs) ....................................................................................... 142 Table 19- Estimated National Emissions of Lead to Air (thousands of tons) ............................ 143 Table 20- Lead in Stormwater by Industry ................................................................................. 147 Table 21- Summary of Ongoing Releases of Lead ..................................................................... 153 Table 22- Selected Federal and State Laws ................................................................................ 157 Table 23- Summary of Federal and Washington State Lead Standards ..................................... 177 Table 24- Summary of U.S. State Lead Standards ..................................................................... 178 Table 25- State Non-Toxic Shot Requirements in the U.S. ........................................................ 185 Table 26- Washington Childhood Blood Lead Level Data 2001-2007 ...................................... 253 Table 27- Multipliers for each BLL Range................................................................................. 255 Table 28- Estimated IQ Point Loss for each BLL Range in the population of Washington children each year ....................................................................................................................... 255 Table 29- Estimated Costs of Lost Income for each BLL Range ............................................... 257 Table 30- Contractors' Average Cost Estimates ......................................................................... 260 Table 31- Estimate of Washington Homes with Lead Hazards .................................................. 263 Table 32- Soil Lead Levels by Housing Age .............................................................................. 264 Table 33- Soil Lead and its Relationship to Exterior Lead-Based Paint from Jacobs et al. 2002..................................................................................................................................................... 264 Table 34- Estimated Costs of Remediation of Soil for Housing ................................................ 264 Table 35- Estimated Cost of Replacing Lead Wheel Weights ................................................... 265 Table 36- Estimated Cost of Lead Shot Alternatives .................................................................. 266 Table 37- Estimated Cost of Replacing Lead Shot ..................................................................... 267 Table 38- Estimates of Lead Shot Used in Washington ............................................................. 268 Table 39- Comparison of Fishing Weight Costs......................................................................... 268 Table 40- Estimates of Costs for Childhood Blood Lead Level Testing .................................... 270 Table 41- Range of Costs of BLL Testing with Case Management ........................................... 271
vii
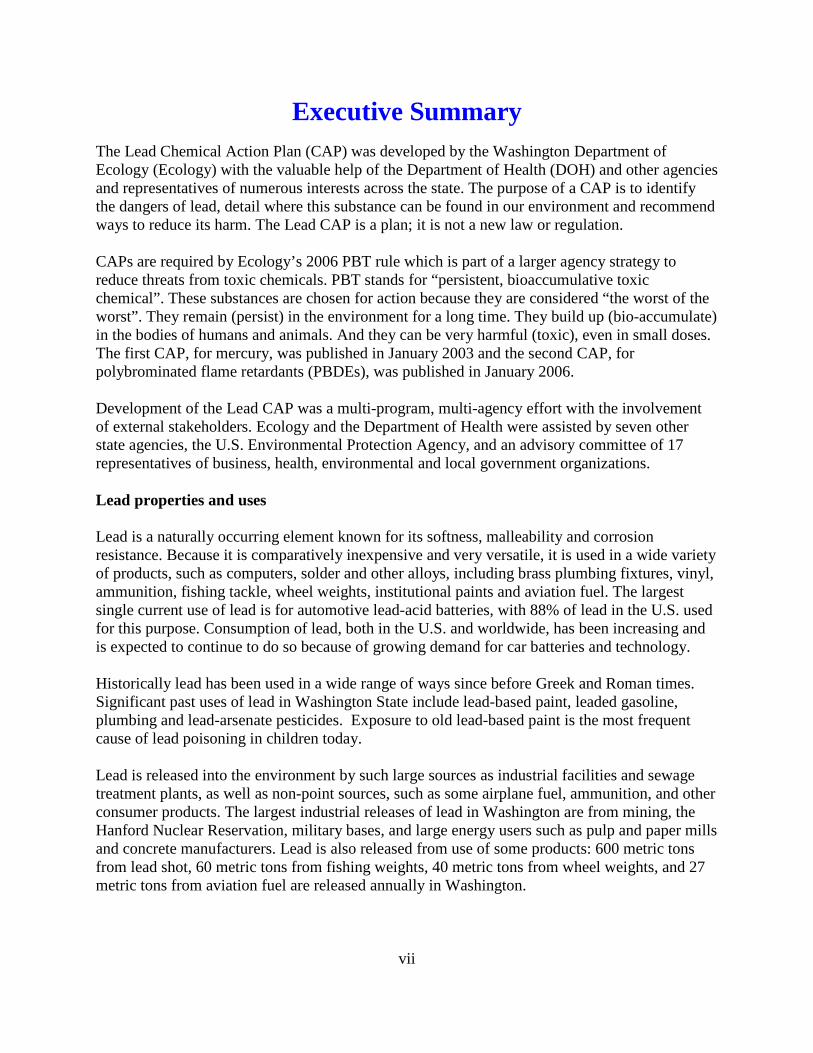
Executive Summary The Lead Chemical Action Plan (CAP) was developed by the Washington Department of Ecology (Ecology) with the valuable help of the Department of Health (DOH) and other agencies and representatives of numerous interests across the state. The purpose of a CAP is to identify the dangers of lead, detail where this substance can be found in our environment and recommend ways to reduce its harm. The Lead CAP is a plan; it is not a new law or regulation. CAPs are required by Ecology’s 2006 PBT rule which is part of a larger agency strategy to reduce threats from toxic chemicals. PBT stands for “persistent, bioaccumulative toxic chemical”. These substances are chosen for action because they are considered “the worst of the worst”. They remain (persist) in the environment for a long time. They build up (bio-accumulate) in the bodies of humans and animals. And they can be very harmful (toxic), even in small doses. The first CAP, for mercury, was published in January 2003 and the second CAP, for polybrominated flame retardants (PBDEs), was published in January 2006. Development of the Lead CAP was a multi-program, multi-agency effort with the involvement of external stakeholders. Ecology and the Department of Health were assisted by seven other state agencies, the U.S. Environmental Protection Agency, and an advisory committee of 17 representatives of business, health, environmental and local government organizations. Lead properties and uses Lead is a naturally occurring element known for its softness, malleability and corrosion resistance. Because it is comparatively inexpensive and very versatile, it is used in a wide variety of products, such as computers, solder and other alloys, including brass plumbing fixtures, vinyl, ammunition, fishing tackle, wheel weights, institutional paints and aviation fuel. The largest single current use of lead is for automotive lead-acid batteries, with 88% of lead in the U.S. used for this purpose. Consumption of lead, both in the U.S. and worldwide, has been increasing and is expected to continue to do so because of growing demand for car batteries and technology. Historically lead has been used in a wide range of ways since before Greek and Roman times. Significant past uses of lead in Washington State include lead-based paint, leaded gasoline, plumbing and lead-arsenate pesticides. Exposure to old lead-based paint is the most frequent cause of lead poisoning in children today. Lead is released into the environment by such large sources as industrial facilities and sewage treatment plants, as well as non-point sources, such as some airplane fuel, ammunition, and other consumer products. The largest industrial releases of lead in Washington are from mining, the Hanford Nuclear Reservation, military bases, and large energy users such as pulp and paper mills and concrete manufacturers. Lead is also released from use of some products: 600 metric tons from lead shot, 60 metric tons from fishing weights, 40 metric tons from wheel weights, and 27 metric tons from aviation fuel are released annually in Washington.

viii
Health effects for people and wildlife Lead is a highly toxic chemical that affects many parts of the body and can cause many different types of health problems to both people and wildlife. No plant or animal has been found that requires lead to live or to function, and no organism has been found that is not harmed by lead. The negative health effects of lead on humans have been known for thousands of years. It affects the central and peripheral nervous systems, cardiovascular system, kidney, blood, gastrointestinal system, immune system, and reproductive system. Reports of lead poisoning of factory workers and children were common from the 1700s to 1900s. Eliminating the use of lead paint and leaded gasoline significantly reduced the occurrence of such acute lead poisonings. Today the harmful effects of lead are often more subtle and can be easily missed until it is too late and permanent harm has occurred. In the 1970s researchers began to identify harmful effects of lead at very low doses in both children and adults. Many studies have shown that children and adults can be harmed by lead without having obvious signs of acute poisoning. For children, the primary concern is the effect low levels of lead have on a child’s developing nervous system. In adults, low levels of lead can cause reproductive harm and increases in blood pressure. For an individual, the harmful effects of lead are hard to predict and depend on the amount and length of exposure, age, diet, health status, and genetic susceptibility. However, at the population level there are known risk factors for children, such as age of housing, ethnicity, and income level. An accurate and inexpensive way to measure an individual’s exposure is with a blood lead test. Compared to other states, Washington has a relatively large number of young children with risk factors for lead poisoning and yet, very few children in Washington are tested for lead in their blood. Everyone has some exposure to lead, and harmful effects can occur from relatively common everyday sources. While exposure to lead-based paint is thought to be the most frequent cause of lead poisoning in children, many other lead containing sources have also been associated with elevated blood lead levels. Most elevated blood lead levels in adults appear to be caused by workplace exposures. The effects of lead and exposure pathways for other living things are similar to those in humans. Animals that do not die directly from acute lead exposure may face chronic effects, which can reduce their ability to survive or reproduce in the wild. Like humans, animals take in lead by inhalation, ingestion, exposure of the fetus, and, to a lesser extent, absorption through skin. As with humans, younger animals are the most sensitive to the effects of lead. They show damage to their nervous system even if there are no obvious signs of lead poisoning. Some of the more important sources of lead exposure for animal populations are lead ammunition, industrial emissions, and contaminated soil.

ix
Recommendations A consistent challenge in developing recommendations to reduce lead exposures is the number of diverse uses and sources of lead. Ecology and DOH recommend a variety of actions to address the worst problems caused by the ongoing uses and releases of lead. These recommendations are based on an extensive review of scientific research on this topic, as well as the following conclusions and guiding principles:
· Blood lead levels as low as 2 micrograms per deciliter (mg/dL) have been shown to have harmful effects.
· There is no known safe level of lead exposure for children. · Harmful lead exposure is widespread and largely preventable. · Children are more vulnerable than adults – but all people and the environment must be
protected. · Priority should be placed on vulnerable populations. · Lead-poisoned individuals should be identified and helped. · Adverse health effects of lead can be permanent, so preventing exposures before they
occur is crucial. · Eliminating lead use is the best way to reduce lead exposures long term. · People should be encouraged to use less toxic alternatives when available. · Information about chemical hazards needs to reach people so they can protect themselves
and their families. · Costs (such as health care and environmental cleanup) associated with current lead
exposure are large. Preventing lead exposures is the smart, healthy way to lower these costs.
Because harmful lead exposure is relatively common and comes from many sources, an effective program to reduce exposure requires the use of several different approaches including public education, increased blood lead testing, continued environmental testing, removal of existing exposure sources, and preventing new sources of exposure. Making a difference in Washington will require collaboration among many agencies. Below is a summary of the recommendations. Our priority is preventing lead exposure in children and helping children who already have elevated blood lead levels. We propose to do this by focusing on known risk factors, such as lead-based paint.
x
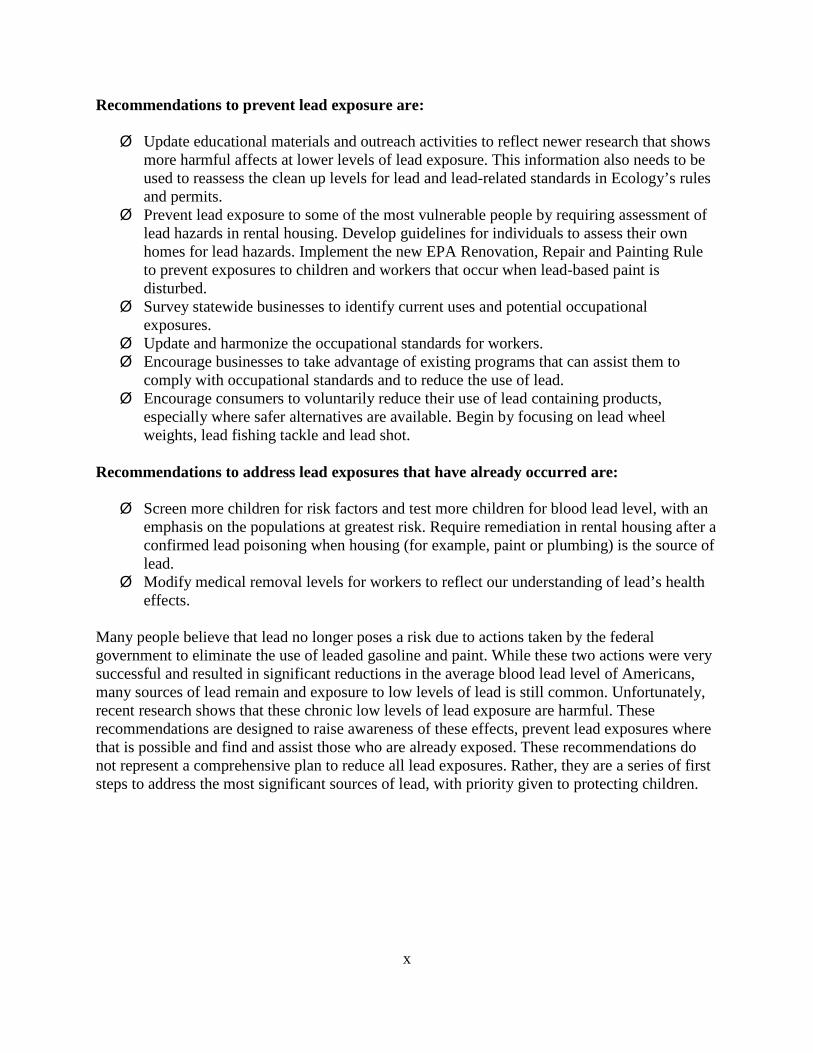
Recommendations to prevent lead exposure are: Ø Update educational materials and outreach activities to reflect newer research that shows
more harmful affects at lower levels of lead exposure. This information also needs to be used to reassess the clean up levels for lead and lead-related standards in Ecology’s rules and permits.
Ø Prevent lead exposure to some of the most vulnerable people by requiring assessment of lead hazards in rental housing. Develop guidelines for individuals to assess their own homes for lead hazards. Implement the new EPA Renovation, Repair and Painting Rule to prevent exposures to children and workers that occur when lead-based paint is disturbed.
Ø Survey statewide businesses to identify current uses and potential occupational exposures.
Ø Update and harmonize the occupational standards for workers. Ø Encourage businesses to take advantage of existing programs that can assist them to
comply with occupational standards and to reduce the use of lead. Ø Encourage consumers to voluntarily reduce their use of lead containing products,
especially where safer alternatives are available. Begin by focusing on lead wheel weights, lead fishing tackle and lead shot.
Recommendations to address lead exposures that have already occurred are: Ø Screen more children for risk factors and test more children for blood lead level, with an
emphasis on the populations at greatest risk. Require remediation in rental housing after a confirmed lead poisoning when housing (for example, paint or plumbing) is the source of lead.
Ø Modify medical removal levels for workers to reflect our understanding of lead’s health effects.
Many people believe that lead no longer poses a risk due to actions taken by the federal government to eliminate the use of leaded gasoline and paint. While these two actions were very successful and resulted in significant reductions in the average blood lead level of Americans, many sources of lead remain and exposure to low levels of lead is still common. Unfortunately, recent research shows that these chronic low levels of lead exposure are harmful. These recommendations are designed to raise awareness of these effects, prevent lead exposures where that is possible and find and assist those who are already exposed. These recommendations do not represent a comprehensive plan to reduce all lead exposures. Rather, they are a series of first steps to address the most significant sources of lead, with priority given to protecting children.

xi
Lead CAP External Advisory Committee Members June 2007– May 2008 Stakeholder Representatives Academic Interests Inst. Of Neurotoxicology and Neurological Disorders Steve Gilbert, Ph. D. Community Groups Solutions for Humanity, Community, and the Environment Amy Bates Electronic Products Phillips Medical Systems Cathy McCaffrey Environmental Organizations People for Puget Sound Heather Trim Washington Toxics Coalition Ivy Sager-Rosenthal General Business & Industry Association of Washington Business Grant Nelson Painting Industry Pacific Northwest Paint Council Mark Gjurasic, John Woodring (Washington Apartment Association, Institute for Real Estate Management) Lead Abatement IRS Environmental Rob Reed
Medical Washington State Hospital Association Robb Menaul Mining Northwest Mining Association Laura Skaer Occupational Health Occupational Health & Environmental Nursing Karen Bowman Product Stewardship Northwest Product Stewardship Council Lisa Sepanski Public Health Tacoma-Pierce County Health Department Frank Dibiase Recreation Puget Sound Anglers Paul Ronald Recycling Total Reclaim, Inc. Craig Lorch Small Business Independent Business Association Gary Smith Transportation All Battery Sales & Service Thomas Allen

xii
Executive Agency Advisors to the Departments of Ecology and Health Department of Community, Trade And Economic Development (CTED) Cindy LaRose Cynthia Sanderson Patricia McLachlan Department of Social and Health Services (DSHS) Nancy Anderson, MD Department of Corrections (DOC) Shane Loper
Department of Fish and Wildlife (DFW) Carl Samuelson Department of Labor & Industries (L & I) Cheryl Christian Department of Early Learning (DEL) Frances Limtiaco Department of Transportation David Moore Tanya Bird EPA Region 10 Pat Springer Facilitator Cascadia Consulting Lead Facilitator: Marc Daudon Assisted by Jessica Branoim-Zwick

xiii
Acronyms and Abbreviations ATSDR Agency for Toxic Substances and Disease Registry
BLL Blood lead level
CAA Clean Air Act
CARB California Air Resources Board
CDC Centers for Disease Control
CEPA Canadian Environmental Protection Act
CPSC Consumer Product Safety Commission
CTED Washington State Department of Community Trade and Economic Development
DEL Washington State Department of Early Learning
DOC Washington State Department of Corrections
DOH Washington State Department of Health
DOSH L&I, Division of Occupational and Health Safety
DOT Washington State Department of Transportation
DSHS Washington State Department of Social and Health Services
EBLL Elevated blood lead level
Ecology Washington State Department of Ecology EPA U.S. Environmental Protection Agency
EPSDT Early and Periodic Screening, Diagnostic, and Treatment
EU European Union
FAA Federal Aviation Administration
FDA U.S. Food and Drug Administration
FHSA Federal Hazardous Substances Act
FOIA Freedom of Information Act
GAO Government Accountability Office
HAP Hazardous Air Pollutant
HUD U.S. Department of Housing and Urban Development
IEUBK Integrated Exposure Uptake and Biokinetic model
ISWGP Industrial Storm Water General Permit
L&I/LNI Washington State Department of Labor and Industries
MACT Maximum Achievable Control Technology
MCL Maximum Contaminant Level

xiv
MCLG Maximum Contaminant Level Goal
MSDS Material Safety Data Sheets
MSW Municipal Solid Waste
MTCA Washington State Model Toxics Control Act
NAAQS National Ambient Air Quality Standards
NHANES National Health and Nutrition Examination Survey
NIOSH National Institute for Occupational Safety and Health
NPDES National Pollutant Discharge Elimination System
OEHHA California Office of Environmental Health Assessment
OSHA U.S. Department of Labor, Occupational Safety and Health Administration
PBT Persistent Bioaccumulative Toxic Chemical
Pb Elemental symbol for the element lead
PEL Permissible Exposure Limit
POP persistent organic pollutant
PSAMP Puget Sound Assessment and Monitoring Program
PVC Polyvinyl Chloride
RCRA Resource Conservations and Recovery Act
REACH Registration, Evaluation and Authorization of Chemicals
RoHS Restriction on Hazardous Substances
SDWA Safe Drinking Water Act
SEDQUAL Sediment Quality
SHARP L&I, Safety & Health Assessment & Research for Prevention
SNUR Significant New Use Rule
SDWA Safe Drinking Water Act
TEL Tetra Ethyl Lead
TREE Technical Resources for Engineering Efficiency
TRI Toxics Release Inventory
TSCA Toxics Substances Control Act
TTB U.S. Tobacco Tax and Trade Bureau
USDA U.S. Department of Agriculture
USGS U.S. Geological Survey
WAC Washington Administrative Code
WDFW Washington State Department of Fish and Wildlife

1
I. Introduction and Purpose of the Document Chemical Action Plans (CAPs) are the vehicle the department of Ecology uses to assess problems and recommend actions to reduce threats caused by use of persistent, bioaccumulative and toxic chemicals (PBTs) and metals of concern. Lead is such a metal of concern. CAPs are developed in accordance with the PBT rule (WAC 173-333). In 2007 Ecology completed a multiyear schedule to identify the next three CAPs. Lead was selected for the next CAP because of the following:
· It is very widespread present in most homes and widely distributed throughout the environment.
· A great deal is known about where it is used and how it is distributed released into the environment.
· There is an abundance of data on its detrimental health effects, particularly on children. · There are many known opportunities to reduce its use and impact.
This document estimates the amount of lead used and released from all man-made and naturally occurring sources or activities in Washington. It also includes estimates of production, intentional and unintentional uses, disposal and other practices that contribute to exposure. It describes the impact on human health and the environment associated with the use and release of lead, including levels present in the environment, potential for exposure, likely fate and transport mechanisms, available body burden data, toxicity effects, and rates of diseases that have been associated with exposure. The CAP describes the current regulations of lead and recommends additional actions to reduce harm caused by current and historic uses of this metal. Ecology’s intent in developing these CAP recommendations was to propose actions to reduce or phase out current uses of lead where possible and to prevent future exposures. However, this plan does not address every source of lead. Instead, the CAP presents an adaptive management strategy. A series of initial actions that address the worst sources of exposures are proposed as a starting point along with options for further actions in the future as needed. There are recommendations for reducing and phasing-out uses and releases, managing products or wastes, minimizing exposure, switching to safer substitutes, and encouraging the development of safer alternatives. Recommendations are evaluated on economic and social impacts, environmental and human health benefits associated with implementing the action, feasibility, and the availability and effectiveness of safer substitutes. Performance measures are included to assess progress.

2
The following conclusions form the basis of our recommendations: · Lead poisoning still occurs in Washington. · In Washington, there is little reliable information about the number of highly exposed
children and the sources of their lead exposure. · Most homes in Washington have lead-based paint or other potential exposure sources that
could cause lead poisoning. · Lead continues to be used in new products and is still released into the environment in
Washington. · Many people in Washington do not have adequate knowledge of lead hazards and how to
reduce exposure.

3
II. General Chemical Information Physical and Chemical Properties of Lead Lead is one of the 90 natural occurring elements and comprises only a small percentage of the overall content of the planet. Lead, however, is concentrated in the mantle and can be found in appreciable quantities in specific locations. The largest producers of lead in 2004 are China, Australia, the United States, Peru and Mexico (U.S. Geological Survey 2007). The following table lists the pertinent chemical properties of lead (Agency for Toxic Substances and Disease Registry 2005): Table 1- Chemical Properties of Lead Abbreviation:
Pb
Atomic Number:
82
Synonyms: Plumbum, pigment metal
Chemical Abstracts Number (CAS):
7439-92-1
Registry of Toxic Effects of Chemical Substances (RTECS) number:
OF7525000
Molecular Weight:
207.2
Boiling point:
1,740oC (3,164oF)
Specific gravity:
11.34 at 16oC (61oF)
Vapor pressure:
1.77 mm Hg at 1,000oC
Melting point:
327.4oC or 621oF
Incompatibilities and Reactivities:
Strong oxidizers, hydrogen peroxide, acids
Physical characteristics:
Bluish grey, malleable metal. A dull silvery coating occurs when subjected to oxygen.
Soil sorption coefficient: N/A; low mobility in most soils, lowest at neutral pH and high organic matter
Bioconcentration Factor:
Log BCF for fish, 1.65; shellfish, 3.4
Water solubility of lead and lead compounds at 25 ºC:
Metal: low solubility Acetate: 443 g/L Arsenate: insoluble in cold water Carbonate: 0.0011 g/L
4
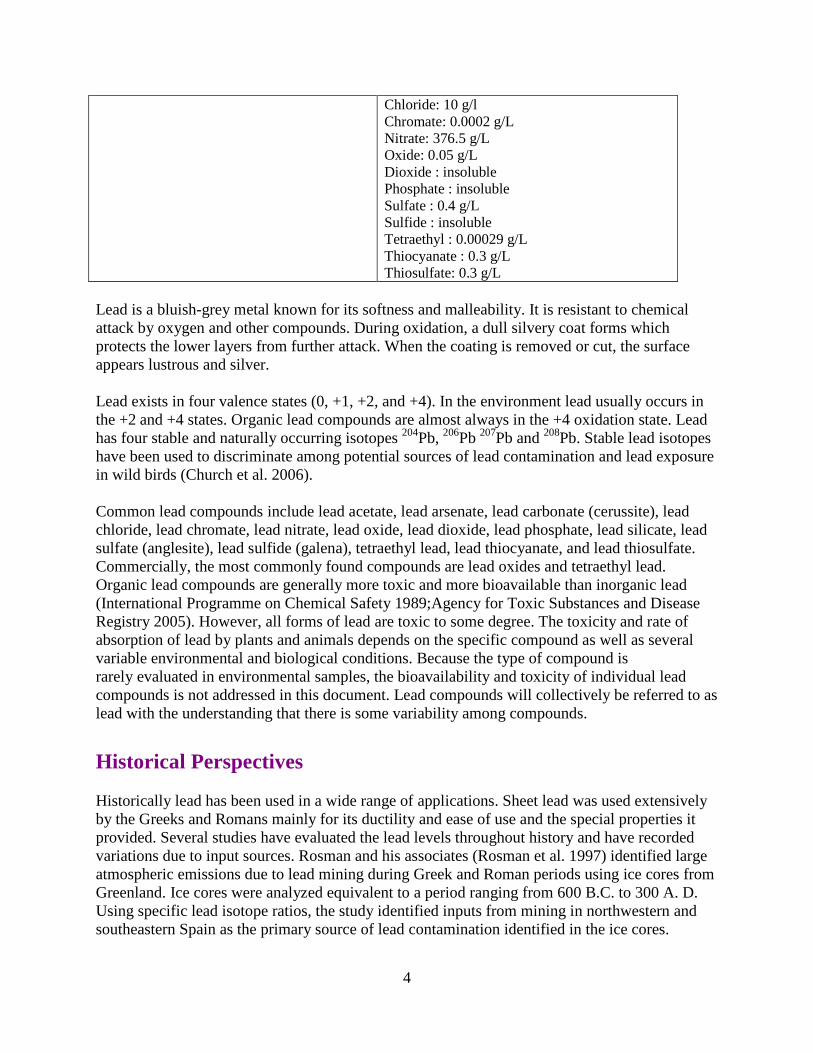
Chloride: 10 g/l Chromate: 0.0002 g/L Nitrate: 376.5 g/L Oxide: 0.05 g/L Dioxide : insoluble Phosphate : insoluble Sulfate : 0.4 g/L Sulfide : insoluble Tetraethyl : 0.00029 g/L Thiocyanate : 0.3 g/L Thiosulfate: 0.3 g/L
Lead is a bluish-grey metal known for its softness and malleability. It is resistant to chemical attack by oxygen and other compounds. During oxidation, a dull silvery coat forms which protects the lower layers from further attack. When the coating is removed or cut, the surface appears lustrous and silver. Lead exists in four valence states (0, +1, +2, and +4). In the environment lead usually occurs in the +2 and +4 states. Organic lead compounds are almost always in the +4 oxidation state. Lead has four stable and naturally occurring isotopes 204Pb, 206Pb 207Pb and 208Pb. Stable lead isotopes have been used to discriminate among potential sources of lead contamination and lead exposure in wild birds (Church et al. 2006). Common lead compounds include lead acetate, lead arsenate, lead carbonate (cerussite), lead chloride, lead chromate, lead nitrate, lead oxide, lead dioxide, lead phosphate, lead silicate, lead sulfate (anglesite), lead sulfide (galena), tetraethyl lead, lead thiocyanate, and lead thiosulfate. Commercially, the most commonly found compounds are lead oxides and tetraethyl lead. Organic lead compounds are generally more toxic and more bioavailable than inorganic lead (International Programme on Chemical Safety 1989;Agency for Toxic Substances and Disease Registry 2005). However, all forms of lead are toxic to some degree. The toxicity and rate of absorption of lead by plants and animals depends on the specific compound as well as several variable environmental and biological conditions. Because the type of compound is rarely evaluated in environmental samples, the bioavailability and toxicity of individual lead compounds is not addressed in this document. Lead compounds will collectively be referred to as lead with the understanding that there is some variability among compounds.
Historical Perspectives Historically lead has been used in a wide range of applications. Sheet lead was used extensively by the Greeks and Romans mainly for its ductility and ease of use and the special properties it provided. Several studies have evaluated the lead levels throughout history and have recorded variations due to input sources. Rosman and his associates (Rosman et al. 1997) identified large atmospheric emissions due to lead mining during Greek and Roman periods using ice cores from Greenland. Ice cores were analyzed equivalent to a period ranging from 600 B.C. to 300 A. D. Using specific lead isotope ratios, the study identified inputs from mining in northwestern and southeastern Spain as the primary source of lead contamination identified in the ice cores.

5
Branvall and his associates analyzed lead concentrations and stable lead isotopes (206Pb/207Pb ratios) of sediments from four lakes in northern Sweden to provide a record of atmospheric lead pollution for the last 3,000 years. There is a clear signal in the sediments of airborne pollution from Greek & Roman cultures 2,000 years ago, followed by a period of “clean” conditions 400-900 A.D. From 900 A.D., there was a conspicuous, permanent increase in atmospheric lead pollution fallout. Atmospheric lead pollution deposition did not, when seen in a historical perspective increase as much as usually assumed with the Industrial Revolution (1800 A.D.) (Brannvall et al. 2007). In addition, Bindler and his associates studied lead levels for a period of approximately 5,000 years using peat cores (Bindler et al. 1999). The study determined that background lead levels prior to any anthropogenic activities were quite low (typically less than or equal to 0.1 μg/g). Greek and Roman use of lead increased levels to approximate 1 μg/g which increased to approximately 4 μg/g due to increased metal production during Medieval times. Present-day concentrations were found to range from 40 to 100 μg/g. Similar work has been done in the United States although the historical deposition demonstrates a very different pattern. Heyvaert and his associates evaluated lead deposition using paleolimnological data from Lake Tahoe on the border between California and Nevada (Heyvaert et al. 2000). This study identified low lead levels prior to 1850 and found a 6-fold increase after this point. The average lead levels observed after 1850 were 83 ppm. Because of the remote nature of the lake, it was assumed all lead observed was due to atmospheric deposition. The deposition of lead has decreased as recent legislation controlling its use has been implemented; however, the recent levels have not returned to pre-industrial concentrations. Similar analyses have also been conducted in Europe on recent trends in lead deposition. Schwikowski and his associates evaluated lead levels from 1650 to 1994 using an ice core from the Swiss Alps. Based on isotopic analysis, lead concentrations from the 1970’s are approximately 25 times higher than results from the 17th century which confirmed the increase in lead contamination during recent years. Interestingly the levels of lead have been seen to decrease over the last two decades. The authors suggest these results agree with other work showing the impact of banning leaded gas throughout Europe (Schwikowski et al. 2004). Farmer and his associates studied lead environmental levels using archival moss samples from Scotland (Farmer et al. 2002). The study identified inputs from such variable sources as local lead smelting, coal combustion and the importation of lead from Australia. The levels of lead observed in the moss were also found to decrease substantially after the use of alkyl lead additives in gasoline were restricted. Several historical uses continue to impact human health and the environment. Lead arsenates were used as insecticides throughout the world during the first half of the 20th century. In Washington State, lead arsenates were used widely in fruit orchards and significant concentrations of lead can still be found in current and former orchard soils. Lead arsenates were no longer used widely in Washington State after the introduction of DDT in 1948 (Peryea 1998).

6
Lead was also used as a pigment in paints. The first child poisoning due to lead paint was identified in 1904 and lead paints were banned in France, Belgium and Austria as early as 1909. The League of Nations banned the use of white-lead interior paint in 1922 but the U.S declined to adopt the restriction. Lead paints were banned in the United States only after passage of the Lead-Based Paint Poisoning Prevention Act in 1971 (Kitman 2000). Houses and businesses constructed and painted prior to this ban are likely to contain appreciable levels of lead paint. The CDC estimates that between 83 and 86% of all homes built before 1978 have some lead paint within (Centers for Disease Control and Prevention 1997). Lastly, tetraethyl lead was used as a gasoline additive to reduce engine knock. This practice began to be phased out in the United States in the 1970’s and the use of leaded gas for on-road vehicles ended on Jan 1, 1996. Leaded gas is allowed to be used in some specialty applications such as aviation fuel, farm equipment and off-road vehicles (Department of Health and Human Services 2008). NASCAR racing events have historically used leaded gasoline. However, NASCAR committed in 2006 to begin using unleaded gasoline in 2008 (NASCAR 2006). Leaded gasoline continues to be used in some countries throughout the world which can cause imported products to be contaminated with lead. The leading lead producers in the world are China, Australia, the United States, Peru and Mexico. Currently, the United States consumes much more lead than it produces and is responsible for about 50% of the world’s consumption. This ratio is changing as countries, such as China and India, develop commercially. Most of the lead mined in the United States comes from Missouri with additional resources located in Washington, Idaho, Utah, Arizona, Colorado and Montana (U.S. Geological Survey 2007). Lead is rarely found in its elemental state. The most common lead ore is galena, a lead sulfide. Other common sources of lead are cerussite and anglesite. Although these sources may contain as little as 3% lead by weight, levels of 10% are more common. Typically ores are concentrated chemically to approximately 40% lead before smelting (Parker 1993). In 2005, approximately 84% of the lead used in the United States came from the recycling of lead, and 80% of this lead came from recycled batteries, primarily automobile batteries (U.S. Geological Survey 2007).
How Lead Enters the Environment Natural Sources Lead can enter the environment either through natural processes or human activities. Found naturally in some rocks, lead is naturally released into the environment through soil weathering, water transport and volcanic action. Soils naturally high in lead are eroded by flowing water releasing lead-containing particles into the environment. These particles can be transported far from their source and may accumulate at specific locations. Volcanic action also leads to the distribution of lead-containing ash during an eruption and the release of lead containing magma which increases the presence of lead in surrounding soil.

7
These natural sources, however, are small compared to the amount of lead released into the environment by human activities. Lead is used in a wide range of products and, prior to use, must be mined and purified. An idea of the amount of lead released into the environment by mining and processing can be quantified from data collected by EPA which states:
‘From 1987 to 1993 according to the Toxics Release Inventory, lead compounds released to land and water totaled nearly 144 million pounds, almost all of which was to land. These releases were primarily from lead and copper smelting industries.’ (U.S. Environmental Protection Agency 2006)
These releases (which include wastes disposed in landfills) do not include the amount of lead released from other uses including water distribution systems and lead-containing products. Plumbing One continuing source of concern is the historical use of lead pipes in domestic water distribution systems. Because of its cost and malleability, lead pipes were used historically to transport drinking water. Therefore older distribution systems throughout the U.S. often contain lead pipes. Lead can erode from these pipes which provide a continuing source of lead contamination. These problems are somewhat mitigated by the ability of lead pipes to generate a coat of protective, insoluble compounds. Lead oxides and other lead-containing compounds form on the outer layer of the pipes. Because these compounds are relatively insoluble in water, the amount of lead released is limited. Problems have occurred when chemicals are added to water distribution systems which adversely affect the solubility of lead compounds and have the effect of removing this protective layer. Many public water systems have or are in the process of switching to chloramines for disinfectant purposes due to safety issues associated with the use of chlorine. Chloramines work well as disinfectants and have the added advantage of not reacting as readily with natural organics to produce chemicals of concern. However this change is having an unexpected impact on the public water systems. By changing the water chemistry, lead containing pipes and solder joints are experiencing a removal of lead oxide scale which has protected the water supply from lead contamination. Lead levels in some water systems have increased dramatically and concern has been raised about the possible impacts of increased lead concentrations upon the end users. Washington, D.C. exhibited elevated lead levels from 2000-2004, part of which EPA attributed to a change from traditional chlorine additives to chloramines (U.S. Environmental Protection Agency 2007). In Massachusetts, researchers compared four towns with similar water supplies; two towns that treated their water supply and two that did not. They tested the public water supply,wastewater effluents and biosolids to determine if the levels of lead in effluents are impacted by corrosion of the distribution systems due to water treatment. Domestic wastewaters were found to contain greater levels of lead than the distribution system suggesting that an important mechanism to reduce lead in the environment is to minimize corrosion. The authors suggest that corrosion

8
reduction efforts in water distribution systems would reduce the levels of lead released into the environment (Isaac et al. 1997). EPA reviewed the problems experienced in Washington, D.C.’s public water supply system from 2000-2004 and attributed increased corrosion as a likely contributor to high lead levels in the water. An increase in residual free chlorine, seasonal variations in pH and chemical changes caused by the shift to chloramines as a disinfectant increased corrosion of lead pipes in the water supply system (U.S. Environmental Protection Agency 2007). Another researcher evaluated the impact on blood lead levels (BLL) in towns where the public water systems had converted to the use of chloramines. In this study, the researchers linked blood lead screening data with age of house, drinking water source and census data for 7,270 records. Their analysis showed that, by switching to chloramines, blood lead levels increase. The impacts were mitigated to some extent in new houses which probably have fewer sources of lead and were therefore not impacted as much by the change in disinfection chemicals. The results showed that the mean BLL was significantly higher for children who live in areas which use chloramines for disinfection. The authors did caution against extrapolating their results to other water systems because of variables unique to their study area (Miranda et al. 2007). Lead in Consumer Products Lead is used in a wide range of products and has historically contributed lead contamination directly to the environment. For example, prior to 1973, tetraethyl lead was used extensively in leaded gasoline. As the leaded gasoline was burned in cars, trucks and other machines, lead was released. Significant amounts of lead can be found along roadways and other areas where machinery were extensively used. Metallic lead and lead compounds have a wide range of uses. Some of the more common uses include:
· Lead storage batteries. · Stabilizer in poly vinyl chloride (PVC) plastics. · Marine and industrial paints. · Weights, such as wheel weights and fishing weights. · Brass, solder and other alloys. · Lead glass and ceramic finishes. · Detonator for explosives. · Protective shield against radioactivity · Bullets and shot.
Some of these products have very high concentrations of lead. For example, bullets and shots often contain large amounts of lead while stabilizers for plastics have much lower levels of lead. For most products, however, lead levels have not been quantified. More information on lead in products is in the product section in Chapter IV.

9
It is not possible to accurately quantify the amounts of lead released into the environment from all products. We can approximate the amount by comparing the amount of lead mined and imported each year with the amount recycled. Although some uses of lead are extensively recycled (lead car batteries for example), the continuing and increasing demand for lead indicates that:
· much of the lead used in products is not recycled but released into the environment, and/or
· the amount of lead-containing products continues to increase. Mobility of lead Lead from products has been found in different media, such as in landfill leachate, soil, groundwater and surface water. Metallic lead is not inert, but it may take hundreds of years for a fragment to completely dissolve (Rattner et al. 2008). The disintegration of lead fragments in environmental media is affected by different factors, including the size of the fragment, rainfall, soil type and pH (acidity). Aerobic and acidic conditions enhance pellet breakdown, while anaerobic and alkaline conditions retard dissolution (Scheuhammer and Norris 1995). Both the mobility of lead in soils and the solubility of lead in water are enhanced at lower pH. Organic material decreases the mobility of lead in soil (Brown et al. 2004) and has been used for remediation in soil with low levels of lead contamination. Atmospheric conditions can weather fragments of metallic lead into more soluble and mobile forms. Once oxidized, lead can be precipitated as hydroxides, sulfates and sulfides, carbonates, and phosphates. Small fragments that result from weathering are more mobile than larger fragments. Surface water runoff can result in transport of small lead particles to adjacent water bodies. Landfill leachate Although much of the lead in products is technically released to the environment, many consumer products end up in landfills which control releases to some degree, slowing the impact to human health and the environment. Lead, however, can still be released to the environment from older landfills. For example, lead in leachate from an unlined municipal solid waste (MSW) landfill was traced throughout a local groundwater system using naturally occurring stable lead isotopes. Lead from leachate was found in groundwater as far as 1,000 meters downstream from the landfill and data from as far as 4,600 meters from the landfill indicate possible contamination. The authors also looked at lead from atmospheric deposition and suggested seasonal rainfall variation might favor an efficient remobilization of atmospheric lead in soils and its transfer into groundwater (Vilomet et al. 2003). Soil Areas where a lot of shooting takes place may accumulate large amounts of lead in the soil. For example, there is a rock pit in the Department of Natural Resources (DNR) managed Capitol Forest near Olympia that has been a popular area for shooting for over 40 years (Sushko 2007). This area is listed on Ecology’s Hazardous Sites List. A 2006 Health Consultation report found

10
soil lead levels of 825-55,500 ppm at the area known as the Waddell or Triangle gravel pit (Washington State Department of Health, 2006 335 /id). These levels are much higher than the background level of 17 ppm in Washington State and the state soil clean up level of 250 ppm. The Health Consultation concluded that the levels of lead in soil did not present a hazard to humans who did not visit the area more than once a week, but it did not look at environmental impacts. An additional study on lead in ground water found the levels of lead in ground water do not pose a potential risk to human health and the environment (Landau Associates 2009). Another area in Washington with high deposition of lead shot is the Skagit Wildlife Area pheasant release site, where non-toxic shot is now required. WDFW conducted soil sampling and found an estimated 344,000 pellets per acre in the top four inches of soil on the 85 acre site, or 6.8 tons of lead (Washington Department of Fish and Wildlife 2001). In April 2008 Ecology monitored lead and copper concentrations in five locations near the Gig Harbor Sportsman Club on two different dates (Washington Department of Ecology 2008). The site was initially investigated by the Tacoma-Pierce County Health Department in 2002 in response to citizen concerns. Ecology also wanted to verify the status of the site on the list of impaired waterbodies (303d list). The samples had the highest lead concentration found in Washington State surface waters. Both the total recovered lead and the dissolved lead were many times higher than the acute and chronic water quality criteria. Samples taken just upstream of the club showed dissolved lead concentrations of 0.82 ug/L, while lead concentrations downstream of the club were as high as 200 ug/L, pointing to the club as the likely source of dissolved lead in North Creek. The club has been operating since the 1940’s and there is no other known source of lead in the area. While the levels of copper were also found to be high, the results did not support the club as a source of copper in North Creek. The study did not assess whether the lead levels have harmed salmon in Donkey Creek, which North Creek flows into. Some studies have been done on the concentration and mobility of lead in soils at shooting ranges. At many formal and informal shooting ranges ammunition hits a berm that results in the spent ammunition breaking apart. Some fragments stay in the berm and others fall to the ground. Lead from contaminated soils from shooting ranges has been found to leach out in standard tests (Cao et al. 2003). There are studies that document dissolved lead from shooting ranges entering surface water and exceeding water quality criteria (Craig et al. 1999). The U.S. EPA issued a manual of best management practices for outdoor shooting ranges to prevent lead contamination (U.S. Environmental Protection Agency 2005). This manual was developed by the EPA in cooperation with stakeholders, such as sporting organizations. We have not found similar studies on the mobility of lead from fishing tackle to water.
Natural and Background Sources of Lead
The Global Lead Cycle The Global Lead Cycle consists of two components, 1) the natural global cycle which existed prior to man’s mining and use of lead and 2) the lead cycle initiated by man. The two cycles have numerous similarities. One major difference however is that the natural cycle involves a small percentage of the total lead cycle currently in use. Approximately 99% of the lead currently

11
being cycled is due to man-made inputs. This relationship is demonstrated in the following figure:
Figure 1- Naturally Occurring vs. Manmade Lead It is important to understand the natural processes which historically have been responsible for cycling lead throughout Earth. There are three primary processes which mobilize lead: 1) weathering of rock and soil containing lead by water and air, 2) volcanic eruptions and 3) combustion processes such as forest fires. All three processes transfer lead from soil and vegetation to air and water. Lead is then either deposited from air to water or from air and water back to soil. The processes are approximated in the following diagram:
Lead (Pb)in Earth
AirWater
VolcanoVolcano
Combustion
Deposition
DepositionSettling
Weathering
Natural Global Lead (Pb) Cycle
Weathering
Figure 2- Natural Global Lead Cycle
Natural Occurring vs Manmade Lead1%
99%
Natural Processes Manmade Processes

12
The manmade Global Lead Cycle is more complex. It begins with the mining of ore, and moves from processing of the ore to transformation into useable lead which can be incorporated into products to final disposal of the products. There are releases to air, water and soil at many points in the cycle. Some of the lead in products is captured and recycled. However, demand for lead continues to grow making it necessary to continually add lead into the cycle to compensate for both releases to the environment and this increase in lead use. This process is approximated in the following figure (Organisation for Economic Co-operation and Development 1993)1
:
Figure 3- Life Cycle of Lead and Release into the Environment
1 Appears as Figure 18 in the referenced document.

13
Although mining is the largest input of lead to the environment, it is not the only source. Lead is also found in trace amounts in resources such as oil, coal and even timber. As large amounts of these resources are used, the trace amounts accumulate into substantial amounts of lead constantly being added to the environment. Natural Sources of Lead in Washington The only major natural source of lead commonly occurring in Washington is from volcanic action. Eruptions in the Cascade Range continue to occur as witnessed by the 1980 eruption of Mount Saint Helens. During these eruptions, large amounts of minerals are released into the air, water and environment of Washington State. Although these minerals are not primarily lead, they do contain trace amounts and a volcanic eruption constitutes a mechanism which increases lead in the environment. Mining/Smelting Historically some small mines, now abandoned, were started in the Cascade Mountain range. Lead is found in the mining slag and exposed areas associated with these mining activities. The total amount of lead from these sources is small although concentrated and may have a significant impact on the local environment. Currently, there are two major mining operations within Washington State. A large zinc and lead mine is located in Pend D’Oreille County in northeast Washington. The Pend D’Oreille mine’s annual mill production in 2007 was 638,000 tonnes of ore, producing 49,000 tonnes of zinc concentrate and 8,300 tonnes of lead concentrate (Teck Cominco 2008). There is a new gold mine at Buckthorn Mountain in Ferry County. The mine opened in late 2008 and the expected production for 2008 was 20,000-30,000 ounces (Kinross Gold Corporation 2009). Lead is expected to be a component in discharge from the mining operations (Kinross Gold Corporation 2006). The ore from these mines is sent to a smelter in British Columbia for further refining. In addition, there are a few small smelters and specialty machinery manufacturers within the state that are not associated with a specific mine. Out-of-State Sources of Lead Products contribute the largest amounts of lead coming into Washington State. Some products which contain appreciable amounts of lead are batteries in automobiles and electronic equipment, lead used for radiation protection, leaded wheel weights, etc. Some lead is also imported for use in consumer products manufactured within the state and for use by hobbyists. Examples of products manufactured in the state which use lead are batteries and specialty glass. Some products (such as pulp and paper products) are manufactured in Washington but do not intentionally add lead- it comes in the raw materials. Although only small

14
amounts of lead are found in trees, the large amounts of resources (water, electricity) used to manufacturer paper leads to an appreciable amount of lead released to the environment. Lead is used by select individuals for certain hobbies such as the creation of stained glass panels, paints for artwork, fishing weights, ammunition, etc. For more information on lead in products, see section IV- Consumer Products.
Presence of Lead in Washington’s Environment Soil A 1994 report by Ecology and USGS estimated the natural background soil metals concentrations based on soil samples from 166 locations throughout Washington (Washington State Department of Ecology 1994). Ecology used the 90th percentile as the default value for background calculations and the statewide 90th percentile was 17 ppm. The study divided the state into regions and the regional background levels were 24 ppm for Puget Sound, 17 ppm for Clark County, 15 ppm for the Spokane Basin, and 11 ppm for the Yakima Basin. Washington’s background levels of lead are similar to those in other areas of the U.S. and Canada. The Washington State Area Wide Soil Contamination Task Force Report (Area-Wide Soil Contamination Task Force 2003) identified large areas of Washington State with elevated lead levels in soil due to historic smelters (489,000 acres) and lead arsenate pesticide use (188,000 acres). There are also unknown and highly variable levels of lead in soil next to roadways, due to historic use of leaded gasoline. There are approximately 400 sites in Washington where lead exceeds the MTCA cleanup levels of 250 ppm (Lambert and Lane 2004). Water Lead has been analyzed in water by various historical monitoring efforts by Ecology. These efforts have resulted in 26 listings for lead on the 2004 Water Quality Assessment list. Ecology assesses water bodies in the State to determine which areas are so polluted that further discharges of certain chemicals into these waters can no longer take place. For the highest priority sites (category 5) Ecology conducts a TMDL analysis or total maximum daily load and develops a cleanup plan for meeting water quality standards. Two such sites, Lake Union in Seattle and North Creek in Pierce County are in this category for lead. Eleven areas along the Spokane River are in category 4A, which means the levels are considered too high but the TMDL is completed and plan is in place to meet water quality standards. Thirteen waterbodies across the state are in category 2, meaning there is some evidence for elevated levels of lead, but there is not sufficient evidence to list it as impaired. Ecology uses the levels specified in EPA’s Quality Criteria for Water to determine the level of impairment. For freshwater with a hardness of 100 mg/L, the criteria are 65 µg/L (65 ppb) for acute exposure and 2.5 µg/L for chronic exposure. The toxicity of lead to aquatic organisms depends on the hardness of the water. For saltwater the criteria are 210 µg/L for acute exposure and 8.1 µg/L for chronic exposure.

15
Sediment Ecology participates in the Puget Sound Assessment and Monitoring Program (PSAMP), which is a multi-agency effort to provide regional information on Puget Sound. Ecology began monitoring marine sediments in 1989 as part of this multi-agency effort. According to Ecology’s SEDQUAL database, there are about 361exceedances of the MCTA cleanup level in 60 sites (Figure 4). Historical data from core samples (Figure 5) show lead in sediments in western Washington State increased in the beginning of the 20th century, peaked in the 1960’s and 1970’s and then decreased, but the levels have not returned to original baseline levels (Washington State Department of Ecology 2001). Average lead concentrations in different media worldwide tend to be much higher in sediments and sediments now constitute the largest global reservoir of lead (Eisler 1988).
Figure 4- Washington Exceedances of the Marine Sediment Clean Up Level Map Prepared by Ecology's Toxics Cleanup Program
Figure 5- Trends for Lead in Puget Sound Sediments

16
Air Prior to the late-1980’s there were high levels of air lead from a smelter on Harbor Island in Seattle, but that smelter is no longer in operation. Leaded gasoline was also a historic source of lead in the air. Lead particulates from industrial and construction sources can be suspended for up to 10 days and the distance traveled depends on the particulate size (U.S. Environmental Protection Agency 2002). Lead particulate falls from air and contaminates water, soil and sediment. Lead is a criteria air pollutant under the Clean Air Act and the federal standard, up until 2008, was 1.5 mg/m3. Statewide monitoring for lead as a priority pollutant has not been conducted since 1999. In October, 2008 the standard was reduced to 0.5 µg/m3. While lead has not been measured as a priority pollutant in recent years, Ecology does have some measurements of lead in Washington from particulate matter testing. Data collected from 2001-2002 in the Seattle area show that the median air lead level is 0.0035 µg/m3, which is more than 100 times lower than the federal standard of 0.5 mg/m3. Figure 6 below shows air lead data from 2000-2007. Implementation of the new standards may also require more monitoring, especially in areas that are more densely populated.
Figure 6- Seattle Area Air Lead Data (2000-2007)
PM2.5 Pb Concentrations (μg/m3) over time
0
0.01
0.02
0.03
0.04
0.05
0.06
0.07
0.08
0.09
2000 2001 2002 2003 2004 2005 2006 2007
Time
Pb ( μ
g/m
3 )
Beacon HillOlive StreetLake Forest ParkDuwamishCorson AveSouth TacomaMaple LeafSpokane Crown Z

17
III. Human Health and Environmental Impacts of Lead
Lead and Human Health Summary - Lead Toxicity and Exposure Lead is a toxic chemical that affects many parts of the human body and can cause many different types of health problems. Everyone has some exposure to lead, and harmful effects can occur from relatively common everyday exposures. In most people, most of the harmful effects of lead are subtle and generally too small to be easily noticed in a routine medical examination. The only way to determine whether people have had potentially harmful lead exposures is to test them, usually by measuring the level of lead in blood. Learning disabilities and behavior problems in young children have been linked to exposures that are only slightly higher than that of the average U.S. child, and many other adverse health effects have been observed at higher exposure levels. In adults, lead exposure has been associated with a range of effects that include elevated blood pressure, nervous system damage, and, for women, problems with reproduction. The CDC blood lead “level of concern” for young children, established in 1991, is 10 micrograms of lead per deciliter of blood (mg/dL). Recent studies have documented adverse health effects in children with blood lead levels as low as 2 mg/dL, and have not found evidence of a threshold below which effects do not occur. While exposure to lead-based paint is thought to be the most frequent cause of lead poisoning in children, many other lead-containing sources have also been associated with elevated blood lead levels. Compared to the other 49 states, Washington has a relatively large number of young children with risk factors for lead poisoning. Washington ranks 17th in number of pre-1950 homes, 13th in number of Hispanics, 27th in number of blacks, 18th in number of families with incomes below the poverty level, and 12th in number of children enrolled in Medicaid. Compared to the other 49 states, few children in Washington get blood lead tests. Because harmful lead exposure is relatively common and comes from many sources, an effective program to reduce exposure will require the concurrent use of several different approaches that include public education, blood lead testing, environmental testing, removal of existing exposure sources, and reducing the production of new exposure sources.

18
A Brief History of Lead Toxicity and Exposure The harmful effects of lead were recognized and recorded more than 2000 years ago Since ancient times people have mined and smelted lead for use in many products. Some of the oldest evidence of mankind’s use of lead includes lead beads made over 6000 years ago and the discovery of a lead mine that operated about that same time.1,2 The ancient Romans used lead for cooking utensils, pipes, and storage of water and wine.1-3 The harmful effects of lead were noted more than 2000 years ago in Greece, when Nikander of Colophon associated colic (severe abdominal pain) and anemia with lead exposure.1-3 Lead was sometimes used in the production and storage of alcoholic beverages. From the 1600s to the 1800s outbreaks of illness were traced to lead in the beverages, leading to local laws banning the use of lead in the production of the beverages.2,3 From the 1700s through the 1900s there were many reports of poisonings in factories and in occupations where lead was used.1,2,4 Symptoms included palsy, paralysis, colic, headache, and vomiting. Lead poisoning became a notifiable condition in Britain in 1899, that is, medical practitioners were required to report cases to the government.1 In the U.S., cases of lead poisoning were noted in the 17th and 18th centuries in the shot-dropping, pottery, pewter-making, and lead-smelting industries. In the early 1900s, Alice Hamilton documented cases of lead poisoning in battery plants, smelters, typefounding (making type for printing presses), pigment manufacturing, and enameling of sanitary ware.5 The effects of lead on children were not appreciated until about 100 years ago Lead poisoning from children placing painted toys in their mouths was noted in the mid-1800s.6 Until about 100 years ago, most descriptions of lead poisoning were in adults, often in workers and people who drank alcoholic beverages. In 1904, an Australian physician described childhood lead poisonings caused by lead-based house paint.6,7 Of particular interest was the suggestion that children were poisoned by swallowing lead that had adhered to their hands after touching sticky paint or dust from older paint. Until the 1940s, it was commonly believed that there were no lasting effects from childhood lead exposure.2 In 1943, Byers and Lord published information indicating that acute lead poisoning with obvious symptoms could have a permanent effect on behavior and intelligence.8 From the 1970s through today, research efforts have identified more effects at lower exposure levels in both adults and children. Since the late 1970s, many studies have shown that children and adults can be harmed by lead without having obvious signs of acute poisoning.9 In children, lead exposure without clinical signs causes damage to the brain resulting in lowered IQ, behavioral problems, and other adverse neurodevelopmental effects.9 In adults, increases in blood pressure have been noted with increasing lead exposure, even at relatively low blood lead levels.9

19
Lead Toxicity Lead is a known human and animal poison with no beneficial biological function There is a large and growing body of scientific research demonstrating the toxicity of lead.9 Many epidemiological studies and case reports of children and adults have documented a wide range of adverse health effects from lead exposure.9 Similar effects have been seen in animal studies.9 Results across studies have been generally consistent, indicating that the information is reliable.9 For an individual, the harmful effects of lead depend on many factors Lead has been associated with many types of harmful effects in people. The type and severity of the effects vary among individuals and depend on many factors including:
· Amount and length of exposure. (Typically, as the amount and length of exposure increases, the number of potential health effects and their severity does also.)
· Age when exposure occurs. (The age when exposure occurs can also influence the type and severity of the effects. For example, while the rapidly developing brains of children are highly sensitive to disruption caused by lead, effects on the adult brain from equivalent exposure do not appear to be as severe. On the other hand, increases in blood pressure from lead exposure have not often been noted in children, but have been reported frequently for adults.)
· Diet and other lifestyle factors. (An adequate, balanced diet can help reduce the consequences of lead exposure.)
· Health status (e.g., preexisting illness). · Inborn susceptibility to the effects of lead. (Some people may be genetically predisposed
to the effects of lead on the blood-forming system.) Exposure is usually evaluated by measuring the level of lead in the blood Lead exposure can be estimated by measuring lead levels in blood, bone, teeth, urine, hair, or nails.9 For most purposes, the blood lead level is the measure of choice, and the most widely used indicator of lead exposure in children and adults. This is partly due to ease of obtaining a sample, relatively low analytical cost, widely accepted analytical techniques, general agreement about the meaning of the results, and good correlation between exposure and result. Blood lead level is a good indicator of exposure for the previous month or two.9 In the U.S., blood lead levels are measured as micrograms of lead per deciliter of blood (µg/dL). A microgram (one millionth of a gram) is much smaller than a grain of salt. A deciliter is one tenth of a liter, or about the volume of a quarter-pound stick of butter. A child weighing 30 pounds has about 10 deciliters of blood.

20
The effects of lead exposure are usually hard to see Although overt cases of lead poisoning used to be common, they are rarely seen today in the U.S.10 In most people, the harmful effects of lead are subclinical and generally too small to be easily noticed in a routine medical examination.3 Even when signs and symptoms are present, it is difficult to know whether lead is a contributing factor unless a blood lead test is performed, since most of lead’s effects aren’t unique, but are similar to those caused by other chemicals or biological agents.9 However, studies comparing groups of people having different amounts of exposure have consistently identified increases in subtle effects in people with lead exposure, and the higher the exposure, the greater the effect.9 Some effects of lead are permanent and continue even after exposure is reduced Some of the health problems caused by lead, both overt and subclinical, are permanent.9 It is therefore better to prevent lead exposure before it occurs rather than treat the problems afterwards. Also, a portion of the lead is stored in bones in the body. Consequently, lead can be released from the bones and affect the body many years after the initial exposure. 9 Lead can cause many different health problems Lead has been shown to affect many parts of the body including the central and peripheral nervous systems, cardiovascular system, kidney, blood, gastrointestinal system, immune system, and reproductive system.9 These effects are seen as clinical signs and symptoms, some of which are noted in Table 2. Lead also affects the normal growth and development of children’s bodies.9,11-15 The Environmental Protection Agency classifies lead as a probable human carcinogen,16 but the non-cancer effects tend to be a much greater concern at the lower exposure levels typically seen in most people. A few of the many health problems associated with blood lead levels from 30 to 100 mg/dL are peripheral nerve damage, kidney damage, frank anemia, and severe brain damage.9 However, blood lead levels that high are rarely seen in children any more.10 At blood lead levels below 30 mg/dL, health effects such as decreased IQ, decreased attention span, and increased aggressiveness occur.9 While these effects have been observed repeatedly in a large number of studies (and are acknowledged throughout the public health community), they may not be obvious in a clinical setting and can be difficult to associate with lead on an individual basis. Since many health effects of lead are similar to those caused by other things, the only way to confirm that lead is causing or contributing to the problem is to evaluate exposure, usually through a blood lead test.

21
Table 2- Some Effects of Lead and the Blood Lead Levels at Which They Have Been Observed in People
Effect Child Blood Lead Level (ug/dL)
Adult Blood Lead Level (ug/dL)
Depressed ALADa <5 <5 Neurodevelopmentb <5 Neurobehavioral effectsc <10 <10 (elderly) Delayed sexual maturation <10 Decreased growth <10 Hearing loss <10 Decreased glomerular filtration rate
<10
Elevated blood pressure <10 Peripheral nerve damage 20 – 30 30 – 40 Enzymuria/proteinuriad <30 Decreased male fertility 30 – 40 Abortion/preterm delivery <10 Clastogenic activity >30 Colic 60 40 Decreased T4 hormonee 40 – 60 Encephalopathy 70 100 a Delta-aminolevulinic acid dehydratase, an enzyme needed for the production of hemoglobin. b Interference with normal brain development, which can result in a range of adverse outcomes such as learning problems and inappropriate behavior. c Damage to the brain that results in inappropriate behavior. d Enzymuria and proteinuria (i.e., higher than normal amounts of enzymes or proteins in the urine) are signs of kidney damage. e A thyroid hormone that affects metabolism. Some of the effects on the central nervous system may result in social problems such as increased dropout rates, aggressiveness, inappropriate behavior, and criminal behavior, all of which have been reported to be linked to lead exposure.17-20 Results of animal studies have generally supported the findings in humans.9,21 Animal models have helped shed light on the biological mechanisms underlying some lead’s harmful effects such as increased blood pressure, neurological damage, and delinquent, anti-social, and criminal behaviors.

22
Recent studies have found that relatively small exposures are harmful When the CDC lowered its childhood blood lead level of concern from 25 to 10 mg/dL in 1991, it acknowledged the possibility that 10 mg/dL might not be a safe threshold.22 Since the beginning of 2000, several studies have identified harmful effects in children with blood lead levels less than 10 mg/dL.23-30 These effects included decreased I.Q., lower test scores on reading and math tests at the end of the 4th grade, reduced mental and psychomotor development at 24 months of age, and deficits in intelligence, attention, reaction time, fine motor skills, and several other parameters. A number of these studies reported effects at blood lead levels below 5 mg/dL, and some were found at blood lead levels of 2 to 3 mg/dL with no evidence of a threshold. Several of these studies reported that the size of the harmful effect was proportionally greater at lower blood lead levels than at higher ones.23-25, 27, 29 For example, Lanphear et al. found that increasing the blood lead level from 2.4 mg/dL to 10 mg/dL was associated with an I.Q. loss of about 3.9 points, more than twice the 1.9 I.Q. point loss associated with increasing the blood lead level from 10 mg/dL to 20 mg/dL.29 Since harmful effects occur at blood lead levels that are at, or only slightly above those commonly found in young children, it is possible that a large portion of the population may be adversely affected from their typical daily lead exposures. Although the results of individual studies should be viewed with caution, the consistent observation of adverse effects across many studies that used different populations, different health measures, and different techniques lends credibility to the overall findings that relatively low blood lead levels can have harmful effects in children. Exposure to Lead Everyone is exposed to lead Everyone has some exposure to lead because it is found throughout the natural environment in soil, water, and air.9 However, compared to natural sources, most people have greater exposure from frequent contact with lead that has been used in many types of products found in the home and at work. Exposures can be relatively large, causing easily observable health problems, or relatively small, causing subtle, subclinical effects that are not easily measured (but may have significant consequences).9 Although currently no threshold for lead’s health effects has been clearly identified,25-27, 29, 31 it is possible that one exists and that some exposures may cause little or no harm. Exposures add up The harmful effects of lead depend on the total amount that enters the body from all exposure sources combined. For some people, the majority of their exposure may come from one main source. For others, exposures from many sources that are each relatively low can add together to produce a harmful dose.

23
Children’s exposure mostly comes from ingestion; adults from ingestion or inhalation In the past, the largest source of exposure for most children and adults was airborne lead emitted by vehicles that burned leaded gasoline.32 People breathed the lead-containing vehicle exhaust that was spread throughout the atmosphere. From the 1970s to the 1990s as the amount of lead allowed in gasoline was reduced, concentrations of lead in the air decreased and inhalation became a less important pathway for most people. Today, children are mostly exposed to lead through ingestion. It is normal behavior for young children to put fingers, toys, and other objects in their mouths.33-37 These may have lead-containing dust, soil, or paint on them that can be swallowed. Some metal and vinyl products may contain significant amounts of lead that can leach out when they are placed into the mouth or accidentally swallowed. Water, other beverages, and food also contain some lead that children ingest.9 Adults whose work or hobbies involve the handling or use of lead-containing materials or products can have significant exposure through ingestion, inhalation, or both.9 Most other adults with no obvious contact with lead probably get most of their exposure through beverages, food, and inadvertent ingestion of lead-containing dust and soil. Lead stored in the body can cause exposure many years after the initial exposure After lead enters the body, some is excreted but some stays in the tissues for days to decades. The body is often referred to as having three “compartments” when discussing the distribution of lead: the blood, the bones, and the rest of the tissues.9 The length of time a chemical such as lead stays in the body is measured in half-lives, that is, the time it takes for half of the chemical to be excreted. The half-lives of lead in blood, other tissues, and bone are about one month, two months, and 20 years, respectively.9 When someone is exposed to lead, a significant amount is stored in the bone because lead is chemically similar to calcium. Lead can move from one compartment to another throughout life. This means that, even without an obvious current exposure source, lead stored in the bone from past exposures can be released into the blood, raising the blood lead level and possibly causing health problems. Conditions where bone density is lost, such as pregnancy and osteoporosis, can cause the release of significant stores of lead from the bones and raise blood lead levels.9 Fetuses and infants can be exposed from their mothers Environmental exposure as well as release of lead from bone in pregnant and nursing mothers can result in increased levels of lead in maternal blood.9 Lead readily crosses the placenta, exposing the fetus. Some studies have found an association between the mother’s blood lead level and harmful effects measured in young children after birth.38,39 Lead can also enter breast milk, although the amount of exposure to the infant is usually small compared to exposure of the fetus in utero.40,41

24
Young children tend to have more exposure than the average adult Young children have several behaviors that put them at high risk for lead exposure.33-37 They tend to explore their environment by putting nonfood items like fingers and toys in their mouths. A child may swallow some lead when these items are constructed of lead-containing materials, are coated with lead-based paint, or have lead-contaminated soil or dust on their surfaces. Since children often play on the ground, dust and soil are likely to collect on hands and toys and subsequently be swallowed. For their size, children tend to ingest several times more soil and dust than adults.33,42,43 Adults are at less risk because they don’t put as many things in their mouths, are more discriminating about the things they do put in their mouths, and absorb less of any lead that they swallow than children. Adults can be exposed to lead from their jobs and hobbies Some adults have been found to have significant exposure to lead-containing materials used in their jobs and hobbies. This is discussed in more detail in Chapter IV of this document. An individual’s exposure is difficult to predict but easy to measure For an individual, the amount of exposure is a complex interaction between presence (the amount of lead in someone’s environment), opportunity (how easily someone could come in contact with the lead) and behavior (activities that influence the likelihood of contact). Trying to predict someone’s exposure by evaluating the environment is impractical because of the resources and time required to obtain measurements of presence, opportunity, and behavior. Further, these factors can be difficult to measure accurately and can change over time. On the other hand, certain environmental (e.g., peeling paint in a pre-1960 apartment) or behavioral (e.g., chewing on windowsills) risk factors have been identified that, when found, increases the likelihood that an individual will have higher than average lead exposure. On a population-wide basis, the presence of these types of risk factors have been associated with increased exposure. However, for an individual the presence of observable risk factors doesn’t necessarily translate into increased exposure, nor does the lack of observable risk factors mean that exposure is minimal. While lead exposure is difficult to predict by evaluating the environment, a blood lead test is an accurate and inexpensive way to measure an individual’s exposure.

25
Currently there are five widespread exposure sources: paint, soil, water, food, and air Although people have some contact with lead in nature, most exposure is from manmade products. Lead has been incorporated into an enormous number of products that have been brought into our personal environments and become sources of exposure (see Chapter IV). House paint House paint was identified as a source of lead poisoning more than 100 years ago.7 In the United States, paint containing up to 50 percent lead was produced until the mid-1950s when paint manufacturers voluntarily limited lead content to less than 1 percent.4,44 In 1971 the New York City Health Department found that paint manufacturers did not always conform to this limit, since 8 out of 76 house paints they purchased and tested had lead concentrations ranging from 2.6 to 10.8 percent.45 By 1978, production of paint containing more than 0.06 percent (the equivalent of 600 parts per million by weight) lead was banned by federal law.46 Today, house paint is thought to be the most common cause of childhood lead poisoning.47, 48 A child’s exposure is usually related to the condition of the paint. When not adequately cared for, normal degradation of painted surfaces releases lead-containing dust, chips, and flakes that can be swallowed by young children who have normal hand to mouth activity. Paint in good condition is less of a hazard. Some children are exposed by chewing directly on painted surfaces. For young children, living in a home built prior to 1946 (and therefore likely to have paint with more than 1% lead content) increases the chances of having blood lead levels ³ 10 mg/dL49 and ³ 5 mg/dL.50 Also, many cases of lead poisoning have been linked to renovation of homes built prior to 1978 that likely had paint containing more than 0.06% lead. Renovation performed without proper precautions can release significant amounts of lead-containing dust from painted surfaces that can be ingested by both children and adults. Of approximately 2,500,000 homes and apartments in Washington, almost 1,500,000 were built prior to 1978 and about 700,000 were built prior to 1960.51 Among the 50 states, Washington ranks 17th in number of both pre-1978 and pre-1950 households.52 Soil Contamination Uncontaminated soil in Washington generally has less than 20 milligrams of lead per kilogram of soil (mg/kg) and doesn’t normally make a significant contribution to people’s exposure.53 However, across the state some land has become contaminated with lead at levels that can increase people’s chances of developing health problems. Important sources of soil lead contamination include deteriorating lead-based exterior paint from homes and other structures, past emissions from smelters, past use of lead arsenate pesticide, and past exhaust from vehicles that used leaded gasoline. Lead does not migrate into the soil very quickly, so once lead from these sources contaminates the ground, it remains near the surface as a source of exposure for many decades. In addition to direct contact outdoors, contaminated soil can be tracked into homes by people and pets and become a source of exposure indoors.

26
Typically, exposure to lead in soil occurs when contaminated dirt and dust gets on hands, toys, or food that are subsequently placed in the mouth.33 As with paint, children tend to have more exposure than adults because they tend to put more things in their mouths. However, adults who disturb soil while working in their yards or gardens could have greater than normal exposure. The amount of lead-contaminated land in Washington is difficult to quantify and depends on what lead concentration is considered “contaminated”. For example, the geographic area and the number of people potentially exposed to soil lead concentrations exceeding background levels (i.e., > 20 mg/kg) is significantly greater those for levels that exceed the Model Toxics Control Act hazardous waste cleanup level (250 mg/kg). A rough estimate of the amount of land impacted by lead and arsenic from smelter emissions (488,960 acres) and lead arsenate use (187,590 acres) was published by Ecology.54 These numbers reflect the acreage on which some amount of lead and/or arsenic contamination is present and do not indicate what portion exceeds 250 mg/kg of lead. Actual soil concentrations throughout these areas were not assessed in detail. Estimates of the statewide impacts of lead based paint and gasoline emissions on lead concentrations in soil are not known. Water The amount of exposure to lead in drinking water varies from person to person and is difficult to predict. The concentration of lead in surface water and ground water is usually less than 5 micrograms of lead per liter of water (5 µg/L) and usually contributes little to people’s exposure.9 However, some of the materials used in plumbing systems may contain lead that can dissolve into the water and cause significant exposure when the water is consumed or used to prepare food and beverages. In the past, lead was used in plumbing materials such as pipes, fittings, solder, water coolers, and faucets. Lead content in most of these products was limited by law to 0.2% (solder) and 8% (pipes, fittings, and faucets) by 1988.55 However, even today, faucets with a “no-lead” label may still contain up to 8% lead in parts that contact water. The amount of lead in water varies over time and depends on many factors including the amount of lead in the plumbing materials, the corrosivity of the water, and the amount of time the water has been sitting in the pipes between uses. Water that is highly corrosive tends to dissolve lead out of plumbing materials more quickly than water with lower corrosivity. In any particular home, the lead concentration in the water can vary from faucet to faucet and can vary over time for individual faucets. Due to the past widespread use of lead in plumbing materials, most people have at least a small amount of exposure to lead from their water supply, and some people may have significant exposure. The actual amount of exposure is difficult to predict and depends on the characteristics of the plumbing and the water. As an example, the water supply to Seattle homes meets the overall requirements of the Safe Drinking Water Act and most homes that are tested have less than the EPA action level of 15 mg/L. However, between January, 2004 and April, 2008, the lead levels in 54 out of 1451 tests exceeded 15 mg/L, with a maximum of 470 mg/L, demonstrating that water can be a significant source of exposure in some homes.56 Also, in 2004, water in about 100 school buildings in the Seattle Public School System was tested. About 25%

27
of 2000 fixtures had water lead concentrations exceeding the EPA recommended maximum for schools of 20 mg/L.57 Food Based on data from the Food and Drug Administration, exposure from food is currently about 1 to 4 mg/day.58 Exposure to lead from food has declined since lead-seamed cans were banned in the U.S. However, cans of food imported from other countries are sometimes found to have lead seams. Also, significant amounts of lead have been found in some Mexican candies9 and imported spices. Air While airborne lead was a significant source of exposure in the past, the reduction of lead content of gasoline has been accompanied by comparable reductions in atmospheric lead concentrations.9 Except for some people who use lead in their jobs or hobbies, lead in air currently makes only a minor contribution to most people’s total exposure. Many other things have caused lead poisoning, although the reports have been rare Published reports have linked lead poisoning to a number of different products.59 Because exposures to these products have not been well studied it is difficult to know how important these sources are to overall lead exposure, both in Washington and nationwide. Products reported to have been responsible for cases of childhood lead poisoning include:
· Imported cosmetics · Beverage containers · Pottery and dishes · Traditional ethnic remedies · Bullets/shot · Fishing sinkers · Mini-blinds (vinyl) · Jewelry · Automobile key chain · Curtain weights · Pool cue chalk
Some cases of childhood lead poisoning have been caused by “take-home exposure” where family members with lead exposure at work have brought significant amounts of lead home on their clothes, tools, and cars.59

28
It is difficult to rank the relative importance of the many sources of lead exposure There are many sources of lead exposure in the environment, and even small exposures may cause some harm. Each person’s total exposure to lead comes from a unique combination of the presence and availability of all potential exposure sources and the way a person interacts with those sources. If 10 children were living in the same home, they would likely all have different blood lead levels due to individual differences in behavior and physiology. For some people, most of their exposure may come from lead-based paint while for others the largest exposure source may be water, ethnic remedies, or something else. There is general agreement that lead in old house paint is the main cause of childhood lead poisoning and should be the main focus of nationwide efforts to eliminate blood lead levels > 10 µg/dL. However, it is possible that more people are exposed to lower but still harmful levels of lead from sources other than paint, and those sources could be an important focus for exposure-reduction programs. Since resource limitations do not allow agencies to address all lead exposure sources at once, it is important to understand the relative contribution of the various sources in order to prioritize efforts to reduce lead exposure in Washington. Unfortunately, reliable information about the relative importance of the various exposure sources is limited. Determining the relative importance of various exposure sources for the population as a whole is difficult and time consuming.48 Most states conduct home investigations to identify exposure sources for children only when a child’s blood lead level exceeds 15 µg/dL and there is little published information reporting the results of the investigations. Further, it is not clear that most home investigations are conducted with enough rigor to allow a reliable estimate of the contribution of various potential sources to the exposure. Blood lead levels are used to evaluate population and individual exposure Programs that evaluate people’s exposure to lead can provide several types of useful information, including assessments of exposure for concerned people, discovery of children and adults who have excessive exposure, and identification of risk factors for lead poisoning. The federal government and many states have programs to promote the evaluation of lead exposure for children and some adult workers and track the results. The most common method to assess someone’s exposure to lead is to measure the concentration of lead in the blood. This test is inexpensive and provides a good indication of the amount of lead exposure a person had during the month or two prior to the test. Although exposure can also be evaluated by measuring lead concentrations in hair, bone, teeth, or urine, these tests have drawbacks that make them less useful than blood for most screening purposes.9 Blood for testing can be collected from the capillaries at a fingertip or from a vein. A capillary sample is easier to obtain, but any lead on the surface of the skin can contaminate the blood and give a falsely high blood lead reading. Therefore, it is critical that the fingertip be properly cleaned before collection. A venous blood draw can be more difficult to obtain but provides more reliable results since lead on the skin is unlikely to contaminate the sample. If a capillary

29
test result is elevated, then a venous sample or a second capillary sample (ensuring adequate cleaning of the fingertip) should be collected and analyzed to confirm the initial result. Blood lead testing – uses and limitations for public health On a national level, the CDC periodically tests a group of several thousand people in order to obtain a reasonable representation of blood lead levels for the U.S. population as a whole. This testing is done as part of the National Health and Nutrition Examination Survey (NHANES).49, 50,
60 Due to the selection of a representative sample of people and the amount of personal information gathered about the people tested, the data are useful to identify risk factors that are associated with elevated blood lead levels. Most states and several large cities have Childhood Lead Poisoning Prevention Programs that collect and analyze blood lead data from physicians and laboratories.61 This information is used to identify children with elevated blood lead levels and recommend follow-up care. Some states are able to use their data to identify risk factors for lead poisoning. However, for many states, including Washington, it is difficult to draw reliable conclusions about risk factors because of the relatively small number of children tested, the non-random selection of the fraction tested, and other data limitations. In 2006, thirty seven states reported results of more than 3.2 million blood lead tests to the CDC.62 Because of differences in the way states collect and report data, results among states and results between states and the national NHANES data cannot be compared directly. Regarding data collection, some states recommend targeted screening of children with specific risk factors while others require testing of all children. If most children screened are at high risk for lead poisoning, the data collected by the state would tend to overestimate blood lead levels for the whole population (which includes many children without risk factors). Other states require that all children have a blood lead test, so their data are likely more representative of the population as a whole. Some states keep better track than others of factors such as race and type of test (venous versus capillary). With respect to reporting, different agencies may include different age groups (zero through the sixth birthday or zero through the seventh birthday). Some agencies may report all elevated blood lead test results while others report only confirmed elevated results (i.e., using blood collected by a single venous draw blood lead or by two capillary draws). The CDC childhood blood lead “level of concern” and its intended use In 1991 the CDC lowered its blood lead “level of concern” from 25 to 10 µg/dL.22 This number was intended to help public health agencies prioritize their lead exposure reduction activities and was not meant to preclude actions or imply safety. The level of concern has also been referred to as an “action level” and children with blood lead levels greater than 10 µg/dL are usually considered to have “elevated blood lead levels” and “lead poisoning.” The use of 10 µg/dL to define who has lead poisoning has been somewhat misleading because, by this definition, children with blood lead concentrations below this level do not have lead poisoning, and it is reasonable to infer that if they do not have lead poisoning, they are not being harmed. However, a number of studies have reported health problems in

30
children whose blood lead levels never exceeded 10 µg/dL. When CDC reassessed the data in 2005, it acknowledged the new research findings, but did not change the level of concern. Even when the level of concern was lowered in 1991, CDC acknowledged that there was evidence for adverse effects at blood lead levels below 10 µg/dL and no evidence of a threshold. Based on the available research, there is cause to reconsider the use of the CDC level of concern to define lead poisoning. Similarly, since the average childhood blood lead level is currently about 2 µg/dL, it could be argued that limiting the definition of “elevated blood lead level” to only those > 10 µg/dL is inaccurate. While these are semantic issues, they may result in misperceptions by the public and health care providers about the extent and health consequences of lead exposure. When it published the blood lead level of concern in 1991, the CDC discussed its intended uses and the problems with using a single number:22 “This document provides guidelines on childhood lead poisoning prevention for diverse groups.
Public health programs that screen children for lead poisoning look to this document for guidance on screening regimens and public health actions. Pediatricians and other health-care practitioners look to this document for information on screening and guidance on the medical treatment of poisoned children. Government agencies, elected officials, and private citizens seek guidance about what constitutes a harmful level of lead in blood what the current definition of lead poisoning is and what blood lead levels should trigger environmental and other interventions.”
“It is not possible to select a single number to define lead poisoning for the various purposes of
all of these groups. Epidemiological studies have identified harmful effects of lead in children at blood lead levels at least as low as 10 µg/dl. Some studies have suggested harmful effects at even lower levels, but the body of information accumulated so far is not adequate for effects below about 10 µg/dl to be evaluated definitively. As yet, no threshold has been identified for the harmful effects of lead.”
“Because 10 µg/dl is the lower level of the range at which effects are now identified, primary
prevention activities community wide environmental interventions and nutritional and educational campaigns should be directed at reducing children's blood lead levels at least to below 10 µg/dl. Blood lead levels between 10 and 14 ug /dL are in a border zone. While the overall goal is to reduce children's blood lead levels below 10 µg/dl, there are several reasons for not attempting to do interventions directed at individual children to lower blood lead levels of 10-14 µg/dl. First, particularly at low blood lead levels, laboratory measurements may have some inaccuracy and imprecision, so a blood lead level in this range may, in fact, be below 10 µg/dl. Secondly, effective environmental and medical interventions for children with blood lead levels in this range have not yet been identified and evaluated. Finally, the sheer numbers of children in this range would preclude effective case management and would detract from the individualized follow up required by children who have higher blood lead levels.”
“The highest priority should continue to be the children with the highest blood lead levels.”

31
Before civilizations used lead, exposure was 100- to 1000-fold lower than today Bone lead concentrations in pre-industrial humans were 100 to 1000 times lower than those in people today.63-65 This suggests that almost all current lead exposure is from the production and use of manmade lead-containing products. National data show that blood lead levels have been decreasing There is not much information about blood lead levels prior to the mid-1970s when the federal government began to assess blood lead levels across the U.S. as part of the NHANES studies. These studies included tests of a representative sample of thousands of people to evaluate lead exposure at the national level. Results of these studies are shown in Tables 3 and 4.66 Table 3- Blood Lead Levels in U.S. Children
Ages 1-5 1976-1980 1988-1991 1991-1994 1999-2002 Geometric Mean Blood Lead Level (µg/dL)
14.9 3.6 2.7 1.9
Percent of Blood Lead Levels >10 µg/dL
88.2 8.6 4.4 1.6
Table 4- Blood Lead Levels in the U.S. Population- All Ages
All Ages 1976-1980 1988-1991 1991-1994 1999-2002 Geometric Mean Blood Lead Levels (µg/dL)
12.8 2.8 2.3 1.6
Percent of Blood Lead Levels >10 µg/dL
77.8 4.3 2.2 0.7
Based on NHANES data, the average blood lead level in the late 1970s for young children 1 through 5 years old was 14.9 µg/dL. Blood lead levels in 88.2 percent of the children exceeded today’s CDC blood lead level of concern of 10 µg/dL and they would be considered lead poisoned. For people of all ages, the average blood lead level was about 12.8 µg/dL with 77.8 percent of people exceeding 10 µg/dL. By the 1999 – 2002 survey, the average all-ages and average childhood blood lead levels had decreased to 1.6 and 1.9 µg/dL respectively. Much of this decrease in exposure was likely due to the reduction in the amount of lead that was allowed in gasoline. Also contributing to this drop in exposure are:
· Laws requiring the reduction of the amount of lead in products such as food cans, plumbing materials, and house paint.

32
· Programs educate the public about the hazards of lead. · Federal, state, and local programs to reduce or eliminate the hazards in homes with lead-
based paint. · The demolition of some older homes with lead-based paint.
Because of growing concern for children with blood lead levels less than 10 µg/dL, Bernard and McGeehin examined the NHANES data from 1988 – 1994 to determine the national rates and demographics of children with blood lead levels ≥ 5 µg/dL.50 For all children 1 to 5 years old, 25.6 percent had blood lead levels ≥ 5 µg/dL, with 6.3 percent > 10 µg/dL and 19.3 percent between 5 µg/dL and 10 µg/dL. Data from other states In the early 1990s, the CDC began to provide grants to states to promote childhood blood lead testing, increase awareness of the public and health care providers about childhood lead poisoning, and ensure that lead-poisoned children receive medical and environmental follow-up. The CDC currently funds Childhood Lead Poisoning Prevention Programs in more than 30 states and several cities. Most states report their blood lead data to the CDC. Some of these data through 2006 are available online, and a more complete analysis for the years 1997 through 2001 has been published.61 In 2001, about 3 percent of the total number of children tested had blood lead levels > 10 µg/dL. By race, the percentages with blood lead levels > 10 µg/dL were Caucasian (2.0%), black (8.7%), Hispanic (5.6%), and Asian and Pacific Islanders (4.4%). Data from the states must be interpreted with caution. For states that focus their screening efforts on high-risk children, the population that is tested is not necessarily a representative sample and the results may not reflect the true, state-wide rate of lead poisoning. With many people exposed, even small effects can have large implications for society The adverse health effects from commonly occurring exposures are expected to be subtle and relatively small and may not have a significant impact on an individual.3 However, many children have lead exposure that has been associated with decreased learning ability and the overall loss for the population as a whole may have important consequences for society. For example, a small loss of learning ability in a large portion of a population can influence test scores, causing more children to require and become eligible for special education services, and drawing resources away from other students.67 Several risk factors for increased lead exposure have been consistently observed Based on the national NHANES data and on applicable data from states (i.e., data from states that recommend or require testing of all children), the following factors have been consistently associated with increased rates of lead poisoning (i.e. blood lead levels > 10 mg/dL) in children:49,60,68,69

33
· Young age (less than 6 years old) · Black race · Hispanic race · Older home (built prior to 1950) · Enrolled in Medicaid · Low income
Risk factors for having a blood lead level ≥ 5 µg/dL among children 1 to 5 years old include:50
· Black race · Hispanic race · Older home (built prior to 1974) · Enrolled in Medicaid · Low income.
Recent immigrants and refugees from many countries tend to have above-average rates of elevated blood lead levels and represent groups at significant risk for lead poisoning.70 Lead exposure in Washington is not well characterized There are more than 500,000 young children in Washington and they are not tested for lead exposure in any systematic or organized manner. Whether or not to test a child is a decision between the parent and the health care provider. Few children in Washington ever get a blood lead test, suggesting that many parents and health care providers are unaware of, or not especially concerned about the hazards of lead. From 2000 until 2008, the Washington State Department of Health (DOH) recommended against universal blood lead testing of children and against the use of a risk factor questionnaire to help decide whom to test.71 DOH recommended that physicians use clinical judgment and consideration of certain risk factors to identify children who should be tested. In 2008, DOH enlisted a panel of physicians, academics, and staff from several agencies to review the existing recommendations and to consider changes that might be warranted based on new scientific information that had been published since 2000. 72 The panel concurred with the existing recommendation against testing every child and against testing any particular group of children based on a specific lead poisoning risk factor. However, the panel did recommend that DOH develop a questionnaire to identify children with lead poisoning risk factors and offer it to health care providers to use if they believe it would be a helpful tool to evaluate their patients. The panel also recommended that DOH begin an enhanced surveillance effort to provide better information about the prevalence of harmful lead exposures and the sources of exposure for children in Washington. A total of seven recommendations were made:

34
1) The Department of Health should implement a comprehensive public education and outreach effort regarding sources of lead and the ways in which exposure can be prevented.
2) The Department of Health should collaborate with, and fully support, other statewide efforts to reduce lead exposure.
3) The Department of Health should conduct additional surveillance to further identify the sources and risk of lead exposure.
4) The Department of Health should adopt and modify a risk factor questionnaire and make it available to physicians and other health care providers.
5) The Department of Health should implement a direct to parent education program to encourage the evaluation and screening of more children throughout the state.
6) The Department of Health should review and strengthen its guidelines regarding the appropriate medical responses for elevated blood lead levels.
7) The Department of Health should engage in more frequent communication with the healthcare community about lead.
For children enrolled in Medicaid, the federal government requires a blood lead test for all young children at certain ages as part of the Early and Periodic Screening, Detection and Treatment examination (EPSDT).73 However, the testing rate for children enrolled in Medicaid in Washington is low and similar to that for those not enrolled in Medicaid Except for workers who are likely to be exposed to lead on the job, adults do not commonly get blood lead tests. Further, it is likely that many workers who may be exposed to lead are never tested. However, more adults than children are tested in Washington every year. More information about occupational exposure is provided in Chapter IV of this document. State law requires that laboratories in Washington report the results of all blood lead tests to DOH. The data for all tests performed on children before their 16th birthday are entered into the Childhood Blood Lead Registry, a database maintained by DOH. For people who are 16 and older, DOH provides the test data to the Department of Labor and Industries (L&I) where information about elevated results (i.e., blood lead levels ³ 25 mg/dL) are entered into the Adult Blood Lead Registry. Each year from 2001 through 2007, only about 1% of the childhood population (birth to their 7th birthday) in Washington got a blood lead test. About five percent of Washington children 0 through 15 years of age are ever tested for lead. For the years 2001 through 2007, an average of 1.06% of children from birth to their 7th birthday had blood lead levels ≥ 10 µg/dL (range 0.74% to 1.34%) and 5.36% had blood lead levels between 5 and 10 µg/dL (range 3.22% to 7.78%). Per year, the number tested ranged from 3601 to 6682, or about 1% of the total population of 522,000 children birth to age 7. Because the number of children tested is relatively small and there is no way to know whether they are a statistically representative sample of children across the state, it is not clear how well the data in the Childhood Blood Lead Registry reflect the true degree of lead exposure in Washington. There is little information indicating why children are or are not tested in

35
Washington, and it is not known whether those who are tested tend to have more exposure or less exposure than average. On one hand, it is possible that many of those who are tested were chosen because they had risk factors for lead poisoning and therefore the data in the registry would overestimate the true extent of lead exposure in Washington. However, it is also possible that the children who tend to get blood lead tests are in low-risk situations and the tests are requested by families with higher socioeconomic status, awareness of the hazards of lead, and the ability to cover the costs of the tests. If the data in the registry are representative of the children of Washington, then extrapolating from the 2001 to 2007 data, about 5,500 children less than 7 years of age would have blood lead levels ³ 10 mg/dL and about 28,000 additional children would have blood lead levels between 5 and 10 mg/dL. One consequence of the limited amount of childhood blood lead testing is Washington is that few children with lead poisoning are found and even fewer investigations have been conducted to identify the causes of exposure. As a result, there is little Washington-specific information about risk factors for lead poisoning in the state. Many Washington children have risk factors, but few get blood lead tests Based on risk factors observed nationwide, many children in Washington are at risk for lead poisoning, and the risk appears to be about average compared to the other 49 states. Table 5 shows where Washington ranks in comparison with the 49 other states for the presence of known lead poisoning risk factors.74-76 A state that ranks “1st” has the highest risk, “25th” has average risk, and “50th” the lowest risk. Table 5- Where Washington State Ranks in Lead Poisoning Risk Factors
Risk Factor Rank by the number of children with the risk factor
Rank by the percentage of children with the risk factor
Pre-1950 homes 15th 28th Hispanic race 13th 16th Black race 27th 36th Family below poverty 18th 32nd Enrolled in Medicaid 12th 21st Compared to most other states, very few children in Washington have blood lead tests. Of the states reporting blood lead data to the CDC for at least six of the ten years between 1997 and 2006, Washington (with ten years of test results) ranked 38th out of 42 in number of children tested.62 The 4 states with fewer tests (Alaska, Hawaii, Utah, and Wyoming) had substantially smaller child populations and did not submit test results 2 to 4 of the 10 years. For the most recent year with complete data (2006), Washington ranked 35th out of 37 states in number of childhood blood lead tests reported to the CDC.

36
Public health statements and recommendations from agencies and medical groups Due to the widespread occurrence of lead poisoning and national concern regarding its consequences, many federal agencies, state agencies, and medical groups have studied the issue and published recommendations for reducing people’s exposure to lead and for blood lead testing. Some of these recommendations are described below. Goals for reducing lead exposure Healthy People 2010 is a set of public health goals for states, communities, and the nation to meet by 2010.77 Many federal agencies and most states are working toward these goals and include them in their public health plans. Within the Environmental Health portion of Healthy People 2010 are two objectives specifically related to lead: Objective 8-11. Eliminate elevated blood lead levels in children. This calls for the elimination of
blood lead levels > 10 μg/dL in all children. Objective 8-22. Increase the proportion of persons living in pre-1950s housing that has been
tested for the presence of lead-based paint. This goal is to have 50 percent of pre-1950 homes tested for the presence of lead-based paint.
Screening guidelines to evaluate lead exposure CDC Guidelines and Recommendations In 1997, the CDC published guidelines for screening children:78 “State public health officials should develop a statewide plan for childhood blood lead
screening.” “In the absence of a statewide plan or other formal guidance from health officials, universal
screening for virtually all young children, as called for in the 1991 edition of Preventing Lead Poisoning in Young Children (CDC, 1991), should be carried out.”
The CDC recommended blood lead testing for children who have greater than normal risk for lead exposure. Some of the risk factors that the CDC suggested could be considered included:
· Living in a zip code where more than 27% of the housing was built before 1950. · Receiving services from public assistance programs for the poor, such as Medicaid or the
Supplemental Food Program for Women, Infants, and Children (WIC) . · A “yes” or “don’t know” answer by the child’s parent or guardian to any question in a
basic personal-risk questionnaire consisting of these three questions: o Does your child live in or regularly visit a house that was built before 1950? This
question could apply to a facility such as a home day-care center or the home of a babysitter or relative.

37
o Does your child live in or regularly visit a house built before 1978 with recent or ongoing renovations or remodeling (within the last 6 months)?
o Does your child have a sibling or playmate who has or did have lead poisoning? In 2004, the CDC Advisory Committee on Childhood Lead Poisoning Prevention (ACCLPP) made the following recommendations about blood lead screening programs:79
“ACCLPP fully supports the concept of local and state decision-making to determine the most appropriate blood lead screening approach based on local conditions and data, which was the centerpiece of the revised 1997 guidelines. Efforts to ensure that the health care system incorporates these guidelines are extremely important. Most childhood lead poisoning prevention programs focus on identification and management of individual cases of elevated BLLs (i.e., secondary prevention). Follow-up care for such children consists of education focused on lead hazards, behavior changes associated with lead exposure, medical and developmental follow-up, nutritional recommendations, and environmental interventions. Environmental interventions to control identified lead hazards and halt further exposure may not be carried out because of lack of resources and/or statutory authority. Evidence suggests that the benefits of secondary prevention are limited. However, identification and provision of services to children with elevated BLLs remain important components of a comprehensive lead poisoning prevention program. To ensure successful elimination of elevated BLLs in children, programs must not rely solely on screening and secondary prevention but also focus on preventing lead exposure through the implementation of housing-based primary prevention.”
In 2000, the CDC Advisory Committee on Childhood Lead Poisoning Prevention (ACCLPP) made the following recommendations for Medicaid children:69
Health care providers should “Administer a screening blood lead test to all children enrolled in Medicaid at ages 1 and 2 years.”
States and Other Agencies That Administer Medicaid Programs should “Implement federal requirements for lead screening and follow-up care in state Medicaid policies and managed-care contracts.”
“Children aged 1--5 years enrolled in Medicaid are at increased risk for having elevated blood lead levels (BLLs). According to estimates from the National Health and Nutrition Examination Survey (NHANES) (1991--1994), Medicaid enrollees accounted for 83% of U.S. children aged 1--5 years who had BLLs >20 µg/dL. Despite longstanding requirements for blood lead screening in the Medicaid program, an estimated 81% of young children enrolled in Medicaid had not been screened with a blood lead test. As a result, most children with elevated BLLs are not identified and, therefore, do not receive appropriate treatment or environmental intervention.”

38
“To ensure delivery of blood lead screening and follow-up services for young children enrolled in Medicaid, the Advisory Committee on Childhood Lead Poisoning Prevention (ACCLPP) recommends specific steps for health-care providers and states. Health-care providers and health plans should provide blood lead screening and diagnostic and treatment services for children enrolled in Medicaid, consistent with federal law, and refer children with elevated BLLs for environmental and public health follow-up services.”
“States should change policies and programs to ensure that young children enrolled in Medicaid receive the screening and follow-up services to which they are legally entitled. Toward this end, states should a) ensure that their own Medicaid policies comply with federal requirements, b) support health-care providers and health plans in delivering screening and follow-up services, and c) ensure that children identified with elevated BLLs receive essential, yet often overlooked, environmental follow-up care. States should also monitor screening performance and BLLs among young children enrolled in Medicaid. Finally, states should implement innovative blood lead screening strategies in areas where conventional screening services have been insufficient. This report provides recommendations for improved screening strategies and relevant background information for health-care providers, state health officials, and other persons interested in improving the delivery of lead-related services to young children served by Medicaid.”
American Academy of Pediatrics Recommendations In its 2005 policy statement, the American Academy of Pediatrics made the following statements:80
“Evidence continues to accrue that commonly encountered blood lead concentrations, even those less than 10 µg/dL, may impair cognition, and there is no threshold yet identified for this effect. Most US children are at sufficient risk that they should have their blood lead concentration measured at least once.”
Pediatricians should “Know state Medicaid regulations and measure blood lead concentrations in Medicaid-eligible children.”
Government should “Identify all children with excess lead exposure and prevent further exposure to them. The AAP supports the efforts of individual states to design targeted screening programs, even for Medicaid children. However, the goal must be to find all children with excess exposure and interrupt that exposure, not simply to screen less. To do this, state and local government activities must focus on the children who are most at risk, which requires more and better data about the prevalence of elevated blood lead concentrations in specific communities. Prevalence estimates based on convenience samples or clinic attendees are not reliable and should not be used as the basis of policy.”

39
U.S. Preventive Services Task Force Recommendations In 2006, the U.S. Preventive Services Task Force published the following:81 “The U.S. Preventive Services Task Force (USPSTF) concludes that evidence is insufficient
to recommend for or against routine screening for elevated blood lead levels in asymptomatic children aged 1 to 5 who are at increased risk.”
“The USPSTF recommends against routine screening for elevated blood lead levels in
asymptomatic children aged 1 to 5 who are at average risk.” “The USPSTF recommends against routine screening for elevated blood lead levels in
asymptomatic pregnant women.” U.S. Department of Health and Human Services Medicaid Requirements The Department of Health and Human Services requires State Medicaid programs to provide blood lead testing as part of the Early and Periodic Screening, Diagnostic, and Treatment (EPSDT) services:73 “As part of the definition of EPSDT services, the Medicaid statute requires coverage for
children to include screening blood lead tests appropriate for age and risk factors. The Health Care Financing Administration (HCFA) has interpreted this language to require that all children enrolled in Medicaid should receive a screening blood lead test at 12- and 24-months of age because this is the age when all children are most at risk. Children over the age of 24 months, up to 72 months of age, for whom no record of a previous screening blood lead test exists, should also receive a screening blood lead test.”
U.S. Department of Health and Human Services Office of Head Start Requirements From an Information Memorandum issued March 20, 2008:82 “In May 2000, the Office of Head Start (OHS) issued an Information Memorandum
regarding the “Childhood Lead Poisoning Prevention Collaboration” (ACYF-IM-HS-00-13). The purpose of this Information Memorandum is to reiterate the importance of lead screenings and to clarify the requirements for lead toxicity screenings for Head Start children.”
“45 CFR 1304.20(a)(1)(ii) requires a determination of whether a child is up-to-date on a
schedule of age appropriate preventative and primary health care. This schedule must incorporate the requirements for well child care utilized by the state Medicaid EPSDT program. It is a Medicaid EPDST requirement that a lead screening blood test be performed to determine a lead toxicity level for all Medicaid-eligible children. A “risk assessment” (i.e., a paper and pencil questionnaire or parent interview) does not meet this requirement.”

40
Requirements and Recommendations from States States have a variety of laws and policies regarding lead exposure evaluation for children. Some states require that all children have blood lead tests. Some states require or recommend blood lead tests for children living in certain high-risk zip codes. Some states require or recommend the use of a risk factor questionnaire to determine which children have a high a high risk of lead poisoning and should be tested. Based on surveys published in 2001 and 2002:6283
· 17 states required or recommended blood lead testing for all children. · 30 states required or recommended blood lead testing of high-risk children. · 41 states required blood lead testing for children enrolled in Medicaid.
Only Washington, Alaska, and Idaho did not fall into any of the above three groups Follow-up for children who have been tested Results of children’s blood lead tests are provided to parents or guardians. If the blood lead level is > 10 µg/dL, the CDC recommends follow-up testing as well as additional actions ranging from parent education when levels are marginally greater than 10 µg/dL, to environmental investigation at levels greater than 20 µg/dL, to hospitalization and chelation therapy at levels greater than 70 µg/dL. Individual states often have policies and regulations that govern what follow-up activities will occur, who conducts the activities, and at what blood lead levels. In Washington, DOH informs the local health department when lead-poisoned children are identified in its jurisdiction. The local health department works with parents or guardians of children with elevated blood lead levels if funding and staffing are available. DOH can offer assistance and, when funds are available, will pay for home lead-hazard assessments and testing of paint chips, soil, and water if requested by the local health jurisdiction. In the past, DOH has recommended follow-up activities when a child had a blood lead level ≥ 10 µg/dL. Recently, a panel of physicians, academics, and staff from several agencies assembled in 2008 by DOH recognized that there is no known safe threshold for lead exposure and that blood lead levels between 5 and 9 µg/dL can be harmful to children. The panel recommended that meaningful follow-up actions should be instituted when a child has a blood lead level between 5 and 9 µg/dL. DOH is evaluating ways to implement that recommendation and will explore ways to fund those actions. Reducing people’s exposure to lead Reducing lead exposure requires a multi-pronged, long-term approach because potentially harmful sources of exposure are commonly present in everyone’s personal environment and new sources continue to be produced. At least 30 states have developed plans to reduce people’s exposure to lead. Comprehensive plans have generally included a range of activities including:
· Outreach and education for the public and health care providers.

41
· Exposure screening using risk factor questionnaires and blood lead testing to identify highly-exposed people.
· Environmental testing to identify hazards. · Source removal to reduce or prevent exposure. · Reducing or eliminating the use of lead in new products.
While some of these activities are more effective than others in reducing exposure, all are important because they address different aspects of the problem and allow for flexibility in implementation of any plan. The most effective ways to reduce someone’s exposure are to remove the lead-containing source from the person’s environment, remove the person from the leaded environment, or to permanently and reliably block the exposure pathway. For a person in a home with lead-based paint, this could be accomplished by safely removing the paint, by moving to a “lead-safe” home with low-lead paint, or by properly encapsulating the paint. There is a growing movement among public health agencies to focus their resources on these types of efforts because of their effectiveness in preventing further exposure.78,84 However, per home, these activities can require considerable resources. Another way to help reduce exposure to lead centers around broad public education activities to make people aware of the hazards of lead, to help them identify potential exposure sources in their environments, and to tell them how to reduce their exposure to the various sources. While this is a common and relatively low-resource approach, it may not be as effective as other measures for reducing most people’s exposure. Testing people for exposure and homes for the presence of hazards can help identify individual problems. Screening can help public health agencies prioritize and target their efforts to those who are most likely to be harmed by lead. Screening to target educational activities are more likely to be effective than broad-based education alone because people who are aware that they have immediate risks will have incentive to take action to reduce the threat. As part of a long-term plan, reducing and eliminating lead from new products is an important way to help prevent future exposures.


42
Human Health References 1. Lead Exposure and Child Development – An International Assessment. Edited by M.A. Smith, L.D. Grant, A.I. Sors. 1989. Kluwer Academic Publishers, Hingham, MA. Section 2.1, Lead: ancient metal – modern menace? By G. Kazantzis. 2. Needleman, H.L. History of lead poisoning in the world. <http://www.leadpoison.net/general/history.htm> accessed 8/5/2008 3. Needleman, H. 2004. Lead poisoning. Annu Rev Med 55: 209-222. 4. Warren, C. 2005. Little pamphlets and big lies: federal authorities respond to childhood lead poisoning, 1935-2003. Public Health Rep 120: 322-329. 5. Markowitz, G., and Rosner, D. “Cater to the children”: the role of the lead industry in a public health tragedy, 1900-1955. Am J Public Health 90: 36-46. 6. Rosner, D., Markowitz, G., and Lanphear, B. J. Lockhart Gibson and the discovery of the impact of lead pigments on children’s health: a review of a century of knowledge. Public Health Rep 120: 296-300. 7. Gibson, J.L. 1904. A plea for painted railings and painted walls of rooms as the source of lead poisoning amongst Queensland children. Australasian Medical Gazette, 23: 149-153. (Reprinted in Public Health Reports / May–June 2005 / Volume 120, 301 – 304) 8. Byers, R., and Lord, E. 1943. Late effects of lead poisoning on mental development. Am J Dis Child 66: 471–494. 9. Agency for Toxic Substances and Disease Registry. 2007. Toxicological Profile for Lead. Atlanta, GA: U.S. Department of Health and Human Services, Public Health Service, Agency for Toxic Substances and Disease Registry. 10. Brody, D.J., Pirkle, J.L., Kramer, R.A., Flegal, K.M., Matte, T.D., Gunter, E.W., and Paschal, D.C. 1994. Blood lead levels in the U.S. population: phase I of the Third National Health and Nutrition Examination Survey (NHANES III, 1988 to 1991). JAMA 272: 277-283. 11. Kordas, K., Lopez, P., Rosado, J.L., Vargas, G.G., Rico, J.A., Ronquillo, D., Cebrián, M.E., and Stoltfus, R.J. 2004. Blood lead, anemia, and short stature are independently associated with cognitive performance in Mexican school children. J Nutr 134: 363-371. 12. Frisancho, A.R., and Ryan, A.S. 1991. Decreased stature associated with moderate blood lead concentrations in Mexican-American children. Am J Clin Nutr 54: 516-519. 13. Kim, R., Hu, H., Rotnitzky, A., Bellinger, D., and Needleman, H. 1995. A longitudinal study of chronic lead exposure and physical growth in Boston children. Env Health Perspect 103: 952-957.

43
14. Selevan, S.G., Rice, D.C., Hogan, K.A., Euling, S.Y., Pfahles-Hutchens, A., and Bethel, J. 2003. Blood lead concentration and delayed puberty in girls. N Eng J Med 348: 1527-1536. 15. Hauser, R., Sergeyev, O., Korrick, S., Lee, M.M., Revich, B., Gitin, E., Burns, J.S., and Williams, P.L. 2008. Association of blood lead levels with onset of puberty in Russian Boys. Env Health Perspect 116: 976-980. 16. United States Environmental Protection Agency. Integrated Risk Information System entry for: Lead and compounds (inorganic). <http://www.epa.gov/ncea/iris/subst/0277.htm> accessed 8/5/2008 17. Wakefield, J. 2002. The lead effect? Env Health Perspect 110: A574-A580. 18. Mendelsohn, A.L., Dreyer, B.P., Fierman, A.H., Rosen, C.M., Legano, L.A., Kruger, H.A., Lim, S.W., and Courtlandt, C.D. 1998. Low-level lead exposure and behavior in early childhood. Pediatrics 101: e10-e16. 19. Wright, J.P., Dietrich, K.N., Ris, M.D., Hornung, R.W., Wessel, S.D., Lanphear, B.P., Ho, M., and Rae, M.N. 2008. Association of prenatal and childhood blood lead concentrations with criminal arrests in early adulthood. PLOS Medicine 5(5): 732-740. 20. Stretsky, P.B., and Lynch, M.J. 2001. The relationship between lead exposure and homicide. Arch Ped Adolesc Med 155: 579-582. 21. Bellinger, D.C. 2004. Lead. Pediatrics 113(suppl): 1016-1022. 22. Centers for Disease Control and Prevention. 1991. Preventing Lead Poisoning in Young Children. Atlanta. 23. Jusko, T.A., Henderson, C.R., Lanphear, B.P., Cory-Slechta, D.A., Parsons, P.J., and Canfield, R.L. 2008. Blood Lead Concentrations < 10 µg/dL and Child Intelligence at 6 Years of Age. Env Health Perspect 116: 243-248. 24. Téllez-Rojo, M.M., Bellinger, D.C., Arroyo-Quiroz, C., Lamadrid-Figueroa, H., Mercado-Gracia, A., Schnaas-Arrieta, L., Wright, R.O., Hernández-Avila, M., and Hu, H. 2006. Longitudinal Associations Between Blood Lead Concentrations Lower Than 10 µg/dL and Neurobehavioral Development in Environmentally Exposed Children in Mexico City. Pediatrics 118: e323-e330. 25. Schnaas, L., Rothenberg, S.J., Flores, M-F., Martinez, S., Hernandez, C., Osorio, E., Velasco, S.R., and Perroni, E. 2006. Reduced Intellectual Development in Children with Prenatal Lead Exposure. Env Health Perspect 114: 791-797. 26. Chiodo, L.M., Jacobson, S.W., and Jacobson, J.L. 2004. Neurodevelopmental effects of postnatal lead exposure at very low levels. Neurotoxicol Teratol 26: 359-371.

44
27. Canfield, R.L., Henderson, C.R., Cory-Slechta, D.A., Cox, C., Jusko, T.A., and Lanphear, B.L. 2003. Intellectual impairment in children with blood lead concentrations below 10 µg per deciliter. New Eng J Med 348: 1517-1526. 28. Lanphear, B.P., Dietrich, K., Auinger, P., and Cox, C. 2000. Cognitive deficits associated with blood lead concentrations < 10 µg/dL in US children and adolescents. Public Health Rep 115: 521-529. 29. Lanphear, B.P., Hornung, R., Khoury, J., Yolton, K., Baghurst, P., Bellinger, D.C., Canfield, R.L., Dietrich, K.N., Bornshcein, R., Greene, T., Rothenberg, S.J., Needleman, H.L., Schnaas, L., Wasserman, G., Graziano, J., and Roberts, R. 2005. Low-level environmental lead exposure and children’s intellectual function: an international pooled analysis. Env Health Perspect 113: 894-899. 30. Miranda, M.L., Kim, D., Galeano, M.A.O., Paul, C.J., Hull, A.P., and Morgan, S.P. 2007. The relationship between early childhood blood lead levels and performance on end-of-grade tests. Env Health Perspect 115: 1242-1247. 31. Centers for Disease Control and Prevention. 2002. Managing Elevated Blood Lead Levels Among Young Children: Recommendations from the Advisory Committee on Childhood Lead Poisoning Prevention. Atlanta. 32. Bellinger, D.C., and Bellinger, A.M. 2006. Childhood lead poisoning: the torturous path from science to policy. J Clin Invest 116: 853-857. 33. U.S. Environmental Protection Agency. 2006. Child-specific exposure factors handbook (external review draft). <http://cfpub.epa.gov/ncea/cfm/recordisplay.cfm?deid=56747> accessed 8/5/2008 34. Moya, J.Bearer, C.F., and Etzel, R.A. 2004. Children’s behavior and physiology and how it affects exposure to environmental contaminants. Pediatrics 113: 996-1006. 35. Freeman, N.C.G., Jimenez, M., Reed, K.J., Gurunathan, S., Edwards, R.D., Roy, A., Adgate, J.L., Pellizzari, E.D., Quackenboss, J., Sexton, K., and Lioy, P.J. 2001. Quantitative analysis of children’s microactivity patterns: the Minnesota Children’s Pesticide Exposure Study. J Exp Anal Environ Epidemiol 11: 501-509. 36. Juberg, D.R., Alfano, K., Coughlin, R.J., and Thompson, K.M. 2001. An observational study of object mouthing behavior by young children. Pediatrics 107: 135-142. 37. Tulve, N.S., Suggs, J.C., McCurdy, T., Cohen-Hubal, E.A., and Moya, J. 2002. Frequency of mouthing behavior in young children. J Exp Anal Environ Epidemiol 12: 259-264. 38. Hu, H., Téllez-Rojo, M.M., Bellinger, D., Smith, D., Ettinger, A.S., Lamadrid-Figueroa, H., Schwartz, J., Schnaas, L., Mercado-Garcia, A., and Hernández-Avila, M. 2006. Fetal lead

45
exposure at each stage of pregnancy as a predictor of infant mental development. Env Health Perspect 114: 1730-1735. 39. Gomaa, A., Hu, H., Bellinger, D., Schwartz, J., Tsaih, S-W., Gonzalez-Cossio, T., Schnaas, L., Peterson, K., Aro, A., and Hernández-Avila, M. 2002. Maternal bone lead as an independent risk factor for fetl neurotoxicity: a prospective study. Pediatrics 110: 110-118. 40. Ettinger, A.S., Téllez-Rojo, M.M., Amarasiriwardena, C., Bellinger, D., Peterson, K., Schwartz, J., Hu, H., and Hernández-Avila, M. 2004. Effect of breast milk on infant blood lead levels at 1 month of age. Env Health Perspect 112: 1381-1385. 41. Ettinger, A.S., Téllez-Rojo, M.M., Amarasiriwardena, C., Peterson, K.E., Schwartz, J., Aro, A., Hu, H., and Hernández-Avila, M. 2006. Influence of maternal bone lead burden and calcium intake on levels of lead in breast milk over the course of lactation. Am J Epidemiol 163: 48-56. 42. Stanek, E.J., Calabrese, E.J., Barnes, R., and Pekow, P. 1997. Soil ingestion in adults – results of a second pilot study. Ecotoxicol Environ Saf 36: 249-257. 43. Simon, S.L. 1998. Soil ingestion by humans: a review of history, data, and etiology with application to risk assessment of radioactively contaminated soil. Health Phys 74: 647-672. 44. American Standards Association. American standard specifications to minimize hazards from residual surface coating materials. (Standard Z66.1-1955). 45. Rabin, R. 1989. Warnings unheeded: a history of child lead poisoning. Am J Public Health 79: 1668-1674. 46. 16 Code of Federal Regulations CFR 1303 – Ban Of Lead-Containing Paint And Certain Consumer Products Bearing Lead-Containing Paint. <http://ecfr.gpoaccess.gov/cgi/t/text/text-idx?c=ecfr&sid=08a4c077fb38af4fa08a2009149b1b87&rgn=div5&view=text&node=16:2.0.1.2.46&idno=16>Accessed 3/17/2009 47. Lanphear, B.P., Matte, T.D., Rogers, J., Clickner, R.P., Dietz, B., Bornschein, R.L., Succop, P., Mahaffey, K.R., Dixon, S., Galke, W., Rabinowitz, M., Farfel, M., Rohde, C., Schwartz, J., Ashley, P., and Jacobs, D.E. 1998. The contribution of lead-contaminated house dust and residential soil to children’s blood lead levels. Env Res (Section A) 79: 51-68. 48. Mushak, P., and Crocetti, A.F. 1989. Determination of numbers of lead-exposed American children as a function of lead source: integrated summary of a report to the U.S. Congress on childhood lead poisoning. Environ Res 50: 210-229. 49. Pirkle, J.L., Kaufmann, R.B., Brody, D.J., Hickman, T., Gunter, E.W., and Paschal, D.C. 1998. Exposure of the U.S. population to lead, 1991 – 1994. Env Health Perspect 106: 745-750. 50. Bernard, S.M. and McGeehin, M.A. 2003. Prevalence of blood lead levels ³ 5 mg/dL among U.S. children 1 to 5 years of age and socioeconomic and demographic factors associated

46
with blood lead levels 5 to 10 mg/dL, Third National Health and Nutrition Examination Survey, 1988 – 1994. Pediatrics 112: 1308-1313. 51. Washington State Office of Financial Management. <http://www.ofm.wa.gov/pop/poptrends/housing2007.xls> accessed 8/5/2008 52. American FactFinder, U.S. Census Bureau. http://factfinder.census.gov/home/saff/main.html?_lang=en In the left column labeled “DATA SETS” choose Decennial Census Choose Census 2000 Summary File 3 (SF #) – Sample Data then choose Enter a table number Enter H34 and choose “Go” In the dropdown menu, choose State, then All States, then “Show Result” Accessed 3/19/2009 53. Washington State Department of Ecology. 1994. Natural Background Soil Metals Concentrations in Washington State. Publication #94-115. 54. Area-Wide Soil Contamination Task Force. 2003. Area-Wide Soil Contamination Task Force Report. <http://www.ecy.wa.gov/programs/tcp/area_wide/Final-Report/PDF/TF-Report-final.pdf>Accessed 3/19/2009 55. Safe Drinking Water Act Amendments of 1986 (P.L. 99-339). 56. Washington State Department of Health. Sentry (drinking water test result database). 57. Seattle Public Schools. <http://www.seattleschools.org/area/ehs/drinkingwater/waterreports.htm>Accessed 3/17/2009 58. Levin, R., Brown, M.J., Kashtock, M.E., Jacobs, D.E., Whelan, E.A., Rodman, J., Schock, M.R., Padilla, A., and Sinks, T. 2008. Lead eaposure in U.S. children, 2008: implications for prevention. Environ Health Perspect 116: 1285-1293. 59. Centers for Disease Control and Prevention. 2002. Managing Elevated Blood Lead Levels Among Young Children: Recommendations from the Advisory Committee on Childhood Lead Poisoning Prevention. Atlanta: CDC. 60. Schwemberger, J.G., Mosby, J.E., Doa, M.J., Jacobs, D.E., Brody, D.J., Brown, M.J., Jones, R.L., and Homa, D. 2005. Blood lead levels – United States, 1999 – 2002. MMWR 54: 513-516. 61. Meyer, P.A., Pivetz, T., Dignam, T.A., Homa, D.M., Schoonover, J., and Brody, D. 2003. Surveillance for elevated blood lead levels among children – United States, 1997 – 2001. MMWR Surveillance Summary (no. SS-10).

47
62. CDC State Blood Lead Surveillance Data, 1997 – 2006. <http://www.cdc.gov/nceh/lead/surv/database/State_Confirmed_byYear_1997_to_2006.xls> Accessed 3/17/2009 63. Ericson, J.E., Smith, D.R., and Flegal, A.R. 1991. Skeletal concentrations of lead, cadmium, zinc, and silver in ancient North American Pecos Indians. Environ Health Perspect 93: 217-223 64. Flegal, A.R., and Smith, D.R. 1992. Lead levels in preindustrial humans. N Engl J Med 326: 1293-1294. 65. Patterson, C., Ericson, J., Manea-Krichten, M., and Shirahata, H. 1991. Natural skeletal levels of lead in Homo sapiens sapiens uncontaminated by technological lead. Sci Total Environ 107: 205-236. 66. Centers for Disease Control and Prevention. Children’s blood lead levels in the United States. <http://www.cdc.gov/nceh/lead/research/kidsBLL.htm> accessed 8/5/2008 67. Gilbert, S.G., and Weiss, B. 2006. A rationale for lowering the blood lead action level from 10 to 2 µg/dl. Neurotoxicology 27: 693-701. 68. Centers for Disease Control and Prevention. 1997. Update: blood lead levels – United States, 1991 – 1994. MMWR 46: 141-146. 69. Centers for Disease Control and Prevention. 2000. Recommendations for Blood Lead Screening of Young Children Enrolled in Medicaid: Targeting a Group at High Risk. Advisory Committee on Childhood Lead Poisoning Prevention (ACCLPP). MMWR 49(RR-14): 1-13. 70. Geltman, P.L., Brown, M.J., and Cochran, J. 2001. Lead poisoning among refugee children resettled in Massachusetts, 1995 to 1999. Pediatrics 108: 158-162. 71. Washington State Department of Health. 2000. Washington State Childhood Blood lead Screening Recommendations. 72. Washington State Department of Health. 2008. Childhood Lead Exposure – Expert Panel Recommendations. <http://www.doh.wa.gov/ehp/Lead/pdfs/panelrecomendations73008.pdf> Accessed 3/17/2009 73. U.S. Department of Health and Human Services, Health Care Financing Administration. 1999. Letter to state Medicaid Directors. 74. U.S. Census Bureau. <http://www.census.gov/popest/estimates.php> accessed 8/5/2008 75. U.S. Census Bureau. <http://factfinder.census.gov/home/saff/main.html> accessed 8/5/2008 76. The Henry Kaiser Family Foundation. <http://www.statehealthfacts.org> accessed 8/5/2008

48
77. Healthy People 2010. <http://www.healthypeople.gov/> accessed 8/5/2008 78. Centers for Disease Control and Prevention. 1997. Screening Young Children for Lead Poisoning: Guidance for State and Local Public Health Officials. Atlanta. 79. Centers for Disease Control and Prevention. 2004. Preventing Lead Exposure in Young Children: A Housing-Based Approach to Primary Prevention of Lead Poisoning. Atlanta. 80. American Academy of Pediatrics Committee on Environmental Health. 2005. Lead Exposure in Children: Prevention, Detection, and Management. Pediatrics 116: 1036-1046. 81. U.S. Preventive Services Task Force. 2006. Screening for Elevated Blood Lead Levels in Children and Pregnant Women. <http://www.ahrq.gov/clinic/uspstf06/lead/leadrs.pdf> accessed 8/5/2008 82. U.S. Department of Health and Human Services Office of Head Start. 2008. Memorandum to state Head Start Programs. 83. National Conference of State Legislatures. 2001. Lead screening for children enrolled in Medicaid: state approaches. <http://www.ncsl.org/programs/health/forum/leadscreening.pdf> accessed 8/5/2008 84. Centers for Disease Control and Prevention. 2005. Preventing Lead Poisoning in Young Children. Atlanta. <http://www.cms.hhs.gov/MedicaidEarlyPeriodicScrn/downloads/epsdt2005.pdf>


49
Health Effects in Other Organisms Overview The effects of lead in other organisms are similar to those in humans. Human activities have spread lead throughout the environment in the air, land and soil. Most animals have higher levels of lead than in pre-industrialized times and a threshold at which there is no effect has not been found (Pain 1996). Animals that do not die directly from acute lead exposure may face sub-lethal effects of chronic lead exposure, which contribute to their inability to survive in the wild. Ronald Eisler wrote a thorough review of lead hazards in fish, wildlife, and invertebrates for the U.S. Fish and Wildlife Service (Eisler 1988). He summarized his findings by stating: “All credible evidence indicates that lead is neither essential nor beneficial to living organisms, and that all measured effects are adverse- including those on survival, growth, reproduction, development, behavior, learning and metabolism.” Like humans, animals take in lead by inhalation, ingestion, and, to a lesser extent, absorption through skin. Mammals also acquire lead through the placenta and in milk. Plants take up lead from the soil and water. Both the absorption of lead and the symptoms of lead poisoning are affected by the age, sex and diet of an individual organism. Younger animals are the most sensitive to the effects of lead and there are neurobehavioral deficits at dose levels that have no overt signs of toxicity. An increase in active calcium metabolism, such as during egg laying, affects lead metabolism. Birds that are actively egg laying have higher levels of lead than either non-laying females or males (Pain 1996). Diet has a similar affect on lead absorption by wildlife as it does in humans. In Coho salmon, for example, an increase in waterborne or dietary calcium reduced uptake and retention of lead. There are some sources of lead exposure that are especially important for animal populations. There are risks to:
· Waterfowl from ingesting lead shot. Predators and scavengers that eat game wounded by hunters.
· Wildlife that forage near roads. · Aquatic life near industrial or legacy sources of lead. · Crops and invertebrates living in lead-contaminated soil. · Domestic livestock and zoo animals near industrial sources and/or in enclosures with lead
paint.
Some of these risks have been reduced by actions such as the phase out of lead in gasoline and the use of non-lead shot for hunting waterfowl. The sources of lead exposure for humans and other organisms are detailed in other sections. Lead levels in Animal Tissues Animals metabolize lead similarly to humans, with most lead found in bone. Lead accumulates during the lifetime of an organism, so there is a correlation between the age of an organism and

50
the amount of lead in bone. This means the levels of lead in bone are not a good measure of current lead exposure (Pain 1996). Different species have slightly different half lives for lead in blood, but in general blood lead concentration is a good measure of recent exposure. The concentration of lead in blood is less useful for determining the cause of death, so liver and/or kidney concentrations are often used in necropsies. For birds, the number of lead pellets in the gizzard is also informative. Due to the multi-faceted nature of the symptoms of lead exposure, it is sometimes difficult to diagnose or determine if an animal died of lead poisoning (Ma 1996). A combination of symptoms and lead levels in tissues are usually used to determine if an animal died of lead poisoning (Franson 1996). There is disagreement among scientists as to what is considered background, subclinical, clinical and severe levels of lead exposure, even within a single species. Often concentrations of up to 20 µg/dL in blood are considered background, with levels over 100 considered severe (Franson 1996;Ma 1996;Pain 1996). Lead Toxicity Plants Lead is not essential for plants and excessive amounts can cause growth inhibition, as well as reduced germination rates, photosynthesis, mitosis and water absorption. Crop plants may have reduced yield. Population level damage to plants from lead is rare, but atmospheric lead may have contributed to the decline of the European spruce forests (Eisler 1988). Invertebrates Reduced survival and reproduction has been seen in woodlice fed lead contaminated soil. A study of lead in earthworms showed negative effects on growth, maturation and cocoon viability (Maboeta et al. 1999). Terrestrial invertebrates found near roadways tend to have higher levels of lead. There is one report of lead hormesis in aquatic snails (Lefcort et al. 2008). In this study one species of snail, Physella columbiana, was found to do better when grown with lead-contaminated soil from a superfund site in Silver Valley, ID. However, lead was not directly beneficial to the snails, but killed snail parasites, which was then beneficial to the snails. Fish Signs of lead poisoning include spinal curvature, anemia, darkening of the dorsal tail region, degeneration of the caudal fin, reduced ability to swim against a current, muscular atrophy, paralysis, renal pathology, growth inhibition, reduced fertility, and death. There are some effects that are unique to fish, such as increased mucous over the gills, interfering with respiration and causing death. While there are differences among aquatic species, for all species effects were most pronounced at elevated water temperatures and reduced pH (Eisler 1988).

51
Amphibians Lead poisoning in frogs is indicated by sloughing of integument, sluggishness, decreased muscle tone, decreases in red blood cells, white blood cells, neutrophils and monocytes, and erosion of the gastric mucosa. Right before death there is excitement, salivation, and muscular twitching. Lower levels of lead leads to thyroid histopathology and increased time for metamorphosis (Eisler 1988). Mammals Signs of lead poisoning in other mammals are similar to those in humans. Signs include weight loss, colic, insomnia, diarrhea, anemia, blindness, renal damage, peripheral nerve damage, reduced growth, infertility, reduced life span, abnormal behavior, and learning impairment (Ma 1996). Higher doses result in convulsions, coma and death. Lead easily crosses the placenta and is transferred to babies in milk. There is some data on mammalian wildlife, but most mammalian data comes from domestic livestock or laboratory animals. Birds External signs of lead poisoning in birds include lethargy, weakness, emaciation, drooped wings and tail, and green feces. There are also internal signs that are seen in necropsies such as wasting of breast muscles and internal organs, reduced visceral fat, distended gall bladder, discolored gizzard lining, and pale internal organs (Pain 1996;Franson 1996). Exposure to Lead Animals and plants have many of the same exposure sources as humans, such as paint, soil, water, food and air. Like humans, younger animals are more susceptible to lead poisoning. Domestic animals Lead poisoning is a common occurrence for many domestic species in the United States and internationally (Cummings School of Veterinary Medicine at Tufts University 2008). In cattle, lead poisoning commonly occurs by consumption of discarded lead-containing farm supplies, batteries, paints, and machinery. Lead paint has been a problem for domestic animals, such as dogs, cats, goats, horses, pigs, cattle and sheep, and zoo animals, including apes, monkeys, bears, ferrets, seals, walruses, foxes, panthers, bats, raccoons, and armadillos (Eisler 1988). Any source of lead that has the potential to harm humans also has the potential to harm pets. Lead poisoning of household pets such as dogs, cats, guinea pigs, iguanas, and birds also occurs.

52
Lead Exposure in Birds Birds are known to be harmed by lead and there is a lot of information on lead poisoning in birds. Birds can be poisoned through direct ingestion of lead (primary lead poisoning) or by eating contaminated prey or carcasses (secondary lead poisoning). WDFW reported that there were 32 species of wild birds that occur in Washington and have examples of individuals who have died from lead poisoning in North America. For five of those species there are documented deaths due to lead poisoning in Washington (Washington Department of Fish and Wildlife 2001). The literature on lead poisoning in different species from fishing tackle and ammunition is too extensive to review here. The Minnesota Department of Natural Resources compiled a literature review with selected summaries of more than 500 citations on lead and nontoxic shot, including information on more than 115 species that have individuals harmed by ingesting lead shot. This was originally included as an appendix to the Non-toxic Shot Advisory Committee Report (Minnesota Nontoxic Shot Advisory Committee 2006), and has been updated (personal communication). Primary lead poisoning in birds The grinding action of birds’ gizzards and the feeding habits of waterfowl make them particularly susceptible to lead (Washington Department of Fish and Wildlife 2001;U.S. Fish and Wildlife Service 1986). Large, localized die-offs of hundreds of and thousands of waterfowl due to lead poisoning have been documented in the U.S. since the late 1800s (Washington Department of Fish and Wildlife 2001). Many waterfowl deaths are undetected, as most dead birds are neither recovered nor necropsied. Prior to the ban on lead shot for hunting waterfowl, lead poisoning was thought to account for the deaths of more than a million ducks each year in the U. S. Between 1999 and 2005, over 1700 dead Trumpeter and Tundra swans were found and studied in Whatcom and Skagit Counties and on the adjacent Sumas Prairie in British Columbia. The highest mortality occurred in 2003-2004 when 402 dead swans were found. An investigation into the causes of death during winters 200-2002 determined that 322/400 (81%) of the swans died from lead poisoning (Degernes et al. 2006). Further work using radio tagged swans localized one source of lead shot at Judson Lake, which spans the U.S./Canada border. Swans were deterred from using Judson Lake for winter 2007- 2009 and initial results show a 50% drop in mortality (Smith et al. 2008). However, due to the continued mortality of swans in the region, it is likely that other areas are also sources of lead for the swans. WDFW reported on possible environmental effects from lead fishing gear (Michael 2006). Many different species of birds, reptiles, and small mammals are known to have died from ingesting lead, but birds seem to be the most susceptible to lead poisoning. Lead poisoning from ingested fishing gear has been documented in many species, including the laughing gull, herring gull, whistling swan, mute swan, trumpeter swan, American black ducks, wood ducks, redheads, scaups, scoters, Canada Geese, great blue heron, snowy egret, white ibis, common merganser, red-breasted merganser, double-crested cormorant, green heron, while and brown pelicans,

53
painted turtle, and snapping turtle (Scheuhammer et al. 2003). Loons are the birds most likely to ingest lead fishing tackle, and one lead sinker or lead jig can kill a loon (Michael 2006). While the major focus has been on waterfowl, lead poisoning in upland game birds has also been documented. Mourning doves, chukars, and pheasants have been found with elevated levels of lead in blood and tissues. Mourning doves near heavily hunted fields have been shown to die from mistaking lead shot for seeds during feeding (Washington Department of Fish and Wildlife 2001). Secondary lead poisoning in birds Secondary poisoning occurs when predators and scavengers ingest lead shot, bullet fragments, or lead from other sources while feeding on wildlife and dead or wounded game animals. Lead poisoning has been documented in many species including golden eagles, red-tailed hawks, prairie falcons, and peregrine falcons. The WDFW report on lead shot has a good table on reports of lead poisoning in different species (Washington Department of Fish and Wildlife 2001). Lead poisoning of bald eagles was one factor in banning the use of lead shot for waterfowl (U.S. Fish and Wildlife Service 1986). Three golden eagles collected in Washington State in 1999 and 2000 had toxic levels of lead. The sources were unknown, but may have been from old pesticides which passed through the food chain via ground squirrel or other mammal (Washington Department of Fish and Wildlife 2001). In 2008, two sick bald eagles were taken to WSU’s veterinary school, but died of lead poisoning from an unknown source (Two Eagles Brought to WSU Die of Lead Poisoning 2008;Emaciated Eagles treated at WSU Die 2008). The most extensive research on secondary lead poisoning in birds has been done on the California condor, which is not currently in Washington. Comparable scavengers and raptors that are in Washington, such as turkey vultures and eagles, may be similar. California condors are closely monitored, including blood lead testing. The high levels of blood lead in wild condors and the high proportion of known deaths due to lead poisoning suggested that lead was an important cause of mortality and contributed to the decision to put the remaining nine wild Californian condors into captivity in 1985 (Wiemeyer et al. 1988). There is mounting evidence that ammunition is the main source of lead to California condors (Church, 2006 42 /id), which has resulted in requirements for non-toxic bullets and shot for hunting in parts of California (Ridley-Tree Condor Preservation Act 2007). Arizona has used a different approach, education and outreach, to phase out the use of lead ammunition in the range of their population of California condors.
Lead in the Food Chain There is some movement of lead in the food chain, but lead does not biomagnify in the food chain to the extent mercury does. Organisms tend to store the majority of lead in bones, which are rarely eaten, so lead is not highly concentrated up the food chain. There are some dangers to humans and wildlife from plants and/or animals that have been contaminated with lead. Secondary lead poisoning in predators and scavengers was discussed earlier.

54
In plants, lead concentrations are usually higher in the roots and lower in shoots and flowers. This is seen in the concentration of lead in foods in the U.S in the FDA market basket survey, which measures the amount of lead in the average diet (U.S. Food and Drug Administration 2006). While plants do not take up and incorporate a large percentage of lead from the soil, they may be covered with lead contaminated soil that is ingested along with the edible plant. For example, the concentration of lead in tree fruits grown on lead arsenate-contaminated soils is extremely low. In contrast, the lead concentration in vegetable crops is higher, and in some leafy and tuberous plants can approach or exceed values associated with human health risk (Peryea 1998). There are examples of hay that is too contaminated with lead to be safe for horses and in some areas it was necessary to slaughter domestic livestock because of high lead levels from plants in their diet (Eisler 1988). There is one DOH fish consumption advisory in the Spokane River due to lead from mining practices in the river basin. The DOH recommendation due to lead and PCBs is based on fish species and geographic area. The general advice is to not eat any fish from the Upriver Dam to the Idaho border and only one fish per month from between the Nine Mile Dam and the Upriver Dam; and only one meal per month for Lake Spokane. (http://www.doh.wa.gov/ehp/oehas/fish/consumpadvice.htm). In the Coeur d’Alene River basin, Tundra Swans and other species are exposed to lead from sediment. The concentrations of lead in sediment are extremely elevated from lead and other metals released from over a century of mining and mineral processing (the mean lead concentrations were 1075 to 5826 ppm). There have been numerous reports of the environmental contamination, exposure and adverse effects of lead and other metals on wildlife in the Coeur d’Alene River basin. A 2000 report summarizes 21 studies on vegetation, waterfowl, songbirds, birds of prey, and mammals (Lejune 2000). The study showed that multiple components of the Coeur d’Alene River basin food web are contaminated with lead, including aquatic vegetation, fish, waterfowl, birds of prey, songbirds, and mammals. In most areas swans are more likely to be exposed to lead from ingesting lead shot or fishing tackle and for those items to be found during necropsies. Necropsies on tundra swans from the contaminated area in the Coeur d’Alene River basin suggested almost all of them were lead poisoned. However, only 13% of the dead swans contained shot, compared to 95% of lead-poisoned swans in studies outside northern Idaho (Blus et al. 1991). This is consistent with other studies on different species in the area.

55
IV. Production, Uses and Releases of Lead Historical Uses/ Legacy While we cannot put exact numbers on which sources are responsible for lead exposures in Washington State, we do know that across the U.S., lead-based paint used in older homes and the resulting dust is consistently found to be the largest source of childhood lead exposure (Haley and Talbot 2004). Other sources include contaminated soil (Mielke et al. 1997) and sediment, drinking water, consumer products, food and nutritional supplements, traditional remedies, art and hobby supplies, worker-related exposures and ongoing releases. Different studies have shown different sources to be more or less important in different locations within the U.S., but all of these are documented to contribute to the problem of lead exposure. The largest population-based study in the literature on childhood blood lead levels is from Haley and Talbot (Haley and Talbot 2004). They analyzed data by zip code from 677,112 children who were born in New York State between 1994 and 1997 and tested for blood lead level before 2 years of age. The highest rates of elevated blood lead levels (EBLLs), which they defined using the CDC level of 10 µg/dL, were in upstate cities where more than 20% of the children had EBLLs. The best predictor of EBLLs was housing age, with pre-1940 housing stronger than pre-1950 housing as a predictor. Poverty and maternal education were also strong predictors. The percentage of children born to African-American mothers was a significant component, even after adjusting for age of housing and education level. New York City zip codes had surprisingly low percentages of EBLLs, considering the number of older housing units, number of children in poverty, low education levels, and number of minority births. New York City may have lower percentages of EBLLs because of all the steps that city took before other areas of the state and nation, such as banning residential use of lead paint, initiating a lead poisoning prevention plan in 1970, adopting strict rules on lead abatement, and controlling corrosivity in drinking water. Washington State Department of Community, Trade, and Economic Development (CTED) conducted a study (Community, Trade, and Economic Development 2005) of lead hazards in housing and childhood lead exposure in Washington State to identify geographic areas where children age 0-6 years old face higher risks of lead exposure in their homes. The CTED report was completed by Cascadia Consulting in collaboration with DOH, Ecology, University of Washington and the Children’s Environmental Health Initiative (CEHI) at Duke University. The analysis was based on soil lead levels near the former Asarco smelter in Tacoma, former orchard areas where lead arsenate pesticides were likely to be used, Childhood Blood Lead Registry data from 2000-2004, and 2000 U.S. Census data. The analysis was done at the census tract level (about 4,500 residents). The analysis included blood lead data from 7128 children who were tested between 2000-2004 and had address information that enabled the researchers to determine census tract. Only about 29% of tested children and 40% of the state’s census tracts were included in the analysis. The researchers looked for statistically significant relationships that were strong predictors of higher blood lead levels in children to develop a Washington State-specific model. The model used weighted risk factors to predict a risk index for each census tract. The four primary risk factors in the model are age of housing, household income, Hispanic ethnicity, and residence in

56
Central Washington. The model predicts that 36,000 children, or 8% of Washington children aged 0-6, are in priority 1 census tracts with the highest risk of elevated blood lead levels. Priority 1 areas tend to cluster in or near the center of older towns in neighborhoods that were developed by the mid-20th century. 93,000 children were predicted to be in priority 2 census tracts, 175,000 in priority 3 census tracts, and 170,000 in priority 4 census tracts. Lead-based paint Exposure routes Because they have more hand-to-mouth behavior, young children tend to have greater exposure to lead from paint than older children and adults. Children’s exposure to lead-based paint can occur by swallowing dust and chips from painted surfaces, mouthing accessible painted areas such as windowsills, breathing and swallowing paint dust and chips released during renovation, and playing in lead contaminated soil. Lead contaminated soil is considered a lead-based paint hazard by the U.S. Department of Housing and Urban Development (HUD) and also contributes to interior lead dust. Adult exposure to lead-based paint can occur by breathing or swallowing dust and chips from painted surfaces, especially dust and chips released during renovation. Gardeners and other adults who frequently work in soil are also exposed to lead contaminated soil. Prevalence of lead-based paint in the U.S. The presence of lead-based paint in homes, and other types of housing, is generally related to the age of the structure (Jacobs et al. 2002). Before 1955 paint contained up to 50% lead. In 1955 the paint industry voluntarily reduced the amount of lead in paint to less than 1%, but the compliance with that standard is not known. By 1978 the CPSC limited the lead content of most consumer paint to 0.06% (600 ppm). The most common definition of lead-based paint is from HUD, which defines lead-based paint as ≥1.0 mg/cm2 or 0.5% (5000 ppm) by weight. Lead-based paint in good condition may not be a lead hazard. It becomes a hazard as it deteriorates and when it is disturbed, as in paint removal, remodeling, or demolition. It is particularly important to use safe work practices during renovation and repair of lead-based paint. Only a small amount of lead-based paint is needed to provide high dust lead levels. For example, if sanded and turned into contaminated dust that is spread across an average size room, only 1 ft2 of paint at a lead concentration of 1 mg/cm2 (the federal standard) is needed to produce a settled dust lead level of 9,300 mg/ft2, several orders of magnitude above current dust lead standards of 40 µg/ft2 for floors (HUD 1995). The National Survey of Lead and Allergens in Housing provides estimates of lead-based paint and lead contaminated soil in U.S. housing (Jacobs et al. 2002). A nationally representative, random sampling of 831 housing units was evaluated between 1998 and 2000. The prevalence of lead-based paint hazards was found to vary by region, housing age, household income, and other factors. In the study the age of housing was broken down into categories of pre-1940, 1940-1959, 1960-1977, and 1978-1998. Older homes were more likely to have lead-based paint, lead hazards, and higher levels of lead in soil (see table 6). The lead-based paint found in homes built

57
after the 1978 ban was likely due to glazed tiles, illegal use of lead-based paint after the ban, or use of industrial or marine lead-based paint. Lead hazards from hobbies or occupations that used lead were also identified. The national survey found most painted surfaces in homes, even older homes, did not have lead-based paint. In almost all homes, regardless of age, the building components with the highest prevalence of lead-based paint were windows and doors. These surfaces can generate significant levels of lead dust and paint chips due to repeated opening and closing. Even lead-based paint that looks like it is in good condition may contribute to lead in household dust. One-third of homes with interior lead-based paint in good condition had dust lead hazards, while two-thirds of the homes with deteriorated interior lead-based paint had dust lead hazards. Lead dust hazards were defined using the HUD clearance standards of 40 µg/ft2 for floors and 250 mg/ft2 for interior window sills. Similarly, 39% of houses with significantly deteriorated exterior lead-based paint had lead soil concentrations over 200 ppm, compared to 13% of houses with exterior lead-based paint in good condition and 5% of homes without exterior lead-based paint. Table 6- Prevalence of Lead in U.S. Housing by Age
Age of Housing
Lead-based paint
Lead hazards Soil lead >200 ppm Housing Units in Washington
All Housing 40% 25% 16% 2,451,075 Pre-1940 87% 68% 41% 307,078 1940-1959 69% 43% 30% 414,555 1960-1977 24% 8% 6% 661,598 Post 1978 5% 3% 1% 1,067,844 Disposal of lead-based paint contaminated materials Materials from renovation, abatement or demolition of old homes may contain lead from the past use of lead-based paint. These materials require special handling and waste management. Debris coated with lead-based paint is a concern and should be evaluated to see if it is dangerous waste before it may be disposed of in a landfill. A representative sample should be obtained and tested using a toxics characteristic leaching procedure (TCLP). Debris leachate over 5.0 mg/l indicates the debris should be managed as dangerous waste. If there is more than 220 pounds of the dangerous waste, an EPA site ID number is required, as well as, an annual report for the year(s) the project was demolished. Most landfills do not require test results before accepting waste, making these requirements difficult to enforce. In addition, household hazardous waste is exempt from the hazardous waste requirements. Materials from renovation of private homes, whether the work is done by the homeowner or a contractor, are considered household hazardous waste and are exempt. Demolition debris is subject to the dangerous waste regulations and should be tested to ensure proper disposal. In the case of public or large private projects, the environmental impact of a project must be considered and a State Environmental Policy Act (SEPA) environmental checklist completed.

58
The likelihood of site contamination due to lead debris and site clean-up would need to be addressed in an Environmental Impact Statement (EIS) which includes an evaluation of alternatives and measures that would eliminate or reduce the likely environmental impacts.
Additional regulations protect the health of workers during the demolition process. See the Occupational Uses section for workplace regulations.
Soil and sediment Exposure Outdoor soil, which is often tracked indoors, is also an important source of childhood lead exposure (Mielke et al. 1997). Most exposure to lead from contaminated residential soil is from inadvertently swallowing soil and dust, both inside and outside the home. This can happen in many ways, such as soil on garden vegetables or soil tracked into the house by people and pets. Young children have more hand-to-mouth behavior, so are expected to have a greater exposure to lead in soil. Lead exposure from soil may also explain why children’s BLLs tend to be higher in the summer. Soil may be contaminated with lead from lead-based paint and such soil is defined as a lead-based paint hazard. The Washington State Area Wide Soil Contamination Task Force Report (Department of Ecology, 2003) identified large areas of Washington State with elevated lead levels in soil due to historic smelters and lead arsenate pesticide use. There are also unknown levels of lead in soil next to roadways, due to historic use of leaded gasoline. Area-Wide Soil Contamination Task Force Findings The Departments of Agriculture, Community, Trade and Economic Development (CTED), Ecology and Health chartered the Area-Wide Soil Contamination Task Force in January 2002 to respond to large areas of low-to-moderate level arsenic and lead soil contamination in Washington State and recommend a statewide strategy. The Task Force submitted their final report to the four chartering agencies on June 30, 2003 (Area-Wide Soil Contamination Task Force 2003). The Task Force findings and recommendations describe where arsenic and lead contamination is likely to be located, provide guidance on assessments and sampling, outline a broad approach to education and outreach, describe steps that should be taken to limit exposure, and address real estate disclosure issues and application of MTCA. While area-wide soil contamination is composed of arsenic and lead contamination, this document will primarily discuss the components that are relevant to lead. Area-wide contamination is different from typical cleanups because it pertains to contamination that occurs over a large geographic area and generally has lower contaminant levels. Population growth and changes in land use have combined to greatly increase the potential that people will be exposed to area-wide soil contamination. Washington’s population growth has resulted in the conversion of many areas to residential and commercial uses and an increased population in areas affected by emissions from metal smelters. The sources of area-wide contamination are historic uses of smelters, lead arsenate pesticides and leaded gasoline. Concentrations of lead at

59
properties affected by area-wide soil contamination are highly variable and the estimates of affected acres are estimates of which areas are likely to be affected. The only way to determine if an individual property is affected is to conduct soil testing. The task force report included estimates of how many acres are contaminated. Additional details can be found in the June 2003 Area-Wide Soil Contamination Project Task 3.4: Preliminary Estimates (ECY pub 03-09-044) (Washington State Department of Ecology 2003). Area-wide contamination from past smelter releases affected an estimated 489,000 acres. The primary releases of lead from smelters are from slag and stack emissions. Ecology estimated the smelter plume areas from four primary smelters in Tacoma, Everett, Northport, and Trail, BC and one secondary smelter on Harbor Island in Seattle. Only the Trail, BC smelter is currently in operation. A broad range of lead concentrations have been measured in soils from the plume areas, ranging from background levels, which are 11-24 mg/kg statewide, to over 3000 mg/kg. There were higher levels of lead found on the smelter sites themselves. Most lead contamination is present in the top 6-18 inches. The general trend from historic smelter emissions appears to be one of highest concentrations near the smelter and decreasing concentrations with increasing distance in the prevailing wind direction. Area-wide contamination from historic use of lead arsenate in orchards affected an estimated 188,000 acres. Studies completed by WSU of shallow orchard soils indicate residual lead concentrations range from background levels to over 4,000 mg/kg. Most of the lead contamination is in the top 16 inches and the concentration decreases with depth. The most extensive use of lead arsenate in Washington was from 1905 to 1947 on apple and pear orchards. It was also used on other crops, but the application rates for other crops were significantly lower, the other crops comprised much smaller acreage in Washington, and were rotated. Ecology estimated the number of acres in cultivation for apples and pears by time period for each county. Chelan, Spokane, Yakima and Okanogan counties are more likely to have elevated levels of lead based on the greater numbers of apple and pear trees in cultivation from 1905-1947. By 1947, the principal target pest, the codling moth, had developed resistance to the arsenate compound, and DDT was found to be a much more effective control agent. In general, plants do not absorb appreciable amounts of lead and translocate it to edible plant tissues, a phenomenon termed the “soil-plant barrier”. The concentration of lead in tree fruits grown on lead arsenate-contaminated soils is extremely low (Peryea 1998). Lead contaminated soil on surfaces of these plants may account for some of the elevated lead content. In contrast, the lead concentration in vegetable crops is higher, and in some leafy and tuberous plants can approach or exceed values associated with human health risk (Peryea 1998). Lead concentrations exceeding the U.S. Food and Drug Administration (USFDA) level of concern for lead were found in 1998 in a shipment of carrots that were grown on a former orchard site. The Task Force did not estimate the area in Washington affected by past use of leaded gasoline. Tetra-ethyl lead was used as a gasoline additive to increase octane and decrease knock starting in 1923. The use of leaded gasoline was phased out from 1973 until its use was banned for on-road vehicles as of Jan. 1, 1996. In general the highest levels of soil lead contamination from gasoline are found in the top 6-8 inches of soil and within 50-60 feet of the roadway. Lead deposition is correlated with gasoline use and traffic patterns, so each section of road has different levels of
60
lead depending on the historic traffic patterns and repair history. Studies have not shown a good correlation between traffic patterns and the concentration of lead in soil, which may be due to the difficulty in quantifying changing traffic patterns and road construction. In order to predict the extent of lead soil contamination from historic use of leaded gasoline we would need road use and repair history for all roads, which would have to be obtained on a county or city level. Additionally, actual soil data would need to be collected from representative roadsides to validate predictions made by the model used to estimate roadside lead soil concentrations. Area-Wide Soil Contamination Task Force Recommendations The Task Force report included recommendations which provide guidance on assessments and sampling, outline a broad approach to education and outreach, describe steps that should be taken to limit exposure, and address real estate disclosure issues and application of MTCA. The recommendations came from the Task Force’s guiding principles which included a focus on effective, practical and affordable solutions to minimize the potential for exposures, especially for children. These principles also included a preference for local decision-making. Education and awareness building comprise the foundation of the Task Force recommendations. The most important audiences are people and organizations that care for children, including parents, educators, healthcare providers, and childcare providers, and gardeners and other adults who frequently work in soil. The Task Force recommended that the agencies develop a tool-box of information and materials to help individuals and organizations answer questions about the potential for lead contamination at specific properties, as well as identify actions and individual protection measures they can take to reduce exposure. The Task Force also recommended that the agencies collect more data on childhood BLLs in Washington, characterize the location and extent of soil contamination from the past use of leaded gasoline, and further study the effects of soil contamination on plants and animals. Specific recommendations focused on child-use areas included:
· Implementing individual protection measures. · Maintaining good soil cover. · Conducting qualitative evaluations followed by soil testing where indicated. · Mandatory soil testing at new public child-use areas. · Voluntary certification for private childcare facilities.
The Task Force recommended that priority should be given to publicly maintained facilities. Specific recommendations for residential areas are similar to those for child-use areas and focused on children, gardeners, and other adults who frequently work in soil. The Task Force recommended that the agencies offer both technical and financial assistance to support residents in implementing individual protection measures; maintaining good soil cover; conducting qualitative evaluations and; testing the soil. There was also a focus on confidentiality and reporting of sampling results to protect the privacy of residents. For open land, the Task Force recommended amending the SEPA checklist to include a question on area-wide soil contamination; conducting qualitative evaluations followed by soil testing

61
where indicated before construction; implementing worker safety and dust control measures, and to encouraging real estate disclosure at property transfer. The Task Force recommended against listing individual properties affected as contaminated sites under MTCA, preferring that Ecology establish a forebearance policy. They also recommended that Ecology provide a streamlined process to indicate which sampled properties are clean, while maintaining the traditional MTCA approach as appropriate. Ecology evaluation of low-to-moderate ranges of soil lead concentrations The Task Force recommended that Ecology address properties with “low-to-moderate” levels of lead differently than properties with “high” levels of lead. Ecology defined “low” levels of lead in soils as below the MTCA Method A Cleanup Level of 250 mg/kg (250 ppm). The Method A Cleanup Level of 250 mg/kg is unlikely (less than 5% probability) to result in child BLLs greater than the CDC level of concern of 10 µg/dL. The upper end of the “moderate” range varies depending on whether a property is used as a residence (500 mg/kg), school or child care facility (700 mg/kg), or a commercial facility or park (1000 mg/kg). The moderate concentrations of lead in soil are unlikely (less than 5% probability) to result in child BLLs greater than 15 µg/dL. The CDC guidelines recommend that some measures may be necessary when a young child’s BLL over 15 µg/dL persists, such as an environmental investigation to determine the source of lead exposure and removal of the lead hazards. There were several key assumptions that underlie the recommended approach for addressing lead-contaminated soils: (1) children are the population group with the greatest susceptibility and exposure to lead; (2) scientists are currently unable to identify a threshold for lead toxicity in individual children and even if such a threshold could be identified for an individual child, it would be difficult to extrapolate such a finding to other children; (3) given current scientific information on the effects of low-level lead exposure, it is prudent to take reasonable steps to prevent exposure; (4) the level of harm from exposure to lead contaminated soils will vary depending on the exposure situation and soil lead concentrations; (5) harm will occur over an extended period of time. Lead has harmful effects on the environment and people of all ages, though children are the most sensitive. Since children are most sensitive to the effects of lead and more research has been done on children, Ecology focused its efforts on predicting the effects of lead on children. It is difficult to predict how lead will affect a given person. The scientific methods used to investigate health and environmental risks are inherently imprecise and open to varying interpretations. Adverse health effects below 10 µg/dL are sub-clinical, which means they are not diagnosed in an individual, and are studied by comparing large groups of children who are exposed to different amounts of lead. Ecology used the EPA’s Integrated Exposure Uptake and Biokinetic (IEUBK) model to evaluate the relationship between soil lead concentrations and blood lead concentrations. The IEUBK model was used to predict the average blood lead concentrations and the probability that a child will have blood lead concentrations greater a certain level. The IEUBK model is a multi-compartment pharmacokinetic model that was developed by the EPA to evaluate the risks to

62
young children (0-84 months old). The model takes into account lead intake from different sources, how much lead is transported into the blood, and how much lead remains in the blood. The IEUBK model has been found to agree with observed BLLs, be consistent with other models, and is widely used by state and federal agencies. The model predictions are sensitive to assumptions regarding variability among people, soil ingestion rate, exposure frequency, and other sources of lead exposure, such as from food and drinking water. Ecology used the default EPA parameters and conducted sensitivity analyses to see the effect that variations in key parameters have on the predicted BLLs. Ecology used the IEUBK model to evaluate soil lead concentrations on a broad age interval (0-84 months) and on selected age intervals, notably 12-36 months. The model predicts that at the Method A Cleanup Level for soil lead of 250 mg/kg, there is a 1-5% chance of a child having a BLL over 10 µg/dL. At that soil lead concentration there is a 5% chance of a child 12-36 months old having a BLL over 10 µg/dL and a 1% chance of a child 0-84 months old having a BLL over 10 µg/dL. There is a 0.1-0.3% chance that a child will have a BLL over 15 µg/dL at a soil lead concentration of 250 mg/kg. Table 7 shows the IEUBK predictions for different combinations of soil concentrations and land uses. Children are assumed to spend less time at commercial facilities and parks, more time at schools and childcare facilities, and the most time at residences. P10 is the probability that a child will have a BLL over 10 µg/dL. P15 is the probability that a child will have a BLL over 15 µg/dL. Table 7- IEUBK Predictions for Soil Exposure
Soil concentration
Age Residential areas
Schools/child care facilities
Parks/commercial facilities
P10 P15 P10 P15 P10 P15 250 mg/kg 0-84 months 1 <0.1 0.3 <0.1 <0.1 <0.1
12-36 months 5 0.3 0.8 <0.1 <0.1 <0.1 500 mg/kg 0-84 months 9.6 1.5 3.4 0.4 0.1 <0.1
12-36 months 21.3 4.9 7.9 1.2 0.3 <0.1 700 mg/kg 0-84 months 22 5.1 9.5 1.5 0.4 <0.1
12-36 months 39.5 12.9 18.9 4.1 1.1 <0.1 1000 mg/kg 0-84 months 41.7 14.2 22.7 5.4 1.5 0.1
12-36 months 61.2 28.1 37.6 11.9 4 0.5 MTCA Science Advisory Board Review In 2004, Ecology asked the MTCA (Model Toxics Control Act) Science Advisory Board (SAB) to review the scientific information and methods that the Department used to develop the numerical soil concentrations used to define the “high”, “moderate” and “low” concentration ranges. The SAB agreed that the methods and assumptions used by Ecology to define the ranges are scientifically defensible. The SAB also recommended that Ecology periodically review and evaluate whether the ranges should be altered, because of the emerging scientific consensus on

63
adverse health effects associated with BLLs below 10 µg/dL. The SAB also observed that there are no clinical interventions to lower BLLs below 10 µg/dL, so it is important for people to take steps to prevent exposure and the SAB recommended that Ecology expand its outreach and education efforts to reduce lead exposure in situations where soil concentrations are below the MTCA cleanup level. Area-Wide Contamination Progress Report Ecology hosts the area-wide toolbox website, which contains background information on area-wide soil contamination, maps and other information describing the extent of area-wide soil contamination, tools for conducting individual property evaluations, information on health risks, examples of individual protection measures, information on other protective measures, and contact information for local, state and federal agencies. The Washington State Legislature passed a law in 2005 that resulted in the Soil Safety Program (RCW 70.140). The program is managed by the Department of Ecology in partnership with DSHS, DOH, the Office of the Superintendent of Public Instruction (OSPI) and local health departments. It provides soil testing for schools and childcares within the program area in Western Washington (Tacoma Smelter Plume). The program also provides design assistance, labor and materials to put soil safety actions in place, and includes other outreach and education materials and activities. The Dirt Alert website has information about lead and arsenic in soil, the Tacoma Smelter Plume and other areas. It also has information on the Soil Safety Project for homeowners, childcares, parks, schools, camps and developers. Education and outreach targets local health agencies, the Department of Early Learning (DEL), childcare inspectors and workers, parks, school districts, parents and other community members, the Department Labor and Industries, and the Washington Association of Realtors. As of June 2007, 214 schools and 686 childcares have been identified, 214 schools and 215 childcares have been qualitatively evaluated and 175 schools and 194 childcares have been sampled. Problems were found in 29 schools and 52 childcares which have since developed or implemented a plan to address arsenic and lead contamination. Plumbing Lead exposure in drinking water from lead plumbing is thought to contribute a small amount of lead to many people, though it does appear to be a major source for a few individuals. In nature, the amount of lead in water is usually low. The concentration of lead in drinking water is usually low and elevated levels are usually due to lead that has leached out of plumbing materials into the water. The concentration in the water depends on the quality of the water (pH, hardness), the amount of lead in the plumbing materials, and the amount of time the water is in contact with the leaded materials. While most lead pipes were used in pre-1940 homes, lead solder was legally used with copper pipes until 1988, and plumbing fixtures still contain some lead. Predicting potential exposure from plumbing is difficult for several reasons. Lead concentrations in water can vary greatly among houses and among taps within a house. Lead concentrations in water also vary over time, even at a single fixture. Faucets manufactured with a sand-casting process show much greater lead leaching than machined or fabricated faucets using the same

64
alloy. This is likely because the casting process produces a rough surface which has a greater surface area. It is also likely that the lead in the alloy would migrate to the surface during the cooling process because it has a lower melting point than other metals in the alloy (Patch et al. 1998). For more on lead in alloys, see the Alloys section in the Consumer Products section of chapter IV. Most people have at least a small amount of lead exposure from plumbing materials. For some people, water may be a significant source of lead. EPA estimates that 10-20% of lead exposure comes from drinking water (U.S. Environmental Protection Agency 2007). It is also estimated that nearly all lead in drinking water is due to the residential plumbing system rather than the municipal distribution system (Maas et al. 2008). Submersible water pumps for well users have historically contributed to lead in water. As of 1995, lead-free brass alloys are required for well pump manufacturers, but pumps installed prior to 1995 may still pose a risk. Water meters installed prior to 2001 contain 5 to 7 percent leaded brass and brass cut-off valves still have no regulations limiting the lead content and are typically also manufactured with 5 to 7 percent leaded brass (Maas et al. 2002). In 2004 the Seattle school system found lead levels of up to 1600 ppb in drinking fountains (Seattle Public Schools 2008). About 25% of the 2000 fixtures that were tested had water lead concentrations exceeding 20 ppb, the EPA recommended maximum for schools. Seattle Public Schools is in the midst of a comprehensive water quality testing and remediation program, initiated in January 2004. A drinking water quality policy was developed by the School Board's Policy and Legislative Committee and adopted by the School Board on Dec. 1, 2004. The EPA recommended action level for drinking water in schools is 20 ppb, but the Seattle School Board set an action level of 10 ppb. According to the procedure, all cold water fountains, elementary classroom sinks, nursing office sinks and kitchen sources must be tested for lead and the superintendent was charged with developing and implementing a program of long term periodic testing. From 2000-2004 Washington, DC had high lead levels in its drinking water due to (U.S. Environmental Protection Agency 2007)
o Increased chlorine residual dosing in the mid-1990s o pH variations and low operating pH in the distribution system o Conversion from free chlorine to chloramines for final disinfection. This change
freed up lead that had been inaccessible. o The condition was fixed with an additive (orthophosphate) that prevents
corrosion. After this problem in Washington, D.C. was discovered, changes have been made to ensure proper testing of municipal water supplies prior to any changes in the disinfection methods. In a household, people can reduce the amount of lead in drinking water by flushing the tap for several minutes. The water that was sitting in the pipes, and has higher concentrations of lead, will be flushed out and not used. This does not work as well in schools because of the different water use patterns in schools. Each tap would need to be flushed every hour during the school day.

65
Occupational Uses Workplace Exposure to Lead Lead exposure in the workplace and take-home exposures to family members continue to be a public health concern in Washington State. Despite our understanding of lead’s health effects and the relative ease with which many lead exposures can be controlled, workers continue to be exposed at levels in excess of those allowable under state and federal workplace standards. Of significant concern are the relatively recent findings that these allowable lead exposures may be associated with significant health effects. In Washington, the primary occupational lead exposures occur in battery manufacturing, specialty glass manufacturing, and bridge renovation and painting. Recently, lead exposure was discovered in workers involved in recycling telecommunication cables. Occasional high blood lead levels are also seen in indoor firing ranges, radiator repair shops, and a variety of other workplaces. Other potential occupational exposures are not well characterized because blood lead level testing may not be performed. The best way to reduce lead exposure is to reduce or eliminate lead use. If there is no feasible alternative to lead-containing materials, then the exposure to workers should be minimized through industrial hygiene controls. Occupational standards for general industry currently rely on air lead testing to trigger blood lead level (BLL) testing in workers. However, current state and federal OSHA standards are based on scientific data from the 1970s and do not account for recent findings of harm associated with relatively low level lead exposures. Introduction Most adult lead exposure occurs in the workplace. Lead affects adults in ways similar to children, but typically at higher doses. Exposed adults may have a variety of health problems like infertility, high blood pressure, central and peripheral nervous system damage, changes to red blood cell formation, digestive system effects, cardiovascular system effects, and kidney damage. In the short term lead-exposed workers may report “flu-like” symptoms. However, some report no symptoms at all. The only reliable way to determine if someone is exposed to lead is to measure the BLL. Because the health effects related to lead exposure are permanent, it is critical to prevent worker exposure by using engineering and administrative controls and providing adequate personal protective equipment (PPE). Workers can be exposed to lead in a variety of industries. The primary ways in which this exposure occurs are through inhalation of dusts, mists and fumes. Workers may also ingest lead from contaminated hands, food, drinks, cosmetics, tobacco products, and clothing. Workers who fail to change their contaminated work clothing before leaving the work site will likely contaminate their vehicles and residences. There are documented cases where the source of elevated blood lead levels in children was traced back to the parents’ work place.

66
National data suggest that workers may be exposed to lead in the following industries, occupations, and tasks:
· Cable splicing · Cable recycling · Machining and grinding · Metal recycling · Mining · Radiator repair · Recovery of gold and silver · Repair and reclamation of lead
batteries · Smelting and foundry work · Soldering · Work on firing ranges
· Construction tasks: o Home renovation/remodeling o Demolition of old structures o Steel bridge maintenance o Welding or cutting of old painted metal o Thermal stripping or sanding of old paint
· Manufacturing: o Bullets o Ceramics o Ceramic tiles o Electrical components o Fishing weights o Lead batteries o Pottery o Specialty glass and stained glass
Monitoring lead exposures BLL measurements are the most useful biomarkers to demonstrate the relationship between increases in lead exposure and adverse health effects (ATSDR 2007). Measuring BLLs in lead-exposed workers is central to state and federal workplace regulations for lead exposure, tracking lead-exposed workers, and interventions with lead-exposed individuals (see below). BLLs are typically expressed in micrograms of lead per deciliter of whole blood (mg/dL). Medical testing laboratories in Washington are required to report BLL test results to DOH, which forwards adult (16 years old and above) results to L&I’s Safety & Health Assessment & Research for Prevention (SHARP) program for their Occupational Lead Exposure Registry. Occupational safety regulations require some level of blood lead evaluation and are explained in Chapter VI on regulations. Health effects of lead exposure in adults Lead poisoning has been recognized as a public health concern for centuries, reflecting the unique properties of this metal, its widespread use in numerous industries, and the well-documented health effects associated with overexposure. Recent research has focused on adverse health outcomes associated with BLLs that were not previously considered problematic. It is beyond the scope of this document to review the considerable literature describing lead’s health effects. However, two recent documents provide comprehensive reviews of the relationship between lead exposure and health effects in adults:
· The Association of Occupational and Environmental Clinics' (AOEC) Medical Management Guidelines for Lead-Exposed Adults (Association of Occupational and Environmental Clinics 2007)

67
· Recommendations for Medical Management of Adult Lead Exposure (Kosnett et al. 2007).
Inorganic lead can interfere with cellular processes throughout the body, resulting in a wide spectrum of adverse effects across many body systems. These health impacts range from subtle, subclinical changes in function to symptomatic, life-threatening intoxication (Kosnett et al. 2007). Symptoms of lead poisoning include weakness, excessive tiredness, irritability, constipation, anorexia, abdominal discomfort (colic), fine tremors, and wrist drop. Additionally, damage to the kidneys and the nervous system, anemia, high blood pressure, impotence, infertility, and reduced sex drive can also occur with exposure to lead. Lead poisoning, neurological effects, and mental retardation have occurred in the children of workers who bring lead home from the workplace (National Institute for Occupational Safety and Health 2007). Recent findings have increased public health concern over the toxicity of lead in adults at low doses (Kosnett et al. 2007). These findings initiated a reappraisal of the levels of lead exposure associated with adverse health outcomes (Association of Occupational and Environmental Clinics 2007;Kosnett et al. 2007). These recent reviews identified the potential for hypertension, effects on kidney function, cognitive dysfunction, and adverse female reproductive outcome in adults at BLLs that were previously considered to be “safe” and do not currently trigger medical removal from lead-exposed tasks under state and federal workplace regulations. Workplace regulations Currently, Federal OSHA and Washington State have two comprehensive worker protection regulations related to workplace exposures to lead. The general industry rule in WAC 296-62-07521 covers all exposed workers except construction work. WAC 296-155-176 covers construction work involving both existing lead containing materials and new installations. While these two Washington rules are identical to Federal OSHA rules; there are differences between them due to the nature of the construction industry and new scientific findings from lead research conducted from the 1970’s through the1990’s. Table 8 contains a summary of the key occupational requirements from both regulations. This table is not designed to provide a comprehensive or conclusive analysis of the regulations. Current occupational standards require employers to evaluate airborne exposure of workers and their job tasks. Employers then compare their exposure monitoring data to the regulatory action level (AL) of 30 µg/m3 and the Permissible Exposure Limit (PEL) of 50 µg/m3 as an 8 hour time-weighted-average (TWA8). Exposures exceeding AL and PEL concentrations have specific regulatory requirements under each of the rules. Exposure data collected in the construction industry for a variety of common job tasks (prior to OSHA’s emergency rule for construction in the 1990’s), was used as a framework. Explicit levels for worker protection are prescribed based upon construction job tasks known to exceed the PEL, such as manual removal (scraping) of a protective coating (paint) or hot work on coated steel structures. Within the construction industry these levels are referred to as “Trigger Tasks,” which represent common tasks with exposures that may exceed the PEL. Appendix D of the general industry rule also identifies processes and

68
industries with known worker exposure levels that may exceed the occupational exposure limit. However, the general industry rule does not assign specific levels of employee protection. Both the general industry and construction rules require some level of blood lead evaluation. The construction rule requires blood lead testing with one day of exposure and periodic follow up testing at a prescribed frequency. The general industry rule requires BLL testing in workers when airborne lead levels exceed the action level. A blood lead test will evaluate circulating blood lead from all routes of exposure, which is important because workers may be exposed via other routes of entry, like ingestion. SHARP used data from its Occupational Lead Exposure Registry to identify elevated blood lead levels occurring in workers in the following occupations: construction (including structural steel work like bridge renovation), battery manufacturing, specialty glass manufacturing, workers cleaning indoor firing ranges, and metal recycling such as telecommunication cable and structural steel recycling. Ideally, employers would find appropriate lead-free materials to substitute in their work processes and eliminate lead exposures from the workplace. However, this is not always feasible (for example, maintenance of a painted steel structure with an existing industrial coating containing 30% lead or manufacturing lead acid batteries). The next best solution requires employers to implement appropriate and feasible industrial hygiene exposure controls like industrial ventilation systems and dust suppression systems. Such measures are required by both occupational regulations. These exposure controls generally require worker training and written procedures to ensure workers use them in a manner that achieves successful exposure reduction. If exposure controls fail to provide adequate exposure reduction or if such measures are not feasible, the employer must provide appropriate personal protective equipment such as appropriate respirators, coveralls, and gloves.

69
Table 8- Summary of the Lead Occupational Regulations: General Industry and Construction General Topic Subject General Industry
WAC 296-62-07521 Construction
WAC 296-155-176 Hazard Assessment and Exposure Evaluation
Evaluate potential for inhalation, skin irritation, skin absorption
Yes Yes
Initial Airborne Exposure monitoring AL = 30 µg/m3 PEL = 50 µg/m3
Required to determine if employees are exposed to lead at or above AL 30 µg/m3
Allowance for use of objective data Limited information in Appendix D of the rule.
Required to determine if employees are exposed to lead at or above AL 30 µg/m3
Presumed airborne exposure levels during “trigger tasks”.
Specific worker protective measures during initial evaluation
Protective measures required by Airborne Contaminants rule, WAC 296-841-20003; not as specific as the construction standard.
Yes, for trigger tasks For other tasks, WAC 296-841-2003 may apply
Additional monitoring
Per prescribed schedule or when production, processes, controls or personnel changes that may result in new or additional exposures.
Per prescribed schedule
Written program Description of each lead activity Specify Exposure Controls Work procedures Air monitoring data Etc…
Yes Updated at least every 6 months
Job specific program Updated at least every 6 months

70
General Topic Subject General Industry WAC 296-62-07521
Construction WAC 296-155-176
Exposure Controls
Use feasible exposure controls to get exposures down to the PEL. (50 µg/m3)
Yes Exceptions: § Brass & bronze ingot manufacturers (down
to 75µg/m3) § Small non-ferrous foundries (down to 75
µg/m3) § Respiratory protection required
Yes
Frequent and regular inspections of job site by competent person
Written program effective in practice Yes
Evaluations of mechanical ventilation system
Yes, and; Specific measurements and frequencies noted to demonstrate system effectiveness.
Yes, but: Frequency – “as necessary”
Establish and post the “Regulated area”
Yes Yes
House-keeping
Maintain all surfaces as “Free as practical” from accumulations including: floors, work surfaces counters etc
Yes Yes
Vacuums with HEPA filters Other methods allowed like wet sweeping when vacuuming or equivalent methods
Yes
Yes

71
General Topic Subject General Industry WAC 296-62-07521
Construction WAC 296-155-176
Facilities
Clean change areas to separate street clothes from contaminated items
Yes Yes
Remove lead contaminated clothing and equipment in the change area. Prohibition on allowing worker to take contaminated work clothes home for washing
Yes Yes
Provide an “adequate number” of hand washing facilities Require hand washing at end of the shift if below PEL (no showers available)
Yes
Yes.
Showers required
Yes
Showers
Required
“Where feasible” Mandatory hand and face washing at the end of the shift where showers infeasible.
Lunchrooms or eating areas
Yes Temperature controlled positive pressure, filtered air supply. Employees must decontaminate PPE and equipment before entering. Required hand and face washing prior to eating, drinking, smoking or applying cosmetics
Yes. They need to be “as free as practicable from lead contamination”.
Food & drink, tobacco products, cosmetics
Prohibited in areas with airborne concentrations at or above PEL
Prohibited in areas with airborne concentrations at or above PEL
Allowed in change rooms and lunchrooms

72
General Topic Subject General Industry WAC 296-62-07521
Construction WAC 296-155-176
PPE Respiratory Protection both in the lead standards and in WAC 296-842 Coveralls, gloves, footwear, shoe covers, face shields, eye protection, hats etc.
Yes Yes
Training
Content of Initial and annual refreshers
Hazards of lead Contents of the standard and its appendices Specific operations resulting in exposure Specific engineering and work practice Respiratory protection and other PPE Medical surveillance program Compliance plan Chelating agents Record keeping
Hazards of lead Signs, labels and warnings Contents of the standard and its appendices Specific operations resulting in exposure Specific engineering and work practices. Respiratory protection and other PPE Medical surveillance program Compliance plan Chelating agents Record keeping

73
General Topic Subject General Industry WAC 296-62-07521
Construction WAC 296-155-176
Medical Surveillance
Initial blood test
Prior to employee assignment to an area with airborne exposures at or over the AL for 30 calendar days per year
1 day of exposure over AL
Additional blood tests
Every 6 months At least every 2 months for each employee who’s last test was at or above 40 µg/dl Second follow up blood sample within two weeks if any 1 sample exceeds 60 µg/dl At least monthly during medical removal
Additional blood work every 2 months during the first 6 months After that, every 6 months.
Initial Medical Exams
Initial medical exam or consult before assignment to area with exposure at or above action level for more than 30 calendar days per year.
Additional Medical Exams and Consultations
At least annually when an employee has a blood lead at or above 40 µg/dl Upon notification an employee has: · Developed signs or symptoms associated with
lead intoxication · Desires medical advise regarding current or
past exposure and ability to procreate a health child
· Demonstrates difficulty breathing during a respirator fit test or during use
As appropriate during medical removal
Multiple Physician Review (MPR) Yes Yes

74
General Topic Subject General Industry WAC 296-62-07521
Construction WAC 296-155-176
Medical Removal
BLL trigger to initiate medical removal
60µg/100g on 1 test (confirmed by a follow-up test) or 50 when averaged over 3 tests.
50µg/dL on 1 test(confirmed by a follow-up test)
Maximum duration of medical removal
18 months Not specified
Chelation Prophylactic Chelation Prohibited Prohibited Therapy Under the supervision of a licensed physician Under the supervision of a licensed
physician Recordkeeping
Duration to maintain exposure monitoring records
At least 40 years or Duration of employment + 20 years
At least 30 years (per chapter 296-802)
Duration to maintain medical records
At least 40 years or Duration of employment + 20 years
Duration of employment + 30 years

75
Tracking adult lead exposures The U.S. Department of Health and Human Services set a national goal to eliminate workplace-related lead exposures that yield BLLs greater than 25 mg/dL by 2010 (DHHS 2000). The prevention of lead poisoning is an important public health goal in the United States and elsewhere, reflecting the serious adverse health outcomes associated with lead poisoning, the preventable nature of the condition, and the potential for minimizing health effects (i.e., with early detection of lead poisoning). More than 90 percent of adults with BLLs greater than 25 mg/dL receive their exposure from the workplace. Public health surveillance systems that track adult BLLs currently operate in 40 states, including Washington. The state programs submit blood lead test results and patient demographic data (without revealing the patient’s name) to the Adult Blood Lead Epidemiology and Surveillance (ABLES) Program of the Centers for Disease Control and Prevention’s (CDC’s) National Institute for Occupational Safety and Health (National Institute for Occupational Safety and Health 2007). These data assist in the national surveillance effort focused on investigating elevated BLLs in adults (Centers for Disease Control and Prevention 2006). Additional information about the ABLES program and national adult blood lead surveillance is available from www.cdc.gov/niosh/topics/ABLES/ables.html. An Occupational Lead Exposure Registry (Registry) has operated in Washington State since May 1993. The Registry serves a vital role in the surveillance of occupational lead overexposure and poisoning. Education and prevention efforts directed towards workers with elevated BLLs (i.e., > 25 mg/dL), workplaces, industries, and occupations stem directly from the information obtained through the Registry. More information about Washington State’s adult blood lead surveillance program is available at www.lni.wa.gov/Safety/Research/OccHealth/Lead/. Washington State data Between May 1993 and December 31, 2006, the Registry received a total of 90,631 BLL reports (see Table 9); approximately 4% of these reports were for individuals with elevated BLLs (≥ 25 μg/dl). For cases where a home address could be obtained, the largest number of elevated blood lead reports was for King County residents (47%), followed by residents of Snohomish (9.8%)and Pierce Counties (8.8%).

76
Table 9- Number of Adult Blood Level Tests Reported in Washington State
Blood Lead Level (μg/dl)
January 1-December 31, 2006
(%)
May 15, 1993-December 31, 2006
(%) < 25 8737 (99%) 87,075 (96%)
25-39 81 (0.92%) 2700 (3.0%) 40-49 18 (0.20%) 609 (0.67%) 50-59 8 (0.09%) 185 (0.20%) ≥ 60 6 (0.07%) 62 (0.68%)
TOTAL 8850 90,631
Note that the number of reports exceeds the number of exposed individuals because an individual may have multiple (repeat) blood lead tests (and hence reports) for a single lead exposure event. The 113 elevated BLL reports for 2006 were associated with 65 individuals.
The industries that yielded the greatest number of cumulative elevated blood lead reports (25 mg/dL or greater) in Washington State between January 1, 1994 and December, 31 2006 are summarized in Table 10. Although an individual may have multiple reports, these data provide a useful indicator of industries in which lead exposures occur (other limitations of these data are described below). Several factors are responsible for the decline in importance of several of these industries in recent years. For example, a study of Washington State’s radiator repair industry (Whittaker 2003) revealed that this industry is in decline because of the phase-out of copper brass radiators in newer passenger vehicles. Lead exposures at a foundry decreased since the facility moved its operation to a new location. In addition, fertilizers are no longer manufactured from industrial waste in Washington State. However, several industries continue to yield lead-exposed workers, as shown in Table 10.

77
Table 10- Number of Washington Industries with Three or More Elevated BLL Reports ((≥ 25 μg/dl), January 1 - December 31, 2006 SIC Code
Description Reports 25-39 μg/dl
Reports 40-49 μg/dl
Reports 50-59 μg/dl
Reports ≥ 60 μg/dl
Total Reports ≥25 μg/dl
3691 Storage Batteries 26 8 0 2 36 1721 Painting And
Paper Hanging 7 4 5 2 18
3211 Flat Glass 7 0 0 0 7 7997 Membership
Sports & Recreation Clubs
3 1 1 0 5
7539 Automotive Repair Shops, Not elsewhere classified
0 0 1 2 3
The lead-exposing tasks associated with these industries are the same as those shown in Table 11. Exposures in SIC code 7997 reflect the cleaning up of spent brass shell casings at indoor firing ranges. The following demographic information was available for the 65 individuals with BLLs ≥ 25 μg/dl recorded between January 1, 2006 and December 31, 2006:
· Gender was available for all individuals. 100% were male.
· Age was available for 64 individuals. Ages ranged from 20 to 72 years old; the average was 46 years and the median was 39 years.
· Race was available for 19 individuals. Of these, 12 were White (63%), four were “Other” (21%), one individual was Asian, one was Black, and one was Hawaiian/Pacific Islander.
· Ethnicity was available for 23 individuals. Of these, 15 were Non-Hispanic (65%) and eight were Hispanic (34%).
A new source of lead exposure was identified in Washington State in 2007 - recycling of telecommunication cables. An international company removed cable with lead sheathing from underground vaults, which was then either cut on-site or spooled and transported to a warehouse and cut. The cutting process yielded air lead levels in excess of the Permissible Exposure Limit for lead and workers were not adequately protected. As of December 10, 2007, the Registry received 32 elevated BLLs reports for 13 patients, ranging from to 25 to 54 µg/dl.

78
Registry limitations The cable recycling episode described above highlights a fundamental limitation of the lead surveillance system: companies that do not test their workers for lead are not included in the Registry. In this instance, there was initially no systematic lead biomonitoring at the company; the sentinel case went to her family physician for a blood lead test after she learned that a worker in another state (employed by the same company) was overexposed to lead. Industries may be under-represented or even missing from the Registry, whereas others may be are over-represented because they consistently provide lead biomonitoring to their workers. Several studies have documented the failure of companies to conduct either air lead- or blood lead-testing:
· Survey of lead-using employers in California (Rudolph et al. 1990): o 2.6% conducted environmental monitoring o 1.4% conducted routine biological monitoring o 80% of battery manufacturing workers were tested for BLL o 1% of radiator-repair workers were tested for BLL
· Washington State survey of lead-using non-construction employers (Nelson and
Kaufman 1988): o 21% of employers conducted air sampling o 17% conducted blood lead testing
· Washington State survey of the radiator repair industry (Whittaker 2003):
o 16% of shops performed air lead testing in the previous 12 months o 35% provided blood lead testing in the previous 12 months
· Survey of current lead use, handling, hygiene, and contaminant controls among New
Jersey industries (Blando et al. 2007): o >25% of companies did not employ basic industrial hygiene practices o 24% of companies had not conducted air sampling within the last 3 years
Because many lead-exposed workers do not have their blood tested, it is likely that lead overexposure and poisoning are much greater problems than the Registry data indicate. Industries and individuals that are likely underrepresented in Washington State’s Registry include:
· Business owner-operators who are not required to abide by state OSHA regulations.
· Other workers not under Washington State OSHA jurisdiction, such as contractors on federal facilities, railroad workers, longshoreman, etc.
· Residential contractors: remodelers, painters, abatement workers, and other de-leaders.

79
· Day laborers and others with no long-term affiliation with an employer.
· Indoor firing range workers who clean up spent shell casings.
· Autobody technicians working on older vehicles with lead-containing paint.
· Cable recyclers and others handling uncharacterized recycled materials.
To help target limited resources to the worst problems, efforts should be directed to answering the following questions about lead exposure in Washington State:
· How many companies have potential worker exposure issues and what are their lead exposure control practices?
· Are companies aware of Washington State’s regulatory requirements and do they need help with lead control programs?
· How many workers are potentially exposed to lead and what are their blood lead levels?
· How significant a problem is take-home lead for workers’ families?
· What is the burden of lead exposure on vulnerable populations (identified by their financial circumstances or place of residence; health, age or functional or developmental status; ability to communicate effectively; presence of chronic or terminal illness or disability; or personal characteristics).
· Are health care providers aware of the recent medical information concerning lead’s health effects at relatively low doses?
· What are the characteristics of workers and their workplaces at BLLs of 10 to 25 µg/dL?

80
Table 11- Top 10 Washington industries with elevated blood lead reports (January 1, 1994 to December 31, 2006) Number of blood lead reports
Industry SIC code
Typical Tasks 25-39 ug/dL
40-49 ug/dL
50-59 ug/dL
> 60 ug/dL
Total
Storage batteries 3691 Manufacturing lead batteries
271 166 49 7 493
Flat glass 3211 Manufacturing specialty lead-containing glass
433 52 3 1 489
Painting and paper hanging
1721 Removing leaded paint from steel structures (e.g., bridges)
285 80 16 5 386
Automotive repair shops, not elsewhere classified
7539 Repairing copper-brass radiators (melting lead solder)
188 40 23 11 262
Bridge, tunnel, and elevated highway construction
1622 Hot work, cutting, chipping, etc. on leaded paint on steel structures (e.g., bridges)
121 19 11 5 156
Gray and ductile iron foundries
3321 Melting and casting lead-containing metals
73 23 7 8 111
Industrial inorganic chemicals, nec
2819 Melting and casting lead-containing metals
96 8 1 0 105
Motor vehicle parts and accessories
3714 Repairing copper-brass radiators (melting lead solder)
59 18 4 0 81
Nitrogenous fertilizers
2873 Manufacturing fertilizer from lead-containing industrial waste
70 6 1 0 77
Metals service centers and offices
5051 Scrap metal recycling (heating and cutting lead)
65 8 1 74

DRAFT
81
Consumer Products Lead is used in so many products that it is not possible to discuss every one of them. This document addresses the most common products or types of products. To assist the reader, the section is organized, as follows, to provide similar types of information on each specific product. Background Because lead is inexpensive, dense, easily molded, melts at low temperatures, and does not rust, corrode or conduct electricity well, it has many potential uses in consumer products. Unfortunately, lead is also highly toxic to all organisms and there is no known safe level of lead. It is not possible to list all consumer products which may potentially contain lead, but we have attempted to include as many as possible. Some products do not contain intentionally added lead, but lead contamination that has unintentionally been introduced into the product. There are also different risks from different products, depending both on how much lead is in the product and how much lead in released under different conditions. Information about different products is detailed in this chapter. Alternatives Known alternatives to many uses of lead are described for each product. Different products have different alternatives, including iron, silver, bismuth, tin, and copper. Groups Affected Everyone has some exposure to lead in products. Children are more vulnerable because they are exposed to more lead from hand-to-mouth activity, they absorb more lead than adults, and their bodies are still growing and developing. Estimated Quantity The U.S. uses about 1.6 million metric tons of lead per year and more than 70% of that use is from recycled lead(U.S. Geological Survey 2008). The difference between what we use each year and what we recycle is about 300 thousand metric tons. According to the USGS 2005 Minerals Yearbook (U.S. Geological Survey 2007) the U.S. used 426 thousand metric tons of mined lead and 1,140 thousand metric tons of secondary lead. The total lead consumption for the U.S. in 2005 was estimated to be 1,566 thousand metric tons. Batteries accounted for 88% of all lead consumption. Tech Cominco’s Pend Oreille zinc-lead mine near Metaline Falls, WA produced 8,000 metric tons of lead in 2005. Consumption of lead, both in the U.S. and worldwide, has been increasing and is expected to continue to increase due to increased production of car batteries and technology. The USGS tracks lead consumption in some categories. In 2005, 1,290,000 tons of lead was used for batteries; 120,000 tons were used for metal products including 61,300 tons for ammunition, 29,000 tons for sheet lead, 19,500 tons for casting metals, 8,400 tons for solder, 1,180 tons for bearing metals, and 2,100 tons for brass and bronze; 14,100 tons were used for oxides in paint, glass and ceramic products and other

DRAFT
82
pigments and chemicals. Fishing weights and wheel weights would be included in the category of “other metal products” that was estimated to be 500 metric tons of lead in 2005. USGS does not track lead use in vinyl, but the Vinyl Institute estimated that 7-11 metric tons of lead were used (The Vinyl Institute Stewardship Committee 2007).
Figure 7- 2005 U.S. Lead Usage (in thousand metric tons) Dotted lines represent releases or recycling. End-of-Life Although there is limited initial exposure to the lead disposed in solid waste, it is a concern because solid waste enters a cycle of management that eventually results in dissipation of lead to areas where exposure can occur. Some of the lead may end up in landfill leachate, which is then treated at a municipal wastewater treatment plant and then released in the wastewater or sewage sludge. Businesses disposing of lead containing products are required to designate their waste per Washington’s Dangerous Waste regulations. If the waste is designated as hazardous it must be disposed of appropriately, in a hazardous waste landfill. There are some exemptions in the regulations if the lead is recycled rather than disposed of as waste. Depending upon the amount of waste generated, businesses must track and report to Ecology how the lead was managed each year. Household waste is exempt from the dangerous waste regulations.

DRAFT
83
Existing Programs/ Regulations There are many laws and regulations about lead in products. The Food and Drug Administration (FDA) and the Department of Agriculture (USDA) regulate lead in food and products that contact food. The Consumer Product Safety Commission (CPSC) limited the amount of lead that is allowed in paint on consumer products and regulates other products as needed. The Environmental Protection Agency (EPA) regulates lead in drinking water. There are also specific state laws in Washington and other states on lead in different media and selected products. The California Safe Drinking Water and Toxic Enforcement Act of 1986 (sometimes referred to as Proposition 65) requires a warning label on any product sold in California that contains enough lead to exceed the no significant risk level of 15 ug/day. Several states, including Washington, have passed a law prohibiting lead in packaging. More information on laws and regulations is in Chapter VI – Current Regulatory Approaches to Lead.

DRAFT
84
Toys Background Lead in toys is primarily found in either paint or plastics used in their manufacture (Centers for Disease Control and Prevention 2008). In 1978 the lead content in paint on toys and most consumer products sold in the U.S. was limited to 600 ppm (0.06%) as mandated by the Federal Hazardous Substances Act (FHSA) (U.S. Consumer Product Safety Commission 2002). However, it is still widely used in other countries and has been found on some imported toys. A new law, the Consumer Product Safety Improvement Act (CPSIA), was passed in Aug. 2008 that set a limit of 600 ppm for lead in children’s products. The new limit became effective on Feb. 10, 2009, with lower limits phased in over time. CPSIA also sets a new limit of 90 ppm for lead in paint as of Aug. 14, 2009. Prior to CPSIA, there was no national limit to the amount of lead in other toy materials, so a toy may have been recalled for having high levels of lead in the paint, but not for the lead in other materials, such as a fishing rod with a solid lead fishing weight. There is also lead in jewelry, including children’s jewelry. More information on jewelry is included in the jewelry section.
Lead is sometimes used as a stabilizer or pigment in plastic toys and packaging. When the plastic is exposed to substances such as sunlight, air, and detergents, the chemical bonds breaks down and lead dust is formed. This lead dust is a possible exposure pathway for children who spend much of their time at or near the floor and who have a higher incidence of hand-to-mouth activity. More information about lead in PVC is in the section on vinyl found later in this chapter.
Alternatives There are alternatives to lead in toys. Toys and other children’s products that do not contain lead are a widely available. Several sources have been established on the web which consumers can use to identify lead free toys (see http://healthytoys.org/home.php for example.) The recent numerous recalls of lead-contaminated toys by the Consumer Product Safety Commission has emphasized how widespread this problem remains. In addition, alternatives to lead used in plastics are also readily available although they tend to be more expensive. The Vinyl Institute, for example, has indicated that alternatives to lead are readily available except for specialty applications in the wire and cable industry (The Vinyl Institute Stewardship Committee 2007). Groups Affected Young children are the primary individuals impacted by lead used in toys. Children are exposed via two pathways:
· Lead dust and flakes unintentionally adhering to toys. · Lead intentionally added to toys.

DRAFT
85
Hand-to-mouth activity is part of the normal development process for children. They often place toys, fingers, and other objects in their mouth to which lead dust and flakes have adhered, exposing themselves to lead. In addition, if these toys contain lead, the children may ingest lead paint directly. Lead is often characterized as having a ‘sweet’ taste which reinforces this behavior and increases possible lead exposure. These topics and more have been explored in detail and can be found in the publication from the Centers for Disease Control (CDC) Preventing Lead Poisoning in Young Children (Centers for Disease Control and Prevention 2005). Estimated Quantity From January 1, 2007 through February 14, 2008, the U.S. Consumer Product Safety Commission (CPSC) issued 71 separate product recalls for children’s toys and related products that contain lead above permissible levels. These products recalls amount to 8,280,820 separate items (Center for Disease Control and Prevention 2008). As Washington has 2% of the national population, approximately 165,616 separate items were likely recalled in Washington State alone since January 1, 2007 (see Appendix A). In addition, work has been done by environmental interest groups and other states to evaluate the levels of lead in children’s toys and products. The Ecology Center in Michigan tested 1,200 toys for lead using an XRF hand-held device. Lead was found in 35% of the toys tested and roughly half of those (17%) contained lead above the legal limit of 600 ppm (The Ecology Center 2007). End-of-life The amount of lead which actually ends up in municipal landfills from toys in Washington State cannot be estimated because information is unavailable on the amount of lead used in toys as well as the number of individual toys sold each year. Existing Programs/ Regulations
In 1978 Federal law limited the amount of lead in paint on most consumer products, including toys, to 600 ppm. The CPSC issues recalls of toys that could potentially expose children to lead (Centers for Disease Control and Prevention 2008). In August 2008, Congress passed the Consumer Product Safety Improvement Act (CSPIA) 5b, which amends the Consumer Product Safety Act. The amendment changes the limit for lead in consumer paint in 16 CFR 1303 from 600 ppm to 90 ppm as of August 14, 2009.
CSPIA also established new standards for lead in children’s products and contained language explicitly pre-empting certain state authorities. CPSIA restricts the level of lead in children’s products to 600ppm in February 2009, then 300ppm in August 2009, and then 100ppm in 2011 if feasible. Under the FHSA, the CPSC can take action against a product that contains lead but it must find that the product is a "hazardous substance" as defined in section 2(f) of the law(15 U.S.C. §

DRAFT
86
1261(2)(f)). For a substance to be considered a hazard under the FHSA, the Commission must be able to demonstrate that:
· Persons are exposed to the substance during customary or reasonably foreseeable handling or use and
· The exposure may cause substantial personal injury or illness.
A product containing a toxic chemical that is not specifically intended for use by children but which creates a risk of substantial personal injury or illness due to customary or reasonably foreseeable handling or use requires precautionary labeling.

DRAFT
87
Jewelry Background
Lead is a common metal found in jewelry and it is used for numerous reasons. Jewelry made with lead is:
· Easier to shape and form. · Heavier, so it seems more substantial. · Cheaper than other metals, such as zinc or silver. · Similar in appearance to more expensive metals such as silver. · Readily available.
For these reasons, many manufacturers, particularly of cheaper jewelry, readily use lead as a main component and, in some cases, as the prime component of pieces of jewelry.
Lead is also sometimes used as a stabilizer in some plastics, such as polyvinyl chloride (U.S. Consumer Product Safety Commission 1997), which is often incorporated into children’s and inexpensive jewelry items (California Department of Toxic Substances Control 2007).
Alternatives Jewelry and other children’s products that do not contain appreciable levels of lead are a widely available alternative. It may not be possible to make the same item for the same cost, but similar items are available. Groups Affected Young children are the primary individuals impacted by lead used in jewelry. Children are primarily exposed to lead from jewelry by placing it in their mouths or by swallowing it. It is considered normal behavior for children, particularly for young children, to place non-food objects such as fingers, toys, and jewelry into their mouths. During this process, lead jewelry can leach lead via oral contact. If ingested, the leaded jewelry can remain within the child for extended periods of time with deleterious effects. In 2003, for example, a 4-year-old child was poisoned after swallowing a pendant from a necklace sold in a toy vending machine. After several weeks of increasingly worsening conditions and incorrect diagnosis as a viral infection and anemia, the charm was found and removed from his stomach. Three days after removal the child’s BLL was 123 μg/dL and more stringent methods were employed to eliminate the lead poisoning. The pendant was subsequently analyzed and found to be 38.8% lead (388,000 ppm). As a result of this poisoning case 1.4 million toy necklaces were recalled (Centers for Disease Control and Prevention 2004). In 2006, another 4-year-old boy from Minnesota swallowed a jewelry charm given as a free gift with the purchase of a pair of children’s sneakers. After extensive testing and incorrect diagnosis, the child’s BLL was test and found to be 180 μg/dL. The child experienced a seizure and

DRAFT
88
subsequently died. The charm was removed after the child’s death and found to consist of 99 % lead by weight (990,000 ppm) (Centers for Disease Control and Prevention 2006). Inexpensive children’s and costume jewelry imported and sold throughout the U.S. often contains substantial amounts of lead. Given the high neurotoxicity of lead to young children, inexpensive jewelry items can pose a potential yet avoidable threat to children’s health. Estimated Quantity From January 1, 2007 through February 14, 2008, the CPSC issued 38 separate product recalls for children’s jewelry and related products that contain lead above existing standards. These 38 individual products amount to 9,949,670 separate items (Centers for Disease Control and Prevention 2008). Assuming Washington has 2% of the national population, this approximates to almost 200,000 separate items in Washington State alone since January 1, 2007 (see Appendix B). New York State has evaluated the levels of lead in children’s jewelry. State representatives purchased various jewelry items marketed toward children and tested them for lead. Although many products contained only small amounts of lead, lead was found in some toys as levels of 90% or greater. Of their 339 samples, 205 (60.47%) tested positive for lead. The products were distributed into 13 broad categories and bracelets, earrings and necklaces were the categories found to be most likely contaminated with lead (Fosmire et al. 2007). If similar numbers can be extrapolated for Washington State, as many as 15-27% of the inexpensive bracelets, earrings and necklaces sold within Washington are also contaminated with lead.
A recent study by Weidenhamer and Clement determined 43% of 139 jewelry items tested for lead exceeded 80% lead by weight. The average lead content for all items tested was 44%. Six of ten samples tested for leachability of lead exceeded the US Consumer Product Safety Commission guidelines of 175 μg accessible lead. This study also demonstrated that the combined lead-tin-copper content of the tested jewelry suggested a solder-based source material. The authors contend that recycled circuit board solders are being used to produce some heavily leaded jewelry that is currently being imported and sold in the US (Weidenhamer and Clement 2007).
End-of-life Most children’s jewelry is likely to be disposed of in a municipal landfill but the amount cannot be estimated because information needed to make such a calculation is not available. Existing Programs/ Regulations Consumer Product Safety Commission (CPSC) The CPSC can take action against a product that contains lead under the Federal Hazardous Substances Act (FHSA), but it must find that the product is a "hazardous substance" as defined

DRAFT
89
in section 2(f) of the FHSA, 15 U.S.C. § 1261(f). For a substance to be considered a hazard under the FHSA, the Commission must be able to demonstrate that:
· Persons are exposed to the substance during customary or reasonably foreseeable handling or use.
· The exposure may cause substantial personal injury or illness.
A product containing a toxic chemical that is not specifically intended for use by children but which creates a risk of substantial personal injury or illness due to customary or reasonably foreseeable handling or use requires precautionary labeling. In August 2008, Congress passed the Consumer Product Safety Improvement Act (CSPIA), which amends the Consumer Product Safety Act. CSPIA established new standards for lead in children’s products and contained language explicitly pre-empting certain state authorities. CPSIA restricts the level of lead in children’s products to 600ppm in February 2009, then 300ppm in August 2009, and then 100ppm in 2011 if feasible. Jewelry is included as a children’s product. The CPSC has an interim enforcement policy for lead in metal in children’s jewelry (U.S. Consumer Product Safety Commission 2005). To avoid exceeding the CDC level of concern of 10 µg/dL, the CPSC determined children should not chronically ingest more than 15 ug of lead per day from consumer products or 175 ug of lead in a short time period. The CPSC further determined that if the lead concentration of any metal jewelry component is less than 600 ppm, it is unlikely that the accessible lead will exceed 175 ug. If the total lead concentration of any component exceeds 600 ppm and the accessible lead from an acid extraction test exceeds 175 ug, then the CPSC can pursue corrective action on a case-by-case basis. The CPSC has urged manufacturers to reduce lead content to products as much as possible and informed them they can avoid enforcement action by ensuring all components contain less than 600 ppm lead. California
California recently enacted the Lead-Containing Jewelry Law (State of California Legislative Council 2007) to limit the amount of lead in jewelry, including children’s jewelry and body piercing jewelry. There are separate standards for children's jewelry, body piercing jewelry, and for all other jewelry (State of California Legislative Council 2007). Briefly, the limits are 600 ppm for lead in metals, printing ink and ceramic glaze and 200 ppm for lead in plastic or rubber.

DRAFT
90
Food and Nutritional Supplements
Background Lead is present in many food and supplement products. Small amounts of lead may be found in environments where food crops are grown and food animals are raised. Its presence is due to naturally occurring sources and human contributions, mainly the use of leaded gasoline and the use of fertilizers and pesticides containing lead (U.S.Department of Health and Human Services, Food and Drug Administration. Center for Food Safety and Applied Nutrition (CFSAN) 2005). A small amount of lead is present in most environments, but foods can become contaminated with additional amounts of lead thereby posing a human health risk. Imported candy and snacks, nutritional supplements and traditional folk remedies are products frequently found having excessive contamination. See table 12 for a list of traditional folk remedies that may contain lead. In the case of some traditional remedies, lead is sometimes intentionally added because it is thought to be useful in treating some ailments (table 12). Certain remedies from Mexico, Saudi Arabia and India are more than 90 percent lead (Centers for Disease Control and Prevention 1983;Centers for Disease Control and Prevention 1983;Centers for Disease Control and Prevention 1983;Centers for Disease Control and Prevention 2004). In most cases, however, lead is present in food and folk medicines because of contamination in the manufacturing process, such as during grinding, in pigments added to the food or packaging, or from the soil remaining on unwashed items. The U.S. FDA measured levels of lead in many common foods and most levels were less than 10 ppb. Of the few items higher than that, the majority contained chocolate or were root vegetables. Calcium supplements frequently contain excessive lead because the primary sources for the supplements are bonemeal, dolomite (U.S. Pharmacopeia (USP) 2003) and fossil oyster shells which all contain lead. The lead occurs naturally in dolomite deposits and living organisms store lead in their bones or shells. Sources of calcium used for nutritional supplements are allowed a maximum lead concentration of 3 ppm (U.S. Pharmacopeia (USP) 2003;U.S. Pharmacopeia (USP) 2003). Lead in candies can be due to packaging using lead-based inks or from contaminated ingredients. Cocoa beans can contaminate chocolate because the drying process of the cocoa beans often exposes the beans to industrial lead aerosols from leaded gasoline (Rankin et al. 2005). Sugar can also be a contributor to the lead concentrations in chocolate. Sweet and salty Mexican style candies sometimes contain significant amounts of chili pepper which are frequently contaminated due to soil residue on the chilies. Tamarind based candies are also a source of concern for the same reason. Another source of lead contamination stems from use of lead solder in food cans. The U.S. canned food industry phased out lead solder in favor of welded cans from 1979-1991. In 1995, the Food and Drug Administration issued a final rule prohibiting the use of lead solder in all food cans, including imported products. Despite this rule, contaminated cans occasionally enter the U.S. market.

DRAFT
91
Studies of lead in game shot with lead ammunition demonstrated the potential health risks for people who consume game. Studies of lead in pectoral muscle tissue in game birds showed high levels of lead in the absence of visible pellets. 21% of the birds had lead tissue concentrations from 5.5 to 3910 ppm, with an average concentration of 211 ppm (Scheuhammer et al. 1998). The traditional Cree diet in Northern Ontario includes game shot with lead ammunition and has been implicated in their high lead levels (Tsuji et al. 2001). Recent studies on bullet fragmentation and lead in game meat are not definitive and work in the field continues. Hunt et al. (Hunt et al. 2006) looked at 38 deer (whole or partial remains) supplied by cooperating licensed hunters in 2002-2004 and found metal fragments broadly distributed along wound channels, as far as 15 cm with an average of 7 cm from the wound. 94% of deer killed with lead-based bullets contained fragments, and 90% of 20 offal piles showed fragments. In 2008, the Minnesota Department of Natural Resources released preliminary findings from a study on fragmentation of bullets used for deer hunting (Cornicelli and Grund 2008). The study used sheep as stand-ins for deer to gather information on fragmentation of different bullets and to help hunters make informed decisions when selecting ammunition. Lead fragments were found as far away as 14 inches from the wound channel. Some bullets did not fragment and the Minnesota Department of Natural Resources has an online presentation (http://www.dnr.state.mn.us/hunting/lead/index.html) of the results that includes pictures of the fragmentation. The study also measured lead in meat samples and found higher levels of lead in animals that were shot with bullets that fragmented the most. Complicating matters is that fact that lead bullet fragments are often too small to be detected by sight, touch or while chewing. Lead was detected in meat further from the wound channel than fragments were detected. Further supporting the health risk is the release in November 2008 of preliminary findings by the U.S. Center for Disease Control (CDC) and the North Dakota Department of Health (North Dakota 2009;Iqbal 2008). The study surveyed blood lead levels in 740 residents of North Dakota. The study included 7 children between 2 and 5 years old and 12 children between 6 and 14 years old. The analysis showed people who ate wild game harvested with lead ammunition had statistically significantly higher blood lead levels compared to people who did not eat wild game (Iqbal 2008). The authors controlled for other known risk factors for elevated blood lead levels, such as age of housing, income level, occupation, and other hobbies. Participants in the study had blood lead levels that ranged from not detectable (less than 0.25 ug/dL) to 9.82 ug/dL. The study also concluded that people who ate more game or ate game more recently had higher blood lead levels. Nobody in the study had a blood lead level over the CDC level of concern of 10 ug/dL and all participants had blood lead levels lower than the national average. The Minnesota Department of Natural Resources, the North Dakota Department of Health and the CDC recommend that hunters take this new information into consideration when they are choosing ammunition and processing game and to be particularly careful for pregnant women and children under the age of 6. Alternatives Alternatives are not applicable to contaminated products, but there are ways of reducing the lead contamination. For example, the use of non-toxic ammunition or bullets that fragment less would

DRAFT
92
reduce lead in game. More information on ammunition is presented later in this chapter in the section on hunting and fishing. The FDA set the limit of 0.1 ppm lead in candy based on good manufacturing processes such as washing chili peppers to remove lead contaminated soil before drying. Groups Affected Everyone can be affected by lead in food products, especially consumers of traditional medicines, imported foods, and game shot with lead ammunition. Estimated Quantity According to FDA, children from 6-11 months receive, on a daily basis, an average of 4.1 micrograms of lead from food, and children from 12 months to 2 years receive on a daily basis an average of 5.3 micrograms of lead from food. In 1998, in the course of conducting its Market Basket Survey, the FDA found jars of baby food that contained 20-22 micrograms of lead per 4-ounce jar. The jars were recalled by the USDA (U.S. Department of Agriculture, Food Safety and Inspection Service 1998). Some calcium supplements have been found to contain approximately 3 µg Pb/day- more than half this maximum value. These values are based on a recommended adult daily dosage of 1 g calcium. The recommended daily dosage of calcium for children 1-3 and 4-8 years of age is 500 and 800 mg, respectively; recommendations for older adults range from 1,000 to 1,300 mg calcium (Scelfo and Flegal 2000). End of Life No specific estimates are available for food and nutritional supplements. Existing Programs/ Regulations Food safety is overseen by the FDA and the USDA
· The FDA’s recommended maximum level of lead in candy likely to be consumed frequently by small children is 0.1 ppm.
· The FDA has banned the use of lead-soldered food cans. · FDA toxicologists have set provisional total tolerable intake levels (PTTILs) of lead from
all sources at 75 µg per day for adults, 25 µg per day for pregnant women and 6 µg per day for infants and children up to 6 years. For every microgram per day of lead intake, blood lead levels increase 0.16 micrograms per deciliter of blood in children and 0.04 micrograms per deciliter of blood in adults (Foulke 1993;U.S. Food and Drug Administration 1993).
· The U.S. Pharmacopeia has set a maximum allowable lead level in calcium used for supplements at 3 ppm in their Food Chemicals Codex (U.S. Pharmacopeia (USP) 2003).

DRAFT
93
California In the state of California, calcium supplements are required to contain < 1.5 µg Pb/g Ca for adults. Table 12- Traditional Remedies Reported to Contain Lead (New South Wales lead reference centre 2001) Name Region of origin Lead level Medicinal use Albayalde or albayaidle
Mexico and Central America
93% Empacho (vomiting, colic), apathy and lethargy
Alarcon, azaracon Coral, luiga, maria luisa, rueda (red orange powder)
Mexico and Central America
95% Empacho (vomiting, colic), apathy and lethargy
Alkohl Middle East 85% Topical medical preparation; applied to umbilical stump
Al Murrah Saudi Arabia NA Colic, stomach aches, diarrhea Anzroot Middle East NA Gastroenteritis Ba Bow Sen China 1000 mg/kg Hyperactivity and nightmares in
children Bali goli Asia/India NA Stomach ache Bint al dahab, bint or bent dahab
Oman, Saudi Arabia, India
98% Diarrhea, colic, constipation, and general neonatal use
Bokhoor (and noqd) Saudi Arabia NA Wood and lead sulfide burned on charcoal to produce pleasant fumes and calm infants
Cebagin Middle East 51% Teething powder Chuifong tokuwan Asia/India NA NA Cordyceps China 414-20,000
mg/kg Herbal medicine treatment for hypertension, diabetes, bleeding
Deshi Dewa Asia, India 12% Fertility pill Farouk Saudi Arabia NA Teething powder Ghasard (brown powder)
India 2% Given as tonic
Greta (yellow powder) Mexico 97% Empacho (vomiting, colic), apathy and lethargy
Hai Ge Fen Henna Middle East NA hair and skin dye Herbal medicines (eg Poying Tan)
China 7.5 mg per dose
general

DRAFT
94
Name Region of origin Lead level Medicinal use Kandu (red powder) Asia/India NA Stomach ache Kohl, surma and Saoott
Africa, Asia, India, Pakistan, middle East
up to 86% Cosmetic; astringent for eye injuries and umbilical sump, teething powder
Kushta India/Pakistan 73% Diseases of the heart, brain, liver, and stomach. Aphrodisiac, tonic
Pay-loo-ah Laos (Hmong) 90% High fever, rash "Santrinj" Saudi Arabia NA Teething powder Unknown India, Pakistan, Sri
Lanka, Burma, Bhutan, Mongolia, Tibet
1.35-72,990 mg/kg per
capsule, 3%
Metal-mineral tonic, slows development

DRAFT
95
Cosmetics and Personal Care Products Background Few cosmetics and personal care items have intentionally added lead. However, lead acetate is a color additive approved by the FDA for use in cosmetics, but not around the eyes or mouth, and is found in progressive hair dyes, such as Grecian Formula, at less than 0.6% by weight. There is a required warning label for hair dyes with lead acetate. Traditional cosmetics, such as kohl may contain up to 50% lead (U.S. Food and Drug Administration 2003). Kohl is not legal as a color additive for cosmetics or food in the U.S. True henna is from a plant and may not legally contain more than 20ppm lead. It is only legal as a hair dye, and not for skin application. Compound hennas mix henna with metallic salts, such as lead acetate, to achieve different colors. Although the FDA has approved a number of color additives for use in cosmetics, none is approved for injection into the skin. Many pigments used in tattoo inks are not approved for skin contact at all, but are industrial grade colors that are suitable for printers' ink or automobile paint. Specifically, green tattoo ink sometimes contains lead (The Campaign for Safe Cosmetics 2007). Some cosmetics and other personal care items contain lead as a contaminant. Many FDA approved additives have a limit of 20 ppm lead. Lead is sometimes found as a contaminant with zinc, and has been found in medicated body powders at up to 3 ppm (Center for Environmental Health 1999), even though the FDA limits lead in zinc oxide to 20 ppm. The Campaign for Safe Cosmetics recently released a study on lead in lipstick, in which they found lipsticks containing 0.03 to 0.65 ppm lead (The Campaign for Safe Cosmetics 2007). Alternatives Alternatives are not applicable to contaminated products, but there are ways of reducing the lead contamination by sourcing ingredients that do not contain more than the FDA defined trace amounts of lead. There are alternatives to lead acetate for hair dyes that are used in Canada and Europe, which do not allow lead acetate. Groups Affected Most cosmetic use is by adults, but some children use cosmetics and other personal care items. Children also have exposure from adult use, such as when a child touches an adult’s dyed hair. Estimated Quantity One published survey indicates 24% of adults in the U.S. have tattoos (Laumann 2006), but there is no estimate of how many may contain lead in the pigment.

DRAFT
96
End of Life No specific estimates are available for cosmetics and personal care products. Existing Programs/ Regulations FDA All cosmetics additives must be approved by the FDA. The FDA considers tattoo inks, including permanent makeup, to be cosmetics and considers the pigments used in the inks to be color additives requiring pre-market approval under the Federal Food, Drug, and Cosmetic Act. However, because of other public health priorities, the FDA has not traditionally regulated tattoo inks or the pigments used in them. Campaign for Safe Cosmetics This group is working to educate customers and convince industry to remove lead from cosmetics. They also maintain a database of ingredients in cosmetics at http://www.cosmeticdatabase.com, which includes safety and regulatory information about each ingredient.

DRAFT
97
Art Supplies Background Lead compounds are commonly used as a pigment in paints, ceramic glazes and inks. Lead also functions to shorten the dry time in paint, changes the refractive quality in paint mediums and glazes and increases the durability of the medium containing it. Flake white is an oil color which was traditionally used to prepare an oil canvases. Some artists insist on continuing its use because of the durability, fast drying time and non-absorbance (Mayer 1979). Because of this, flake white was exempted from the ban on lead in paint under the U. S. Consumer Product Safety Act. However, it still must be labeled with health, cautionary and safe use information. Inks containing lead can contaminate printed materials used for children’s art projects, such as papier-mâché (California Office of Environmental Health Hazard Assessment 2007).
The use of lead pigments is thought to be the cause of high lead levels in some crayons. High levels of lead in crayons in 1994 were discovered as the source of an elevated blood lead level in an infant in Arizona (Centers for Disease Control and Prevention 1994).
Alternatives Art supplies that do not contain lead are widely available. Some adult artists feel that lead is necessary, but those products contain warning labels and are not suitable for others. Groups Affected Children, who may be exposed to lead through normal hand-to-mouth activity, are the primary group affected by lead in art supplies. They often place toys, fingers, and other objects in their mouth, exposing themselves to lead paint or dust. Children sometimes eat art supplies, such as crayons. Artists and art students, including college students, may be unaware of the dangers associated with the supplies, despite labeling requirements. Estimated Quantity Unknown End of Life No specific estimates are available for art supplies. Existing Programs/ Regulations There are existing labels for art materials that are intended for use in the household or by children. CPSC regulates art materials under the 1988 Labeling of Hazardous Art Materials Act (LHAMA), which amended the Federal Hazardous Substances Act (FHSA) and applies to products sold after Nov. 18, 1990. Manufacturers are expected to test and label products. Art

DRAFT
98
materials should be labeled as “conforms to ASTM D4236.” There are also warning labels, so hazardous substances may still be present, if they are properly labeled. Under LHAMA schools are not allowed to give children in grades six and younger art supplies that are labeled with a chronic-hazard warning label. There is also a voluntary, industry supported label from the Art and Craft Materials Institute in Boston (ACMI). ACMI reviews the materials and ascertains that the product is reasonably safe and properly labeled, but does not perform tests. ACMI then allows products to be labeled with AP (approved product) or CL (cautionary label) for a product with properly labeled hazardous ingredients. There are no child products with the CL label. While the ACMI does not prohibit all toxic chemicals, it does prohibit lead in approved products.

DRAFT
99
Vinyl Products Background Polyvinyl chloride is a polymer manufactured by linking multiple vinyl chloride (U.S. Consumer Product Safety Commission 1997) monomers into a long chain. A vinyl chloride monomer consists of two carbon, three hydrogen and one chloride atoms with the following structure:
Figure 8- Vinyl Chloride Monomer In order to produce PVC, as many as 5,000 to 10,000 VC monomers link together. PVC, therefore, has the following structure:
Figure 9- Vinyl Chloride Polymer (PVC) R indicates the linkage continues on for 5,000 or more VC monomers. Pure PVC is 57% chlorine, 38% carbon, 5% hydrogen and exists as a resin. Stabilizers, plasticizers, lubricants, colorants and other constituents are added to the resin to make a wide variety of products. Metals such as lead, cadmium, tin, calcium, barium, and zinc are added to vinyl for stabilization and/or coloring. Stabilizers control degradation in both the manufacturing process and in finished products. PVC is used in many products, with the largest uses in plumbing and siding. It is also used in toys, clothing (such as vinyl appliqués), window mini-blinds, flooring, shower curtains, packaging, and many other plastic consumer products. Plastics labeled with a “3” are usually PVC.
C
H
H
C
H
Cl
C
H
H
C
H
Cl
C
H
H
C
H
Cl
[ ]R

DRAFT
100
In the U.S., lead is not commonly used in PVC production. However, a wide range of PVC products are imported into the U.S. and many have been found to contain lead. Lead stabilizers continue to be used in the U.S. in wire cable insulation and jacketing where some producers believe superior electrical properties and outstanding long-term heat stability are needed. Lead has excellent electrical and water resistance. Wire cable insulation and jacketing is 4% of the PVC uses in the U.S. and Canada. The typical amount of lead in PVC used for wire and cable is 2.8% (28,000 ppm) by weight (The Vinyl Institute Stewardship Committee, 2007). Lead-free cables for use in electrical applications are available from other manufacturers and there is an on-going international effort to produce PVC cables which have less impact upon human health and the environment (Nakayama et al. 1999). Wire and cable scrap cannot be recycled into more PVC cable insulation and jacketing, but must be used in less critical applications. Frequently these materials are used to make items such as garden hoses. Therefore, most garden hoses contain lead and are labeled as not safe for drinking water. Consumer Reports measured lead in vinyl garden hoses and found lead leaches into the water from the hose (Lovejoy 2007). Some artificial Christmas trees are made of PVC and there is the potential for health risks from lead in the PVC. Maas et al. (Maas et al. 2004) found that older trees had detectable levels of lead and higher levels of lead were found in dust beneath those trees. These results suggest that artificial Christmas trees, especially newer ones, are not likely to be a significant source of lead, but some trees may present a risk for young children. Alternatives Other metals such as tin, zinc, calcium and barium, either alone or in combination can be used as a stabilizer for PVC. Calcium and zinc stabilizers are mainly used in food and medical applications because of their less toxic properties. Zinc, however, does present some aquatic toxicity concerns. The main obstacle to the use of lead-free PVC is cost. Alternatives are often more expensive. Some concerns have been raised because alternatives to lead are sometimes less easy to use and can cause manufacturing problems. However, alternatives are readily available. Groups Affected Three groups are affected by the use of lead in PVC:
· PVC manufacturers and other manufacturers who use PVC. · Recyclers of PVC or electronic equipment in which PVC was used. · Consumers, especially children and pets who have contact with vinyl products that
contain lead. These three groups are not completely separate as crossover occurs. For example, lead has been shown to be brought into the home by workers in manufacturing and other industries associated with lead. Children in the home are thus contaminated by sources other than products used directly in the home.

DRAFT
101
Estimated Quantity Estimates of lead used as a heat stabilizer in vinyl applications in the U.S. range from 7,000 to 11,000 metric tons per year (The Vinyl Institute Stewardship Committee 2007). Although lead use is limited to a small segment of the vinyl market, it accounts for relatively high percentage of total metals used to stabilize vinyl products. An unknown amount of lead pigments are also used in vinyl. The use of lead pigments has decreased in the vinyl industry (The Vinyl Institute Stewardship Committee, 2007). Lead in PVC, however, continues to be an issue, particularly for imported products. The amounts of lead used in products remains unknown as there are no reporting requirements for lead use, the amount of lead in specific products or the number of these products sold in the United States. End-of-Life No specific estimates are available for vinyl products. Existing Programs/ Regulations CPSC In August 2008, Congress passed the Consumer Product Safety Improvement Act (CSPIA) 5b, which amends the Consumer Product Safety Act. CSPIA established new standards for lead in children’s products and contained language explicitly pre-empting certain state authorities. CPSIA restricts the level of lead in children’s products to 600ppm in February 2009, then 300ppm in August 2009, and then 100ppm in 2011 if feasible. The Commission can take action against a product that contains lead under the Federal Hazardous Substances Act (FHSA), but it must find that the product is a "hazardous substance" as defined in section 2(f) of the FHSA, 15 U.S.C. § 1261(f). For a substance to be considered a hazard under the FHSA, the Commission must be able to demonstrate both that:
· Persons are exposed to the substance during customary or reasonably foreseeable handling or use.
· The exposure may cause substantial personal injury or illness.
A product containing a toxic chemical that is not specifically intended for use by children but which creates a risk of substantial personal injury or illness due to customary or reasonably foreseeable handling or use requires precautionary labeling. The CPSC requests manufacturers to eliminate the use of lead that is accessible in children’s products and the CPSC evaluates products on a case-by-case basis to determine if the product is a hazard. The Commission also recommends that, before purchasing products for resale, importers, distributors, and retailers obtain assurances from manufacturers that those products do not contain lead that may be accessible to children.

DRAFT
102
The Commission uses the blood lead level of 10 mg/dL as a threshold level of concern. To avoid exceeding that level the Commission determined young children should not chronically ingest more than 15 micrograms (mg) of lead per day from consumer products (U.S. Consumer Product Safety Commission 2005). Imported non-glossy vinyl mini-blinds
In 1996 the CPSC determined that lead accumulated in large amounts as accessible dust on the surface of vinyl mini-blinds. Lead was used as a stabilizer and was abraded or released from the mini-blinds forming lead-contaminated dust. CPSC asked the Window Covering Safety Council, which represents the industry, to immediately change the way vinyl mini-blinds are produced by removing lead stabilizers from the plastic used during manufacture. U.S. manufacturers have made this change. Vinyl importers requested that CPSC provide a guidance limit which could be used to specify the minimum amount of lead allowed in their manufacturing process. The CPSC determined that a limit of 0.02% lead (200 ppm) was an appropriate limit based on the amount of lead dust found on different mini-blinds and normal hand-to-mouth behavior in children, but also indicated:
‘…that with no lead intentionally added and good manufacturing practices followed, much lower lead levels are technologically feasible. Staff urges the industry to achieve the lowest technologically feasible level of lead, since any lead to which a child is exposed adds to their body burden.’
The voluntary 0.02% limit has been in effect since 1996 (U.S. Consumer Product Safety Commission 1996).
Children’s Products
In 1997, Greenpeace published a report identifying high levels of lead and cadmium in children’s products. Greenpeace purchased 131 children’s products including backpacks, toys, umbrella, placemats, purses, etc. from leading retailers in the U.S. and tested them for total lead. They found 28 of the 131 products (21.4%) ‘…contained from 100 to over 22,000 parts-per-million (ppm) lead.’ The investigation was expanded to test the same products being sold in California and a further 19 items were tested. 17 of these 19 exceeded CPSC staff-recommended limits. Greenpeace conducted further testing including ‘aging’ products to determine if the lead released from the products increased with age. The products were tested at independent laboratories and lead was found to be released from these products at levels of concern (DiGangi 1997). Based upon this discovery, CPSC staff collected and tested a number of children's plastic products that they believed might be repeatedly exposed to sunlight and heat as with the vinyl mini-blinds. The children's products collected and tested included wading pools, riding toys, basketball hoops, slides, and character toys. Testing revealed that many of these items were not made of PVC, but rather other types of plastic that do not contain lead. In those items that contained PVC and were found to contain total lead above 200 ppm, CPSC staff conducted further testing to determine if the lead would leach from the product and impact

DRAFT
103
children. This evaluation was done either by wiping the PVC surface and analyzing the wipes to determine how much lead would leach from the product or by conducting an extraction study. Based upon these results, the CPSC determined that lead present in these products did not pose a risk to children (U.S. Consumer Product Safety Commission 1997).
Lunchboxes Starting in 2004, several environmental groups tested vinyl lunch boxes for the presence of lead. In 2005 the CPSC also tested 60 lunch boxes and determined the levels of accessible lead do not present a health hazard. During the same period, Ecology sampled 20 lunch boxes and found unacceptable total lead levels in only 3 of the 20. One in particular, a lunch box given away as a gift, was found to contain 22,000 ppm (2.2%) total lead. Of those lunchboxes purchased on the open market, only two had total lead levels above 100 ppm. Ecology found that the amount of lead reported depended greatly upon the type of test conducted. Highest levels were found for total lead analyses, lower levels for leachable lead and the lowest levels were found using the wipe test used by the CPSC. In 2006, the U.S. Food and Drug Administration (FDA) sent a letter to all manufacturers of vinyl lunchboxes urging ‘….companies to refrain from marketing such lead-containing lunchboxes.’ The FDA used as the basis for its recommendation its ‘…longstanding objective of the FDA to reduce, to the extent practicable, consumer exposure to lead from foods. The adverse health effects of elevated lead levels in children are well-documented and may have long-lasting or permanent consequences’ (U.S. Food and Drug Administration 2006).
Center for Environmental Health (CEH)
The CEH is a non-profit organization, based in California, which works to hold corporations accountable for their use of toxic chemicals that endanger public health. The CEH tested numerous lunch boxes for total lead, mostly in 2005 and 2006. Seventeen lunchboxes contained total lead above the 600 ppm limit. One lunchbox consisted of 5.6% (56,400 ppm) lead. The CEH worked with manufacturers and retailers to make available lunch boxes that are lead-free (Center for Environmental Health 2006).
Bibs
In 2007 the CPSC warned that there is a potential risk of lead exposure from baby bibs with cracked or peeling vinyl surfaces. These concerns arose after an environmental group tested bibs for sale at WalMart and found high levels of total lead in the bib. CPSC recommended that parents and caregivers discard bibs that are in poor condition to avoid any potential exposure to lead from swallowed vinyl. CPSC tested 40 vinyl bibs and found lead content of 0-0.688% (6,880 ppm). The mean lead content was 0.087% (870 ppm). 53.5% of the samples had a total lead value of less than 0.01% (100 ppm). CPSC also evaluated accessible lead, simulating hand-to-mouth contact, mouthing and ingesting (U.S. Consumer Product Safety Commission 2007).

DRAFT
104
Based on these results, the CPSC determined no recall of baby bibs was warranted. It did, however, caution consumers to discard older bibs which were cracked or peeling as they did pose a threat to a baby’s health. The warning states ‘Pieces of vinyl containing lead could pose a hazard to infants if they are swallowed. CPSC staff recommends that parents and caregivers discard bibs that are in poor condition to avoid any potential exposure to lead from swallowed vinyl.’ (U.S. Consumer Product Safety Commission 2007).
Pipe
Personal communication with U.S. manufacturers of PVC pipe indicated that they do not intentionally add lead as a stabilizer. NSF International states on their website that they are:
‘....a not-for-profit, non-governmental organization...(and)…world leader in standards development, product certification, education, and risk management for public health and safety.’
NSF certifies pipes and other devices used to provide drinking water. Products obtaining their certification are analyzed using NSF/ANSI Standard 61. Standard 61 subjects components to a leaching test using two specially formulated solutions at pH 5 and 10. The results of these tests are compared with the federal standard of 15 ppb lead. Any products which does not leach lead above the permissible limit are certified as meeting federal requirements (leaded brass in plumbing will be addressed separately in this chapter).
It is important to note that the NSF Standard 61 is based upon lead leaching from products and not upon total lead content. Therefore products which contain but do not leach lead could pass this certification process. NSF states on their website, however:
‘A recent survey of products submitted to NSF for evaluation under Standard 61 shows that 89 percent of all metal parts in valves and water meters contain less than 3.7% lead, and two-thirds contain less than 0.5% lead.’ (NSF International 2008)
This statement is limited only to valves and water meters and indicates that 11% of products certified by this process contain more than 3.7% lead. In 2006, the Government Accountability Office of the Federal Government conducted a review of EPA’s efforts to implement the Clean Water Act of 1988. The GAO recommended that EPA should strengthen its efforts to protect consumers from lead contamination via drinking water systems. As part of this report, the GAO also indicated that ‘…NSF’s testing protocol for lead leaching may not accurately reflect actual conditions and may need to be modified.’ GAO further indicated that because of problems like this ‘Some of the products that are not covered by the voluntary leaching standard have been found to contribute high levels of lead to drink water during testing.’ NSF is aware of these concerns and is taking action to address them (U.S. Government Accountability Office 2006).

DRAFT
105
Siding
The Vinyl Siding Institute (VSI), a trade association of vinyl and other polymeric siding manufacturers, was created to address issues associated with vinyl siding. In 1998, VSI initiated a certification program. In order for a vinyl siding to be certified, it must meet the requirements of ASTM International Method D3679 which prohibits the intentional use of lead in vinyl siding. VSI believes that certified vinyl siding accounts for approximately 96% of the vinyl siding sold in the U.S. (Dobson 2006).
Window and door profiles
The American Architectural Manufacturers Association Window and Door Profile Certification Program prohibits participating companies from adding lead to profiles for windows and doors sold for installation in the U.S. The limit is 0.02% lead by weight. About 85% of the doors and window profiles sold in the U.S. are certified, but more are likely to use a non-lead stabilizer (The Vinyl Institute Stewardship Committee 2007) .

DRAFT
106
Fishing, Hunting, and Shooting Background Lead is used in fishing tackle because of its density, malleability, and resistance to corrosion. Lead is used for ammunition because the density and hardness of lead give desirable ballistic properties. The properties are controlled by adding antimony, forming lead-antimony alloys of 99.8% lead and 0.2% antimony in lead shot (Seely 2007). There are many different types of ammunition that have traditionally contained lead. Shotguns shoot shotshells with either pellets or a slug propelled by centerfire primer and powder. Rifles and handguns use cartridges that have a bullet with gunpowder and either centerfire primer (in the center) or rimfire primer (in the rim). Lead styphnate is an unstable primary explosive that resists shock but will detonate readily from heat or static electricity. Traditionally it was used to ignite gun powder in bullets. It was also commonly used to initiate the inflation of airbags, but this use has been phased out in favor of a less toxic substitute. Alternatives Alternatives to leaded fishing tackle include natural stone, ceramic, tin, bismuth, steel, and tungsten-nickel alloy fishing sinkers and jigs. Some alternatives are denser than lead. Many types of ammunition are available in non-lead versions, but non-lead alternatives for bullets and some gauges of shotguns are currently limited. Non-toxic shot is required for all waterfowl hunting in the U. S. as well as other game bird hunting in designated areas in Washington. Almost all modern shotguns can safely shoot steel shot. Other alternatives can be safely used in shotguns that cannot shoot steel shot. Currently available nontoxic shot products are made with steel, tungsten, tungsten-iron, tungsten-iron-nickel and tungsten polymers, bismuth and tin. Generally, lighter pellets (e.g. steel shot) will exhibit faster initial velocities, while more quickly losing retained energy as the distance to the target increases (Washington Department of Fish and Wildlife 2001). While ballistics are different between lead and non-toxic shot, non-toxic shot is appropriate for use in many cases. Because of the increased hardness of steel shot compared to lead shot, there is the potential for damage to some older shotguns with tightly-constricted chokes or certain types of barrels. Hunters have been advised by WDFW to check with the manufacturer if they are concerned with the effects of non-toxic shot on their shotguns. Some products, such as those sold by Ecotungsten, reportedly do not scratch barrels. One argument against steel shot has been that hunters were more likely to wound birds, thereby exceeding losses to lead poisoning. Numerous studies have shown that there is no significant difference between wounding rates for steel or lead (Scheuhammer and Norris 1995). Schulz et al. (Schulz et al. 2008) looked at national, hunter reported crippling rates for waterfowl before, during and after the phase in of nontoxic shot and found a decline in crippling rates once the use of nontoxic shot was completely phased in for hunting waterfowl.

DRAFT
107
There are alternatives for some, but not all, types and uses of ammunition. For example, there are copper expanding nose bullets that are very effective for hunting. In Arizona 93% of deer hunters in the California condor range that have switched to copper bullets and reports that they perform as well or better than lead bullets. Law enforcement, military, and corrections officers are required to practice with ammunition that has the same ballistics as the ammunition that would be used in the field. For example, the Washington Corrections Center near Shelton has switched to lead-free ammunition for some weapons at their shooting range, but they were unable to use lead-free shot (personal communication). New heavy-metal-free primers use the compound DDNT (diazo dinitro phenol), commonly known as Dinol to replace lead styphnate as the initiator. It behaves very differently requiring some changes in manufacture and technique on the part of the sportsman. In addition, non lead primer has a shorter shelf life. Groups Affected The primary groups affected are hunters, people who eat game, shooters, military and law enforcement officers. Wildlife can also be impacted (see section on wildlife health effects). High blood lead levels can be found in people who smelt lead, and sportspersons who cast their own ammunition or fishing weights. These people, as well as their family members, have a higher risk of lead exposure. EPA strongly advises against home manufacturing of lead sinkers and jigs (http://www.epa.gov/owow/fish/humans.html). Indoor firing ranges present an exposure to the employees due to the lead dust, especially when dry sweeping (see section on Occupational Exposures). According to the U.S. Fish and Wildlife Service, there are approximately 764,000 Washington State residents over the age of 16 who hunt or fish, which is 15% of the population over the age of 16 (U.S. Department of Interior, Fish and Wildlife Service 2006). The same survey on sportspersons indicates 577,000 who only fished, 74,000 who only hunted, and 113,000 who both fished and hunted. WDFW data on license sales shows 786,940 fishing licenses for 2005, though not all fishing requires a license. There are some risks for people who consume game. Studies demonstrate that cutting meat away from visible wound sites and removing obvious metal fragments is not sufficient to prevent lead contamination (North Dakota 2009;Scheuhammer et al. 1998;Tsuji et al. 2001). More about lead in game meat is discussed in the section on lead in food. Government agencies that have reviewed the existing data and conducted new studies, such as the Minnesota Department of Natural Resources, the North Dakota Department of Health and the CDC, recommend that hunters take this new information into consideration when they are choosing ammunition and processing game and to be particularly careful for pregnant women and children under the age of six.

DRAFT
108
Estimated Quantity For fishing weights and ammunition the estimated quantity used each year is connected to the amount disposed. End-of-Life Fishing Weights An estimated 48 to 80 tons of fishing weights are lost annually in Washington. The first estimate, shown in Table 13, from Sheuhammer used EPA estimates for the amount of money spent on fishing weights, while the second estimate used EPA estimates for number of sinkers produced (Scheuhammer et al. 2003). It is assumed that the number of weights purchased is equivalent to the number of weights lost. The EPA estimate is only for lead sinkers smaller than 2 cm (U.S. Environmental Protection Agency 1994). The Nussman estimate is from a U. S. sport fishing industry position paper on lead fishing sinkers that was in another reference. The Ecology estimate is based on the number of fishing licenses in Washington and estimates 30% are fly fishermen, and each angler loses 4 ounces of lead per year. Table 13- Estimates of Lead Fishing Weights Used/Lost in Washington
Ammunition Table 14 below shows a range of estimates for how much lead shot or total ammunition is used in Washington State each year, from 40 to 1226 metric tons. Ecology believes 550 metric tons is the best estimate for how much lead shot is used in Washington, because the other estimates rely on national data, are underestimates, or are for all ammunition. Federal taxes on ammunition and firearms are tracked providing one source of data on how much of these products are sold in each state (Tobacco Tax and Trade Bureau (TTB) data by personal communication). For the estimations using TTB data, Ecology assumed that 25% of the revenue
Study
U.S. Weights Sold/Lost Annually
(Metric Tons)
Basis Of Estimate
Washington State Weights Lost Annually (Metric Tons)
Canadian Wildlife Service, Sheuhammer 2003 3977 $87.5 million /
$0.022/g 80
Canadian Wildlife Service, Sheuhammer 2003 2600 480 million sinkers x
5.4 g/sinker 52
EPA, 1994. 2385 450 mil. sinkers x 5.3g/sinker 48
Nussman, M 1994. 2700 Report unavailable 54
Ecology 550,858 anglers x 4 ounces 63

DRAFT
109
is for ammunition. This percentage is based on the USFWS data on amounts that hunters spend on ammunition compared to rifles and shotguns (U.S. Department of Interior, Fish and Wildlife Service 2006). The first estimate of 40 tons is based on tax revenue paid by retailers in Washington, and does not include retailers who have regional distribution centers, so will underestimate sales in Washington. The second estimate of 520 metric tons is simply 2% of the national total for all ammunition. The estimates from the excise tax include all ammunition, an unknown portion of which is lead. TTB was not able to provide a breakdown by type of metal or type of ammunition. We have also estimated the amount of lead shot that is used for hunting upland birds and other small game in Washington. The estimate of 85 metric tons is based on the number of animals in the WDFW 2006 Small Game Harvest Report and assumes an average of 6 shots per animal (U.S. Fish and Wildlife Service 1986;Washington Department of Fish and Wildlife 2001). This estimate assumes that hunters use lead shot where they are allowed to. We have no way of estimating how many hunters use non-toxic shot in areas that allow lead shot. The estimate of 556 metric tons comes from an estimate provided by several agencies on expected revenue for a proposed tax on lead shot for hunting and other shooting (Washington Department of Fish and Wildlife 2005). The fiscal estimate used information from WDFW small game harvest reports and other information on trap and target shooting from a sportsman club and industry to estimate current use. Based on the expected tax revenue, Ecology calculated 556 metric tons of lead shot are sold. The Minnesota Pollution Control Agency estimated the amount of lead shot deposited annually in their state at 1184 metric tons (Minnesota Pollution Control Agency 1999). Their estimate used information from a commercial association, the Lead Industries of America, which said 3.7% of lead use in the U.S. is for sporting ammunition. Minnesota has slightly less than 2% of the U.S. population, while Washington has slightly more than 2% of the U.S. population, so both states estimate their share at 2%. This estimate is for all sporting ammunition, and not just lead shot. 2005 USGS records indicate 61.3 thousand metric tons of lead used for ammunition in the U.S. (U.S. Geological Survey 2007). Since Washington is 2% of the U. S. population, Ecology estimated total lead ammunition use at 1226 metric tons each year. The USGS estimate is for lead in ammunition and does not break down the data by type of ammunition (shot, bullets, etc.). We requested further details, but the USGS was not able to provide a breakdown by type of ammunition (personal communication), so this estimate is for all ammunition. The estimates from the WDFW seem to be the best estimates of lead shot use in Washington for hunting and other recreational uses, since they were specifically done for Washington State. None of the estimates take into account the recycling that is done at some ranges. We did not estimate how much lead is recycled because we had no credible sources of information on this activity. Recycling of spent lead ammunition will decrease the estimate of how much is released to the environment. The estimates also do not take into account people making and using their own ammunition. Again, we did not have credible sources of information to estimate how much additional lead is used in homemade ammunition.

DRAFT
110
Table 14- Estimates of Lead Ammunition Used in Washington
Popular shooting areas may accumulate large amounts of lead. Washington has many such areas including indoor ranges and outdoor ranges; ranges open to the public, law enforcement and military ranges; and informal shooting areas on both public and private land. WDFW has identified 165 non law-enforcement or military ranges in Washington, although 27 seem to be only archery (Washington Department of Fish and Wildlife 2004). The number of informal shooting areas is unknown, but areas such as rock pits are often used for their backstop walls. Existing Programs/ Regulations Several countries and U.S. states have passed laws limiting the use of lead ammunition and fishing tackle. Federal Several national areas, such as Yellowstone National Park, require nontoxic fishing tackle. Lead shot has been prohibited for all waterfowl hunting since a nationwide phase-in of non-toxic shot was implemented in 1986-1991. State New Hampshire prohibits the use and Maine prohibits the sale of small lead fishing tackle (Michael 2006). In Massachusetts, lead fishing weights are banned on two large reservoirs; the Wachusett and Quabbin (State of Massachusetts 2000). There may be other state regulations that restrict the use of lead fishing weights. Washington In Washington State, lead shot has been prohibited for all waterfowl, coot and snipe hunting since a nationwide phase-in of non-toxic shot was implemented in 1986-1991. Amendments to WAC 232-12-068 in April 2000 expanded nontoxic shot requirements for hunting of all species to 10 pheasant release sites and other areas, based on a high potential for ingestion of lead by wildlife (Washington Department of Fish and Wildlife 2001). WDFW continues to monitor the use of lead shot for hunting to determine if harm has occurred to an animal population or if there
Source U.S.
(metric tons) WA
(metric tons) WA tax revenue for all ammunition (TTB) 40 WA portion of national tax revenue for all ammunition (TTB) 26,000 520 WA non waterfowl hunting 85 WDFW estimate for lead shot 556 Minnesota MPCA 59,200 1184 USGS estimate for ammunition 61,300 1226

DRAFT
111
is a high potential for ingestion of lead by wildlife. On private lands WDFW only regulates hunting. Not all uses of lead shot are under the jurisdiction of WDFW, such as lead shot used for target practice. On WDFW lands, WDFW requires non-toxic shot for all uses in certain areas (primarily areas with extensive wetlands). On these areas it is unlawful to possess lead shot for any purpose. California California Governor Arnold Schwarzenegger on October 13, 2007 signed into law the Ridley-Tree Condor Preservation Act to ban hunting with lead ammunition in habitat used by endangered California condors (Ridley-Tree Condor Preservation Act 2007). Arizona Arizona used education and outreach approaches to voluntarily phase out the use of lead ammunition in the range of their population of California condors. The Arizona Fish and Game Department initiated a public education campaign, including a program to provide non-lead ammunition for free during the 2005 and 2006 big game hunting seasons. Lead reduction efforts were intensified in 2007 and resulted in 60% of hunters of big game using non-lead bullets and 20% of hunters of big game continuing to use lead bullets, but removing lead-contaminated gut piles (Sieg et al. 2008).

DRAFT
112
General and Electronic Uses of Solder Background Lead solder is a metallic compound that has been used in a variety of industries including food processing (to seal cans), plumbing and water distribution (to link pipes together) and electronics (to connect wires to printed circuit boards). Lead solder was used for a variety of reasons including its resistance to corrosion, its ease of use and special chemical properties. While lead is no longer used to solder food cans in the U.S., it is still used in other countries. Since 1988, solder that has lead content over 0.2 percent (2,000 ppm) cannot be used for joints or fittings in any private or public drinking water system (U.S. Environmental Protection Agency 1998). Lead solder is used in the assembly of electronics to provide the final surface finish for printed wiring boards, applied to component leads to achieve a compatible solderable surface, and attached to electronic components on printed wiring boards. Lead solder is inexpensive relative to other alloys and performs reliably under a variety of operating conditions. In addition, it possesses unique characteristics such as low melting point, reflow properties, and the relative ductility of the solder joints formed (Geibig and Socolof 2005). Alternatives
Lead-free solder is currently being used in electronics manufacturing, driven by the EU RoHS directive that limits lead in electronics to less than 0.1% (1000 ppm). More than 30 lead-free alloys are available for use in almost all soldering applications. In electronics, lead-free interconnects can be used to replace lead in the solder, printed circuit board (PCB) finishes, and component leads metallization. Generally, high-tin alloys, such as a tin/silver/copper alloy, are preferred alternatives to lead solder. Alternatives to electrically conductive adhesives (tin-lead in PCB assembly) that are currently in development include isotropic conductive adhesives (Geibig and Socolof 2005). There have been problems with lead free solder forming “tin-whiskers” and short circuiting.

DRAFT
113
Alternative technologies that can replace lead in the manufacture of electrical equipment in Table 15 are from the Northeast Waste Management Official’s Association (Northeast Waste Management Officials' Association 2007). Table 15- Electrical Equipment (SIC 36) Lead-Emitting Technology Alternative Leaded etch-resist used in manufacture of printed wiring boards (PWBs) Tin, dry film, or nickel gold etch-resist
Lead used in terminal plating of wired products Tin plating and tin-copper alloy Removal of tin/lead plating from circuit boards (strip etch-resist)
Improved bath operations to reduce need for removal
Tin/lead solder used in manufacture of flexible interconnects Organic materials
Tin/lead solder used in surface-mount technology (SMT) components Tin/silver/copper alloy
Lead solder mask used in manufacture of PWBs
Nickel/gold, immersion bismuth/immersion silver, and organic solderability preservatives
Groups Affected The number of individuals affected by lead solder is quite large since electronics are in everyone’s home and office. However, the primary individuals impacted are:
· Electronics manufacturers and recyclers. · Electronics customers. · Workers in waste management and related industries who handle lead-containing
products at the end of their usable life. Estimated Quantity In its 2005 report on lead, the USGS indicated that the total amount of solder used in the U.S. increased from 7,440 to 8,370 metric tons between 2004 and 2005. The amount of lead solder used in electronic components increased by a net 1,340 metric tons over the same period. Overall, the majority of lead solder (92%) was used in electronic equipment. In addition, solder accounted for 0.57% of the lead used in products (U.S. Geological Survey 2007). These results agree with the values reported for 2003 by Toxics Use Reduction Institute in Massachusetts which indicated that Solder account for 0.5% of the total US consumption of lead (Toxics Use Reduction Institute 2006). End-of-Life No specific estimates are available for solder.

DRAFT
114
Existing Programs/ Regulations Federal The Safe Drinking Water Act (SWDA) (U.S. Environmental Protection Agency 1998) limits the amount of lead in solder when it is used in water distribution systems. In 1986, the SDWA was amended to require that:
‘…no person may use any pipe, any pipe, any pipe or plumbing fitting or fixture, any solder, or any flux, the installation or repair of any public water system or any plumbing in a residential or nonresidential facility providing water for human consumption that is not lead free.’
‘Lead free’ solder was subsequently defined as:
‘…may not contain more than 0.2 percent lead.’ EPA adopted the NSF Standard 61, Section 9 which limits the amount of lead which can leach from any product as an acceptable method to meet the SDWA requirements (U.S. Environmental Protection Agency 2007). The SDWA was further amended in 1996 to make it unlawful for anyone to use or sell lead solder for use in waster distribution systems after August 6, 1998 (U.S. Environmental Protection Agency 1998). Washington State DOH is delegated by EPA to implement the requirements of the SDWA within Washington State. Therefore all of the federal requirements identified above are also applicable within Washington and are enforced by DOH (Washington State Department of Health 2005). In addition, Ecology established regulations in 2006 to implement the Electronics Products Recycling Program under the authority of Chapter 70.95N, Electronic Product Recycling (State of Washington 2006). This law gives Ecology administrative and enforcement responsibility for implementing electronic product recycling. Covered electronic devices (i.e. computers, televisions) fall under the scope of this chapter. Manufacturers, transporters and collectors must register annually with Ecology prior to performing activities and services associated with covered electronic products (CEP). Ecology expects to collect 24 million pounds of material in the first year but how much of that will be lead has not been estimated. Lead is an element in the cathode ray tube of many CEPs. To sell CEPs in Washington, manufacturers must clearly label their products with their brand name. In addition to being financially responsible for the collection, transportation and recycling of electronic waste products, manufacturers must also pay an administrative fee to Ecology that is based on a tiered system (Washington State Department of Ecology 2007).

DRAFT
115
Plumbing Background Many plumbing fixtures are made of brass and other alloys. An alloy is a solid mixture that contains two or more elements, at least one of which is a metal. In all of these alloys, other metals like lead can be intentionally added to alter their physical or chemical properties. Lead is added to brass, bronze, and steel to improve machinability, lubrication or other physical properties. Intentionally added lead can vary considerably depending upon the desired characteristic. Lead content in brass can range from 0.25 to 3.7% lead by weight, but may be higher. Plumbing fixtures can contain up to 8% lead by federal law and still be considered “lead-free.” In addition to intentionally added lead, lead can remain as a trace contaminant in other metals after the smelting process. Lead, for example, is often found with ores containing zinc and can therefore appear as a contaminant in the finished zinc product. Although lead content can vary considerably depending upon the smelting process, lead contamination after smelting is typically low, less than 1% by weight. Lead is not used as a stabilizer in PVC pipes, but PVC pipes are joined together with brass pipefittings that contain lead. For more information on lead in PVC see the section on vinyl. Alternatives Alternatives to lead exist and are commonly available. Tin, bismuth and selenium are examples of other elements which can be used in place of lead. In addition, many manufacturers are moving toward low-lead alloys which are currently available. For example, EnviroBrass uses bismuth selenide instead of lead and offers the machinability, pressure tightness, corrosion resistance and casting characteristics of leaded brass. Lead-free alternatives are currently more expensive than their lead-containing counterparts, though the price is likely to decrease if demand for lead-free alloys increases. Groups Affected The main affected groups are producers and users of plumbing fixtures. Lead plumbing is not known to be a large contributor of lead for the majority of children, although some children have gotten significant lead exposure from plumbing fixtures. Older homes, built before 1940, are more likely to have lead pipes. Houses with copper pipes that were installed before 1988 may have lead solder. Houses plumbed with PVC pipes may also have high levels of lead in the water due to lead in brass pipefittings and fixtures. Recent studies have suggested that levels of lead in the water may even be higher in houses with PVC pipes (Zhang et al. 2008). The severity of the exposure varies greatly depending upon the conditions to which the metal is exposed. Leaching from alloys, for example, is very dependent upon pH. The lower the pH, the

DRAFT
116
greater the likelihood of material leaching from the alloy. Therefore, the impact to affected individuals can vary widely depending upon the specific conditions experienced. Estimated Quantity Plumbing fixtures can contain up to 8% lead by federal law and still be considered “lead-free.” EPA adopted the NSF Standard 61, Section 9 which limits the amount of lead which can leach from any product as an acceptable method to meet the SDWA requirements (U.S. Environmental Protection Agency 2007). The current leaching limit is 11 ppb and that will be reduced to 5 ppb in 2012. The GAO report on lead from plumbing (U.S. Government Accountability Office 2006) included information on level of lead in plumbing fixtures. The report states that 37.3% of faucets contain less than 1% lead and 99% of faucets contain less than 3.7% lead. All 5,551 faucets that were tested contained less than 8% lead. For meters and valves 75.1% contained less than 1% lead and 89.1% contained less than 3.7% lead. There were 3 (0.2%) of the 1,239 meters and valves tested that contained more than 8% lead. In 2005, USGS statistics show that 2,100 metric tons of lead were used in brass and bronze billets and ingots (U.S. Geological Survey 2007). Recycled material is an important source in the industry and the amount of lead in recycled alloys is harder to control. End-of-Life No specific estimates are available for plumbing. Existing Programs/ Regulations Federal The Safe Drinking Water Act was passed and took effect in 1974. This Act ensures that all drinking water meets specific and safe quality standards. The SDWA granted EPA the authority to establish national primary drinking water regulations (40 CFR Part 141). Section 141.51 of this Act sets a Maximum Contaminant Level Goal (MCLG) for lead at 0 ppb and an action level of 15 ppb. These standards apply to all drinking water sources (includes drinking water from surface water and ground water). The Safe Water Drinking Act (U.S. Environmental Protection Agency 1998) also limits the amount of lead in solder when it is used in water distribution systems. In 1986, the SDWA was amended to require that:
‘…no person may use any pipe, any pipe, any pipe or plumbing fitting or fixture, any solder, or any flux, the installation or repair of any public water system or any plumbing in a residential or nonresidential facility providing water for human consumption that is not lead free.’

DRAFT
117
‘Lead free’ solder was subsequently defined as:
‘…may not contain more than 0.2 percent lead.’ EPA adopted the NSF Standard 61, Section 9 which limits the amount of lead which can leach from any product as an acceptable method to meet the SDWA requirements. Under the SDWA a voluntary standard was developed by NSF (originally the National Sanitation Foundation) and ANSI (American National Standards Institute) to ensure drinking water does not contain excessive amounts of lead. The NSF ANSI Standard 61 evaluates the amount of lead which leaches out of plumbing fixtures. The amount of lead that leaches out of the fixture and into the water must be less than 11 ppb (less than 5 ppb in 2012) (U.S. Environmental Protection Agency 2007). The amount of lead in the fixtures is not monitored to determine if they meet the 8% maximum lead content. Rather, the amount of lead that leaches from these fixtures into the water supply system is regulated. The Lead Contamination Control Act, passed in 1988, amended the Safe Drinking Water Act by adding a new part titled “Additional requirements to regulate the safety of drinking water.” The new provisions require the Consumer Product Safety Commission to focus on, among other things, reducing lead levels in school drinking water systems. The Act defines “Lead-free” water cooler fixtures, requires the recall or repair of lead-containing water coolers in schools, prohibits the sale of lead-containing water coolers and requires programs to be established to monitor and, where necessary, remediate lead in school drinking water (U.S. Department of Health and Human Services 2007). The Lead and Copper Rule was enacted by the EPA in 1991. It established the action level of 15 ppb based on the 90th percentile level for tap water samples. The Rule also established tap water sample monitoring conditions and treatment requirements based on the water system in place. The rule requires drinking water suppliers to provide public health education materials to customers if the lead action level is exceeded. The Lead and Copper Rule applies to public water systems as well as owners or operators of private water systems (U.S. Environmental Protection Agency 2004). Washington DOH is delegated by EPA to implement the requirements of the SDWA within Washington State. Therefore all of the federal requirements identified above are also applicable within Washington and are enforced by DOH (Washington State Department of Health 2005). California The California Health and Safety Code §116875-116880 established new limits for lead in water systems. The new limit applies to the wetted surfaces of pipes, pipe fittings, plumbing fittings and fixtures that pass water intended for human consumption. In 2010, when this statute becomes effective, the limit on lead content in solder will remain the same. However, the wetted surfaces of pipes, pipe fittings, plumbing fittings and fixtures shall not exceed a weighted average of more than 0.25% lead. Vermont also recently passed a bill with a similar limit.

DRAFT
118
Other Alloys Background An alloy is a solid mixture that contains two or more elements, at least one of which is a metal. There are many different types of alloys but the four pertinent to this section are brass, bronze, pewter and steel. Brass is mostly copper (58-90%) and zinc. Bronze is mostly copper (88%) and tin. Pewter is mostly tin (85-99%) with copper and steel is mostly iron (98-99.8%) with carbon. In all of these alloys, other metals like lead can be intentionally added to alter their physical or chemical properties. Lead is added to brass, bronze, and steel to improve machinability, lubrication or other physical properties. Higher machining speeds and lower rates of tool wear mean that overall production costs are lowered. Intentionally added lead can vary considerably depending upon the desired characteristic. Lead content in brass can range from 0.25 to 3.7% lead by weight, but may be higher. Bronze alloys may contain up to 20% lead. Other elements added to alloys for different reasons include manganese, aluminum, silicon, nickel, iron, antimony, phosphorus and arsenic. In addition to intentionally added lead, lead can remain as a trace contaminant in other metals after the smelting process. Lead, for example, is often found with ores containing zinc and can therefore appear as a contaminant in the finished zinc product. Although lead content can vary considerably depending upon the smelting process, lead contamination after smelting is typically low, less than 1% by weight. Lastly, some specialty applications use high-lead content alloys. Organ pipes, for example, are traditionally 50% lead and 50% tin, but some contain lead levels as high as 90% or higher. Uses of high-lead content alloys are rare and typically specialized. Other musical instruments, especially brasses, will also contain lead, but there is no data on the amount of lead or estimate of the potential for health risks. Some piano keys also contain lead weights, as mentioned in the weight section. Information on alloys in solder and plumbing fixtures are addressed in other sections of this chapter. Alternatives Alternatives to lead exist and are commonly available. Tin, bismuth and selenium are examples of other elements which can be used in place of lead. In addition, many manufacturers are moving toward low-lead alloys which are currently available. For example, EnviroBrass has only trace amounts of lead. Green Steel uses tin instead of lead for improved machinability. Lead-free alternatives are more expensive than their lead-containing counterparts. However, the price is likely to decrease if demand for lead-free alloys increases. There are no current alternatives for lead in organ pipes.

DRAFT
119
Groups Affected The main affected groups are:
· Metal producers. · Industries that make metal products such as plumbing fixtures, appliances, etc. · Workers in these industries · Scrap metal recyclers. · Consumers and daily users.
The severity of the exposure will vary greatly depending upon the conditions to which the metal is exposed. Leaching from alloys, for example, is very dependent upon pH. The lower the pH, the greater the likelihood of material leaching from the alloy. Therefore, the impact to affected individuals can vary widely depending upon the specific conditions experienced. Estimated Quantity In 2005, USGS statistics show that 2,100 metric tons of lead were used in brass and bronze billets and ingots (U.S. Geological Survey 2007). This represents a decrease of 290 metric tons from 2004. The same report shows 19,500 metric tons of lead were used in a wide range of products including electrical machinery and equipment, transportation equipment including motor vehicles, bearing metals, etc. This is an increase of 1,800 tons in 2004. Some of this lead, however, is used in applications for which viable alternatives do not exist. For example, lead used as ‘nuclear radiation shielding’ is included in this number. The exact amount of lead used in shielding is not reported and, therefore, it is impossible to determine how much lead was used in these applications. In addition, the ‘pipes, traps and other extruded products’ category accounts for an additional 1,220 metric tons in 2005. The amount used in 2004 was not reported so, again, no information can be provided on whether the amount of lead used in this category increased or decreased over the two year period. The report also lists other pertinent uses of lead but does not include sufficient information to calculate the amounts of lead used (U.S. Geological Survey 2007). Recycled metal is an important source of material in industry and the amount of lead in recycled alloys is harder to control. End-of-Life No specific estimates are available for other alloys. Existing Programs/ Regulations Existing programs and regulations focus on lead in solder and plumbing, and they are detailed in those sections.

DRAFT
120
Batteries Background Batteries store energy and allow access to that energy at a later time. A lead-acid battery uses a reaction between lead metal, lead oxide, and sulfuric acid to generate an electric charge. The battery can be recharged easily by reversing the chemical process and will last for several years. The popularity of lead for this purpose is due to its ability to supply high surge currents and its low cost. Lead-acid batteries are used for starting-lighting-ignition (Jordan et al. 2003) purposes in vehicles. Traction batteries used to power electric vehicles, such as electric cars, forklifts, golf carts, etc., also use this technology (U.S. Geological Survey 2007). An increasing use for lead-acid batteries is in uninterruptible power supply systems used for voltage control and emergency power in critical computer storage systems, hospitals and telecommunications networks. Alternatives Nickel-metal hydride (NiMH) batteries are commonly used high-voltage traction battery systems in electric and hybrid-electric vehicles. Lithium batteries, common in electronics, have automotive uses as well. The automobile industry is expected to increase its production of hybrid vehicles with these alternative battery systems in the future. (Environmental Defense 2003). There are also companies, such as Firefly Energy, that are working to reduce the amount of lead needed in lead-acid batteries. Groups Affected Consumers are not usually directly exposed to lead in batteries, since automotive batteries are typically self-enclosed in plastic and will only leak if dropped and broken. However, people and wildlife are affected by the estimated 1% of batteries that are not recycled. There are occupational exposures to lead related to use of lead in batteries for people such as automobile repair workers, battery manufacturers, and battery recyclers and occupational exposures were discussed in the occupational section. Estimated Quantity An individual battery used for a car or light truck contains an average of 21 pounds of lead (U.S. Geological Survey 2006). Over 88 percent of the lead consumed in the U.S. goes into producing lead-acid batteries used in automotive and various industrial applications (U.S. Geological Survey 2007). In 2005 this amounted to 1,290,000 metric tons of lead in the U.S. (U.S. Geological Survey 2007). End-of-Life Although there is limited initial exposure to the lead disposed in solid waste landfills, it is a concern because solid waste enters a cycle of management that eventually results in dissipation

DRAFT
121
of lead to areas where exposure can occur. Some of the lead may end up in landfill leachate, which is then treated at a municipal wastewater treatment plant and then released in the wastewater or sewage sludge. While an estimated 99 percent of lead-acid batteries are recycled, the remaining 1 percent represents a significant quantity of lead. Table 16 shows the different estimates for batteries. Ecology estimates that approximately 600 tons of lead batteries are not recycled each year in Washington, which is a major source of lead released into the environment. The estimates for how much lead from batteries is disposed of each year in Washington range from 248 to 1560 tons. A waste composition study conducted by Green Solutions estimated 1,560 tons of lead is thrown out each year in Washington.(Green Solutions 2003). The study looked at municipal solid waste (MSW) from ten counties in both eastern and western Washington, plus the city of Seattle. MSW data was compiled from different studies in different counties from 1995-2003. The data from these ten counties were used to estimate the amount of each type of MSW in the other counties in the state, based on demographics. In those ten counties and Seattle, an estimated 450 tons of automobile batteries, or 0.03% of the total MSW were disposed of instead of being recycled. That equates to an estimated 1,560 tons of automobile batteries statewide. Ecology’s annual report on solid waste in Washington does not estimate the recycling rate for vehicle batteries, but in 2005 28,903 tons of vehicle batteries were recycled. The Battery Council estimates that 98.8% of batteries are recycled. This figure has been used by EPA and others in estimating the number of batteries that are not recycled. Assuming 98.8% of automotive batteries are recycled, we calculate that 293 tons of batteries are not recycled and remain a potential source of lead to the environment. The other estimates in the chart come from EPA reports on waste, USGS reports on lead usage and battery industry estimates. The estimates for the amount recycled in Washington are from population figures (Washington has 2% of the U.S. population)

DRAFT
122
Table 16- Estimates of Lead-Acid Batteries in Washington
Study Lead In Batteries
(Tons) Percent
Recycled Recycled in U.S. (Tons)
Recycled in WA (Tons)
Discarded In U.S. (Tons)
Discarded In WA (Tons)
Waste Composition Study for Washington State
1,560
Solid Waste in Washington State Fifteenth Annual Rep. 28,903 293 Municipal Solid Waste in the U.S. 2005 Facts and Figures U.S. EPA Office of Solid Waste. Oct 2006 2,570,000 98.8% 2,539,160 51,000 30,840 617 USGS 2006 Minerals Yearbook 1,256,675 98.8% 1,241,595 25,000 15,080 302 USGS 2006 Apparent Consumption vs. Total Consumption, A lead Acid battery case study 1,372,336 98.8% 1,355,868 27,000 16,468 329 Battery Concil International from USGS fact sheet 2006 1,032,000 98.8% 1,019,616 20,000 12,384 248 Washington average 560 Existing Programs/ Regulations Battery recycling in Washington is as close to a closed loop as any product. They are recycled at very high rates, and the lead is re-smelted and made into new batteries. In 1991, Ecology adopted Chapter 173-331 WAC under the authority of Chapter 70.95.610-670 RCW. This regulation requires that all batteries must be properly returned to one of the following:
· A person or entity selling lead-acid batteries. · Person or entity authorized by the Department of Ecology to accept the battery. · A secondary lead smelter.
Chapter 70.95.640 RCW establishes a retail core charge of no less than five dollars that may be reclaimed by any purchaser who recycles a used vehicle battery of the same size. None of the battery disposal requirements shall supersede any of the provisions established by Chapter 70.105 RCW, Hazardous Waste Management. Battery wholesalers can be suspended for failing to accept used batteries.

DRAFT
123
Weights Background There are a variety of uses of lead in weights. Some examples include:
· Automotive wheel weights. · Fishing tackle (see section on Hunting and Fishing). · Scuba diving. · Exercise, chiropractic and medical therapy purposes. · Piano keys. · Curtain weights to hang curtains uniformly. · “Pinewood derby” cars. · Clock pendulum weights.
Lead is commonly used for weights because it is dense and inexpensive. Weights are generally made of solid lead, and in some cases, the weights are not covered with any protective coating allowing direct skin contact during their use. Not all lead weights are recycled, resulting in environmental releases and exposures. Some weights, such as wheel weights and fishing tackle, are distributed into the environment during use and pose a risk to wildlife. More information on fishing weights is in the section on Hunting, Fishing and Shooting. Alternatives For most uses, steel or other metals can be used in place of lead weights. Steel is likely the most common alternative because it is readily available and is not a toxic hazard to humans. Steel is lighter than lead, so a larger volume of steel would be needed for the same weight. There are zinc wheel weights, but there are concerns about the aquatic toxicity of zinc. Mercury wheel weights are not recommended due to the toxicity of mercury. Methylmercury is on Washington’s PBT list and was the subject of the first Chemical Action Plan in Washington. Groups Affected Many people may be exposed because lead weights are commonly used in a variety of uses and applications. Specific affected groups include automobile owners, automotive tire workers, medical and chiropractic professionals and patients, scuba divers, curtain manufacturers and installers and homeowners/renters, and piano and clock assembly workers. In addition, weights that are released into the environment, such as wheel weights, have the potential to expose humans and wildlife. In 2006 a five-year-old girl ate lead pellets from an ankle weight. Luckily, she was seen eating the lead pellets and treated in time to prevent death, but her blood level was 79mg/dL (McNeil and Schoenfeld 2007).

DRAFT
124
Estimated Quantity Wheel weights In 2003, approximately 65,000 tons of lead wheel weights were used on 232 million registered automobiles, light trucks, and commercial vehicles (Bleiwas 2006). The total amount of lead in use for wheel weights on vehicles in the United States may differ from year to year because of the addition of new vehicles, the rate of the retirement (scrapped) of vehicles, rate of tire replacement, greater or lesser use of alternative materials and newer wheel-balancing technol-ogy, and wheel weight loss from vehicles in use (Bleiwas 2006). Other Weights No estimates available. End-of-Life Table 17 shows varying estimates, ranging from 30 to 65 metric tons, of wheel weights lost from vehicles every year on the Washington’s roadways. Ecology believes 40 tons is the best estimate, based on the range of other estimates and our estimate using the number of registered cars in Washington. Many of these wheel weights are pulverized by traffic into fine particles and washed off of the road and onto the shoulder and into stormwater. A higher percentage of weights fall of in urban areas due to the stop and go traffic, so the lost weights are disproportionately in the most populated areas. In a 2006 study the USGS estimated that 2,000 metric tons of wheel weights are lost, nationwide, each year (Bleiwas 2006). The study examined the loss of wheel weights in great detail. The estimate of lost wheel weights does not include an additional 4,000 metric tons that are unaccounted for in the estimates of production, use, inventory and recycling. Based on population size, Washington’s share would be 40 metric tons. The study by Root looked at lead deposited along urban roadways in Albuquerque, New Mexico (Root 2000). This study assumes fewer wheel weights per car, which is why the estimated wheel weights in use is lower. In their petition to the EPA to prohibit the use of lead wheel weights, The Ecology Center, a Michigan based non-profit, estimated that 35 metric tons of wheel weights are lost each year on urban streets in Washington(Ecology Center 2005). This estimate is based on urban vehicle miles traveled, car registrations, and deposition rates from the Root study. While the EPA denied the petition by the Ecology Center to ban lead wheel weights in the U.S., they acknowledge the problem and are working with industry to voluntarily switch to less toxic alternatives(U.S. Environmental Protection Agency 2007). Ecology estimated the lost wheel weights in Washington using the lower estimate of 130 g (4.3 oz) of lead wheel weights per car and 6,738,398 registered cars in Washington.

DRAFT
125
Table 17- Estimates of Lead Wheel Weights Lost in Washington
Study Estimated weights in use (tons)
Estimated percentage lost
National loss (tons)
WA loss (tons)
Bleiwas USGS, 2006 65,000 3% 2,000 40 Root, 2000 25,000 6% 1,500 30 The Ecology Center 15% 35 EPA 25,000 13% 3,250 65 Ecology 823 ~5% N/A 41 Other Weights No estimates available. Existing Programs/ Regulations The European Union banned the use of lead wheel weights as of July 2005. In the U.S. the industry has been switching from lead wheel weights to steel wheel weights. Cars imported into the U.S. from Europe and other regions usually come with lead-free wheel weights. Domestic auto manufacturers have been switching over to steel wheel weights. Several states, such as Minnesota, Maine and Vermont, are phasing out the use of lead wheel weights starting with state fleets. There have been successful programs in the U.S. Air Force and U.S. Postal Service to switch to steel wheel weights. In Washington, Les Schwab announced in July 2008 that it was switching to steel wheel weights in all of its stores in 2009. In California, lead wheel weights are being phased out by the end of 2009 in response to a lawsuit brought under Proposition 65, the Safe Drinking Water and Toxic Enforcement Act of 1986. On April 28, 2009, Governor Gregoire signed into legislation ESHB 1033 to require alternatives to lead wheel weights at the time of tire replacement or repair. “Environmentally preferred” wheel weights are defined as not having more than 0.5% of any substance on the list in the PBT Rule (WAC 173-333), which includes lead and mercury. The new law only pertains to motor vehicles with a wheel diameter of less than 19.5 inches or a gross vehicle weight of 14,000 lbs. Ecology will assist manufacturers, distributers, wholesalers, retailers, and persons that balance tires with identifying environmentally preferred wheel weights.

DRAFT
126
Leaded fuel Background Lead is used in fuel as an additive to improve the octane rating and reduce knocking. The organic tetraethyl lead (TEL) added to fuel enters organisms more readily than inorganic lead. The 1990 Clean Air Act Amendment limited lead in automotive fuel to less than 0.05 g/gallon, but there is an exemption for off-road vehicles (i.e., aviation, marine, racing, and farm use). NASCAR is phasing out its use of leaded racing fuel and will began using unleaded gas at the start of the 2008 season. Some general aviation planes use leaded gas, called Avgas 100LL, which contains 0.56g lead per liter (2g/gallon). Some developing countries still use leaded fuel and the United Nations is working to phase out leaded petrol in countries that are still using it. Alternatives The National Association for Stock Car Automobile Racing (NASCAR) developed an unleaded racing fuels program in partnership with EPA and Sunoco (U.S. Environmental Protection Agency 2002;NASCAR 2006). The unleaded Sunoco fuel was used at the 2007 Nextel Cup (NASCAR 2007) and NASCAR is transitioning to unleaded fuel for the 2008 season (NASCAR 2006). The FAA Technical Center has been working on a replacement for leaded aviation fuel since 1994 (Federal Aviation Administration 2008). Currently, there is no single replacement for Avgas 100LL that is economical, requires only minor or no aircraft modification or recertification, and does not negatively impact aircraft performance. An unleaded Avgas is available that could replace 30% of the current 100LL consumption. Some international use of leaded gasoline still affects Washington through lead contaminated food. The United Nations Environment Programme (UNEP) has been working to help countries phase out leaded gasoline through their Partnership for Clean Fuels and Vehicles. For example, UNEP worked to phase out the use of leaded gasoline in Sub-Saharan Africa with the Dakar Declaration in 2001 and then an action plan in 2002 (United Nations Environment Programme 2008). Leaded gasoline is still sold in North Korea and several countries in Eastern Europe, Middle East, and northern Africa (United Nations Environment Programme 2008;Lead Education and Abatement Design Group 2008) Groups Affected The fuel industry, general aviation pilots, race car drivers and spectators are the primary groups affected. The general public and the environment are affected when leaded fuel is burned due to the release of lead into the air. Food imported into the U.S. may be contaminated by the continued use of leaded fuel in other countries.

DRAFT
127
Estimated Quantity Avgas 100LL is the most commonly used aviation gasoline and contains 2.1g of lead per gallon (U.S. Environmental Protection Agency 2002). Washington sold 11,437,910 gallons of aviation fuel in the fiscal year ending June 2006 (WSDOT personal communication), which contained approximately 26.7 tons of lead. The National Motor Sports Council estimated that approximately 100,000 gallons of leaded gasoline were used by NASCAR in 1998 (U.S. Environmental Protection Agency 2002), plus leaded additive was added to some unleaded gasoline. Racing fuels have about 4.2 g of lead (4 ml of TEL) per gallon (U.S. Environmental Protection Agency 2002;Sunoco 2008).An estimated 925 lbs of lead was released nationwide from use of leaded racing fuel in 1998. Washington State likely uses less leaded fuel for racing than other states because the state does not have any NASCAR tracks, though we do have other automobile racing tracks which are associated with NASCAR. Due to the unavailability of leaded fuel for cars in Washington, it is unlikely that much leaded fuel is used on these tracks. The American Boat Racing Association (ABRA) is the sanctioning body for the Unlimited Hydroplane races in Seattle and Tri Cities and their vehicles do not use leaded fuel (personal communication). End-of-Life When leaded gas is burned, the lead is released into the air, and then falls to the ground. The amount of lead estimated to be in leaded aviation fuel, 27 tons a year, would be released into the air. Existing Programs/ Regulations The Clean Air Act and its amendments address airborne lead emissions and EPA is responsible for carrying out the law. In the mid-1970s, EPA began its lead phase-out effort by proposing to limit the amount of lead that could be used in gasoline. At that time there was 2-3 grams of lead per gallon of gasoline. In 1985 the lead content of leaded gasoline was reduced to 0.5g/gallon. It 1993 it became illegal to manufacture vehicles that required leaded gasoline. In 1996, leaded gasoline was limited to less than 0.05g/gallon for on-road vehicles. Because of the phase-out of leaded gasoline, lead emissions and concentrations in the ambient air decreased sharply during the 1980s and early 1990s (see Table 19). The Clean Air Act also gives EPA the authority to limit lead emissions from sources like chemical plants, utilities, and steel mills. Since 1994, the Federal Aviation Administration (FAA) Unleaded Fuels Research Program at the FAA Technical Center and the industry-established Coordinating Research Council (CRC) have been cooperating to develop and test alternatives and develop a specification with the American Society of Testing and Materials (ASTM) for an unleaded aviation gasoline that will replace the currently available 100LL. The CRC established the Aviation Gasoline Committee, and two

DRAFT
128
subcommittees, the High Octane Rating Aviation Gas and the Unleaded Avgas Development Subcommittees, to share research on replacing the current low-lead fuel with an unleaded alternative. The thrust of these groups is to provide and share research on unleaded fuels with a goal of replacing leaded aviation gasoline. The FAA Technical Center has tested several proprietary unleaded fuel blends in both engine knock and engine endurance tests. The tests were conducted to study detonation, performance, vapor lock, wear, oil dilution, deposit formation, startability, hot fuel, materials compatibility and enrichment. While the FAA neither regulates nor develops specifications for fuels, it would be very difficult to certify an engine for operation on a fuel that does not have an existing specification.

DRAFT
129
Specialty Glass Background Historically, lead was added to silica to lower the melting temperature of the mixture. Lead also has characteristics which improve the appearance and cutting properties of crystal glass. Leaded glass reflects the light more brilliantly than non-lead glass which provides an aesthetic value to the end product. Small additions of lead are also made to optical and electrical glass. The major application of leaded glass is in television screens and computer monitors, to protect viewers from the harmful X-rays generated by these appliances (Thornton et al. 2001). The optical properties of lead glass result from the high density of the material. Cathode ray tubes (CRTs) in televisions and computer monitors are one of the most common sources of leaded glass. Alternatives Alternatives to leaded glass, particularly for CRTs, are becoming readily available. Alternatives to CRTs that contain less lead, such as flat panel monitors, are also becoming more popular. Radiation Shielding Alternatives to radiation shielding are more problematic. Although lead is by no means the only material which can provide screening against radiation, its very high screening ability, combined with malleability and relative low cost, makes it a particularly suitable candidate for many applications. Alternatives to lead need to either be as dense or thicker than lead shields to provide equivalent levels of protection.
However there are few alternatives which meet these characteristics and those that do contain either precious metals (gold, platinum) or refractory metals, such as tungsten and tantalum. These replacement metals are typically rare and difficult to produce and shape. Therefore, they are expensive and are not really viable alternatives to lead (Thornton et al. 2001). Optical Glass and Lead Crystal Private companies have been working on alternatives. Nikon developed eco-glass in the 1990’s to perform well with no lead or arsenic. Due to the diversity of optical products, Nikon has not been able to incorporate eco-glass into all of their products, but for the year that ended March 2007, they achieved an eco-glass utilization rate of over 98% of all glass shipped. Alternatives to lead used in crystal and other similar applications are available. The Danish Ministry of the Environment and Energy conducted extensive research on alternatives in support of the Danish ban on all uses of lead unless no viable alternative exists. As part of this effort, alternatives to lead crystal were evaluated and barium and zinc identified as suitable replacements for lead in crystal (Brønnum and Hansen 1999).

DRAFT
130
CRTs New plasma and LCD screen technologies are likely to replace use of lead containing CRTs.The purchase of CRTs in recent years has decreased substantially. However, this new technology will also increase the likelihood that existing televisions with CRTs will be disposed of. Any discussion of alternatives will be greatly impacted by consumer developments of this type. It should also be noted, however, that although the newer plasma and LCD alternatives contain comparatively little lead, they do contain other heavy metals like mercury which may be of concern for the future. For those televisions still being manufactured with CRTs, alternatives are more expensive and therefore unlikely. Lead provides excellent radiation shield though barium,strontium and zirconium have been suggested as replacements. These elements, however, do not shield as well as lead and the amounts needed may not be readily available (Thornton et al. 2001). Therefore, a viable alternative to lead is unlikely and the switch to plasma and LCD displays provides a better alternative than changing the formulation of glass in CRTs. Groups Affected The groups and individuals affected by the use of lead in these areas are:
· Electronics manufacturers and specifically CRT manufacturers. · Workers in specialty glass manufacturing facilities. · Workers in electronics recycling facilities. · General consumers who use the products.
The level to which these groups are affected depends greatly upon the amount of lead to which each group is exposed and varies considerably depending upon manufacturing, recycling and use conditions. Estimated Quantity No specific estimates are available for the amount of lead used in specialty glass. End-of-Life As mentioned previously, the advent of flat-screened television and computer monitors has greatly impacted the use of leaded glass in the traditional cathode-ray tube applications. It is difficult, however, to determine how much of an impact this will have on overall lead use. It will lead though to increased numbers of CRTs being sent to landfills for disposal. If each CRT contains 2-4 pounds of lead in the CRT glass, this equates to a minimum of 2 and 4 million pounds of lead being sent to landfills each year. Actual amounts may be much higher depending on the exact number of CRTs sent for disposal. For this reason, many states like Washington have implemented recycling program, which is explained below.

DRAFT
131
In 2008, EPA reported that millions of CRTs are being disposed of each year and that 80-85% of the discarded CRTs end up in landfills (U.S. Environmental Protection Agency 2008). According to Townsend et al. 1999, consumer electronics were the number four source of lead in MSW landfills in 1970. However, by 1975 they were the number two source and accounted for 27 percent of lead discarded to MSW landfills in 1986. Townsend estimated that CRTs made up approximately 28 % of the municipal solid waste (MSW) disposal of lead containing products in1995 They are projected to make up 30 percent of lead discards by 2000 (Townsend et al. 1999). Existing Programs/ Regulations Federal In 2006, EPA finalized the CRT Rule which affected the way CRTs are handled within the U.S. EPA’s intent was to increase the recycling of CRTs and to decrease the inappropriate disposal of unwanted CRTs into third world countries. With the implementation of this rule, recyclers must notify EPA if they plan to export used or broken CRTs. EPA then notifies the receiving country of the planned shipment. If, however, the CRTs are to be reused the shipper only has to provide a single notification to EPA and can continue to ship CRTs for reuse. EPA does not notify the receiving country of any shipment of CRTs intended for reuse. The rule also makes it easier to recycle CRTs within the U.S. by exempting CRTs from the dangerous waste regulations as long as certain requirements are met. CRTs used in households and small businesses that generate less than 100 kilograms of hazardous waste each month are exempt from these requirements (U.S. Environmental Protection Agency 2006). Washington State Ecology established regulations in 2006 to implement the Electronics Products Recycling Program under the authority of Chapter 70.95N, Electronic Product Recycling (State of Washington 2006). This law gives Ecology administrative and enforcement responsibility for implementing electronic product recycling. Covered electronic devices (i.e. computers, televisions) fall under the scope of this chapter. Manufacturers, transporters and collectors must annually register with Ecology prior to performing activities and services associated with covered electronic products (CEP). Lead is an element in the cathode ray tube of many CEPs. To sell CEPs in Washington, manufacturers must clearly label their products with their brand name. In addition to being financially responsible for the collection, transportation and recycling of electronic waste products, manufacturers must also pay an administrative fee to Ecology that is based on a tier system.

DRAFT
132
Specialty Paint Background Lead is added to paint as a white pigment to speed drying, increase durability, improve coverage, retain a fresh appearance, and resist moisture and pests. Until 1955, paint contained up to 50% lead. The lead levels in most consumer paint declined to 1% and was further limited to 0.06% in 1978 by the CPSC. Lead paint is still used legally in some applications, such as traffic paint, non-consumer marine paint, bridge paint, artist paint, appliances and fixtures, and touch up paint. Some artists prefer to use traditional white paint that contains lead and antiques may be coated with lead paint. Alternatives Titanium, zinc and aluminum oxides can be added to paint to achieve the same qualities previously provided by lead. Groups Affected Workers in industries using lead paint have the greatest exposure. See section IV- Occupational Uses. Boating enthusiasts who paint their crafts, sign painters, hobbyists and artists (who are discussed more in the Art Supplies section of this chapter) are also at risk of exposure. Estimated Quantity Unknown quantities of lead are used in paint in Washington. This information is considered proprietary by industry and is therefore not reported. The USGS statistics for lead oxide consumption includes paint, as well as glass and ceramics products and pigments used in other applications. In 2005 15.5 thousand tons of lead oxides were used in the U.S. (U.S. Geological Survey 2007). With 2% of the general population, Washington’s share of lead oxides would be estimated to be 311 tons. End-of-Life No specific estimates are available for specialty paint containing lead. Existing Programs/ Regulations CPSC In 1978 the Consumer Product Safety Commission restricted the amount of lead in most consumer paint to a maximum of 600 ppm. This restriction applies to consumer products (defined in section 3(a)(1) of the Consumer Product Safety Act), toys, furniture and products sold to consumers for use in homes, schools, parks, hospitals and other areas. There are two types of exemptions to this regulation, those requiring labels and those that need no labeling. This regulation does not apply to boats or cars.
DRAFT
133
Washington The Washington State contract for traffic marking paint ( 2005) requires lead free paint. This contract is mandatory for the Department of Transportation (Guidotti et al. 2007) and optional for other state agencies. There is another optional contract (#07706) for traffic marking paint with no lead, chromium or cadmium and low amounts of volatile organic compounds (VOCs). Vermont In 2008 Vermont passed a law on lead in consumer products that included a ban on the sale of nonresidential paints and primers containing lead beginning Jan. 1, 2011.

DRAFT
134
Decorative and Hobby Uses of Lead Background
Lead has numerous uses in decorative items or as part of hobbies. Examples include ceramic pottery, stained glass, candle making, toy soldiers and fireworks. These uses are a concern because exposure can occur from contact with lead during manufacture, use or as part of hobby activities. In addition, lead contamination from these activities can be carried by people into their homes and other family members not involved in these practices can also be impacted.
Ceramics/Pottery
Lead glazes were used historically on a wide range of ceramic items. Traditionally they are most commonly used on earthenware, and on older bone china and porcelain. Lead glazes were attractive for use in ceramics because they were durable, inexpensive, commonly available, and produced attractive glazes.
When glazes are properly formulated and fired at a high temperature, lead is tightly bound into the ceramic matrix and is not easily removed. However, if the clay is not properly prepared and fired, lead may leach out and move into food stored in or on the ceramic ware. The degree of lead leaching from tableware can vary. It depends on how often the tableware is warmed and used, the amount of contact it has with food and drink and the acidity of the food involved. Acidic foods tend to leach lead more easily than other food types. Cups and bowls are of greater concern than dishes.
Handling glazes containing lead, even occasionally, can be harmful to human health if dust or fumes containing lead are swallowed or breathed in. When lead glazes are used, strict precautions are advised when mixing, applying or firing them. Where possible, it is better to avoid using glazes that contain lead (Australian Government 2008).
Stained Glass Traditionally, pieces of stained glass used in windows and other items are held together by ‘cames’. Cames are H-shaped extruded sections of lead which hold together small pieces of glass. Older stained glass windows found in churches and cathedrals all are made in this manner and contain large amounts of almost pure lead. More recently, the traditional cames have been replaced by a flat self-adhesive extruded lead tape which holds the pieces of stained glass together. This alternative is cheaper and is very effective in providing the appearance of the traditional lead came (Thornton et al. 2001). Working with stained glass and lead lighting often involves contact with lead fumes and dust. Any amount of lead fumes or dust is hazardous to human health, and should be avoided as much as possible. Lead fumes are a serious concern when the solder is melted. Operating the soldering iron at very high temperatures releases more fumes than at lower temperatures.

DRAFT
135
Lead dust can also be generated from sawing old frames. In addition, the plaster and fillings around the glass may a health hazard as they might have absorbed lead over the years (Australian Government 2008). Therefore when working with stained glass, it is important to handle the lead carefully and to work under conditions which minimize the release of lead. Candle wicks Historically, lead or lead containing wire was used to provide structural rigidity to candle wicks. This allowed the candles to burn more consistently and last longer. Concerns were raised about the volatilization of lead during the burning of the candle and possible impacts on human health. The U.S. Consumer Product Safety Commission (CPSC) warned of possible risks of lead exposure from candle wicks as early as 1976 (U.S. Consumer Product Safety Commission 1976). In 2000, the CPSC received two requests to ban this use of lead. Subsequently, the CPSC proposed a ban on the use of lead in candle wicks at levels above 0.06% (600 ppm) lead as their tests could determine no appreciable volatilization of lead below this level (U.S. Consumer Product Safety Commission 2002). The CPSC banned the manufacture and sale of lead-cored wicks and candles with lead-cored wicks in April 2003. The federal ban, which applies to all domestic and imported candles, allows the U.S. Customs Service to stop shipments of non-conforming wicks and candles, and allows the CPSC to seek penalties for violations of the ban (U.S. Consumer Product Safety Commission 2003). Fireworks Lead is used in fireworks primarily for pigments but it can also help to make the explosions more effective. The Danish Environmental Protection Agency identified fireworks as a major source of lead contamination to the atmosphere. They report that as much as 1 to 8 metric tons of lead were released directly to the atmosphere over Denmark each year from public use of fireworks. This release was second behind the contribution from solid waste incinerators. In previous years, releases from gasoline additives were the largest contributor to the atmosphere but this amount had decreased to 1.6 to 2 metric tons by 2000 (Lassen 2004). In a separate report released in 2007, the Danish Environmental Protection Agency again identified fireworks as a major source of lead contamination to the atmosphere. The report states:
‘Lead restrictions on fireworks will produce an immediate and profound effect, only limited by the possible illegal import of fireworks from other countries.’
The report does indicate however that restriction on the use of fireworks in Denmark may not have as much impact as desired due to limited regulations in surrounding countries. (Kjølhot et al. 2007). Other sources have also indicated that fireworks have a major impact on air lead levels. According to Monica Kauppi of the Heavy Metal Bulletin, stated:

DRAFT
136
"During the Stockholm Water Festival in 1996, the levels of pollutants in the air were measured before and after the fireworks by an environmental agency. Arsenic levels were doubled and the levels of mercury, cadmium, lead, copper, zinc and chromium were 4-5 times elevated. "It has been estimated that if all EU countries use the same number of fireworks per capita, for New Years Eve, the lead pollution will amount to 124 tonnes (Sweden 9 million people = 3 tonnes, EU 372 million people = 124 tonnes….(Lead Group Incorporated 1999).
These results are in agreement with the numbers identified the Danish Reports cited earlier. It should be noted, however, that the Danish reports indicate a wide range because of the uncertainty of the actual levels of lead in fireworks as there is considerable variability in lead content depending upon manufacturer and type of firework. The calculations made by Kauppi are based on the lower range of the Danish estimates and therefore are likely to be a conservative and accurate representation of atmospheric lead contamination from fireworks in the EU. Some companies have taken steps to reduce the atmospheric contamination from fireworks. Disney World, for example, announced in 2004 that it had started using compressed air to launch its nightly fireworks display to reduce the environmental impacts from fireworks displays (The Disney Corporation 2004). Leaded crystal
Lead crystal is made by combining molten quartz with lead compounds and is valued for its brilliance and clarity. Lead crystal is typically 24% lead. When a food or beverage is put into a crystal container, some lead may be released into the food or beverage. The quantity which is released depends on the amount of lead in the crystal, the type of food or beverage, and the length of time they are in contact with each other.
Acidic foods and beverages such as pickles, fruit juices, soft drinks, wine and port increase the amount of lead released. With less acidic foods and beverages, such as cheese, nuts, milk, scotch and vodka, less lead is released. The risk of lead release is lower if the crystal is only used over the course of a meal. Tests show that the amount of lead in both alcoholic and non-alcoholic beverages when consumed from a crystal glass during a meal is usually well below 0.2 parts per million, the maximum lead concentration allowed in food and beverages in Canada. However, lead concentrations of up to 20 parts per million - 100 times higher than the Canadian limit - have been found in wines kept for weeks in crystal decanters (Health Canada 2003).
Alternatives Alternatives for many of these uses exist. In those instances where an alternative is not available, steps can be taken to reduce the amount of lead released.

DRAFT
137
Ceramics/Pottery
Lead-free glazes are readily available and the industry is moving away from glazes which contain lead. Care needs to be taken with existing and particularly collectible items which are likely to have been manufactured using lead glazes. However, for those instances where lead is still necessary or contact remains, care should be used to prevent the transfer of lead from the ceramic or pottery item to any food eaten from or stored in the item.
Stained Glass Alternatives to the traditional use of lead in the manufacture of stained glass do exist. At the turn of the 19th century, the copper foil technique was developed and used extensively by individuals such as Louis Comfort Tiffany in the production of his stained glass lamps and other products. Copper foil is a viable alternative to lead and has fewer health concerns, but segments of copper foil or lead cames are often attached to each other using lead solder. The advent of lead-free solders has reduced the need for the use of lead solder in stained glass manufacture (Warner Stained Glass 2008). Resistance to the use of copper though remains with traditionalists who prefer to manufacture stained-glass using historical techniques. In these instances, great care needs to be taken to prevent exposure to the workers and transport of lead contamination from the work to home environment. Candle wicks The CPSC banned the use of wicks containing greater than 0.6% (600 ppm) lead,in 2003. Alternatives are readily available. Care needs to be taken however as candles manufactured in other countries and imported into the U.S. may not meet this standard. Fireworks Very few alternatives are currently available for fireworks containing lead. The U.S. Navy sponsored some work on alternatives to fireworks which contain lead but Ecology could find no indication that these alternatives are used outside of the military. The research was directed toward flares, fireworks and military warheads and may have limited consumer application (Elstrodt et al. 2003). Leaded crystal As mentioned in the Specialty Glass Section, the Danish Ministry of the Environment and Energy has conducted considerable work on lead and lead alternatives in support of the Danish ban on all uses of lead unless no viable alternative exists. As part of this effort, alternatives to lead crystal were evaluated and barium and zinc identified as suitable replacements for lead in crystal (Brønnum and Hansen 1999).

DRAFT
138
Groups Affected The groups and individuals affected by the use of lead in these products are:
· Artisan producers of pottery, ceramics and stained glass. · Owners of lead glazed ceramic products. · Residents and occupants where stained glass windows are installed. · Pyrotechnicians and other individuals involved in fireworks displays.
The level to which these groups are affected depends greatly upon the amount of lead to which each group is exposed. These conditions may vary considerably depending upon manufacturing, recycling and use conditions. Estimated Quantity The amounts of lead involved in these uses are unknown. Some applications may use products with high levels of levels of lead and the amount of lead released to the environment may be appreciable. For example, the traditional lead cames used in the manufacture of stained glass windows and other decorations is over 90% leaded. Mishandling of small amounts of this product can lead to appreciable releases of lead into the environment. End-of-Life No specific estimates are available for these products. Existing Programs/ Regulations Very few regulations exist on lead containing items used in the home or for hobby purposes. The Food and Drug Administration regulates the amount of lead that leaches from any item used to store or serve food. Therefore crystal used for these purposes is regulated. As mentioned earlier, the CPSC banned the use of lead wicks in candles. These two will be discussed in more detail below. Fireworks are the only items in this category which are regulated to any degree. Otherwise, most regulations have exemptions for activities which take place in the home and this exemption applies to most hobby uses of lead. Federal Candle Wicks The Federal Hazardous Substances Act (FHSA), 15 USC 1261-1278, grants the CPSC the authority to promulgate regulations to protect consumers from products containing hazardous substances. The FHSA was passed in 1960 and has been amended many times since. The Act requires that products contain cautionary labels stating the presence of any hazardous substance. The CPSC also has the authority to ban certain products containing hazardous substances. Any product intended for use by children and containing a hazardous substance that is accessible to a child is considered a banned hazardous substance. Under regulation (16 CFR 1500-1512), the

DRAFT
139
CPSC incorporates the lead-based paint restriction (16 CFR 1303) and bans the introduction into commerce of candles with metal core wicks that contain greater than 0.06% (600 ppm) lead. The regulations also provide guidance for lead in consumer products. It is designed to highlight lead-hazards faced by children (U.S. Environmental Protection Agency 1960). Fireworks The CPSC regulates fireworks used in or around the home and has banned several specific types of fireworks and firework products. The CPSC places extensive requirements on fireworks which, limit the amount of reactive material that each type of firework can contain and how the fireworks can be used. The CPSC also bans the sale of any fireworks that look like candy, food or other banned fireworks. The CPSC, however, has not placed any restriction on fireworks related to their lead content (U.S. Consumer Product Safety Commission 2001). Food The Food and Drug Administration (FDA) regulates lead under the authority of the Federal Food, Drug and Cosmetics Act (FFDCA). The FFDCA is a set of laws passed in 1938 by Congress and amended most recently in 2004. In order to ensure the safety of food, drug and cosmetic products, the FDA restricts the amount of lead in various products. In cans containing fruit, lead solder may not exceed 80 ppb lead. In all other cans, the solder may not exceed 250 ppb. Lead in foil capsules used for wine bottles is banned. The FDA also established restrictions on the concentration of lead that leaches from different pieces of ceramic-ware (U.S. Food and Drug Administration 2004). Washington Fireworks Washington State passed its own State Fireworks Law in 1995 (Chapter 70.77 RCW). The legislation places several restrictions on fireworks related to their use. Additional restrictions may be added by local authorities and several have banned the use of any fireworks except under special conditions (State of Washington 1995). As with the federal regulations, none of the Washington regulations place any restrictions on the lead content in fireworks.

140
This page intentionally left blank

141
Ongoing Releases In Washington, ongoing lead releases occur from permitted and non-permitted sources. Permitted facilities are allowed to release limited amounts of lead into air, land and water. Other releases of lead come from consumer products, such as lead wheel weights, fishing tackle, ammunition, and other consumer products. Actions that reduce lead use in products will also reduce the ongoing releases of lead. The foremost method of reducing ongoing lead releases is to reduce or eliminate lead use, as outlined in the sections on consumer products and occupational exposure. If there is no feasible alternative to lead-containing materials, then releases and exposures should be minimized. Some releases are mostly to one medium, but some are to several media, and there is movement of lead across media. For example, lead is not released into sediments, but lead that is released into water may end up in sediment. Lead is also present in the environment from past uses, such as lead arsenate pesticides, which moves among media. The movement of lead among media has not been quantified for the CAP. The Toxics Release Inventory (TRI) includes permitted estimated releases from facilities that discharge more than 100 lbs of lead from certain industries. The TRI database is part of the federal Emergency Planning and Community Right to Know Act to aid in community planning in case of an emergency and to generally inform the public about releases of toxic chemicals. More information about the database is at http://www.epa.gov/tri/index.htm. While the TRI database is an important source of information, the entries are estimates of releases and not necessarily direct measurements. Releases are reported in the following categories: air, water, land onsite (i.e. a landfill), sewage treatment, disposal, energy generation, and recycling. Different types of releases have different short and long term impacts. For example, onsite mining releases are to an engineered, triple-lined facility that will be capped and covered. Each type of release estimated in the TRI is discussed in more detail in the sections that follow. Table 18 summarizes the major releases in Washington of lead and lead compounds by SIC code for 2005. More TRI data can be found in appendix F.

142
Table 18- Summary of 2005 TRI (lbs)
SIC Industry Air Water Land Onsite Landfill Recycling
10 Metal Mines 678 286 4,432,980 7 0 99 Hanford 4 0 1,609,784 19549 34,000
33, 34 Metals 1493 0 1 14569 587,635 97 Military bases 804 589 144,900 15217 0 49 Electric, gas, and refuse 70 1 67,400 49022 6 26 Pulp and paper mills 1118 2022 1690 85953 211 38 Measuring, analyzing and
control instruments 0 0 0 13957 20,458 36 Electronic (non-computer)
includes batteries 19 0 0 651 33,395 32 Concrete and glass products 660 3 4794 3860 542 39 Misc. manufacture- includes
specialty glass 58 0 0 2057 0 29 Petroleum refining 431 73 85 224 112
Other 294 5 0 2638 20,499 Totals 5628 2979 6,261,634 207,704 696,858
Air Lead particulates can be suspended for up to 10 days and the distance traveled depends on the particulate size (U.S. Environmental Protection Agency 2002). Releases of lead into the air fall and contaminate water, soil and sediment. The largest releases of lead into the air in Washington are from aviation gas for propeller planes (not jet fuel), high energy users such as paper mills, and metals facilities. National Standards Lead is one of six criteria air pollutants under the Clean Air Act. The National Ambient Air Quality Standards (NAAQS) for lead was set in 1978 at 1.5 µg/m3 for the average quarterly concentration. In October 2008, the standard was dropped to 0.5 µg/m3 and the method for averaging changed to evaluate a maximum concentration over “rolling” three month periods within a three-year period. Statewide monitoring for lead as a criteria air pollutant has not been conducted since 1999, but new air monitoring will be needed to verify conformance with the new standard. Prior to the late-1980’s there were levels of air lead above the federal standard from a smelter on Harbor Island in Seattle, but that smelter ceased operation in 1998 (Puget Sound Clean Air Agency 2006). Ecology does have some measurements of lead in Washington as part of particulate matter testing. Recent data collected from 2001-2002 in the Seattle area show that the median air lead level was 0.0035 µg/m3, which is more than 100 times lower than the new federal standard.

143
When the EPA developed its lead standard in 1978, the aim was to prevent 99.5% of children from having a BLL over 30 µg/dL (California Air Resources Board 2000), which was the CDC level of concern at the time. In 2000 the California Office of Environmental Health Assessment (OEHHA) prepared a report for the California Air Resources Board (CARB) on lead air quality standards and children’s health. OEHHA examined the relationship between air lead concentrations and blood lead levels using data from a variety of air models and the national data from NHANES III. Their model predicts that more than 45% of California’s children aged one and two would be above the CDC level of concern of 10 µg/dL if the air lead level was at the federal limit of 1.5 µg/m3. A national average air lead of 0.055 µg/m3 was predicted to result in 1% of California’s children aged one and two having BLLs above 10 µg/dL. The California OEHHA also estimated that the mean annual 1990-1991 statewide population-weighted airborne lead exposure of 0.06 µg/m3 led to 26,000 additional cases of hypertension and an additional 72 deaths from cardiovascular related disease per year among the 8 million adults in California between the ages of 40 and 59 (California Office of Environmental Health Assessment 1996). Non-point Sources In the past, the largest source of lead in the air was from the combustion of leaded gasoline. Tetra-ethyl lead (TEL) was added to gasoline to improve performance from 1920’s until it was phased out from 1973-1995 (U.S. Environmental Protection Agency 1996). TEL itself is not a persistent environmental compound, but it breaks down in into inorganic lead compounds that are persistent, as are the inorganic lead compounds emitted as exhaust. Since Jan. 1, 1996 trace amounts of lead have been limited to 0.05 g/gallon gasoline for on-road vehicles (Federal Register 1996). Table 19 presents information from the Bureau of Transportation Statistics (Bureau of Transportation Statistics 2002;U.S. Environmental Protection Agency 2003) and shows 221 thousand tons of lead was released into the air in 1970 and 172 thousand tons (78%) was from highway vehicles. The second largest source was 26 thousand tons from industrial processes, such as chemical manufacture and metals processing. By 1980, the amount of lead released from on-road vehicles had decreased to 61 thousand tons, and has remained at 20 tons since 1991. During that same time period the amount of lead released from aircraft has gone from 1.4 thousand tons in 1970 to 0.9 thousand tons in 1980 and has remained about approximately 0.5 thousand (U.S. Consumer Product Safety Commission 2001) tons since 1991. Table 19- Estimated National Emissions of Lead to Air (thousands of tons) (Bureau of Transportation Statistics 2002)
1970 1980 1986 1988 1990 1992 1994 1996 1998 2000 TOTAL all sources 220.88 74.16 14.77 7.05 4.98 3.81 4.05 4.08 4.06 4.23 Transportation, total 173.36 61.39 11.06 3.24 1.04 0.59 0.55 0.52 0.52 0.56 Highway vehicles 171.96 60.50 10.25 2.57 0.42 0.02 0.02 0.02 0.02 0.02 Aircraft 1.40 0.89 0.81 0.67 0.62 0.57 0.53 0.51 0.50 0.55 Nontransportation, total 47.52 12.77 3.71 3.81 3.94 3.22 3.50 3.55 3.54 3.66 Fuel combustion 10.62 4.30 0.52 0.51 0.50 0.49 0.50 0.49 0.49 0.50 Industrial processes 26.36 3.94 2.13 2.27 2.48 1.92 2.18 2.27 2.24 2.35 Waste disposal and recycling 2.20 1.21 0.84 0.82 0.80 0.81 0.83 0.79 0.81 0.81 Miscellaneous 8.34 3.32 0.22 0.21 0.16 <0.01 <0.01 <0.01 <0.01 <0.01

144
The 1990 Clean Air Act Amendment prohibited use of lead in on road vehicles as of Jan. 1, 1996, but had a temporary exemption for other vehicles, such as aircraft. Boats and farm equipment, though permitted to use leaded gasoline, typically use commercially available non-leaded fuels. As mentioned in the section on Consumer Products, lead is still used in some fuels. NASCAR has phased out the use of lead but lead may still be used legally in off road vehicles, such as small planes. The National Motor Sports Council estimated that approximately 100,000 gallons of leaded gasoline were used by NASCAR in 1998 (U. S. Environmental Protection Agency 2002), plus leaded additive was added to some unleaded gasoline. Racing fuels have about 4.2 g of lead (4 ml of TEL) per gallon (U.S. Environmental Protection Agency 2002;Sunoco 2008), which leads to an estimate of 925 lbs of lead used nationwide in the leaded racing fuel in 1998. Washington State is likely to use less leaded fuel for racing than other states. Washington State does not have any NASCAR tracks, but we do have other automobile racing tracks which are associated with NASCAR. Due to the unavailability of leaded fuel for cars in Washington, it is unlikely that much leaded fuel is used on these tracks. The American Boat Racing Association (ABRA) is the sanctioning body for the Unlimited Hydroplane races in Seattle and Tri Cities and their vehicles do not use leaded fuel (personal communication). Using data on Avgas sales from the Washington State Department of Transportation (personal communication), 27 tons of lead were released in Washington for the fiscal year July 2005-June 2006. This was calculated from 11,437,010 gallons of Avgas sold for use in Washington and 0.56 g of lead per liter (2.1g/gallon) of gasoline. Avgas 100LL is the most commonly used aviation gasoline and contains 2.1g of lead per gallon (U. S. Environmental Protection Agency 2002). As mentioned previously, there is still some international use of leaded gasoline which affects Washington through lead contaminated food. In 2005 Ecology estimated 0.034 tons (68 lbs) of lead was released into the air from residential fuel oil heating, and 0.056 tons (112 lbs) from locomotives. Point Sources While the Clean Air Act and subsequent amendments have drastically reduced the amount of lead that is released from gasoline, less progress has been made in reducing releases from other sources. From 1970 to 1980 the amount of lead released from non-transportation sources went from 48 to 13 thousand tons. It has remained at about 4 thousand tons since 1985. Due to the decrease in lead use in gasoline, industrial processes now account for the largest share of lead emissions (U.S. Environmental Protection Agency 2003;Bureau of Transportation Statistics 2002). According to the Washington Toxics Release Inventory (TRI), 5628 lbs of lead and lead compounds were released in Washington. In 2005, the largest permitted releases of lead into the air (in lbs.) from point sources are from pulp and paper mills (1118), mines (678), primary metal

145
industries (889), military bases (804), glass and concrete manufacturing (660), fabricated metal industries (604), petroleum refining (431), and lumber and wood products. TRI data is limited in that they are estimates (not measurements) of legal lead releases over 100 lbs from certain companies. Many of the releases are from dilute concentrations of lead that are present in fuel and raw materials such as trees. Similar amounts of released lead were measured in Ecology issued Air Quality permits. When these permits are issued, the incremental impact of adding the permitted releases to the current level of lead in the air are considered, so the effects of multiple sources in the same area are taken into account. The Pend Oreille lead mine is Washington’s only currently active lead mine and it estimated that it released 677 lbs of lead into the air. The other active mine in Washington is the K2 gold mine, which has much lower estimates for lead releases in general. The ore from the Pend Oreille lead mine is smelted in Trail, B.C. Industries such as pulp and paper mills and concrete manufacturing release large amounts of lead into the air from burning large amounts of fuel. The estimates are derived from emission factors for the types of fuel used. Some industries use tire derived fuel (TDF) as an energy source. Tires contain about 65 ppm lead (Gray 2004) and use of TDF releases lead into the air. The EPA studied emissions from TDF, including lead, and concluded that the emissions from 10-20% TDF should be similar to other fossil fuels, as long as combustion occurs properly in a well-designed, well-operated and well-maintained facility (U.S. Environmental Protection Agency 1997). Cement kilns are the largest users of TDF because the boilers operate at higher temperatures, with higher residence times and higher oxygen, and the leftover iron can be utilized in the cement. TDF poses more difficulties for boilers, such as in utilities, pulp and paper mills, and general industrial boilers. For example, pulp and paper mills are set up to burn wood waste and TDF lowers the emission quality (U.S. Environmental Protection Agency 1997). Washington motorists generated approximately 5 million waste tires in 2005, using the industry standard of one waste tire generated per person. If each used passenger tire weighs approximately 20 lbs and contains 65 ppm lead, an estimated 3 metric tons of lead would be released each year if all the tires were burned and none of the lead was recovered in the particulate matter controls. Water Toxicity test data conducted on a variety of aquatic organisms are used to develop water quality standards. Water quality standards are set to protect essentially all the species in a given aquatic community, including the more sensitive species, from any adverse affects over their full life span. Ecology uses the levels specified in EPA’s Quality Criteria for Water. For freshwater with a hardness of 100 mg/L, the criteria are 65 µg/L (65 ppb) for acute exposure and 2.5 µg/L for

146
chronic exposure (the toxicity of lead to aquatic organisms depends on the hardness of the water). For saltwater, the criteria are 210 µg/L for acute exposure and 8.1 µg/L for chronic exposure. Point Sources According to the 2005 Washington Toxics Release Inventory (TRI), 2,977 lbs of lead and lead compounds were released into water in Washington. The largest permitted releases of lead into water (in lbs.) from point sources are from pulp and paper mills (2,022), military bases (589), the Pend Oreille mine (677) and petroleum refining (73). The estimated release from pulp and paper mills is high because they use a lot of water. A mill may measure the lead content in released water once a year and then multiply the concentration by the amount of water used. For example 1 ppb lead multiplied by 67 million gallons of water per day results in an estimate of 204 lbs of lead released into the water per year. We do not know if the lead was added to the water in the mill or if the lead was in the water prior to the mill’s use. Stormwater Stormwater is rain and snow melt that runs off surfaces and may pick up pollution. Stormwater might flow directly into a local stream, bay, or lake or, it may go into a storm drain and continue through storm pipes until it is released untreated into a local waterway. Contaminated stormwater may affect the health of people and wildlife. More information on lead in stormwater is included below in the section on multi-media releases of lead. Certain stormwater discharges require a National Pollutant Discharge Elimination System (NPDES) permit or water quality discharge permit. EPA delegated Ecology the authority to implement these permits in Washington State. Ecology regulates stormwater discharges from industries and construction sites under separate general permits. Both permits require the development and implementation of a Stormwater Pollution Prevention Plan (SWPPP). Construction sites that disturb more than 1 acre of land require a construction stormwater permit. Certain municipalities are required to get a municipal stormwater permit. The permits require permittees to develop and implement a public education and outreach program. The goal of these programs is to reduce or eliminate behaviors and practices that cause or contribute to stormwater pollution. Certain industries require an industrial stormwater permit. Ecology reviewed data on lead and other contaminants in stormwater as part of the evaluation of the Industrial Stormwater General Permit (ISWGP) (EnviroVision and Herrera Environmental Consultants 2006). The report classified lead in stormwater as being of low concern because less than 20% of the collected samples were above the benchmark value of 81.6 µg/L (ppb). Action levels are set at one standard deviation above benchmarks and the current action level for lead is 159 µg/L. Washington’s benchmarks, adopted from the EPA, are not designed to be effluent limits, but as indicators, and are based on acute freshwater ambient water quality criteria. Under the current

147
ISWGP collected industrial stormwater samples are always monitored for zinc and lead is assayed if zinc concentrations are found to be high. The fact sheet for the ISWGP also includes data on lead in stormwater by type of industry, by using SIC codes. Data from the fact sheet has been put into Table 20 below. All values are in µg/L (ppb) Table 20- Lead in Stormwater by Industry
SIC Name # Facilities
# Values
Min Value (µg/L)
Median Value (µg/L)
Max Value (µg/L)
Exceedance of
Benchmark
Exceedance of Action
Level 10 Metal Mining 1 1 13.9 13.9 13.9 0% 0% 17 Construction
Special Trade Contractors
3 11 1.7 33 70 0% 0%
20 Food and Kindred Products
82 55 0.05 10 200 4% 2%
22 Textile Mill Products
3 5 6 6 7.56 0% 0%
24 Lumber and Wood Products
127 67 0.006 8 332 3% 3%
26 Paper and Allied Products
14 8 1 40 110 13% 0%
28 Chemicals and Allied Products
40 43 2 40 597 12% 9%
30 Rubber and Plastic Products
37 33 0.08 7 40 0% 0%
32 Stone, Clay and Glass Products
23 4 25 25 40 0% 0%
33 Primary Metal Industries
13 48 0.01 10 1240 21% 8%
34 Fabricated Metal Products
62 192 0.02 25 3000 11% 5%
35 Industrial and Commercial
Machinery and Computer Equipment
28 1 1.7 1.7 1.7 0% 0%
36 Electrical Products
7 8 1.44 6.5 78 0% 0%
37 Transportation Equipment
33 122 0.01 3.3 89.7 1% 0%
39 Misc. Manufacturing
6 4 1.8 4 5.7 0% 0%

148
SIC Name # Facilities
# Values
Min Value (µg/L)
Median Value (µg/L)
Max Value (µg/L)
Exceedance of
Benchmark
Exceedance of Action
Level 40 Railroad
Transportation 11 8 1.5 40 81 0% 0%
41 Local and Interurban Passenger
Transportation
23 9 1 4.5 40 0% 0%
42 Motor Freight Transportation
and Warehousing
108 111 2 15 289 6% 4%
44 Water Transportation
30 27 0.05 13 144 11% 0%
45 Air Transportation
41 15 25 40 50 0% 0%
49 Electric, Gas and Sanitary
Services
62 57 0.9 7 110 3% 0%
50 Wholesale Trade-Durable
Goods
63 186 25 3730 22% 10%
50 Recycling Facilities
64 178 0.1 25 3730 21% 11%
51 Wholesale Trade-
NonDurable Goods
23 13 2 20 81.6 0% 0%
95 Environmental Quality
Programs
1 4 1.6 2 7.6 0% 0%
Uncharacterized 26 19 0.007 10 576 11% 11% Soil The FDA standard for lead in soil is 400 ppm for residential areas and 1,200 ppm in other areas. The Washington State clean up levels are lower. The MTCA method A clean up level for lead in soil is 250 ppm and 1,000 ppm for industrial sites. See the sections on legacy lead in soil and the Area-Wide Contamination for more details about how Washington defines low to moderate levels of lead in soil.

149
Point Sources The TRI requires separate estimates of releases to land releases on site from amounts that are transferred for disposal or recycling. According to the 2005 Washington Toxics Release Inventory (TRI) 6,257,925 lbs of lead and lead compounds were released into soil on site in Washington. The largest permitted releases (in lbs.) from point sources are from mining (4,432,980), Hanford (1,609,784), military bases (144,900), and electric, gas and refuse (67,400). The Pend Oreille mine has a large estimated release to land on site. This material is treated, then placed in a hazardous waste disposal landfill with safety measures such as triple-liners, leachate collections systems and groundwater monitoring. The Pend Oreille mine estimates only 7 lbs of lead compounds were transferred off site for disposal. Hanford also has most of its land releases in a controlled landfill onsite. The 2005 TRI estimate for transfers for disposal was 207,704 lbs and the largest point sources are pulp and paper mills (85,953), electric, gas and refuse (49,022), Hanford (19,549), military bases (15,217), metals (14,569) and measuring, analyzing and control instrument manufacturing (13,957). Sediment Lead releases to sediment are not tracked, but lead released from air, water, and soil sources may eventually end up in sediment. As mentioned in the section on background concentrations of lead in Washington, sediments are the largest global reservoir of lead (Eisler 1988). Multimedia Toxics in Puget Sound Hart Crowser, Ecology, EPA, and Puget Sound Partnership released a report in Nov. 2007 on the Control of Toxic Chemicals in Puget Sound and lead was included as one of the 17 toxic chemicals (Hart Crowser, Inc et al. 2007). This first-phase study estimated lead loadings using land uses and average deposition rates to provide insights about the relative importance of various pathways to help direct further management and study. The phase I initial estimates for lead loading are 89 metric tons from runoff, 31 metric tons from atmospheric deposition, 0.11 metric tons from sewage treatment plants, 4.6 metric tons from industrial sources, and 0.14 metric tons from combined sewer outfalls. These median values were estimated using the 50% probability of exceedance (POE). Phase 2 built on the initial Phase 1 investigation to further refine the loading estimates, examine chemical transport and fate, and provide some of the foundation for assessing risks to human health and the ecosystem. Not all of the results from the eight sub-tasks in Phase 2 have been reported. Surface runoff appears to be the largest source of lead and other toxics to Puget Sound. Phase 2 Sub-Task 2A was an analysis of toxic chemical loading to Puget Sound from surface runoff, with an emphasis on roadways ( EnviroVision Corp. et al. 2008). Absolute loading for lead ranged from 74 to 530 metric tons per year. Phase 2 estimated the median lead loading of

150
197 metric tons per year from surface runoff. Residential areas were the largest source (67 percent). Forest/field/other areas, agricultural areas, and commercial/industrial areas were relatively minor sources with contributions of 9 to 10 percent. Highways contributed only 6 percent of the total load. However, lead concentrations do not follow this pattern. By far the highest lead concentrations were found in stormwater runoff from highways (46 μg/L). The next highest concentration was 20μg/L for the commercial/industrial land use category. The residential land use category had a concentration of 10 μg/L, followed by the agricultural and forest/field/other land use categories with concentrations of 5.0 μg/L and 0.50 μg/L, respectively. Phase 2 Sub-Task 2B refined our understanding of the wastewater loading pathway ( EnviroVision Corp. et al. 2008). This Phase 2 analysis used more facilities and more recent monitoring data compared to Phase 1. The primary conclusion from this Phase 2 analysis is that the contributions of toxic chemicals from permitted wastewater dischargers were found to be small relative to the total loadings from the major loading sources to Puget Sound. The total lead loading from wastewater point sources to Puget Sound from both municipal and industrial discharges was estimated to be about 1.6 metric tons/year. Municipal sources contributed most of the lead loading from permitted wastewater dischargers (69 percent or 1.1 metric tons/year). Total industrial lead loading was about 0.5 metric tons/year. These values may underestimate the total loading since not all facilities were represented. In Phase 3, Ecology and other partners will collect and analyze environmental samples to further improve the numerical model of Puget Sound with the new data. People for Puget Sound released a study on Toxic Chemicals in Puget Sound (People for Puget Sound 2008). This study evaluated 103 sewage treatment plants and 15 major industrial facilities for toxic loading and use of mixing zones. The use of mixing zones allows the permitee to meet water quality criteria at the edge of the mixing zone, rather than at the end of the pipe. This study estimated yearly lead loadings of 3.3 metric tons from sewage treatment plants and 0.3 metric tons from industrial sources. In order to examine the link between outfall discharges and sediment quality, they compared the estimated loadings to Ecology’s SEDQUAL database. As mentioned above, the TRI estimate for lead releases into water for Washington State is 2,977 lbs or 1.4 metric tons from 30 facilities. Ten of the 15 facilities in the People for Puget Sound study are on the TRI and their sum is 1,707 lbs of lead and lead compounds. The TRI estimate may be higher than the report estimate because there are no negative consequences for overestimating releases for the TRI and because the weight of other material is included in the estimate for lead compounds. Sewage treatment After sewage treatment, lead may be found in both the discharged water and in the biosolids. Two recent studies evaluated lead in sewage waste water discharged into Puget Sound. Phase 2 of the Control of Toxic Chemicals in Puget Sound Study estimated 1.1 metric tons per year of lead discharged ( EnviroVision Corp. et al. 2008). People for Puget Sound estimated 3.3 metric tons per year (People for Puget Sound 2008). The estimate in the People for Puget Sound report
151
may be high because it used the maximum concentration where no average concentration was reported and extrapolated missing values based on similar sewage treatment plants. The actual amount of lead that enters Puget Sound from wastewater treatment facilities is likely to be between 1.1 and 3.3 metric tons per year and we have used an average value of 2 metric tons per year to estimate this. Ecology tracks how much lead is in biosolids so it can be safely used as a soil amendment or fertilizer. Federal law allows the use of biosolids as fertilizer if the concentration of lead is less than 300 ppm. Biosolids with higher concentrations of lead may still be used as fertilizer, but the field locations must be tracked. If the lead concentration exceeds 840 ppm, then the biosolids must be disposed of as a hazardous material. In 2006, 4.5 metric tons of biosolids were generated in Washington with an average concentration of 45 ppm. The most recent Ecology estimates on the amount of lead in biosolids that were applied as fertilizer is from 2004. An estimated 84,606 dry tons of biosolids were applied to 13,882 acres. The average lead concentration was 52 mg/kg (or 0.104 lb/dry ton). The estimated amount of lead applied via biosolids in 2004 was 8,799 lbs or about 0.63 lb of lead per acre. The concentration of lead in biosolids has been declining. Ecology data shows that in Washington the average concentration has gone from 99 ppm in 1995 to 45 ppm in 2006. King County has seen a similar decline in lead concentration in biosolids. In their 2006 biosolids quality report(King County Department of Natural Resources and Parks 2007), King County credits the reductions in metals, including lead, to ongoing corrosion control projects, waste management and pretreatment programs, and to the removal of lead from gasoline. Figure 10 is reproduced from the King County report and shows this decline in lead in biosolids in King County.

152
Figure 10- Trend in Annual Average Lead Concentrations in Biosolids from the West Point Treatment Plant 1988-2006 Products Some of the largest ongoing releases of lead are from products, as seen in table 21. The details for each estimate are in the section on consumer products. Releases from products are mostly to soil, but some lead eventually goes into water and then sediment.

153
Summary The table below is a summary of ongoing releases from different sources detailed in this section and the section on consumer products. Table 21- Summary of Ongoing Releases of Lead
Source Amount (Tons) Medium Point sources Mining 2217 air, land, water federal facilities 895 air, land, water high energy users 52 air, land, water Remaining TRI reporters 68 air, land, water Metals 8 air, land Biosolids 5 land, water sewer wastewater 2 land, water other users ? air, land, water stormwater ? land, water Non point sources Batteries not recycled 600 land, water lead shot 550 land, water fishing weights 60 land, water wheel weights 40 land, water aviation fuel 27 air, land, water other products ? air, land, water air, land, water Legacy sources ? air, land, water


154
V. Research and Monitoring Current and Historical Research Ecology and other agencies include lead in many of their ongoing environmental monitoring efforts described below. Ecology also requires measurements for lead in many, but not all, permits for discharging pollutants into air, water, and land. Ecology and local air agencies share regulation of air discharges. Historical monitoring efforts by Ecology number in the hundreds. Reports or data from many of the historical studies and current studies can be accessed through Ecology websites or databases using “lead” as a search term. Ecology’s Environmental Information Management system (EIM) contains results and links to reports from many historical and ongoing studies (http://www.ecy.wa.gov/eim/). Control of Toxic Chemicals in Puget Sound Ecology is working in collaboration with the Puget Sound Partnership and other state and Federal agencies to deliver three phases of scientific data related to toxic chemicals that will help identify actions to restore Puget Sound. Lead is one of the 17 toxic chemicals included in the study. Phases 1 and 2 developed loading estimates based on an in-depth review of existing data. Phase 3 will include sampling of a variety of contaminants and pathways. This phase will be completed in late 2010. http://www.ecy.wa.gov/programs/wq/pstoxics/index.html PSAMP The Puget Sound Assessment and Monitoring Program has provided a scientific foundation for the conservation, recovery, and management of the Puget Sound Ecosystem since 1989. PSAMP is an extensive, network of regional scientists from numerous agencies, including Ecology. They monitor key indicators of water and sediment quality, nearshore habitat, and the health or abundance of fish, seabirds, shellfish, and marine mammals. Lead is included in PSAMP monitoring efforts. http://www.psp.wa.gov/psamp.html Mussel Watch Marine mussels at about 20 sites in Washington are monitored through NOAA’s Mussel Watch Program. Lead is included as a target analyte. http://www8.nos.noaa.gov/cit/nsandt/download/mw_monitoring.aspx River and Stream Water Quality Monitoring Ecology's Environmental Assessment Program has conducted monthly water-quality monitoring at hundreds of streams throughout the state since 1959. Metals monitoring, including lead is currently conducted bimonthly at about 12 of the stations. http://www.ecy.wa.gov/programs/eap/fw_riv/rv_main.html

155
Asarco Tacoma Smelter Plume For almost 100 years, the Asarco Company had a copper smelter in Tacoma. Air pollution from the smelter settled on parts of King, Pierce, Kitsap, and Thurston counties. Arsenic and lead are still in the soil. Some child play areas have arsenic and lead in amounts that are a health concern. In 2005, the legislature passed a law to keep children safe from polluted soil. The Soil Safety Program is one result of this new law. The Soil Safety Program provides:
· Free soil testing at all schools and childcares in the Soil Safety Program Area. · Free design assistance, labor and materials to put soil safety action in place at schools and
childcares with arsenic or lead above state standards. · Educational materials for teachers and childcare providers regarding how to keep
children safe from arsenic and lead in soils. http://www.ecy.wa.gov/programs/tcp/sites/dirt_alert/soilSafety/SoilSafety.htm Specific test results are available at: http://www.ecy.wa.gov/eim/ Environmental Toxics Monitoring Ecology's Environmental Assessment Program conducts monitoring to evaluate the occurrences and risks from toxic chemicals in Washington's environment. There are several ongoing studies, and many historical studies, that include lead as a target analyte. Website for general toxics monitoring: http://www.ecy.wa.gov/programs/eap/toxics/index.html Trends in Lead This project aims to evaluate trends in lead in suspended particulate matter at 15 sites around the state beginning in spring 2008. http://www.ecy.wa.gov/pubs/0703104add1.pdf Depositional History of Mercury (and lead) in Selected Washington Lakes Determined from Sediment Cores This project collects sediment cores and surface sediments from three lakes per year to better understand past and current deposition of mercury and lead in lake sediment. Lead was included in this project starting in 2008 http://www.ecy.wa.gov/biblio/0703104add1.html Lead Contamination in North Creek, Pierce County This study addresses concerns about lead and copper contamination in a suburban stream. http://www.ecy.wa.gov/biblio/0803038.html Wastewater and Stormwater Most wastewater and some stormwater discharges require a National Pollutant Discharge Elimination System (NPDES) permit or water quality discharge permit. The permit describes what

156
the discharger must do to protect the water and what types of monitoring and reporting the discharger must perform, and limits the pollutants that can be discharged. The requirement for a permit is triggered by the types of business activities. Information on the hundreds of permitted discharges in the state can be found at: http://www.ecy.wa.gov/programs/wq/permits/index.html#wastewater_individual_permits Monitoring results and other data from individual permits are stored in the WPLCS database: http://www.ecy.wa.gov/programs/wq/permits/wplcs/index.html Upper Columbia River – Lake Roosevelt The U.S. Environmental Protection Agency is studying hazardous waste contamination in the Columbia River from the U.S./Canada border to the Grand Coulee Dam and surrounding upland areas. The study is called a Remedial Investigation and Feasibility Study (RI/FS). For more info see the EPA website: http://yosemite.epa.gov/R10/CLEANUP.NSF/sites/upperc Other Lakes Lead has also been included in studies of fish tissue and sediments in other lakes. 1989 Lakes and Reservoir Water Quality Assessment Program: Survey of Chemical Contaminants in Ten Washington Lakes: http://www.ecy.wa.gov/biblio/90e35.html Survey of Chemical Contaminants in Ten Washington Lakes: http://www.ecy.wa.gov/biblio/94154.html


157
VI. Current Regulatory and Management Approaches for Lead
Introduction This chapter describes the existing regulations relevant to lead at the federal, state (both Washington and other states) and international levels. It includes a brief summary of many known laws and regulations directly related to the management, transport, storage, disposal, environmental and human health monitoring, and safety standards related to the use and application of lead. In many instances, federal laws and regulations pass the authority for implementing these laws and regulations on to state or Tribal governments. In some cases, states adopt laws and promulgate regulations that are more stringent than their federal partners. While this chapter aims to be comprehensive, it is not an exhaustive review of all of the regulations pertaining to lead. New legislation is continuously being proposed and passed. Washington has established some lead laws and regulations that are more restrictive than federal standards. Other Washington State laws and regulations are equivalent to the federal. Washington has adopted various laws and regulations that overlap with many Federal laws. Table 22 identifies a few Federal laws, their equivalent in Washington State and the Agency in Washington responsible for implementing the regulations. This list is neither exhaustive nor complete but is meant to give an indication of how some of the major environment regulations relate at the Federal and State levels. Table 22- Selected Federal and State Laws
Federal Regulation Washington Equivalent/Responsible
Agency The Clean Air Act Washington Clean Air Act (RCW 70.94) The Clean Water Act Water Pollution Control (RCW 90.48) Resource Conservations and Recovery Act (RCRA).
Dangerous Waste Regulations (WAC 173-303)/Ecology
Comprehensive Environmental Response, Compensation and Liabilities Act (CERCLA or Superfund)
Model Toxics Control Act (WAC 173-340)/Ecology
Environmental Protection and Community Right-to-Know Act (EPCRA)
Hazardous Chemical Emergency Response Planning and Community Right-to-know Reporting (WAC 118-40)/Ecology
The Occupational Safety and Health Act (OSHA) requirements.
General Safety and Health Standards (WAC 296)/Labor and Industries
Additional information on Federal and state regulations is provided in the subsequent sections of this chapter.

158
Washington State and Federal laws and regulations regarding lead differ and typically Washington regulations are more restrictive than their Federal equivalents. For example, cleanup of contaminated soils is very different between the two. Under the Toxics Substances Control Act (TSCA), the standard for lead in residential soils in play areas is 400 ppm. In all other residential soils, the standard is 1,200 ppm. The State of Washington takes a different regulatory position. All residential soils must be below 250 ppm and commercial and industrial soils under 1,000 ppm as established by the Model Toxics Control Act. Soil cleanup levels vary tremendously from state to state. Typically, states develop specific cleanup levels for different types of land uses. Residential cleanup levels are, for the most part, more restrictive than industrial and commercial site remediation. Iowa, Maryland, Massachusetts and New Hampshire implement one remediation standard for all soil cleanup157, 181,187,220. The State of Washington regulates the amount of lead permissible in sediments for which no Federal regulations exist. In Washington, the marine sediment quality criterion for lead is 450 ppm which is used as a “sediment quality goal” for lead-contaminated sediments in Washington. The cleanup level for lead is 530 ppm. This value used as an “upper regulatory level” for source control and cleanup decision making for lead contaminated sediments. Generally, state drinking water action levels align with the federal action level of 15 ppb. However, two states have adopted standards that are more restrictive than the federal action level. Maine and Maryland regulate lead in drinking water at action levels of 10 and 5 ppb, respectively173,180. States also adopt laws and regulations for more specific uses of lead. Forty-one states implement some sort of lead-acid battery regulation to facilitate safe disposal and recycling. Nineteen states have laws and regulations that address the issue of toxics in packaging. Another area of lead regulation is the banning of lead shot in designated areas. As of May 2008, 24 states have banned lead shot in designated areas covering more than 1.3 million acres across the U.S. (Minnesota Department of Natural Resources 2008) Federal regulations include requirements for the appropriate disposal of lead-acid batteries. Washington State regulations require a more restrictive lead-acid battery recycling program. The State imposes a core charge at the purchase of a lead-acid battery that is refunded once a used lead-acid battery is returned in its place. Retailers and manufacturers are required to send the batteries off for lead reclamation and recycling or to dispose of lead-acid batteries as dangerous waste. Washington passed a statute in 1991 limiting the amount of four metals in packaging materials. There is no federal counterpart to this statute although 19 states have adopted similar legislation. (Toxics in Packaging Clearinghouse 2005) While there is no regulation for this statute, the RCW mandates that intentional addition of cadmium, lead, hexavalent chromium and mercury to packaging is not allowed and that the incidental levels for the sum of the four metals be less than 100 ppm.

159
In addition to the Federal RCRA requirements, the Washington Dangerous Waste Regulations include state-specific disposal restrictions. . Generators must evaluate the toxicity of their waste using criteria specified in the regulations (WAC 173-303-100 (5)) in order to determine the need for special handling for any wastes generated or disposed of within the state. Another significant regulatory area is the proper disposal of electronic waste. Ten states have passed electronic waste legislation. Most recently, North Carolina passed the Solid Waste Management Act, which contains a clause for electronic waste242. The main difference between these electronic waste laws is the approach to funding. Usually, manufacturers must ensure the safe disposal of the electronic equipment. However, consumers in California bear the financial burden108. A particularly important lead issue is the continued presence of lead-based paint in older homes. Many states promulgate regulations to govern lead-based paint abatement. In addition, some states developed lead poisoning prevention programs to help minimize childhood exposures to lead. Lead poisoning prevention programs often aim to reduce exposure past a certain point. This level varies from state to state. Recently, New Hampshire lowered the limit of blood lead levels that require action by the State to 10 ppb225.

160
Federal Lead Laws and Regulations 42 United States Code 4851 et seq., Residential Lead-Based Paint Hazard Reduction Act1 This statute, commonly referred to as Title X, was passed by Congress in 1992 as part of the Housing and Community Development Act. It amends the Lead-Based Paint Poisoning Prevention Act initially enacted in 1971. Passage of this act grants the Secretary of Housing and Urban Development (HUD) the authority to issue grants and/or loans on a priority basis to both federally-assisted and -owned properties as well as privately-owned housing. These grants can be used to implement interim controls, conduct risk assessments or perform lead abatement services. Section 1018 of the Act requires that information regarding lead-paint hazards and any known lead-paint hazards be disclosed to buyers and renters prior to when sales or leases are finalized. The Act includes a worker safety provision that requires the Secretary of Labor to promulgate regulations for lead safety that amend the Occupational Safety and Health Act. The Environmental Protection Agency (EPA) and HUD jointly published regulations (40 CFR 745 and 24 CFR 35) addressing, among other activities, notification, abatement and inspection of lead-based paint hazards. 15 U.S.C. 2681 et seq., Lead-Based Paint Exposure Reduction Act2 Passed by Congress in 1992, this act amended the Toxic Substances Control Act by creating a new title – Title IV Lead Exposure Reduction. The Administrator of the EPA must promulgate regulations to address accreditation of lead training programs, required content of training programs, standards for lead-paint hazards, adoption of authorized State programs, environmental laboratory standards and issuance of a lead hazard information pamphlet. 40 Code of Federal Regulations 745, Lead-Based Paint Poisoning Prevention in Certain Residential Structures3 In 1992, EPA promulgated regulations concerning residential lead-based paint under the authority of 42 USC 4851 et seq. and 15 USC 2681 et seq. The purpose of these regulations is to provide lead-safe housing, especially for children. These regulations include definitions for lead paint hazards in soil and dust, requirements for the training of abatement workers, standards for accreditation programs and work practice safety measures. Additionally, renovators must provide notification to the home owners when undergoing lead abatement work. The regulations also establish procedures for implementing approved State and Tribal training and accreditation programs. 24 CFR 35, Residential Lead-Based Poisoning Prevention in Certain Residential Structures4 In 1992, HUD promulgated regulations concerning residential lead-based paint under the authority of 42 USC 4851 et seq. and 15 USC 2681 et seq. These regulations define several measures to promote the safety of residential housing. These measures include: required disclosure notification and lead hazard pamphlet materials; environmental intervention blood lead levels for children; intervention procedures; inspection requirements; abatement measures;

161
and interim control specifications. The regulations prohibit people from using certain paint removal techniques at residential housing units. In addition to 40 CFR 745, this regulation also includes safe work practice standards. 16 CFR 1303, Ban of Lead-Containing Paint and Certain Consumer Products Bearing Lead-Containing Paint5
Implemented in 1978, the Consumer Product Safety Commission restricted the amount of lead in paint to a maximum of 600 ppm. This restriction applies to consumer products (defined in section 3(a)(1) of the Consumer Product Safety Act), toys, furniture and products sold to consumers for use in homes, schools, parks, hospitals and other areas. There are two types of exemptions to this regulation, those requiring labels and those that need no labeling. This regulation does not apply to boats or cars. In August 2008, Congress passed the Consumer Product Safety Improvement Act (CSPIA) 5b, which amends the Consumer Product Safety Act. The amendment changes the limit for lead in consumer paint in 16 CFR 1303 from 600 ppm to 90 ppm as of August 14, 2009. CSPIA also established new standards for lead in children’s products and contained language explicitly pre-empting certain state authorities. CPSIA restricts the level of lead in children’s products to 600ppm in February 2009, then 300ppm in August 2009, and then 100ppm in 2011 if feasible. 42 USC 7401, Clean Air Act and Amendments6,7
Lead is regulated in a number of ways under the Clean Air Act of 1970 and subsequent amendments. First, Section 109 created a National Ambient Air Quality Standard for lead of 1.5 µg/m3. The standard was reduced to 0.5 µg/m3 lead on October 15, 2008. Air monitoring will verify conformance by 2017. Section 111 authorizes EPA to establish new source performance standards. The Clean Air Act also established a list of hazardous air pollutants (HAPs) (State of Washington 2006) which includes lead compounds. Section 112 lists the HAPs and mandates that the Maximum Achievable Control Technology (MACT) standards be adopted to regulate the emission of all HAPs. Elemental lead is specifically excluded from this section. However, due to its chemical nature, lead usually exists as a compound. Elemental lead emissions can be used as a surrogate to quantify lead compound emissions because of this propensity to exist as a compound. Solid waste combustion standards were promulgated by EPA under the authority granted by section 129. The Clean Air Act Amendments of 1990 prohibited the sale or use of gas containing lead or lead additives in motor vehicles intend for on-road use. Section 220 made the use of gasoline containing greater than 0.05 grams of lead per gallon illegal after December 31, 1995. Title I of the federal Clean Air Act amendments of 1977 created New Source Review. EPA is charged with making sure that all areas of the ambient air meet the National Air Quality Standards. So all new or modified large sources of air pollution must demonstrate their emissions will not cause an exceedance. This includes emissions of lead. The Washington Clean Air Act (Chapter 70.94 WAC) requires Ecology and the local authorities to evaluate smaller sources as well.

162
33 USC 1251 et seq., Clean Water Act8
Initially passed in 1972, the Clean Water Act establishes a number of programs to prevent or control water pollution. Lead and lead compounds are listed as priority pollutants. EPA has established water quality criteria for lead that define levels to protect human health and aquatic life. The Act and its amendments prohibit people from discharging pollutants from a point source without a National Pollutant Discharge Elimination System (NPDES) permit. These permits must include conditions to protect water quality. The EPA and authorized states issue and monitor compliance with the waste discharge permits. The Act also directs EPA to establish technology-based standards (i.e. best available technology (BAT) requirements) to prevent discharges of harmful amounts of pollutants. 42 USC 300f et seq., Safe Drinking Water Act9
The Safe Drinking Water Act was passed in 1974. This Act ensures that all drinking water meets specific and safe quality standards. The SDWA granted EPA the authority to establish national primary drinking water regulations (40 CFR part 141). This Act sets a Maximum Contaminant Level Goal (MCLG) for lead of zero ppb and an action level of 15 ppb. These standards apply to all drinking water sources (includes drinking water from surface water and ground water). 42 USC 247b-1, 300j-21 to 300j-26, Lead Contamination Control Act10
Passed in 1988, the Lead Contamination Control Act amended the Safe Drinking Water Act by adding a new part titled “Additional requirements to regulate the safety of drinking water.” The new provisions are focused on reducing lead levels in school drinking water systems. The Act defines “Lead-free” water cooler fixtures. The Act prohibits people from introducing lead-containing water coolers into commerce. EPA must provide grants to States so that they can meet these new standards. The CDC is also required to provide grants to States to help prevent lead poisoning. The Lead Contamination Control Act applies to school drinking water provided by a public water system. 40 CFR part 141 subparts E,I, part 142 subpart B, Lead and Copper Rule11
EPA published a regulation to reduce lead in drinking water (the Lead and Copper Rule) in 1991. It established the action level of 15 ppb based on the 90th percentile level for tap water samples. The Rule also established tap water sample monitoring conditions and treatment requirements based on the water system in place. The rule requires drinking water suppliers to provide public health education materials to customers if the lead action level is exceeded. The Lead and Copper Rule applies to public water systems as well as owners or operators of private water systems. 42 USC Part 103, Comprehensive Environmental Response, Compensation and Liability Act (CERCLA)12
CERCLA, passed in 1980, is the primary federal authority used to regulate and cleanup historic hazardous waste sites. The statute and implementing regulations establish procedures for the

163
long-term remediation of such sites, but also provides authority to clean up hazardous waste sites in need of immediate action. Lead is one of many hazardous substances that are covered under CERCLA. The person who caused the contamination is responsible for paying for the cleanup under CERCLA. EPA has published regulations to implement CERCLA and the Oil Pollution Act (33 USC Part 40). The National Contingency Plan (NCP) provides a schedule for the remediation of hazardous waste sites. Section 103 of CERCLA requires the reporting of the release of hazardous substances. Under 40 CFR 302.4, most lead releases in excess of ten pounds must be reported. Lead arsenate must be reported in quantities greater than one pound. 42 USC 9601 et seq., Superfund Amendment Reauthorization Act, SARA13
The Superfund Amendment Reauthorization Act of 1986 amended and reauthorized CERCLA. In addition to providing authority to continue cleanup of historical hazardous waste sites, SARA established new rules, definitions and provisions that go beyond CERCLA. EPA must consider the standards and requirements of different state and federal laws while also increasing states’ involvement in cleanup efforts. SARA emphasizes the permanent remediation of sites rather than interim actions. The amendment also requires EPA to revise the Hazard Ranking System, used to prioritize federal cleanup actions. SARA includes the Emergency Planning and Community Right-to-know Act, in which toxic chemical hazard awareness is addressed. 42 USC Part 116, Emergency Planning and Community Right-to-know Act, EPCRA14
EPCRA, or SARA Title III, is intended to protect public health and the environment from hazards posed by toxic chemicals by providing information about the presence of toxic chemicals in communities. The Act, passed in 1986, creates the annual hazardous chemical inventory as well as the toxics release inventory (TRI). Facilities that manufacture, process or use lead must report quantities under both the annual hazardous chemical inventory and the TRI. The annual hazardous chemical inventory records the amount of a certain chemical stored. Under the TRI, the release or waste management of toxic chemicals by certain industries must be reported. Users of tetramethyl lead and tetraethyl lead are required to report quantities held in excess of their threshold planning quantity which is 100 pounds for both compounds. This requirement is set forth by section 302 of the Act. Hazardous chemicals must be reported to the annual hazardous chemical inventory when quantities stored at a facility exceed 10,000 pounds, including lead. The TRI lead rule, 40 CFR 372, lowers the reportable minimum threshold for lead and lead compounds to 100 pounds. 42 USC 6901 et seq., Resource Conservation and Recovery Act (RCRA)15 Under the authority of the Resource Conservation and Recovery Act of 1976, EPA implements regulations pertaining to solid waste, hazardous waste and underground storage tanks (40 CFR parts 239-299). Lead is primarily regulated as a hazardous waste. RCRA subtitle C establishes the requirements for the inclusion of lead as a hazardous waste. Using the toxicity characteristic leaching procedure, hazardous levels of lead are designated as those wastes that leach a concentration of lead greater than 5.0 mg/kg. RCRA imposes universal standards for the treatment of hazardous wastes. Hazardous wastes are controlled and managed under RCRA from their time of generation to their time of disposal.

164
40 CFR 266 subpart G, Spent Lead-Acid Batteries Being Reclaimed16
This battery reclamation regulation was established as a section of RCRA governing specific uses of hazardous wastes. This section, enacted in 1998, states that a spent lead-acid battery may be handled as a hazardous waste or a universal waste. Subpart G specifies the parameters under which a spent lead-acid battery is to be managed as a hazardous waste or as a universal waste. 42 USC 14301, Mercury-Containing and Rechargeable Battery Management Act17
This Act, passed in 1996, affects both mercury-containing batteries and small, sealed lead-acid batteries. Title I of the Act regulates rechargeable batteries by promoting the efficient collection and recycling of rechargeable batteries. It also mandates the proper labeling of batteries and stipulates that the public should be educated on appropriate collection, recycling and disposal measures. 29 CFR 1910.1025, Lead in General Industry18
The general industry standard for lead, promulgated in 1978, protects employees that are exposed to lead in the course of daily work activities. It, however, does not apply to workers in the construction or agriculture industries. Using engineering and work practice controls, employers are required to reduce the exposure of employees to the lowest feasible level. Employers shall assure that employees are not exposed to lead at levels greater than 50 µg/m3, the Permissible Exposure Limit (PEL). The action level for employee exposure is 30 µg/m3. Employee exposure above this level for greater than 30 days per year initiates an employer-sponsored medical surveillance program which includes biological blood lead monitoring every six months. 29 CFR 1926.62, Lead in Construction19
This regulation, promulgated in 1993, applies to workers occupationally exposed to lead in the construction industry. The lead in construction standard imposes many of the same requirements as the general industry standard. The action level and permissible exposure limit are the same, 30 µg/m3 and 50 µg/m3, respectively. Employers must ensure a workplace in which employees will not be exposed to levels of lead exceeding the permissible exposure limit. The medical surveillance program that is instigated by exposure to levels of lead above the action level for more than 30 days a year is more stringent in its requirements than the general standard. It requires more consistent blood sampling; an initial BLL test every two months for the first six months after exposure and every six months thereafter. Work practice measures must ensure that all surfaces be kept as free as practicable of accumulations of lead. 42 USC 1396d., Medicaid20 Under section 1905 (r) of the Social Security Act21 (passed in 1935 and since amended), Medicaid Early and Periodic Screening and Diagnostic Treatment (EPSDT) must include a lead toxicity screening. All children are considered to be susceptible to lead poisoning. As such,

165
children must be screened for lead poisoning at 12 and 24 months. A screening is mandated by the Act to consist of a blood lead test. If a child has not previously been screened for lead, between the ages of 36-72 months a required screening procedure must be conducted. Children demonstrating blood lead levels greater than or equal to 10 µg/dL resulting from a capillary test are required to undergo a venous procedure. State Medicaid programs must pay for the inspection of the home of a lead-poisoned child as a condition of Health Care Financing Administration policy. 15 USC 1261-1278, Federal Hazardous Substances Act22 The Federal Hazardous Substances Act (FHSA), 15 USC 1261-1278, grants the Consumer Product Safety Commission (CPSC) the authority to promulgate regulations to protect consumers from products containing hazardous substances. The FHSA was passed in 1960 and has been amended many times since. The Act requires that products contain cautionary labels stating the presence of any hazardous substance. The CPSC also has the authority to ban certain products containing hazardous substances. Any product, intended for use by children and containing a hazardous substance that is accessible to a child is considered a banned hazardous substance. Under regulation (16 CFR 1500-1512), the CPSC incorporates the lead-based paint restriction (16 CFR 1303) and bans the introduction into commerce of candles with metal core wicks that contain greater than 0.06% lead. The regulations also provide guidance for lead in consumer products. It is designed to highlight lead-hazards faced by children. CPSC regulates art materials under the 1988 Labeling of Hazardous Art Materials Act (LHAMA), which amended the Federal Hazardous Substances Act (FHSA) and applies to products sold after Nov. 18, 1990. Manufacturers are expected to test and label products. Art materials should be labeled as “conforms to ASTM D4236.” There are also warning labels, so hazardous substances may still be present, if they are properly labeled. Under LHAMA schools are not allowed to give children in grades six and younger art supplies that are labeled with a chronic-hazard warning label. 15 USC 2601 et seq., Toxic Substances Control Act 23
The Toxic Substances Control Act of 1976 (15 USC 2601 et seq.) gives EPA the authority to regulate new and existing substances. The scope of TSCA consists of individual chemicals, such as lead, instead of waste streams. TSCA regulates the manufacture, distribution, use and disposal of harmful chemicals used for commercial and industrial purposes. 42 USC Part 133, Pollution Prevention Act24
The Pollution Prevention Act of 1990, 42 USC 133, promotes the prevention and reduction of pollution at its source whenever feasible. The Act encompasses the pollution of multi-media; air, water and land. Pollution that cannot be addressed at the source should be recycled. Pollution that is unsuited to neither prevention nor recycling should be treated using appropriate methods. The Act authorizes EPA to allocate grants to States in order to promote pollution reduction attributed to business practices. Owners or operators of facilities that are required to submit a

166
report to the Toxic Release Inventory must also submit a toxic chemical source reduction and recycling report. 40 CFR part 503, Biosolids25
The federal standards for biosolid management are promulgated under the authority of the Clean Water Act and its amendments. Promulgated in 1993, the standards include a number of requirements for the final use of biosolids. Part 503 establishes pollutant (including lead) limits for biosolids when applied to land, subjected to surface disposal, and incinerated. Reporting requirements are included for each final use. 7 USC 136 et seq., Federal Insecticide, Fungicide, Rodenticide Act (FIFRA)26
Lead was used in many pesticides and in some cases, may still be used in some pesticides on a limited basis. One pesticide, lead arsenate, was widely used in the first half of the 20th Century (1900 – 1950’s), but was banned in 1988. Other lead-containing pesticides are subject to FIFRA and its accompanying regulations, 40 CFR 150-180. These regulations aim to control the use of pesticides. All pesticides must be licensed for use in the United States by EPA. Under these regulations, pesticides must also be properly labeled and packaged. Distributors cannot sell any pesticide to a user that is not registered in accordance with FIFRA. Applicators are required to take exams in order to obtain the necessary certification for the use of certain pesticides. The registration procedure ensures that, when applied in compliance with these regulations, registered pesticides will not cause intolerable damage to the environment. 40 CFR parts 261, 266, 268 and 271, Zinc Fertilizers Made From Recycled Hazardous Secondary Materials27 Under the authority of RCRA, the Environmental Protection Agency institutes regulations that affect the use and manufacture of zinc fertilizers. These regulations, finalized in 2002, conditionally exclude hazardous materials used to make zinc fertilizers from regulations regarding solid waste such as the land disposal restriction standards (40 CFR part 268). The final rule sets limits on heavy metal contaminants derived from the hazardous manufacturing materials. For lead, the maximum allowable total concentration in a fertilizer, per unit (1%) of zinc content is 2.8 ppm. Zinc fertilizers that follow the limits established in this rule are not regulated as wastes. Land disposal restrictions standards still apply to non-zinc fertilizers made from recycled hazardous waste. 40 CFR Parts 9, 260, 261, et al., Cathode Ray Tube Rule28
The EPA published the final Cathode Ray Tube (CRT) Rule July 28, 2006. The purpose of this regulation is to reduce confusion regarding the disposal of CRTs and encourage the recycling and reuse. CRTs often contain hazardous amounts of lead. The CRT rule allows CRTs to be disposed of as solid waste as long as they are unbroken and are not stored for more than a year. The Rule also lists provisions in which broken CRTs may be disposed of as a solid waste rather than a hazardous waste.

167
50 CFR Part 20, Lead shot ban31,32 Lead shot poses a significant risk to waterfowl, sometimes leading to death. In 1991, the U.S. Department of Fish and Wildlife banned the use of lead shot when hunting waterfowl and coots. In addition to steel shot, there are currently 11 types of nontoxic shot approved for hunting waterfowl. 21 CFR 165.110, Bottled Water33 The United States Food and Drug Administration regulates bottled water as a food product. By doing so, the FDA maintains authority under the Federal Food, Drug and Cosmetic Act to establish safe standards for bottled drinking water. Much like public drinking water, bottled water is at risk for lead contamination. Under 21 CFR 165.110, the FDA specifies the maximum allowable level for lead in bottled drinking water as five ppb. 21 USC 301 et seq., Federal Food, Drug and Cosmetics Act34,35,36
The Food and Drug Administration (FDA) regulates lead under the authority of the Federal Food, Drug and Cosmetics Act (FFDCA). The FFDCA is a set of laws passed in 1938 by Congress. In order to ensure the safety of food, drug and cosmetic products, the FDA restricts the amount of lead in various products. In food cans, lead solder may only consist of 80 ppb in fruit cans and 250 ppb in all other cans. Lead in foil capsules used for wine bottles are banned. The FDA also established different limits on the concentration of soluble lead in different pieces of ceramic-ware.
168
Washington State Laws and Regulations Chapter 64.06 RCW, Exceptions for certain transfers of residential real property39 This law, adopted in 2007, requires sellers of residential real property to disclose known substances of environmental concern. In a transaction for the sale of both unimproved and improved residential real property, the seller shall provide the buyer a completed seller disclosure statement. The seller disclosure statement must be in the same format as outlined in this new law. Regarding lead, it includes the question: Are there any substances, materials, or products on the property that may be environmental concerns, such as asbestos, formaldehyde, radon gas, lead-based paint, fuel or chemical storage tanks, or contaminated soil or water? This law allows the buyer to waive the right to receive the disclosure statement and allows for certain exemptions such as foreclosures, or gifts and transfers between spouses for marital dissolution. It does not require the owner to test for the substances prior to sale. Chapter 70.95G RCW, Packages Containing Metals40
This law, passed in 1991, mandates that the intentional addition of lead, cadmium, hexavalent chromium and mercury to packaging is prohibited and that any incidental addition may not exceed 100 ppm for the sum of all four metals. Manufacturers of packaging materials must monitor their products for these toxic metals. Under this statute, manufacturers are required to submit a certificate of compliance to the Department of Ecology that demonstrates their compliance with this chapter if Ecology requests one. Ecology may prohibit the sale of any packaging or packaging component which a manufacturer fails to submit a certificate of compliance. There are no penalties for violations listed in the statute. Chapter 173-900 WAC, Electronics Products Recycling Program41,42
Ecology established regulations in 2006 to implement the Electronics Products Recycling Program under the authority of Chapter 70.95N, Electronic Product Recycling. This chapter grants the Department of Ecology administrative and enforcement responsibility for implementing electronic product recycling. Covered electronic products fall under the scope of this chapter. Manufacturers, transporters and collectors must annually register with Ecology prior to performing activities and services associated with covered electronic products (CEP). To sell CEPs in Washington, manufacturers must clearly label their products with their brand name. In addition to being financially responsible for the collection, transportation and recycling of electronic waste products, manufacturers must also pay an administrative fee to Ecology that is based on a tier system. Lead is an element in the cathode ray tube of many CEPs. Violators of this regulation first receive a warning. A second offense results in fines of up to 2000 dollars.

169
Chapter 173-331 WAC, Vehicle Battery Recycling44
In 1991, The Department of Ecology adopted this rule under the authority of Chapter 70.95.610-670 RCW. The regulation requires that all batteries must be properly disposed by one of the following: (1) A person or entity selling lead-acid batteries; (2) a person or entity authorized by the Department of Ecology to accept the battery; or (3) a secondary lead smelter. Chapter 70.95.640 RCW establishes a retail core charge of no less than five dollars that may be reclaimed by a purchaser upon the delivery of a used vehicle battery of the same size. None of the battery disposal requirements shall supersede any of the provisions established by Chapter 70.105 RCW, Hazardous Waste Management. Battery wholesalers can be suspended for failing to accept used batteries. Chapter 173-303-520 WAC, Special Requirements for Reclaiming Spent Lead Acid Battery Wastes45
This regulation implements Chapters 70.105 and 70.105D RCW and is managed by the Department of Ecology. Enacted in 2003, this section is applicable to persons who reclaim spent lead-acid batteries. These regulations establish requirements for handlers of lead-acid batteries, including persons who generate, transport, or collect spent batteries, who regenerate spent batteries, or who store spent batteries but do not reclaim them. All owners and operators of battery reclaiming facilities are regulated under certain reclamation requirements, while owners and operators with interim facility or final facility status are subject to further regulation. Chapter 365-230 WAC, Accreditation of Lead-Based Paint Training Programs and the Certification of Firms and Individuals Conducting Lead-Based Paint Activities45, 46
The Department of Community, Trade and Economic Development (CTED) is granted the authority under Chapter 70.103 RCW, Lead-Based Paint, to implement this chapter. This regulation took effect in 2004. To take part in lead-based paint activities, individuals must complete a training course and firms must be certified. Section -050 of this chapter establishes the minimum training curriculum requirements. Different job classifications such as an inspector, risk assessor or supervisor must complete different requirements. This chapter institutes work practice standards for lead-based paint activities. Any lead-based paint abatement activities must be reported to CTED prior to initiation. Lead-based paint and lead-based paint hazard determination guidelines are specified in section -210 of this chapter. Violators may be fined up to 5000 dollars and/or receive a suspension of up to one year. Chapter 246-290 WAC, Public Water Supplies47
The Department of Health (DOH) issued these regulations in 1983. The purpose of this chapter is to protect consumers using public drinking water supplies from any hazards to human health. State and local health departments regulate water systems to ensure that they exercise adequate design, construction, sampling, management, maintenance and operation practice measures. DOH also monitors drinking water quality for lead. There is no State maximum contaminant level (MCL) for lead, only a MCLG- goal – 0 ppb. DOH has adopted the EPA “action level” for

170
lead of 15 ppb that triggers necessary responses such as public education. Failure to comply with this regulation may result in civil penalties and/or legal action. Chapter 173-216 WAC, State Waste Discharge Permit Program48,49
This chapter, enacted in 1983, implements a state permit program to regulate waste materials from industrial, commercial and municipal sources into groundwater, surface waters and municipal sewerage systems. Unless authorized by the Department of Ecology in accordance with this chapter, waste may not be released into groundwater, surface water or municipal sewage systems by any industrial, commercial or municipal operation. Discharge permits are intended to satisfy the requirements for permits designated by Chapter 90.48 RCW. Ecology may modify, suspend or revoke a permit if a violation occurs. Chapter 16-200 WAC, Fertilizers50,51
In 2000, the Department of Agriculture adopted this chapter under the authority of the Commercial Fertilizer Act, Chapter 15.54 RCW. The Department of Agriculture requires the completion of a registration application for commercial fertilizer that includes relevant information about the metal content in each fertilizer. This chapter also establishes the standards for metal additions to soils. The standard for the maximum acceptable annual addition to soil for lead is 1.981 pounds/acre/year. Violators may be fined or have their license application denied or cancelled. Chapter 118-40 WAC, Hazardous Chemical Emergency Response Planning and Community Right-To-Know Reporting52,53,54
The Military Department adopted this chapter in 1988 under the authority of RCW 38.52.030, 38.52.050 and 43.63A.060. This chapter adopts regulations that ensure compliance with the federal requirements of the Emergency Planning and Community Right-To-Know Act (EPCRA). Many other state agencies (including the Department of Ecology) are responsible for implementing specific parts of this chapter. If a facility generates or discards more than 100 pounds of lead, it must report under Section 313 of EPCRA. Although necessary reports and notifications are usually sent to the EPA, Ecology may also receive such information. Chapter 173-306 WAC, Special Incinerator Ash Management Standards55,56
The purpose of this chapter is to protect human health, the environment and employees from hazards generated by the management and disposal of special incinerator ash. The Department of Ecology is responsible for implementing this chapter under the authority of Chapter 70.138 RCW. This rule, issued in 1990, regulates special incinerator ash that would otherwise by managed as a state hazardous waste. This regulation is not applicable to special incinerator ash residues that classify as a hazardous waste under RCRA Subtitle C. Before managing or generating special incinerator ash, a generator must submit a management plan to Ecology. Generators must submit annual reports and must sample bottom ash and flyash/scrubber residues quarterly for lead and other toxic metals. Violators face civil and criminal penalties.
171
Chapter 173-200, Water Quality Standards for Groundwater57,58
Ecology regulates State ground waters under the authority of Chapters 90.48 and 90.54 RCW. This chapter, enacted in 1990, includes an anti-degradation policy to protect current and future beneficial uses of ground water from deleterious effects, prevent degradation of waters of outstanding value and actively maintain the higher quality of waters that exceed their criteria assigned. The criterion set for lead in ground water is 0.050 mg/L, or 50 ppb. The state usually follows levels consistent with the highest level of beneficial use. In the case of groundwater, quality standards usually include compliance with the federal drinking water standard, 15 ppb. Each violation may result in a fine of up to 10,000 per day. Chapter 173-307, Pollution Prevention Plan59,60
Pursuant to Chapter 70.95C RCW, the purpose of this chapter is to encourage voluntary efforts to reduce hazardous waste by-products of production while also increasing the reuse of such hazardous substances in production. The regulation was implemented in 1991. Lead is considered a hazardous substance under RCRA Subtitle C. This chapter applies to most hazardous waste generators, though a few generators are exempt from the requirements including: treatment, storage, and disposal facilities or recycling facilities. Generators must create a reduction plan which documents activities involving hazardous substances as well as establish written policy and objectives to reduce hazardous releases. Generators must submit progress reports to the Department of Ecology evaluating the advancement towards reaching their specific objectives. Fines may be imposed by the Department of Ecology if an entity is not in compliance with this chapter. Violators face a penalty and a surcharge for disposal while in violation of this chapter. Chapter 173-201A, Water Quality Standards for Surface Waters58,61
This chapter, taking effect in 1992, implements Chapters 90.48 and 90.54 RCW in order to protect the water quality of surface waters. In accordance with this chapter, Ecology institutes narrative and numeric criteria for surface water quality, an anti-degradation policy and use-based protection measures. This chapter includes toxic substance criteria for surface water in section -240, which contains criteria for lead in marine surface waters and freshwater. The standards include criteria based on both chronic and acute exposures to lead. The criteria for freshwater are based on a formula that takes into account the hardness of the water. For freshwater with a hardness of 100 mg/L, the criteria are 65 µg/L for acute exposure and 2.5 µg/L for chronic exposure. For marine waters the acute criteria is 210.0 µg/L and the chronic is 8.1 µg/L. Violators may be subject to civil penalties and/or criminal charges such as gross misdemeanor. Chapter 173-308 WAC, Biosolids Management62,63,64 Under the authority of Chapters 70.95J and 70.95 RCW, the Department of Ecology purports to manage biosolids in manner that is safe to both human health and the environment. This chapter, enacted in 1992, also promotes the maximum beneficial use of biosolids. The chapter also complies with federal biosolid standards established in the Clean Water Act. Sewage sludge that does not meet the biosolid standards criteria must be managed as a solid waste. This chapter
172
mandates, with some exemptions, that permits be obtained by domestic sewage treatment facilities and land management plans be submitted by persons who apply biosolids to land. Also, this chapter establishes biosolid pollutant limits. Sewage sludge managed as a biosolid may not exceed 840 ppm lead. There is a lower pollutant concentration limit that when reached, relaxes or suspends some of the management requirements in this chapter. For lead, the lower threshold limit is 300 ppm. Violators may be subject to civil penalties and/or criminal charges such as gross misdemeanor. Chapter 173-350 WAC, Solid Waste Handling Standards64,65
This chapter, promulgated under the authority of Chapter 70.95 RCW, establishes standards for handling solid wastes to assure the efficient use of resources. This chapter, implemented in 2003, applies to facilities and activities that manage solid waste. The owner or operator is responsible for all solid waste handling activities performed on their property. Facilities that engage in solid waste handling activities (disposal, storage, treatment etc.) must obtain a permit, unless the facility fits the categorical requirements for an exemption stated in the chapter. Permits are not required for facilities that demonstrate the beneficial use of the solid wastes generated or accumulated. Section -220 requires that any application of solid waste to land must test for lead content. Section -230 stipulates composting facility requirements, which designate that compost containing less than 150 ppm and an adequate stability rating, do not need to be managed as a solid waste. Section -260 of this chapter defines a limited moderate risk waste, which include waste batteries. Notification and permitting requirements are reduced for limited moderate risk wastes. Chapter 16-256 WAC, Commercial Feed Rules – Processed Animal Waste66,67,68
This chapter was adopted in 2004, by the Department of Agriculture, under the authority of Chapters 15.53 and 34.05 RCW. These regulations require the labeling and testing of feed products. Toxic metals are one of the substances that must be tested. Section -070 of this chapter mandates that processed animal waste, distributed as a commercial feed product, may not contain a total concentration of toxic metals, including lead, greater than 500 ppm. Failure to comply with this regulation may result in the revocation of a commercial feed license. Chapter 70.140 RCW, Area-Wide Soil Contamination69
Passed in 2005, the Area-Wide Soil Contamination Act aims to reduce children’s exposure to hazardous materials from soil, including arsenic and lead. Under the requirements of this law, the Department of Ecology, with assistance from other agencies, evaluates arsenic and lead contamination in schools and childcare facilities. If a soil sample confirms soil contamination, Ecology will help the facility or school to implement best management practices. This law is only applicable to Western Washington, specifically areas within the Tacoma Smelter Plume. Chapter 173-360 WAC, Underground Storage Tank Regulations70,71
The Department of Ecology implements Chapter 90.76 RCW, Underground Storage Tanks, in order to protect human health and the environment from leaky underground storage tanks

173
containing petroleum and other regulated substances. Tanks may contain aviation gas with tetraethyl lead. No underground storage tank systems, within the parameters of this chapter’s scope, may operate without a valid permit. This chapter sets forth performance standards for underground storage tanks. Tanks must be monitored and owners and operators are required to comply fully with testing and inspection. Releases into the surrounding environment shall be immediately reported to Ecology and appropriate cleanup and containment measure must be taken. Under most circumstances, MTCA cleanup standards apply to the remediation of releases from leaky underground storage tanks. This chapter was adopted in 1990 and violators face fines of up to $5,000 dollars per day per violation. Chapter 296-62-07521 WAC, Lead72,73
This section is part of the general occupational health standards, Chapter 296-62 WAC, and is promulgated under the authority of Chapter 49.17 RCW, the Washington Industrial Safety and Health Act. This section, enacted in 1982, constitutes the general industry lead standard. The standard protects workers from occupational hazards associated with lead. Employers must provide a safe workplace which includes safety measures such as employee blood lead level testing, exposure notifications and adequate respiratory protection equipment. This section establishes an action level for the concentration of lead in the air, 30 µg/m3 averaged over an eight-hour period. This section further stipulates that air concentrations in the workplace may not exceed 50 µg/m3. Employers must follow the exposure monitoring and medical surveillance requirements set forth in this section. Medical surveillance may include biological monitoring of blood lead levels that follow a schedule that determines medical removal and return of an employee from the workplace. 296-155-176 WAC, Lead73,74
Chapter 49.17 RCW grants authority to the Department of Labor and Industries to implement this section of the safety standards for construction workers. This section, implemented in 1993, serves to protect construction workers from occupational exposures to lead. The action level in the construction standard is 30 µg/m3 while the permissible exposure level is 50 µg/m3. The construction standard also requires medical surveillance, including consistent biological monitoring of blood lead levels. Other safety requirements that the employer must provide include: Respiratory protection, clothing, change areas, hand washing, biological monitoring and training programs. Chapter 173-204 WAC, Sediment Management Standards58,77,78,79,80
Enacted in 1991, this chapter establishes marine, low salinity and freshwater surface sediment management standards under the authority of Chapters 90.48, 70.105D, 90.70, 90.52, 90.54 and 43.21 RCW. The purpose of this chapter is to reduce health threats to humans and biological resources resulting from surface sediment contamination. In Washington, the marine sediment quality criteria for lead is 450 ppm. This value is used as a “sediment quality goal” for lead in sediments in Washington. The cleanup level for lead in sediments is 530 ppm. This value is used as a “upper regulatory level” for source control and cleanup decision making for lead contaminated sediments.

174
Chapter 173-400 WAC, General Regulation for Air Pollution Sources81,82
Lead is one of seven criteria pollutants identified in the Federal Clean Air Act. EPA established a National Ambient Air Quality Standard for lead. States are responsible for developing State Implementation Plans (SIPs) that identify requirements for attaining and maintaining the NAAQSs. The Washington Clean Air Act (Chapter 70.94 RCW) authorizes the Department of Ecology to develop and implement regulations that are needed to meet the federal air quality standards. Ecology adopted general regulations (chapter 173-400 WAC) that apply to all air pollution sources in 1976. These regulations are used to establish requirements that are included in the SIP for lead and other criteria pollutants. The federal law also establishes requirements for hazardous air pollutants (including lead). Ecology has established regulations that include control requirements for industrial sources that emit lead. Ecology has adopted these regulations for large sources by reference. Ecology and the seven local air authorities have adopted New Source Review rules for all new and modified sources. Violators may be subject to civil penalties and/or criminal charges such as gross misdemeanor. Chapter 173-460 WAC, Controls for New Sources of Toxic Air Pollutants82,83 Ecology has established emission control requirements for new sources of toxic air pollutants. This chapter is adopted under the authority of Chapter 70.94 RCW, the Washington Clean Air Act. Under this chapter, Ecology reviews new sources of toxic air pollutants and establishes emission control requirements that are needed to prevent air pollution that may impact human health and safety. This chapter, enacted in 1991, requires new sources to implement best available control technology for toxics. The owner or operator of a new toxic air pollutant source must also conduct an acceptable source impact level (ASIL) analysis for Class A and B toxic air pollutants. When performing these assessments, the owner/operator must quantify the amount of toxic air pollutant likely to be emitted from the new source and estimate ambient air concentrations that might result from those emissions. Ambient air concentrations are estimated using air quality models. The model air concentrations are then compared to regulatory screening values (acceptable source impact level (ASIL)). If the modeled concentration exceeds the ASIL screening levels, the owner/operator must perform a comprehensive review using a more sophisticated model and, if necessary, apply additional emission controls. Lead and lead compounds are included in both categories of toxic air pollutants and ASIL levels can be found in section 150 of this chapter. Ecology’s Air Quality Program is in the process of amending the 460 rule. The Lead ASIL will be lowered from 0.5 µg/m3 to .0833 µg/m3. Violators may be subject to civil penalties and/or criminal charges such as gross misdemeanor. Chapter 173-303 WAC, Dangerous Waste Regulations51,76,84,85,86
Implemented in 1982, this chapter is promulgated under the authority of Chapter 70.105 RCW and parts of chapters 70.105A, 70.105D and 15.54 RCW. These regulations meet the requirements of the Federal Resource Conservation and Recovery Act (RCRA) and the Department of Ecology is delegated by the US EPA to implement RCRA within the state. This chapter also contains specific state-only dangerous waste requirements for any waste generated or disposed of within the state.

175
The Washington Dangerous Waste (WAC 173-303) regulations separate wastes into four categories:
· Characteristic wastes. · Criteria wastes. · Discarded chemical products. · Non-specific and specific industrial sources.
Wastes are given waste codes based on their sources or specific properties. D codes are for characteristic wastes. W codes are for state-only wastes. P and U waste codes are assigned to discarded chemical products. F codes are for non-specific and K codes are for specific industrial sources. Toxicity is the most common state-only requirement that is applicable to lead and lead compounds. Dangerous wastes that fail state-only toxicity criteria are designated as WT02, while extremely hazardous wastes are identified by the waste code WT01. Both WT01 and WT02 wastes must be handled per RCRA requirements. Generators not in compliance with these regulations are subject to civil penalties as well as criminal charges including class B and C felonies. Chapter 173-340 WAC, Model Toxics Control Act – Cleanup75,76
Chapter 70.105D RCW establishes the framework and authority for the development of a program dealing with the cleanup of sites contaminated with toxic chemicals. The MTCA Cleanup Regulation, issued in 1991, establishes procedures and standards for the identification, investigation and cleanup of facilities contaminated with hazardous wastes. The regulation includes standards for the cleanup of sites contaminated with lead. Method A Soil Cleanup Levels are set at 250 ppm and are designed to protect human health, groundwater and surface water for all future uses of the site. Method B Soil Cleanup Levels are risk-based protection standards. Method B cleanup levels for lead are developed using an EPA exposure model (the Integrated Exposure Uptake Bio-Kinetic (IEUBK) model) to establish site-specific cleanup levels to protect human health. Method B soil cleanup levels are based on preventing blood lead concentrations greater than 10 µg/dL. Method C Soil Cleanup Levels apply to industrial properties that pose no threat to groundwater or surface water. The Method C cleanup level is 1,000 mg/kg. Some sites also employ Terrestrial Ecological Evaluation (TEE) screening levels. TEE screening levels are designed to protect plants, animals and soil biota. There are different lead standards set for simplified and site-specific TEEs. In most cases, cleanup levels for ground water and surface waters are based on drinking water standards and the state water quality standards. Chapter 232-12-068 WAC, Nontoxic Shot Requirements87,88 The Department of Fish and Wildlife is authorized by Chapter 77.12.047 RCW to develop regulations for the use of nontoxic shot. This section, implemented in 1995, makes it illegal to

176
possess shot that is not specified as nontoxic shot when hunting waterfowl, coot or snipe. A variety of nontoxic shot options are listed in the text. Additionally, this section lists nine areas where the possession of shot other than nontoxic is prohibited. It is also illegal to use shot other than nontoxic at six other areas when hunting game birds or game animals. ESHB 103338 On April 28, 2009, Governor Gregoire signed into legislation this act to require alternatives to lead wheel weights. Environmentally preferred wheel weights are required by January 1, 2011 at the time of tire replacement or repair. “Environmentally preferred” wheel weights are defined as not having more than 0.5% of any substance on the list in the PBT Rule (WAC 173-333), which includes lead. The new law only pertains to motor vehicles with a wheel diameter of less than 19.5 inches or a gross vehicle weight of 14,000 lbs. Ecology will assist manufacturers, distributers, wholesalers, retailers, and persons that balance tires with identifying environmentally preferred wheel weights. Ecology also has the authority to enforce this law.
Local Regulation Seattle Public Schools89 In 2004, the Seattle Public School system adopted a new drinking water quality policy. The new water quality policy set the standard for lead in school drinking water at 10 ppb. The new standard is lower than the existing EPA action level for schools, 20 ppb. The use of bottled water was implemented as an interim action as schools began taking actions to come into compliance with this new standard.

177
Table 23- Summary of Federal and Washington State Lead Standards
Standards for Lead Source Federal Levels Washington State Levels Children’s products 600 ppm (2/14/09) 600 ppm (2/14/09) CPSC lead-based paint regulation
600 ppm 90 ppm (8/14/09)
600 ppm 90 ppm (8/14/09)
HUD lead-based paint regulation
0.5% (5,000 ppm) or >1.0 mg/cm2
0.5% (5,000 ppm) or >1.0 mg/cm2
Dust Floor: 40 µg/ft2 40 µg/ft2 Interior window sills: 250 µg/ft2 250 µg/ft2 Window trough: 400 µg/ft2 400 µg/ft2
Soil Bare soil in children’s play areas: 400 ppm
Unrestricted use: 250 ppm
Bare soil in rest of yard: 1200 ppm
Industrial use: 1000 ppm
Sediment - Sediment Quality: 450 ppm Cleanup: 530 ppm
Air National Ambient Air Quality Standard: 0.5 µg/m3
0.5 µg/m3
Drinking Water Action Level: 15 ppb 15 ppb Maximum Contaminant Level Goal: 0 ppb
0
Action level in Schools: 20 ppb Plumbing - Solder and Flux - Pipes and Pipe Fittings
Lead-free Lead-free 0.2% lead = 2000 ppm 0.2% 8% lead = 80000 ppm 8%
Bottled Water 5 ppb 5 ppb Toxicity Characteristic Leaching Procedure
Maximum concentration level: 5.0 mg/kg
5.0 mg/kg
Annual Hazardous Chemical Reporting
10,000 lbs. 10,000 lbs.
TRI reporting 100 lbs. 100 lbs. Biosolids applied to soil 1.) Ceiling concentration 2.) Cumulative pollutant loading rate 3.) Monthly average concentration 4.) Annual pollutant loading rate
840 ppm
840 ppm
300 kg/hectare
300 kg/hectare
300 ppm
300 ppm
15 kg/hectare [13.42 lbs/acre] 1.981 lbs./acre (maximum annual addition)
Packaging - 100 ppm

178
Selected Lead Laws and Regulations for other States Overview
Table 24- Summary of U.S. State Lead Standards State Media-Specific Action Levels Other Alabama Drinking Water (Maximum
Contaminant Level) 90: 15 ppb Soil91: 400 ppm , 800 ppm
· Lead Ban Act (plumbing)92 · Lead Reduction Act93
Alaska Drinking Water MCL94: 15 ppb
Soil95: 400, 1000 ppm
Arizona Drinking Water MCL96: 15 ppb Soil97: 400, 800 ppm
· Lead-Based Paint98 · Batteries99,100
Arkansas Drinking Water MCL101: 15 ppb Soil102: 400, 800 ppm
· Lead-Based Paint Hazard Act103 · Lead Poisoning Prevention104 · Batteries105
California Drinking Water106: 15 ppb Soil107: 150, 3500 ppm
· Electronic Waste Recovery and Recycling108
· RoHS109 · Proposition 65110 · Lead in Water Systems111 · Lead in Toys and Jewelry112 · Batteries113 · Packaging114
Colorado Drinking Water115: 15 ppb Soil116: 400, 2920, 1460 ppm
· Lead-Based Paint Abatement117 · Prevention, Intervention, and
Reduction of Lead Exposure118 Connecticut Drinking Water119: 15 ppb
Soil120: 500, 1000 ppm
· Lead Poisoning Prevention Program121
· Lead Abatement Consultants, Contractors and Workers122
· Electronic Waste123 · Batteries124 · Packaging125
Delaware Drinking Water126: 15 ppb Soil127: 400, 1000 ppm
· Childhood Lead Poisoning Prevention Act128
· Lead Based Paint Hazards129 Florida Drinking Water130: 15 ppb
Soil131: 400, 1400 ppm · Batteries132 · Packaging133

179
State Media-Specific Action Levels Other Georgia Drinking Water134: 15 ppb
Soil Notification Concentration135: 300 ppm
· Georgia Lead Poisoning Prevention Act of 1994136
· Batteries137 · Packaging138
Hawaii Drinking Water139: 15 ppb Soil140: 400, 800, 800 (construction) ppm
· Batteries141
Idaho Drinking Water142: 15 ppb
· Batteries144
Illinois Drinking Water145: 15 ppb Soil146: 400, 800, 700 ppm
· Lead Poisoning Prevention Act147
· Lead-bearing substances148 · Batteries149 · Packaging150
Indiana Drinking Water151: 15 ppb Soil152: 400, 1300 ppm
· Lead-Based Paint Activities153 · Childhood Lead Poisoning154 · Batteries155
Iowa Drinking Water156: 15 ppb Soil157: 400 ppm
· Childhood Lead Poisoning Prevention Program158
· Batteries159 · Packaging160
Kansas Drinking Water161: 15 ppb Soil162: 400, 1000 ppm
· Residential Childhood Lead Poisoning Prevention Act163
Kentucky Drinking Water164: 15 ppb
Soil165: 400, 800 ppm
· Lead Poisoning Prevention166 · Lead-Hazard Detection and
Abatement167 · Batteries168
Louisiana Drinking Water169: 15 ppb Soil170: 400, 1400 ppm
· Lead Hazard Reduction, Licensure and Certification171
· Batteries172 Maine Drinking Water173: 10 ppb
Soil174: 375, 700, 700 ppm
· Lead Poisoning Control Act175 · Electronic Waste176 · Batteries177 · Packaging178 · Fishing Weights179

180
State Media-Specific Action Levels Other Maryland
Drinking Water180: 5 ppb Soil181: 400 ppm
· Reduction of Lead Risk in
Housing182 · Accreditation of Lead
Abatement Services183 · Electronic Waste184 · Packaging185
Massachusetts Drinking Water186: 15 ppb Soil187: 300 ppm
· Lead Poisoning Prevention and Control188
· Batteries189 · Fishing Weights189b
Michigan Drinking Water190: 15 ppb Soil191,192: 400, 900 ppm
· Lead Abatement Act193 · Batteries194
Minnesota Drinking Water195: 15 ppb Soil196: 400, 700 ppm
· Lead Poisoning Prevention Act197
· Electronic Waste198 · Batteries199 · Packaging200
Mississippi Drinking Water201: 15 ppb Soil202: 400, 1700 ppm
· Lead-Based Paint Activity Accreditation and Certification203
· Batteries204 Missouri Drinking Water205: 15 ppb
Soil206: 260, 660, 660 ppm
· Lead Poisoning Prevention207 · Batteries208 · Packaging209
Montana Drinking Water210: 15 ppb
Nebraska Drinking Water212: 15 ppb Soil213: 400, 750 ppm
· Residential Lead-Based Paint Professions Practice Act214
· Batteries215 Nevada Drinking Water216: 15 ppb
Soil217: 150, 750 ppm
· Batteries218
New Hampshire Drinking Water219: 15 ppb Soil remediation standard220: 400 ppm
· Lead Paint Poisoning Prevention and Control221
· Batteries222 · Packaging223 · Fishing Weights224
New Jersey Drinking Water226: 15 ppb Soil227: 400, 600 ppm
· Batteries228 · Packaging229
New Mexico Drinking Water230: 15 ppb Soil231: 400, 800, 800 ppm
· Batteries232

181
State Media-Specific Action Levels Other New York Drinking Water233: 15 ppb
Soil234: 400, 1000, 3900 ppm
· Control of Lead Poisoning235 · Batteries236 · Packaging237 · Fishing Weights238
North Carolina Drinking Water239: 15 ppb
· Lead-Based Paint Hazard Management Program241
· Electronic Waste242 · Batteries243
North Dakota Drinking Water244: 15 ppb Soil245:
· Batteries246
Ohio Drinking Water247: 15 ppb Soil248: 400, 1800, 1600 ppm
· Lead Abatement249
Oklahoma Drinking Water250: 15 ppb Soil251: 400, 800 ppm
· Lead-based Paint Management Act252
· Batteries253 Oregon Drinking Water254: 15 ppb
· Lead Poisoning and Hazard
Reduction256 · Electronic Waste257 · Batteries258
Pennsylvania Drinking Water259: 15 ppb Soil260: 500, 1000 ppm
· Packaging337
Rhode Island Drinking Water261: 15 ppb Soil262: 150, 500 ppm
· Lead Poisoning Prevention Act263
· Electronic Waste264 · Batteries265 · Packaging266
South Carolina Drinking Water267: 15 ppb Soil268: 400, 800 ppm
· Childhood Lead Poisoning Prevention and Control Act269
· Batteries270 South Dakota Drinking Water271: 15 ppb
· Batteries273
Tennessee Drinking Water274: 15 ppb Soil275: 400, 800 ppm
· Tennessee Lead-Based Paint Abatement Certification Act of 1997276
· Batteries277 Texas Drinking Water278: 15 ppb
Soil279: 500, 1000 ppm
· Lead-Based Paint Abatement280 · Electronic Waste281 · Batteries282
Utah Drinking Water283: 15 ppb
· Batteries285

182
State Media-Specific Action Levels Other Vermont Drinking Water286: 15 ppb
· Lead Poisoning288 · Batteries289 · Packaging290 · Fishing Weights291 · Children’s products291b · Wheel weights291b · Industrial paints291b · Plumbing fixtures291b
Virginia Drinking Water292: 15 ppb Soil293: 400, 800 ppm
· Batteries294,295 · Packaging296
Washington Drinking Water47: 15 ppb Soil75: 250, 1000 ppm
· Lead-Based Paint46 · Electronic Waste41 · Batteries43 · Packaging41 · Wheel Weights38
West Virginia Drinking Water297: 15 ppb Soil298: 400, 1000 ppm
· Lead Abatement Act299 · Batteries300
Wisconsin Drinking Water301: 15 ppb Soil302: 50, 500 ppm
· Wisconsin Statute 254 Environmental Health303
· Batteries304 · Packaging305
Wyoming Drinking Water306: 15 ppb Soil307: 400 ppm (residential)
· Batteries308
All states address lead in many ways. The following presents a description of some approaches to regulating lead. Paint Laws Several states have enacted legislation based on the paint industry’s model childhood lead poisoning prevention bill. Briefly, the main parts of the model legislation are: · All pre-1978 properties must be certified “lead-free” or “lead-safe.” Lead-free means there is
no lead paint inside and no deteriorated lead paint outside. Lead-safe means there are no lead hazards. There are re-certifications every three years, unless the tenants haven’t changed and/or there are no children under 6 years old.
· There will be an environmental investigation within 15 days of an EBLL. · The owner is not liable if property is certified lead-free or lead-safe and no new lead hazard
was generated, or the source was not lead paint. · Mandatory blood lead level testing for children at 12 and 24 months of age.

183
Maryland is the basis for the model bill. Maryland has chosen to focus on pre-1950 rental properties. The property owners fund enforcement with a $10 per unit annual fee for pre-1950 housing and a $5 per unit fee for 1950-1978.
New Jersey passed a comprehensive version of model bill. The property owners fund mandatory inspections ($20 every five years). A diversion of sales tax collected on paint product sales to Lead Hazard Assistance Program. A 2008 law requires inspections for lead-based paint hazards in one and two unit rental housing, which were exempted in the original law. Florida enacted the screening & education portions of the model bill. Kentucky enacted the screening and education portions of the model bill and limited intervention. Illinois requires retail warnings (posters and brochures to be displayed at retailers of paints), some follow-up inspections, targeted blood testing, and intervention after an EBLL. The law requires testing of the whole building (not just unit with affected child) after an EBLL. Indiana requires retail warnings (posters and brochures to be displayed at retailers of paints), some follow-up inspections, targeted blood testing, and intervention after an EBLL. Arkansas requires remediation after an EBLL. Connecticut requires owners of dwellings with toxic levels of lead and in which children under the age of 6 reside, to abate or manage lead-based paint hazards. The law requires inspections of home day cares for any evident sources of lead poisoning prior to being licensed. Louisiana requires owners to remove or cover paint, plaster or other accessible materials containing dangerous levels of lead in a child less than 6 years or a mentally disabled person resides at the premises. Massachusetts requires an owner of a home built before 1978 to have the home inspected for lead if a child under six years old lives there. If lead hazards are found, it must be deleaded or brought under interim control. A licensed deleader has to do all removal of leaded paint, and all other high-risk work. The owner or someone who works for him who is not a licensed deleader can do certain low-risk deleading and interim control work. After the work is done, the lead inspector or risk assessor issues a Letter of Compliance or Letter of Interim Control. The owner must make sure there is no peeling paint anytime after getting a Letter of Compliance or Letter of Interim Control. Maine requires child care facilities and preschools to have lead inspections every 3 years. Minnesota requires certification of lead-safe housing and abatement after an EBLL, with a clearance inspection.
North Carolina requires abatement in dwellings, schools, and daycares determined to be a potential source of an EBLL in children under the age of 6.

184
New Hampshire has provisions to inspect dwellings that applies to landlords, day cares, and rental property owners. The whole building is inspected if one unit has lead-based paint. In Rhode Island, the Lead Hazard Mitigation Act of 2002 provides the authority for the implementation of lead regulations by the Housing and Resource Commission336. Owners of rental housing built prior to 1978 must mitigate or abate any existing lead hazards and achieve a lead-safe or lead-free designation. Dwelling units must continue to comply with the lead hazard mitigation standards for paint, dust and soil. Owners are required to maintain compliance with these standards through visual assessments and dust testing. Virginia requires landlords to maintain paint to international property maintenance code. Vermont requires owners of pre-1978 rental housing and child care facilities to take a training course and complete annual essential maintenance practices. Owners of rental housing must file an affidavit of EMP compliance annually (no enforcement). Hunting and Fishing Several states have enacted laws to limit the use of lead in ammunition or fishing weights. The Minnesota Department of Natural Resources surveyed all the states and has an interactive map with each state’s restrictions on use of lead shot. This information from Minnesota is shown in Table 25. The information is updated frequently and can be found at the Minnesota DNR website at: http://www.dnr.state.mn.us/outdoor_activities/hunting/nts/index.html. Washington is one of 24 states that have additional restrictions for hunting, beyond the federal ban on the use of lead shot for hunting waterfowl. Pheasant release sites in Washington require non-toxic shot and the table indicates lead shot is banned in 20,000 acres in Washington. There are no states that have banned the use of lead shot in general. There is also a summary of nontoxic shot regulations for upland game hunting in the United States in the 2001 WDFW report on non toxic shot (Washington Department of Fish and Wildlife 2001). New Hampshire prohibits use and sale of lead fishing sinker or jig in fresh water and Vermont prohibits the use and sale of lead sinkers. In Massachusetts, lead fishing weights are banned on two large reservoirs; the Wachusett and Quabbin.

185
Table 25- State Non-Toxic Shot Requirements in the U.S.
State Nontoxic required
Number of areas Acres
Year begun Species involved
Arkansas yes 2 14,000 1992 rabbit, squirrel, deer California yes 1 12,000 1990 dove, pheasant Delaware yes 1 100 1985 dove Florida yes 3 10,000
snipe
Iowa yes 65 80,500 1998 partridge, pheasant, turkey, small game
Illinois yes 25
1990 dove, pheasant Indiana yes 3 4,365 1991 dove Kansas yes 16 72,000 1986 dove, upland game Kentucky yes 12 40,000 1989 dove Louisiana yes 2 2,500 1995 dove, gallinule, rail Michigan yes 7 10,000
Minnesota yes 4 45 2006 dove
Missouri yes 18 49,106 1977 dove, quail, rabbit, squirrel, turkey
North Carolina yes 8 5,000 1980 all Nebraska yes 265 403,868 1986 grouse, prairie chicken, quail New Mexico yes 25 80,000 1993 grouse, pheasant, quail, squirrel Ohio yes 3 1,000 1996 gallinule, rail, snipe
Oklahoma yes 36 8,000 1997 small game, migratory birds, turkey
Oregon yes 8 46,840 1991 dove, pheasant, quail, snipe South Dakota yes
400,000 1998
dove, grouse, pheasant, small/big game
Tennessee yes 6 4,534 1990 dove, quail, rabbit, squirrel Utah yes 5 75,000 1976 dove Washington yes 11 20,000 1988 all
Wyoming yes 2 4,445 1985 dove, grouse, pheasant, rabbit, squirrel, deer
Total 24 525+ 1,330,173

186
Batteries 43 states, including Washington, have battery recycling laws and 38 are based on the Battery Council model legislation. Packaging As of July 2004 19 states have lead in packaging laws, including Washington. These laws prohibit the intentional addition of lead, chromium, mercury and cadmium to packaging. Selected Other State Laws California In 2003, California passed the Electronic Waste Recycling Act. This Act contained provisions for both the recycling of certain electronic wastes as well as restrictions on heavy metal content in covered electronic devices. The following regulations were promulgated as a result of this Act. 14 California Code of Regulations §18660.5-18660.43, Electronic Waste Recovery and Recycling108
The Department of Toxic Substances Control (DTSC) adopted regulations regarding electronic waste recycling under the authority of the California Public Resources Code §42460-42486. These regulations impose a $6-10 fee at the point of purchase of a covered electronic device. This fee is used to finance the recycling of electronic waste products.
22 CCR §66260.202, Restrictions on the Use of Heavy Metals in Covered Electronic Devices109
Under the authority of the California Health and Safety Code §25214.9-25214.10.2, the DTSC implements regulations covering Restrictions on the Use of Heavy Metals in Covered Electronic Devices. These regulations are also known as California RoHS. The California RoHS regulations are very similar to the EU RoHS. However, California RoHS only regulates lead, cadmium, mercury and hexavalent chromium. The scope of California RoHS is much smaller than EU RoHS: It regulates only covered electronic devices. California RoHS prohibits the sale of covered electronic devices containing more than 0.1%, 1000 ppm, of lead in its homogenous components.
California also has other regulations and laws in place that affect lead. A particularly important regulation is the Safe Drinking Water and Toxic Enforcement Act of 1986, commonly referred to as Proposition 65. The Act, codified under the California Health and Safety Code 25249.5 et seq., implements the regulations set forth by the Office of Environmental Health and Hazard Assessment in 22 CCR §12000-14000110. Proposition 65 mandates the annual publication of a comprehensive list containing chemicals known to the state to cause cancer or reproductive toxicity. Businesses are required to provide a clear warning prior to knowingly exposing a consumer to chemicals within their products that are carcinogenic or toxic to reproduction. The California Health and Safety Code §116875-116880 established new limits for lead in water systems111. The limit applies to the wetted surfaces of pipes, pipe fittings, plumbing fittings and fixtures that pass water that is intended for human consumption. Currently, pipes and pipe

187
fittings may have up to 8% lead; plumbing fittings and fixtures up to 4%; and lead solder may have up to 0.2%. In 2010, when this statute becomes effective, the limit on lead content in solder will remain the same. However, the wetted surfaces of pipes, pipe fittings, plumbing fittings and fixtures shall not exceed a weighted average of more than 0.25% lead. The Cell Phone Recycling Act of 2004 enacts the law manifested in the California Public Resources Code §42490-42499335. This statute mandates that all cell phone retailers must develop a recycling program that includes an acceptance and collection plan. In order to sell cellular phones in California after July 1, 2006, a retailer must have an acceptance and collection plan in place. Retailers must accept a used cellular phone, even if it was not bought at their store, providing the consumer purchases a new cell phone from the retailer. Additionally, costs incurred in the collection and disposal of cell phones cannot be passed on to the consumer.
Under the California law listed in the Health and Safety Code §25214.1-25214.4.2, the lead content in toys and jewelry is restricted112. The statute establishes different classes of materials used for jewelry. Class 1 materials are not naturally treated with lead. Class 2 materials include plastic and rubber, electroplated metal, unplated metals and dyes or surface coatings. Plastic or rubber shall not contain lead in excess of 0.06% before August 31, 2009; and less than 0.02% after. Electroplated metals must contain less than 10% lead before August 31, 2009; and less than 6 % after. Unplated metals must contain less than 1.5% lead. Dyes and surface coatings must contain less than 0.06% lead. Class 3 materials are those not meeting class 1 or 2 specifications which contain less than 0.06% lead by weight. On and after September 1, 2007, all jewelry intended for use by children under the age of 6 must be made from a nonmetallic class 1 or 2 material, a metallic material containing less than 0.06% lead by weight, glass or crystal components containing less 0.02% lead, printing ink with less than 0.06% lead and class 3 materials with less than 0.02% lead. On and after March 1, 2008, all types of jewelry must be made of class 1, 2, or 3 materials. Illinois The Lead Poisoning Prevention Act of 2006 (Illinois General Assembly 2006) amends the Lead Poisoning Prevention Act (410 ILCS 45/)147,148. The Illinois Lead Poisoning Prevention Act addresses lead bearing substances, screening protocol, licensing of abatement workers, requirements of property owners, lead poisoning reporting and inspection procedures. As defined in the Act, a lead bearing substance is any item containing or coated with lead such that the lead content exceeds 0.06% by total weight. The Act prohibits the use and application of lead bearing substances on items such as candy, toys, jewelry and clothing that is accessible to use by children. Rhode Island The Rules and Regulations for Lead Poisoning Prevention (R23-24.6) established standards for screening; inspection; reporting and notification requirements; provisions for lead hazard reduction; and licensing and certification procedures263. These regulations impose different threshold levels for the determination of lead-free, lead-safe, and lead hazards. These standards apply to lead in paint, interior dust, soil and water. For example, paint may be considered lead-

188
free if its concentration level does not exceed 150 ppm. It is considered lead-safe if the lead concentration level lies between 150 and 600 ppm. Concentrations above 600 ppm on a damaged surface and above 150 ppm on surfaces abraded by friction are deemed a significant lead hazard. These regulations stipulate that paint, dust, soil or water receiving a lead-free designation upon inspection, are expected to remain safe and require no further action. Lead-safe designations mandate interim actions and maintenance of the effected article, which includes annual re-inspections. The Lead Hazard Mitigation Act of 2002 provides the authority for the implementation of lead regulations by the Housing and Resource Commission336. Owners of rental housing built prior to 1978 must mitigate or abate any existing lead hazards and achieve a lead-safe or lead-free designation. Dwelling units must continue to comply with the lead hazard mitigation standards for paint, dust and soil. Owners are required to maintain compliance with these standards through visual assessments and dust testing. Rhode Island also implements regulations on electronic waste (Health and Safety Code 23-24.10)264, lead-acid batteries265 and toxics in packaging266. Vermont The Vermont Department of Health administers lead control regulations under the authority of 18 VSA Chapter 38288. These regulations govern the abatement of lead hazards, including certification requirements, abatement work practices, and laboratory standards. The statute imposes essential maintenance practices for rental properties and child care facilities. Essential maintenance practices assume that all paint is lead-based and owners of rental and child-care facilities must undergo required steps to determine the facility is safe. The state of Vermont regulates lead-acid batteries289 and toxics in packaging290 and has banned lead fishing weights291. In 2008 Vermont passed a more comprehensive law on lead in products that includes children’s products, children’s jewelry, wheel weights, plumbing fixtures and related supplies, industrial paint, and salvage building materials291b.

189
International Regulation of Lead European Union The European Union has promulgated many laws which regulate the use, sale and disposal of lead. Most recently, the European Parliament and European Council passed Directive 2006/121/EC309 entitled Registration, Evaluation and Authorisation of Chemicals (REACH). The Directive came into effect on June 1, 2007. Previous Directives had separately managed new and existing chemical, but REACH simultaneously regulates both of these categories of chemicals310. REACH operates under the assumption that industry and manufacturers of chemicals are best able to measure the effects of their products. Manufacturers and importers must obtain relevant information regarding the properties of chemicals manufactured and used in excess of 1 tonne during production and, subsequently, submit a dossier to the European Chemicals Agency (ECHA) 310. A technical dossier must be submitted if use exceeds 1 tonne but is less than 10 tonnes310. The use of greater than 10 tonnes requires an in-depth chemical safety report310. To facilitate the registration process and reduce cost to industry, the Directive requires the sharing of data. Additionally, REACH requires that all entities have access to the information necessary for the safe use of chemicals. Submitted dossiers will be evaluated by the ECHA to ensure inclusion of all relevant material. The ECHA will create a list of substances of very high concern that must first be authorized by the Agency prior to use310. The first recommendation for substances is expected in 2009. Although there is currently no list for substances of very high concern, lead and lead compounds are already listed as a restricted substance310. REACH considers lead hydrogen arsenate to be a Carcinogen Category 1, while all other lead compounds, including two pigments, are regarded as Toxic to Reproduction Category 1310. Some exemptions to REACH include food, waste, radioactive substances and items subject to customs inspections. A pair of Directives, enacted to prevent adverse health risks posed to humans and the environment by electrical and electronic equipment, were passed in 2002. First, Directive 2002/95/EC named the Restriction of the use of certain Hazardous Substances (RoHS) mandates that all electrical and electronic equipment be lead-free by 7/1/06311. As defined in the Directive 2005/618/EC, “lead-free” equipment may only have a maximum lead concentration value of 0.1% or 1000 ppm in its homogenous components312. There are exemptions to RoHS, including; glass in cathode ray tubes, some solders, lead as an alloying element, medical equipment and electronic ceramic parts. Lead is allowed as an alloying element in steel up to 0.35% (3500 ppm), in aluminum up to 0.4% (4000 ppm) and as a copper alloy (such as brass) up to 4%. Some classes are exempt from RoHS and WEEE, such as medical devices. A similar Directive, Waste Electrical and Electronic Equipment (WEEE) (Directive 2002/96/EC), regulates the disposal and recycling of such equipment. Producers of waste electrical and electronic equipment (WEEE) must provide information on the disposal and collection systems in place in addition to information regarding the human and environmental health effects. The Directive requires that producers of WEEE finance the collection, treatment and recycling of their WEEE313. To enable efficient recycling and facilitate reuse, WEEE encourages new product design amenable to dismantling and recovery of components. The

190
Directive stipulates that by December 31, 2006 four kilograms of WEEE per inhabitant per year must be collected from private household and separated313. Additional recovery requirements for each individual category of WEEE are stated in the Directive. Another major European law that impacts lead is the End-of-life Vehicles Directive (Directive 2000/53/EC). Passed in 2000, the End-of-life Vehicles (ELV) Directive emphasizes improved waste management of ELV. The Directive aims to increase the use of recycled materials in production while reducing the amount of hazardous materials used. As of July 1, 2003, lead and other toxic metals were prohibited from use in the manufacture of vehicles and their components314. Components with less than 1000 ppm of lead are exempt from the Directive providing that the lead is not intentionally added315. Uses and components exempt from the prohibition are recorded in Annex II which has been amended twice (Directives 2002/525/EC315 and 2005/673/EC316) to narrow the list of acceptable exemptions. Some examples of uses and components no longer exempt from ELV include: lead wheel balance weights, the use of lead as a stabilizer in protective paint, lead alloyed with copper in brake linings, and lead used in valve seats. The ELV Directive only applies to vehicles weighing less than 3.75 tonnes that hold less than 8 passengers314. There are many other European Directives that regulate lead and lead products. Directive 98/70/EC prohibited the marketing of leaded petrol after 2000317. Before the European Union had addressed the issue of lead-based paint, many countries had already adopted individual restrictions. The use of lead paint, specifically lead sulphates and lead carbonates, is banned under Directive 76/769/EEC318. This Directive, passed in 1976, implemented a complete ban of lead in paint until 1989; when it was amended by Directive 89/677/EEC. Directive 89/677/EEC permitted the use of lead paint to restore historical relics such as art and buildings318. The Battery Directive (2006/66/EC), was passed in 2006 in order to amend and harmonize a previous battery law. The only batteries escaping the scope of the Directive are those designed for outer space and military uses. The Directive requires that all batteries containing greater than 40 ppm of lead be labeled with the chemical symbol, Pb319. Also, the Directive describes treatment and recycling processes to be followed and stipulates that at least 65% of all lead-acid batteries must be recycled319. Passed in 1994, Directive 94/62/EC addresses the prevalence of lead and other toxic materials in packaging. The sum of all heavy metals contained in packaging may not exceed a concentration of 100 ppm by weight320. In addition, the Directive stresses the development of a system to return, collect, recover and reuse environmentally-safe packaging. Toys and cosmetics are also regulated by different European laws. In 1988, Directive 88/3378/EEC established standards for the safe manufacture of toys. It harmonized the many different standards existing around the European Community. Toys may not contain more than 0.7 µg/day bioavailable to children321. Also, the European Standard, EN 71-3, states that soluble lead in toys may not exceed 90 ppm322. The Cosmetics Directive (76/768/EEC) and its subsequent amendments prohibit the use of lead and its compounds as any part of the

191
composition of a cosmetic product323. Despite this ban, the Commission acknowledges that trace amounts in products may be unavoidable. Drinking water is regulated by Directive 1998/83/EC. Enacted in 1998, the Directive mandates that lead levels in drinking water must be below 10 ppb324. Member States have fifteen years to come into compliance with the new standard. The Directive mandates that waters with the highest levels of lead that are intended for human consumption must be prioritized in the remediation process. Between the fifth and fifteenth year, lead in drinking water must not exceed 25 ppb325. After the fifteenth year, the new standard of ten ppb comes into effect, thereby removing the 25 ppb standard. Directive 1999/30/EC, commonly known as the First Daughter Directive, regulates the amount of lead in air325. Adopted in 1999, the Directive set the concentration limit of lead in ambient air as 0.5 µg/m3. The new standard was to be met in all Member States by 2005 with the exception of areas surrounding industrial sources. Until 2010, ambient air around industrial lands may contain concentrations of lead up to 1.0 µg/m3. Denmark While Denmark must follow all EU regulations pertaining to lead, it has also developed restrictions that are more stringent. In 2000, Denmark enacted Statutory Order No. 1012, also known as the Lead Order. As of March 1, 2001, the Lead Order banned the import and marketing of all products containing chemical compounds of lead326. The Order defines lead containing as “products in which lead represents more than 100 ppm of their homogenous components326.” The ban applies to all products except those categorically excluded from the Order. A few of these exemptions include: products intended for export, raw materials and semi-finished goods, lead sulphate and lead carbonate in paints, electronic components and glass for special uses326. The Danish Environmental Protection Agency regulates compliance with this order and under very special cases may grant derogations from the Order. China In 2006, the People’s Republic of China adopted the Ministry of Information Industry Order #39, entitled Administrative Measure on the Control of Pollution Caused by Electronic Information Products. This Order is similar to the EU RoHS and is often referred to as China RoHS. The scope of the Order covers electronic information products, which, to name a few, includes: radio and television products, computer products, electronic components and parts, and home electronic products327. Electronic information products are broken down into three classes. Two of these classes may not contain lead in greater concentrations than 1000 ppm328. The other class may not possess intentionally added lead. China RoHS currently regulates the same toxic chemicals as the EU RoHS, including lead, but may add more chemicals as deemed necessary. Lead in products for domestic sale, production and import are subject to the Order327. The marking of electronic information products with a pollution control logo is another requirement of the Order. The marking distinguishes products containing hazardous materials above the standard from those that are hazard-free.

192
Korea Korea recently adopted the Act for Resource Recycling of Electrical and Electronic Equipment and Vehicles (April 2, 2007). The Act combines aspects of the EU RoHS, WEEE and ELV directives and became effective January 1, 2008329. While much of the Act awaits a presidential decree to define its details (the actual scope, regulated substances, limits and exemptions), it nevertheless promotes a design for the environment that facilitates recycling as well as appropriate treatment of waste. It requires that necessary information be passed to recycling entities to ensure safe treatment measures. Manufacturers are directed to collect pertinent data regarding the chemical composition of their products. Korea also employs an Extended Producer Responsibility (EPR) system330. This system requires that manufacturers be held accountable for the entire life cycle of their products. As of January 2005, the EPR system regulates 19 different items that include televisions, some home appliances, packaging material and cellular phones. The EPR system sets mandatory recycling obligations for producers. The recycling obligations for each EPR item are updated yearly. The Ministry of the Environment considers a number of different factors when it decides the recycling requirements for a particular EPR item, including ease of recycling and previous recycling records. Japan Japan has many laws that address recycling including the Law for the Promotion of Effective Utilization of Resources (PEUR) as well as an End-of-Life Vehicle Recycling Law. PEUR was amended in 2006 to include labeling requirements. This amendment is known as J-MOSS. These requirements mandate that the contents of certain electrical and electronic equipment be labeled. If a product contains more than 0.1% lead, mercury, hexavalent chromium, PBB, or PBDE and 0.01% cadmium, a label must indicate their presence331. Products containing less than these amounts receive a green label. This amendment also promotes a movement towards the manufacture of products that are designed for the environment331. These products are more easily recyclable and used for longer periods. J-MOSS does not prohibit the manufacture of products, it only requires the labeling of products containing these specific chemicals. Canada In 1999, the Canadian government passed the Environmental Protection Act (CEPA). This Act significantly revised its preceding analog; embracing pollution prevention of toxic substances as its hallmark. Lead is designated by the CEPA as a toxic substance332. As such, it is subject to the principles that the CEPA embodies. The CEPA employs regulations that advocate the precautionary principle, the elimination of PBTs and polluter responsibility for remediation. The CEPA restricts the use of toxic substances and aims to reduce their exposure to the environment and human health.

193
Basel Convention The Basel Convention establishes regulations that manage the trans-boundary movements of hazardous and other wastes333. As a hazardous waste, lead and lead compounds fall under the scope of the Convention. A major goal of the Convention is the environmentally sound management of hazardous wastes so that human and environmental health is ensured. Also, whenever possible, the Basel Convention directs its members to strive for the minimization of hazardous waste production. Decision II/12, the Basel Ban, made the export of hazardous wastes from OECD to non-OECD countries illegal334. Furthermore, the shipment of hazardous waste to and from non-party countries is illegal333. The United States is a non-party country.


194
Regulation References Federal Sources 1US Code—Title 42—The Public Health and Welfare, <http://www.access.gpo.gov/uscode/title42/chapter63a_.html>, (viewed 27 August 2007). 2US Code—Title 15—Commerce and Trade, <http://www.access.gpo.gov/uscode/title15/chapter53_subchapteriv_.html>, (viewed 27 August 2007). 32005 CFR Title 40, Volume 30, <http://www.access.gpo.gov/nara/cfr/waisidx_06/40cfr745_06.html>, (viewed 27 August 2007). 42005 CFR Title 24, Volume 1, <http://www.access.gpo.gov/nara/cfr/waisidx_07/24cfr35_07.html>, (viewed 9 July 2007). 52006 CFR Title 16, Volume 2, <http://www.access.gpo.gov/nara/cfr/waisidx_06/16cfr1303_06.html>, (viewed 27 August 2007). 5b 2008 Public Law 110-314 Consumer Product Safety Improvement Act (CSPIA) <http://www.cpsc.gov/about/cpsia/legislation.html> (viewed March 10, 2009) 6See <http://www.epa.gov/air/caa/caa.txt>, Environmental Protection Agency, (viewed 27 August 2007). 7See <http://www.epa.gov/air/caa/caaa.txt>, Environmental Protection Agency, (viewed 27 August 2007). 8US Environmental Protection Agency. “Federal Water Pollution Control Act,” November 27, 2002. <http://www.epa.gov/region5/water/pdf/ecwa.pdf>, (viewed 27 August 2007). 9US Code—Title 42—The Public Health and Welfare, <http://www.access.gpo.gov/uscode/title42/chapter6a_subchapterxii_.html>, (viewed 27 August 2007). 10US Code—Title 42—The Public Health and Welfare, <http://www.access.gpo.gov/uscode/title42/chapter6a_subchapterxii_partf_.html>, (viewed 27 August 2007). 11United States Environmental Protection Agency. “Lead and Copper Rule: Summary of Revisions,” April 2000. <http://epa.gov/safewater/lcrmr/pdfs/guidance_lcmr_summary_rule_compliance_dates.pdf>, (viewed 27 August 2007). 12 US Code—Title 42—The Public Health and Welfare, <http://www.access.gpo.gov/uscode/title42/chapter103_.html>, (viewed 27 August 2007). 13 US Code—Title 42—The Public Health and Welfare, <http://www.access.gpo.gov/uscode/title42/chapter103_.html>, (viewed 27 August 2007). 14US Code—Title 42—The Public Health and Welfare, <http://www.access.gpo.gov/uscode/title42/chapter116_.html>, (viewed 27 August 2007). 15US Code—Title 42—The Public Health and Welfare, <http://www.access.gpo.gov/uscode/title42/chapter82_.html>, (viewed 27 August 2007). 16United States Environmental Protection Agency. “40 CFR Ch. I,” July 1, 2006, P. 8. <http://a257.g.akamaitech.net/7/257/2422/22jul20061500/edocket.access.gpo.gov/cfr_2006/julqtr/pdf/40cfr266.23.pdf>, (viewed 27 August 2007). 17US Code—Title 42—The Public Health and Welfare, <http://www.access.gpo.gov/uscode/title42/chapter137_.html>, (viewed 27 August 2007). 18Occupational Safety and Health Admin., Labor. “29 CFR Chapter XVII,” July 1, 2006. <http://a257.g.akamaitech.net/7/257/2422/22jul20061500/edocket.access.gpo.gov/cfr_2006/julqtr/pdf/29cfr1910.1025.pdf>, (viewed 27 August 2007). 19Occupational Safety and Health Admin., Labor. “29 CFR Chapter XVII,” July 1, 2006. <http://a257.g.akamaitech.net/7/257/2422/01jul20061500/edocket.access.gpo.gov/cfr_2006/julqtr/pdf/29cfr1926.62.pdf>, (viewed 27 August 2007). 20EPSDT Benefits, <http://www.cms.hhs.gov/MedicaidEarlyPeriodicScrn/02_Benefits.asp>, (viewed 27 August 2007). 21Social Security Act: Table of Contents, <http://www.ssa.gov/OP_Home/ssact/comp-toc.htm>, (viewed 27 August 2007). 22US Code—Title 15—Commerce and Trade, <http://www.access.gpo.gov/uscode/title15/chapter30_.html>, (viewed 27 August 2007). 23US Code—Title 15—Commerce and Trade, <http://www.access.gpo.gov/uscode/title15/chapter53_.html>, (viewed 27 August 2007).

195
24US Code—Title 42—The Public Health and Welfare, <http://www.access.gpo.gov/uscode/title42/chapter133_.html>, (viewed 27 August 2007). 252005 CFR Title 40, Volume 29, <http://www.access.gpo.gov/nara/cfr/waisidx_06/40cfr503_06.html>, (viewed 27 August 2007). 26US Code—Title 7—Agriculture, <http://www.access.gpo.gov/uscode/title7/chapter6_subchapterii_.html>, (viewed 27 August 2007). 27EPA: Federal Register: Zinc fertilizers mad from recycled hazardous secondary materials, <http://www.epa.gov/EPA-WASTE/2002/July/Day-24/f18405.htm>, (viewed 27 August 2007) 28United State Environmental Protection Agency. “40 CFR Parts 9, 260, 261, et al. Hazardous Waste Management System; Modification of the Hazardous Waste Program; Cathode Ray Tubes; Final Rule,” July 28, 2006. <http://www.epa.gov/epaoswer/hazwaste/recycle/electron/crt-final.pdf>, (viewed 27 August 2007). 29United States Environmental Protection Agency. “Controlling Lead in Drinking Water for School sand Day Care Facilities: A Summary of State Programs,” July 2004. P. 3. <http://www.epa.gov/safewater/lcrmr/pdfs/report_lcmr_schoolssummary.pdf>, (viewed 27 August 2007). 30National Center for Environmental Health │Childhood Lead Poisoning Prevention Program │ Gen In, <http://www.cdc.gov/nceh/lead/faq/about.htm>, (viewed 27 August 2007). 312006 Federal Register, 71 FR 4294; Centralized Library: U.S. Fish and Wildlife Service – FR Doc, <http://www.fws.gov/policy/library/06-745.html>, (viewed 27 August 2007). 322005 CFR Title 50, Volume 6, <http://www.access.gpo.gov/nara/cfr/waisidx_05/50cfr20_05.html>, (viewed 27 August 2007) 33Electronic Code of Federal Regulations:, <http://ecfr.gpoaccess.gov/cgi/t/text/text-idx?idno=21;region=DIV1;type=boolean;c=ecfr;cc=ecfr;sid=488f70fefe0640a86448e916ca70ef97;q1=165;rgn1=Part%20Number;op2=and;q2=110;rgn2=Section%20Number;op3=and;rgn3=Section;rgn=div8;view=text;node=21%3A2.0.1.1.37.2.1.1>, (viewed 27 August 2007) 34US Code – Title 21—Federal Food, Drug and Cosmetic Act, <http://www.access.gpo.gov/uscode/title21/chapter9_.html>, (viewed 27 August 2007). Lead solder 35United States Food and Drug Administration. “21 CFR Ch. I,” April 1, 2006. <http://a257.g.akamaitech.net/7/257/2422/10apr20061500/edocket.access.gpo.gov/cfr_2006/aprqtr/pdf/21cfr189.240.pdf>, (viewed 27 August 2007). Lead foil 36United States Food and Drug Administration. “21 CFR Ch. I,” April 1, 2006. <http://a257.g.akamaitech.net/7/257/2422/10apr20061500/edocket.access.gpo.gov/cfr_2006/aprqtr/pdf/21cfr189.240.pdf>, (viewed 27 August 2007).

196
Washington Sources
38 An Act Requiring the use of Alternatives to Lead Wheel Weights, ESHB 1033, <http://apps.leg.wa.gov/documents/billdocs/2009-10/Pdf/Bills/Session%20Law%202009/1033-S.SL.pdf> , (viewed 21 May 2009) 39Chapter 64.06 RCW: Exceptions for certain transfers of residential real property, <http://apps.leg.wa.gov/rcw/supdefault.aspx?cite=64.06.010>, (Viewed 8 October 2007). 40Chapter 70.95G RCW: Packages containing metals, <http://apps.leg.wa.gov/RCW/default.aspx?cite=70.95G>, (viewed 27 August 2007). 41Chapter 173-900 WAC: Electronic products recycling program, <http://apps.leg.wa.gov/WAC/default.aspx?cite=173-900>, (viewed 27 August 2007). 42Chapter 70.95N RCW: Electronic product recycling, <http://apps.leg.wa.gov/RCW/default.aspx?cite=70.95N>, (viewed 27 August 2007). 43Chapter 173-331 WAC: Vehicle battery recycling, <http://apps.leg.wa.gov/WAC/default.aspx?cite=173-331>, (viewed 27 August 2007). 44WAC 173-303-520: Special requirements for reclaiming spent lead acid battery wastes, <http://apps.leg.wa.gov/WAC/default.aspx?cite=173-303-520>, (viewed 27 August 2007). 45Chapter 365-230 WAC: Accreditation of lead-based paint training programs and the certification, <http://apps.leg.wa.gov/WAC/default.aspx?cite=365-230>, (viewed 27 August 2007). 46Chapter 70.103 RCW: Lead-based paint, <http://apps.leg.wa.gov/RCW/default.aspx?cite=70.103>, (viewed 27 August 2007). 47Chapter 246-290 WAC: Public water supplies, <http://apps.leg.wa.gov/WAC/default.aspx?cite=246-290>, (viewed 27 August 2007). 48Chapter 173-216 WAC: State waste discharge permit program, <http://apps.leg.wa.gov/WAC/default.aspx?cite=173-216>, (viewed 27 August 2007). 49Chapter 90.48 RCW: Water pollution control, <http://apps.leg.wa.gov/RCW/default.aspx?cite=90.48>, (viewed 27 August 2007). 50Chapter 16-200 WAC: Fertilizers, <http://apps.leg.wa.gov/WAC/default.aspx?cite=16-200>, (viewed 27 August 2007). 51Chapter 15.54 RCW: Fertilizers, minerals and limes, <http://apps.leg.wa.gov/RCW/default.aspx?cite=15.54>, (viewed 27 August 2007). 52Chapter 118-40 WAC: Hazardous chemical emergency response planning and community right-to-know, <http://apps.leg.wa.gov/WAC/default.aspx?cite=118-40>, (viewed 27 August 2007). 53Chapter 38.52 RCW: Emergency management, <http://apps.leg.wa.gov/RCW/default.aspx?cite=38.52>, (viewed 27 August 2007). 54Chapter 43.63A.060 RCW Dispositions: Department of community, trade, and economic development, <http://apps.leg.wa.gov/RCW/dispo.aspx?cite=43.63A.060>, (viewed 27 August 2007). 55Chapter 173-306 WAC: Special incinerator ash management standards, <http://apps.leg.wa.gov/WAC/default.aspx?cite=173-306>, (viewed 27 August 2007). 56Chapter 70.138 RCW: Incinerator ash residue, <http://apps.leg.wa.gov/RCW/default.aspx?cite=70.138>, (viewed 27 August 2007). 57Chapter 173-200 WAC: Water quality standards for ground waters of the state of Washington, <http://apps.leg.wa.gov/WAC/default.aspx?cite=173-200>, (viewed 27 August 2007). 58Chapter 90.54 RCW: Water resources act of 1971, <http://apps.leg.wa.gov/RCW/default.aspx?cite=90.54>, (viewed 27 August 2007). 59Chapter 173-307 WAC: Pollution prevention plans, <http://apps.leg.wa.gov/WAC/default.aspx?cite=173-307>, (viewed 27 August 2007). 60Chapter 70.95C RCW: Waste reduction, <http://apps.leg.wa.gov/RCW/default.aspx?cite=70.95C>, (viewed 27 August 2007). 61Chapter 173-201A WAC: Water quality standards for surface waters of the state of Washington, <http://apps.leg.wa.gov/WAC/default.aspx?cite=173-201A>, (viewed 27 August 2007). 62Chapter 173-308 WAC: Biosolids management, <http://apps.leg.wa.gov/WAC/default.aspx?cite=173-308>, (viewed 27 August 2007). 63Chapter 70.95J RCW: Municipal sewage sludge – biosolids, <http://apps.leg.wa.gov/RCW/default.aspx?cite=70.95J>, (viewed 27 August 2007).

197
64Chapter 70.95 RCW: Solid waste management – reduction and recycling, <http://apps.leg.wa.gov/RCW/default.aspx?cite=70.95>, (viewed 27 August 2007). 65Chapter 173-350 WAC: Solid waste handling standards, <http://apps.leg.wa.gov/WAC/default.aspx?cite=173-350>, (viewed 27 August 2007). 66Chapter 16-256 WAC: Commercial feed rules – processed animal waste, <http://apps.leg.wa.gov/WAC/default.aspx?cite=16-256>, (viewed 27 August 2007). 67Chapter 15.53 RCW: Commercial feed, <http://apps.leg.wa.gov/RCW/default.aspx?cite=15.53>, (viewed 27 August 2007). 68Chapter 34.05 RCW: Administrative procedure act, <http://apps.leg.wa.gov/RCW/default.aspx?cite=34.05>, (viewed 27 August 2007). 69Chapter 70.140 RCW: Area-wide soil contamination, <http://apps.leg.wa.gov/RCW/default.aspx?cite=70.140>, (viewed 27 August 2007). 70Chapter 173-360 WAC: Underground storage tank regulations, <http://apps.leg.wa.gov/WAC/default.aspx?cite=173-360>, (viewed 27 August 2007). 71Chapter 90.76 RCW: Underground storage tanks, <http://apps.leg.wa.gov/RCW/default.aspx?cite=90.76>, (viewed 27 August 2007). 72WAC 296-62-07521: Lead, <http://apps.leg.wa.gov/WAC/default.aspx?cite=296-62-07521>, (viewed 27 August 2007). 73Chapter 49.17 RCW: Washington industrial safety and health act, <http://apps.leg.wa.gov/RCW/default.aspx?cite=49.17>, (viewed 27 August 2007). 74Chapter 295-155 WAC: Safety standards for construction work, <http://apps.leg.wa.gov/WAC/default.aspx?cite=296-155>, (viewed 27 August 2007). 75Chapter 173-340 WAC: Model toxics control act – cleanup, <http://apps.leg.wa.gov/WAC/default.aspx?cite=173-340>, (viewed 27 August 2007). 76Chapter 70.105D RCW: Hazardous waste cleanup – model toxics control act, <http://apps.leg.wa.gov/RCW/default.aspx?cite=70.105D>, (viewed 27 August 2007). 77Chapter 173-204 WAC: Sediment management standards, <http://apps.leg.wa.gov/WAC/default.aspx?cite=173-204> 78Chapter 90.70 RCW dispositions: Puget Sound Water Quality Authority, <http://apps.leg.wa.gov/RCW/dispo.aspx?cite=90.70>, (viewed 27 August 2007). 79Chapter 90.52 RCW: Pollution disclosure act of 1971, <http://apps.leg.wa.gov/RCW/default.aspx?cite=90.52>, (viewed 27 August 2007). 80Chapter 43.21C RCW: State environmental policy, <http://apps.leg.wa.gov/RCW/default.aspx?cite=43.21C>, (viewed 27 August 2007). 81Chapter 173-400 WAC: General regulations for air pollution sources, <http://apps.leg.wa.gov/WAC/default.aspx?cite=173-400>, (viewed 27 August 2007). 82Chapter 70.94 RCW: Washington clean air act, <http://apps.leg.wa.gov/RCW/default.aspx?cite=70.94>, (viewed 27 August 2007). 83Chapter 173-460 WAC: Controls for new sources of toxic air pollutants, <http://apps.leg.wa.gov/WAC/default.aspx?cite=173-460>, (viewed 27 August 2007). 84Chapter 173-303 WAC: Dangerous waste regulations, <http://apps.leg.wa.gov/WAC/default.aspx?cite=173-303>, (viewed 27 August 2007). 85Chapter 70.105 RCW: Hazardous waste management, <http://apps.leg.wa.gov/RCW/default.aspx?cite=70.105>, (viewed 27 August 2007). 86Chapter 70.105A RCW: Hazardous waste fees, <http://apps.leg.wa.gov/RCW/default.aspx?cite=70.105A>, (viewed 27 August 2007). 87WAC 232-12-068: Nontoxic shot requirements, ,http://apps.leg.wa.gov/WAC/default.aspx?cite=232-12-068>, (viewed 27 August 2007). 88Chapter 77.12 RCW: Powers and duties, <http://apps.leg.wa.gov/RCW/default.aspx?cite=77.12>, (viewed 27 August 2007). 88b Chapter 70.240 RCW: Children’s Safe Products, http://apps.leg.wa.gov/RCW/default.aspx?cite=70.240.040> (viewed 8 December 2008)

198
Local regulations in Washington 89Seattle Public Schools. “Drinking Water Quality and Access,” December 1, 2004. <http://www.seattleschools.org/area/policies/e/e10-01.pdf>, (viewed 27 August 2007). Other State regulations Alabama
90Alabama Department of Environmental Management. “Water Division – Water Supply Program Division 335-7,” December 12, 2005, P. 117. <http://www.adem.state.al.us/Regulations/Div7/Division%207%20Effective%20December%2012,%202005.pdf>, (viewed 21 August, 2007). 91Alabama Department of Environmental Management “Alabama Risk-Based Corrective Action Guidance Manual,” May 2006, p. 97. http://www.adem.state.al.us/LandDivision/Guidance/ARBCA5062.pdf, (viewed 21 August, 2007). Alabama Legislative Information System Online, <http://alisdb.legislature.state.al.us/acas/ACASLogin.asp>, (viewed 21 August, 2007). 92See Alabama Code, Title 22 Chapter 37, Lead Ban Act of 1988 93See Alabama Code, Title 22 Chapter 37A, Lead Reduction Act of 1997 Alaska 94DOC Frame Page, <http://www.legis.state.ak.us/cgi-bin/folioisa.dll/aac/query=[group+!2718+aac+80!2E010!27!3A]/doc/{@1}/hits only? >, (viewed 21 August, 2007). 95DOC Frame Page, < http://www.legis.state.ak.us/cgi-bin/folioisa.dll/aac/query=%5Bjump!3A!2718+aac+75!2E340!27%5D/doc/%7B@71239%7D/hits_only?>, (viewed 21 August, 2007). Arizona 96Arizona Department of Environmental Quality. “Arizona Administrative Code Department of Environmental Quality – Safe Drinking Water,” September 30, 2002. <http://www.awpca.org/operator/Regulations/adeqr18-04.pdf>, (viewed 21 August, 2007) 97Title 18. Environmental Quality, <http://www.azsos.gov/public_services/Title_18/18-07.htm>, (viewed 21 August, 2007). Arizona Revised Statutes, < http://www.azleg.gov/ArizonaRevisedStatutes.asp>, (viewed 21 August, 2007). 98See 36 ARS §1672-1676, Lead-Based Paint 9944-1322 – Disposal of lead acid batteries, <http://www.azleg.gov/ars/44/01322.htm>, (viewed 21 August, 2007) 10044-1323– Sale of lead acid batteries; fee; notice, <http://www.azleg.gov/ars/44/01323.htm>, (viewed 21 August, 2007). Arkansas 101Primar;y Standards – ADH-DOE, < http://www.healthyarkansas.com/eng/primary.htm#Inorganic%20Contaminants>, (viewed 21 August, 2007). 102Alabama Department of Environmental Management. “Alabama Risk-Based Corrective Action Guidance Manual,” May 2006, <http://www.adem.state.al.us/LandDivision/Guidance/ARBCA5062.pdf> 103Arkansas 86th General Assembly, <http://www.arkleg.state.ar.us/ >, (viewed 21 August, 2007). See ASA Title 20 Chapter 27 Subchapter 6, Lead Poisoning Prevention 104Arkansas 86th General Assembly, <http://www.arkleg.state.ar.us/ >, (viewed 21 August, 2007). See ASA Title 8 Chapter 4 Subchapter 4, Lead-Based Paint Hazard Act 105Arkansas 86th General Assembly, <http://www.arkleg.state.ar.us/ >, (viewed 21 August, 2007). See ASA Title 8 Chapter 9 Subchapter 3 Section 303, Lead-Acid Batteries

199
California Official California Legislative Information, <http://www.leginfo.ca.gov/index.html>, (viewed 10 July 2007). 106California Department of Public Health. “California Regulations Related to Drinking Water,” July 25, 2007. <http://www.cdph.ca.gov/certlic/drinkingwater/Documents/Lawbook/dwregulations-07-25-07.pdf>, (viewed 21 August, 2007 107California Environmental Protection Agency. “Use of California Human Health Screening Levels (CHHSLs) in Evaluation of Contaminated Properties,” 2005. <http://www.calepa.ca.gov/Brownfields/documents/2005/CHHSLsGuide.pdf>, (viewed 21 August, 2007). 108Section 18660.5 of Title 14, Division 7, Chapter 8.2, Article 1, California Code of Regulations, <http://www.ciwmb.ca.gov/Regulations/Title14/Chap08pt2/default.htm>, (viewed 13 July, 2007). 109California Department of Toxic Substance Control. “California’s Restriction on the Use of Certain Hazardous Substances in Covered Electronic Devices.” < http://www.dtsc.ca.gov/HazardousWaste/EWaste/upload/Restrictions_on_Electronic_Devices.pdf>, (viewed 13 July, 2007). 110 Official California Legislative Information, <http://www.leginfo.ca.gov/index.html>, See < http://www.leginfo.ca.gov/cgi-bin/waisgate?WAISdocID=98803826266+0+0+0&WAISaction=retrieve>, (viewed 11 July 2007) 111Official California Legislative Information, <http://www.leginfo.ca.gov/index.html>, See <http://www.leginfo.ca.gov/cgi-bin/waisgate?WAISdocID=98860229396+0+0+0&WAISaction=retrieve>, (viewed 13 July 2007). 112 Official California Legislative Information, <http://www.leginfo.ca.gov/index.html>, See <http://www.leginfo.ca.gov/cgi-bin/displaycode?section=hsc&group=25001-26000&file=25214.1-25214.4.2>, (viewed 27 July 2007) 113See <http://www.leginfo.ca.gov/cgi-bin/waisgate?WAISdocID=7603869099+0+0+0&WAISaction=retrieve> 114 Official California Legislative Information, <http://www.leginfo.ca.gov/index.html>, See <http://www.leginfo.ca.gov/cgi-bin/waisgate?WAISdocID=9894804772+12+0+0&WAISaction=retrieve>, (viewed 23 August 2007) 335 Official California Legislative Information, <http://www.leginfo.ca.gov/index.html>, See <http://www.leginfo.ca.gov/cgi-bin/waisgate?WAISdocID=9890562002+0+0+0&WAISaction=retrieve>, (viewed 13 July 2007) Colorado 116Colorado Department of Public Health and Environment. “State Board of Health Primary Drinking Water Regulations,” 2005. <http://www.cdphe.state.co.us/regulations/waterqualitycontroldivision/100301primarydrinkingwater.pdf> (viewed 24 August, 2007) 117 Colorado Department of Public Health and Environment. “Proposed Soil Remediation Objectives Policy Document,” December 31, 1997. <http://www.cdphe.state.co.us/hm/soilplcydraft.pdf>, (viewed 24 August, 2007) http://www2.michie.com/colorado/lpext.dll?f=templates&fn=fs-main.htm&2.0 118LexisNexis™CD, <http://www2.michie.com/colorado/lpext.dll/Infobase4/3f7fb/41c48/41cd5?f=templates&fn=document-frame.htm&2.0>, See 25-7-1101-1107, Lead-Based Paint Abatement (viewed 24 August, 2007) 119LexisNexis™CD, <http://www2.michie.com/colorado/lpext.dll/Infobase4/3f7fb/413f4/413f6?f=templates&fn=document-frame.htm&2.0> See 25-5-1101 – 1106, Lead Exposure (viewed 24 August, 2007) Connecticut 12019-13-B102 Standards for Quality of Public Drinking Water, <http://www.dph.state.ct.us/phc/browse.asp>, (viewed 21 August 2007)

200
121Connecticut Department of Environmental Protection. “Remediation Standard,” <http://www.ct.gov/dep/lib/dep/regulations/22a/22a-133k-1through3.pdf>, (viewed 21 August 2007) 122Chapter 368a * Department of Public Health, <http://www.cga.ct.gov/2007/pub/Chap368a.htm#Sec19a-111a.htm>, (viewed 21 August 2007) 123Chapter 400c* Lead Abatement Consultants, Contractors And Workers, <Http://Www.Cga.Ct.Gov/2007/Pub/Chap400c.Htm >, (Viewed 22 August 2007) 124An Act Concerning The Collection And Recycling Of Covered Electronic Devices, <Http://Www.Cga.Ct.Gov/2007/Act/Pa/Pdf/2007pa-00189-R00hb-07249-Pa.Pdf>, (Viewed 22 August 2007) 125Chapter 446d * Solid Waste Management, <Http://Www.Cga.Ct.Gov/2007/Pub/Chap446d.Htm#Sec22a-256f.Htm>, (Viewed 25 August 2007) 126Chapter 446d * Solid Waste Management, <Http://Www.Cga.Ct.Gov/2007/Pub/Chap446d.Htm#Sec22a-255i.Htm>, (Viewed 25 August 2007) Delaware 127Delaware Department of Health and Social Services. “Chapter 5 Water, Plumbing and Waste,” <http://www.dhss.delaware.gov/dhss/dph/hsp/files/99fdcodechap5rev.pdf>, (viewed 22 August 2007). 128Delaware Department of Natural Resources. “Remediation Standards Guidance under the Delaware Hazardous Substance Cleanup Act,” December 1999. <http://www.dnrec.state.de.us/DNREC2000/Divisions/AWM/sirb/DOCS/PDFS/Misc/RemStnd.pdf>, (viewed 22 August 2007). 129Chapter 26. Childhood Lead Poisoning Prevention Act, <http://delcode.delaware.gov/title16/c026/index.shtml>, (viewed 22 August 2007). 132414459 Lead Based Paints Hazards, <http://regulations.delaware.gov/AdminCode/title16/4000/4400/4459.shtml>, (viewed 22 August 2007). Florida 131FDEP Drinking Water – Summary of Drinking Water Regulations, <http://www.dep.state.fl.us/water/drinkingwater/st_inorg.htm> (viewed 21 August 2007). 132Table II Soil Cleanup Target Levels, <http://www.dep.state.fl.us/waste/quick_topics/rules/documents/62-777/TableIISoilCTLs4-17-05.pdf>, (viewed 21 August 2007). 133Statutes & Constitution :View Statutes :->2007->Ch0403->Section 7185 : Online Sunshine, <http://www.leg.state.fl.us/statutes/index.cfm?App_mode=Display_Statute&Search_String=&URL=Ch0403/SEC7185.HTM&Title=-%3E2007-%3ECh0403-%3ESection%207185#0403.7185>, (viewed 21 August 2007). 134Statutes & Constitution :View Statutes :->2007->Ch0403->Section 7191 : Online Sunshine, <http://www.leg.state.fl.us/statutes/index.cfm?App_mode=Display_Statute&Search_String=&URL=Ch0403/SEC7191.HTM&Title=-%3E2007-%3ECh0403-%3ESection%207191#0403.7191>, (viewed 21 August 2007). Georgia 135Secretary of State. “391-3-5-.25 Treatment Techniques, Lead and Copper Requirements.” <http://rules.sos.state.ga.us/docs/391/3/5/25.pdf>, (viewed 21 August 2007). 136Secretary of State. “Appendix I Regulated Substances and Soil Concentrations That Trigger Notification.” <http://rules.sos.state.ga.us/docs/391/3/19/AP.pdf>, (viewed 21 August 2007). LexisNexis® Custom Solution: Georgia Code Research Tool, <http://www.lexis-nexis.com/hottopics/gacode/Default.asp>, (viewed 21 August 2007). 137See Title 31 Chapter 41 Section 1, Georgia Lead Poisoning Prevention Act of 1994 138See Title 12 Chapter 8 Section 160-166, Product Packaging 139See Title 12 Chapter 8 Section 28, Lead acid Vehicle Batteries

201
Hawaii 140“Contaminants Regulated by the Safe Drinking Water Branch.” (Effective 12/16/05).” <http://www.hawaii.gov/health/environmental/water/sdwb/sdwb/pdf/State%20MCL.pdf>, (viewed 22 August 2007). 141Hawai’i Department of Health. “Screening for Environmental Concerns at Sites with Contaminated Soil and Groundwater,” August 2006, P. 172, 176, 180. <http://www.hawaii.gov/health/environmental/hazard/pdf/ealsapp1nov2006.pdf>, (viewed 22 August 2007). 142Hawaii Revised Statutes, <http://www.capitol.hawaii.gov/hrscurrent/Vol06_Ch0321-0344/HRS0342I/>, (viewed 22 August 2007). See Chapter 342I Section 1-9, Lead Acid Batteries Idaho 143Department of Environmental Protection. “Idaho Rules for Public Drinking Water Systems.” <http://adm.idaho.gov/adminrules/rules/idapa58/0108.pdf>, (viewed 23 August 2007). 145Idaho Statutes TITLE 39 HEALTH AND SAFETY, <http://www3.state.id.us/idstat/TOC/39070KTOC.html>, (viewed 23 August 2007). Illinois 146Illinois Environmental Protection Agency. “State and Federal Regulated Contaminants,” October 2, 2001. <http://www.epa.state.il.us/water/compliance/drinking-water/publications/regulated-contaminants.pdf>, (viewed 22 August 2007) 147Illinois Pollution Control Board. “Part 742 Tiered Approach to Corrective Action Objectives.” See<http://www.ipcb.state.il.us/documents/dsweb/Get/Document-38408/>, (viewed 22 August 2007) 148410 ILCS 45/ Lead Poisoning Prevention Act., <http://www.ilga.gov/legislation/ilcs/ilcs3.asp?ActID=1523&ChapAct=410%20ILCS%2045/&ChapterID=35&ChapterName=PUBLIC+HEALTH&ActName=Lead+Poisoning+Prevention+Act.>, (viewed 25 August 2007) August 2007) 149415 ILCS 5/22.23, <http://www.ilga.gov/legislation/ilcs/documents/041500050K22.23.htm>, (viewed 25 August 2007) 150415 ILCS 5/21.5, <http://www.ilga.gov/legislation/ilcs/documents/041500050K21.5.htm>, (viewed 25 Indiana 151Indiana Department of Environmental Management. “Appendix 1 Default Closure Tables,” January 31, 2006, P. 12, 17. <http://www.in.gov/idem/programs/land/risc/tech_guide/pdfs/appendix1_2006.pdf>, (viewed 22 August 2007) 152Indiana Code 13-17-14, <http://www.in.gov/legislative/ic/code/title13/ar17/ch14.html>, (viewed 22 August 2007) 153Indiana Code 16-41-39.4, <http://www.in.gov/legislative/ic/code/title16/ar41/ch39.4.html>, (viewed 22 August 2007) 154Indiana Code 13-20-16, <http://www.in.gov/legislative/ic/code/title13/ar20/ch16.html>, (viewed 22 August 2007) Iowa FAST NXT 4, <http://nxtsearch.legis.state.ia.us/NXT/gateway.dll/2007%20Iowa%20Code/2007code/1/27534?f=templates&fn=default.htm>, (viewed 22 August 2007) 155See Iowa Administrative Code Environmental Protection 567—Chapter 41.4(455B) 156See Iowa Administrative Code Environmental Protection 567—Chapter 137.5(5)

202
157See Iowa Code Title 4 Chapter 135 Section 100-105D, Child Lead Poisoning Prevention Program 158See Iowa Code Title 11 Chapter 455D Section 10, Land Disposal of Lead Acid Batteries – prohibited – Collection for Recycling 159See Iowa Administrative Code Environmental Protection 567—Chapter 213 Kansas 160The Kansas Legislature Website, <http://www.kslegislature.org/legsrv-kars/search.do?kar=/28-15a-80.html>, (viewed August 23 2007) 161Kansas Department of Health and Environment, Risk-Based Standards for Kansas RSK Manual – 4th Version, June 2007, P. 34. <http://www.kdheks.gov/remedial/download/RSK_Manual_07.pdf>, (viewed 23 August 2007) 162Statutes, <http://www.kslegislature.org/legsrv-statutes/getStatute.do>, (viewed 23 August 2007) See Chapter 65 Article 1 Sections 200-214, Residential Childhood Lead Poisoning Prevention Act Kentucky 163401 KAR 8:300. Lead and copper, <http://www.lrc.state.ky.us/kar/401/008/300.htm>, (viewed 23 August 2007) 164401 KAR 100.030. Remediation requirements, <http://www.lrc.ky.gov/kar/401/100/030.htm>, (viewed 23 August 2007) Kentucky Revised Statutes, <http://www.lrc.ky.gov/KRS/211-00/CHAPTER.HTM>, (viewed 23 August 2007) 165See Title 18 Chapter 211 Sections 900-905, Lead Poisoning Prevention 166See Title 18 Chapter 211 Sections 9061-9079, Lead-Hazard Detection and Abatement 167See Title 18 Chapter 224 Subchapter 50 Sections .410 and .413, Lead Acid Batteries Louisiana 168Department of Health and Hospitals. “Part XII. Water Supplies,” October 20 2004, P. 80. <http://www.dhh.louisiana.gov/offices/publications/pubs-238/Part%20XII%20watersupplies.pdf>, (viewed 23 August 2007) 169Louisiana Department of Environmental Quality. “Risk Evaluation/Corrective Action Program,” October 23, 2003, Appendix D P. 16-18. <http://www.deq.louisiana.gov/portal/Portals/0/technology/recap/2003/RECAP%202003%20Appendix%20D%20-%20final.pdf >, (viewed 23 August 2007) Louisiana State Legislature, <http://www.legis.state.la.us/>, (viewed 23 August 2007) 170See <http://www.legis.state.la.us/lss/lss.asp?doc=87364>, (viewed 23 August 2007) 171See <http://www.legis.state.la.us/lss/lss.asp?doc=87432>, (viewed 23 August 2007) 172See <http://www.legis.state.la.us/lss/lss.asp?doc=87433>, (viewed 23 August 2007) Maine 173Department of Human Services. “Maximum Exposure Guidelines(MEGs) for drinking water,” August 7, 2006, P. 2. <http://www.maine.gov/dhhs/eohp/wells/documents/megtable.pdf>, (viewed 22 August 2007) 174Remedial Action Guidelines, Bureau of Remediation and Waste Management, Maine Department of Env, <http://www.maine.gov/dep/rwm/vrap/remactionguidelines.htm>, (viewed 22 August 2007) 175Title 22 – Chapter 252, LEAD POISONING CONTROL ACT, <http://janus.state.me.us/legis/statutes/22/title22ch252sec0.html>, (viewed 22 August 2007) 176Title 38 - §1610. Electronic waste (REALLOCATED FROM TITLE 38, SECTION 1609), <http://janus.state.me.us/legis/statutes/38/title38sec1610.html>, (viewed 22 August 2007) 177Title 38 - §1604. Lead-acid batteries, <http://janus.state.me.us/legis/statutes/38/title38sec1604.html>, (viewed 22 August 2007) 178Title 32 – Chapter 26-A, REDUCTION OF TOXICS IN PACKAGING (HEADING: PL 1989, c.849, §1 (new)), <http://janus.state.me.us/legis/statutes/32/title32ch26-Asec0.html>, (viewed 22 August 2007)

203
179Title 12 - §12663-A. Unlawful sale of lead sinkers, <http://janus.state.me.us/legis/statutes/12/title12sec12663-A.html>, (viewed 22 August 2007) Maryland 180CODE OF MARYLAND REGULATIONS, <http://www.dsd.state.md.us/comar/>, (viewed 23 August 2007) See <http://www.dsd.state.md.us/comar/26/26.04.01.06%2D2.htm>, (viewed 23 August 2007) 181Department of the Environment. “Cleanup Standards for Soil and Groundwater,” August 2001, P. 26. <http://www.mde.state.md.us/assets/document/hazcleanup_Aug2001.pdf>, (viewed 23 August 2007) 182See Title 6 Subtitle 8 Sections 801-852, Reduction of Lead Risk in Housing, <http://mlis.state.md.us/cgi-win/web_statutes.exe?gen&6-801>, (viewed 23 August 2007) 183See Title 6 Subtitle 10 Sections 1001-1005, Accreditation of Lead Paint Abatement Services, <http://mlis.state.md.us/cgi-win/web_statutes.exe?gen&6-1001>, (viewed 23 August 2007) 184Annotated Code of Maryland – Environmental Article, <http://www.dsd.state.md.us/comar/Annot_Code_Idx/EnvirIndex.htm>, (viewed 23 August 2007) 185See Title 9 Subtitle 19 Sections 1901-1907, Toxics in Packaging, <http://mlis.state.md.us/cgi-win/web_statutes.exe?gen&9-1901>, (viewed 23 August 2007) Massachusetts 186Department of Environmental Protection, “310 CMR: DEPARTMENT OF ENVIRONMENTAL PROTECTION,” November 3, 2006, P. 47. <http://www.mass.gov/dep/service/regulations/310cmr22.pdf>, (viewed 22 August 2007). 187Department of Environmental Protection, “310 CMR: DEPARTMENT OF ENVIRONMENTAL PROTECTION,” March 24, 2006, P. 261. <http://mass.gov/dep/service/regulations/310cmr40.pdf>, (viewed 22 August 2007). 188See<http://www.mass.gov/Eeohhs2/docs/dph/environmental/lead/1054601.pdf>, (viewed 5 July 2007). 189Massachusetts Department of Environmental Protection. “Guidance for Solid Waste Handling and Disposal Facilities On Compliance With MassDEP’s Waste Bans,” December 23, 2005. <http://www.mass.gov/dep/recycle/solid/cdwbguid.pdf>, (viewed 22 August 2007). 189b Code of Massachusetts Regulations (CMR) 321 CMR 4:00 Fishing 4.01 Taking of Certain Fish <http://www.mass.gov/dfwele/dfw/regulations/cmr/cmr_400.htm> (viewed 6 January 2009) Michigan 190Department of Environmental Quality, Michigan Safe Drinking Water Act, revised February 28, 2006, P. 24. <http://www.deq.state.mi.us/documents/deq-wd-water-fos-tsu-Act399.pdf>, (viewed 23 August 2007). 191Department of Environmental Quality, Attachment 1, January 23, 2006, P. 1.20, <http://www.deq.state.mi.us/documents/deq-rrd-OpMemo_1-Attachment1Table2SoilResidential.pdf>, (viewed 23 August 2007). 192Department of Environmental Quality, Attachment 1, January 23, 2006, P. 1.32. <http://www.deq.state.mi.us/documents/deq-rrd-OpMemo_1-Attachment1Table3SoilCommercial.pdf>, (viewed 23 August 2007). 193Michigan Legislature, <http://www.legislature.mi.gov/(S(ork2th45tgzxw4zdr3zi4uqm))/mileg.aspx?page=getobject&objectname=mcl-368-1978-5-54A&queryid=19437873&highlight=lead>, (viewed 23 August 2007). 194Michigan Legislature, <http://www.legislature.mi.gov/(S(ork2th45tgzxw4zdr3zi4uqm))/mileg.aspx?page=getObject&objectName=mcl-451-1994-II-5-171>, (viewed 23 August 2007).

204
Minnesota 195Drinking Water Standards for Contaminants Microbiological, Radiological, and Inorganic Contamin, <http://www.health.state.mn.us/divs/eh/water/com/fs/ioc.html >, (viewed 23 August 2007). 196Minnesota Pollution Control Agency, Draft Guidelines Risk-Based Guidance for the Soil – Human Health Pathway, January 1999, P. 225, 236, 247, 259, 269, 279. <http://www.pca.state.mn.us/cleanup/pubs/srv3_99.pdf>, (viewed 23 August 2007). 197144.9501, Minnesota Statutes 2006, <http://ros.leg.mn/bin/getpub.php?pubtype=STAT_CHAP_SEC&year=2006§ion=144.9501&keyword_type=exact&keyword=lead>, (viewed 23 August 2007). 198Minnesota Session Laws 2007 – Chapter 48, <http://ros.leg.mn/bin/getpub.php?type=law&year=2007&sn=0&num=48>, (viewed 23 June 2007). 199Minnesota Rule 7045.0685, <http://ros.leg.mn/bin/getpub.php?pubtype=RULE_CHAP_SEC&year=current§ion=7045.0685&keyword_type=exact&keyword=lead-acid>, (viewed 23 August 2007). 200115A.965, Minnesota Statutes 2006, <http://ros.leg.mn/bin/getpub.php?pubtype=STAT_CHAP_SEC&year=2006§ion=115A.965&keyword_type=exact&keyword=packaging>, (viewed 23 August 2007). Mississippi Legal Resources, <http://michie.com/mississippi/lpext.dll?f=templates&fn=main-h.htm&cp=>, (viewed 23 August 2007). 201See Title 41 Chapter 26, Safe Drinking Water Act of 1997 202See Title 49 Chapter 17, Lead-Based Paint Activity Accreditation and Certification Act 203See Title 17 Chapter 17, Disposal of Waste Tires and Lead Acid Batteries; Right-Way-To-Throw-Away Program 204Mississippi Department of Environmental Quality. “Risk Evaluation Procedures for Voluntary Cleanup and Redevelopment of Brownfield Sites,” February 28, 2002, Appendix A P. 5. <http://www.deq.state.ms.us/MDEQ.nsf/pdf/GARD_brownfieldrisk/$File/Proced.pdf?OpenElement>, (viewed 22 August 2007). Missouri 205Matt Blunt, Secretary of State. “Rules of Department of Natural Resources Division 60—Public Drinking Water Program Chapter 15—Lead and Copper,” March 31, 2003. <http://www.sos.mo.gov/adrules/csr/current/10csr/10c60-15.pdf>, (viewed 22 August 2007). 206Missouri Department of Natural Resources. “MRBCA Guidance Document – Final Draft,” February 2005. <http://www.dnr.mo.gov/env/hwp/tanks/docs/soiltypedep.pdf>, (viewed 22 August 2007). 207Lead Poisoning MISSOURI REVISED STATUTES, <http://www.moga.mo.gov/STATUTES/STATUTES.HTM#T41>, (viewed 22 August 2007) 208See Title XLI Chapter 701 Section 300-349, <http://www.moga.mo.gov/STATUTES/C701.HTM>, (viewed 22 August 2007) 209See Title XVI Chapter 260 Sections 820-826, <http://www.moga.mo.gov/STATUTES/C260.HTM>, (viewed 22 August 2007) Montana 210Montana Department of Environmental Quality. “Drinking Water Regulations for Community Public Water Supplies,” September 21, 1999, P. 7. <http://www.deq.state.mt.us/wqinfo/pws/docs/99CSUM.PDF>, (viewed 22 August 2007)

205
Nebraska <http://www.sos.state.ne.us/business/regsearch/>, (viewed 21 August 2007). 212See<http://www.sos.state.ne.us/business/regsearch/Rules/Health_and_Human_Services_System/Title-179/Chapter-12.pdf>, (viewed 21 August 2007) 213Nebraska Department of Environmental Quality. “Nebraska Voluntary Cleanup Program Guidance,” August 2006, Attachment 2-6, P. 7. <http://www.deq.state.ne.us/Publica.nsf/23e5e39594c064ee852564ae004fa010/d243c2b56e34ea8486256f2700698997/$FILE/VCP%20GD%20August%202006.pdf >, (viewed 21 August 2007) 214Index – Chapter 71, <http://uniweb.legislature.ne.gov/legaldocs/view.php?page=s71index>, (viewed 21 August 2007). See Nebraska Revised Statutes Chapter 71 Sections 71-6318 to 71-6331.01, Residential Lead-Based Paint Professions Practice Act 215Battery Council International: State Recycling, <http://www.batterycouncil.org/states.html>, (viewed 21 August 2007). Nevada 216Nevada Revised Statutes: Chapter 445A, <http://www.leg.state.nv.us/NRS/NRS-445A.html#NRS445ASec855>, (viewed 21 August 2007) 217Personal Correspondence with Joe Sawyer. August 30, 2007. 218Nevada Revised Statutes: Chapter 444, <http://www.leg.state.nv.us/NRS/NRS-444.html#NRS444Sec583>, (viewed 21 August 2007). New Hampshire 219New Hampshire of Environmental Services. “New Hampshire Code of Administrative Rules,” <http://www.des.state.nh.us/rules/env-ws381.pdf>, (viewed 22 August 2007) 220 New Hampshire of Environmental Services. New Hampshire Code of Administrative Rules. “Table 600-2 Soil Remediation Standards,” P. 35. <http://www.des.state.nh.us/rules/Env-Or600.pdf>, (viewed 22 August 2007) 221CHAPTER 130-A LEAD PAINT POISONING PREVENTION AND CONTROL, <http://www.gencourt.state.nh.us/rsa/html/X/130-A/130-A-mrg.htm>, (viewed 22 August 2007) 222 Battery Council International: State Recycling, <http://www.batterycouncil.org/states.html>, (viewed 21 August 2007). 223New Hampshire Statutes – Table of Contents, <http://www.gencourt.state.nh.us/rsa/html/NHTOC/NHTOC-X-149-M.htm>, (viewed 22 August 2007) See Title X Chapter 149-M Section 32-40, Toxics Reduction 224Section 211:13-b Lead Fishing Sinkers and Jigs; Use Prohibited. <http://www.gencourt.state.nh.us/rsa/html/XVIII/211/211-13-b.htm>, (viewed 22 August 2007) 225sb 0176, <http://www.gencourt.state.nh.us/legislation/2007/SB0176.html>, (viewed 22 August 2007) New Jersey 226New Jersey Department of Environmental Protection. “Safe Drinking Water Act Regulations,” November 4, 2004, P. 4. <http://www.state.nj.us/dep/watersupply/sdwarule.pdf>, (viewed 22 August 2007) 227NJDEP SRP – Soil Cleanup Criteria, <http://www.state.nj.us/dep/srp/regs/scc/index.html>, (viewed 22 August 2007) Document View Frame Page, <http://lis.njleg.state.nj.us/cgi-bin/om_isapi.dll?clientID=193555568&Depth=2&depth=2&expandheadings=on&headingswithhits=on&hitsperheading=on&infobase=statutes.nfo&record={43F7}&softpage=Doc_Frame_PG42>, (viewed 22 August 2007) 228See Title 13-1e-99 Sections 44-58, Toxic Packaging Reduction Act 229See Title 13-1e 199-207, Lead Acid Batteries

206
New Mexico 23020.7.10 NMAC, <http://www.nmcpr.state.nm.us/nmac/parts/title20/20.007.0010.htm>, (viewed 23 August 2007) 231New Mexico Environment Department. “Technical Background Document for Development of Soil Screening Levels,” Revision 3.0 August 2005, Table A-1-4. <http://www.nmenv.state.nm.us/HWB/data/NMED_Tech_Background_Doc---_Rev3.0_(August_2005;_Updated_November_2005).pdf>, (viewed 23 August 2007) 232 Battery Council International: State Recycling, <http://www.batterycouncil.org/states.html>, (viewed 21 August 2007). New York 233Part 5, Subpart 5-1 Public Water Systems, <http://www.health.state.ny.us/environmental/water/drinking/part5/subpart5.htm#5141>, (viewed 21 August 2007) 234Subpart 375-6: Remedial Program Soil Cleanup Objectives- NYS Dept. of Environmental Conservation, <http://www.dec.ny.gov/regs/15507.html#15518>, (viewed 21 August 2007) Laws of New York, <http://public.leginfo.state.ny.us/menugetf.cgi?COMMONQUERY=LAWS>, (viewed 21 August 2007) 235See Public Health Law Article 13 Title 10, Control of Lead Poisoning 236See Environmental Conservation Law Article 27 Title 17, Lead Acid Battery Recycling 237See Environmental Conservation Law Article 37 Title 2, Hazardous Packaging 238See Environmental Conservation Law Article 11 Title 3 Section 308, Sale of small lead fishing sinkers prohibited North Carolina 239North Carolina Division of Environmental Health. “Lead and Copper,” February 2006. <http://www.deh.enr.state.nc.us/pws/Compliance/RuleSummaries/leadcopper.pdf>, (viewed 22 August 2007). 241Chapter 130A – Article 19A, <http://www.ncga.state.nc.us/EnactedLegislation/Statutes/HTML/ByArticle/Chapter_130A/Article_19A.html>, (viewed 22 August 2007) 242SL2007-0550, <http://www.ncga.state.nc.us/Sessions/2007/Bills/Senate/HTML/S1492v7.html> (viewed 31 August 2007) 243North Carolina General Assembly – General Statutes, <http://www.ncga.state.nc.us/gascripts/Statutes/StatutesTOC.pl?Chapter=0130A>, (viewed 22 August 2007) See Chapter 130A Article 9 Section 309.70-73, Lead-Acid Batteries North Dakota 244North Dakota Legislative Branch. “Public Water Supply Systems.” <http://www.legis.nd.gov/information/acdata/pdf/33-17-01.pdf>, (viewed 27 August 2007) 245Personal Correspondence with Curt Erikson. August 30, 2007. 246North Dakota Legislative Branch. “33-20-01.1-04. Care and disposal of solid waste.” <http://www.legis.nd.gov/information/acdata/pdf/33-20-01.1.pdf>, (viewed 27 August 2007) Ohio 247Lawriter – OAC – Chapter 3745-81 Primary Drinking Water Rules, <http://codes.ohio.gov/oac/3745-81>, (viewed 27 August 2007) 248Lawriter – OAC – Chapter 3745-300 Voluntary Action Program, <http://codes.ohio.gov/oac/3745-300>, (viewed 27 August 2007) 249Lawriter – ORC – Chapter 3742: LEAD ABATEMENT, <http://codes.ohio.gov/orc/3742>, (viewed 27 August 2007)

207
Oklahoma 250252_631-3-1.htm, <http://www.oar.state.ok.us/viewhtml/252_631-3-1.htm> Oklahoma Office of Administrative Rules. (viewed 22 August 2007) 251Oklahoma Department of Environmental Quality, “Land” P. 2. <http://www.deq.state.ok.us/factsheets/land/SiteCleanUp.pdf>, (viewed 22 August 2007) Environmental Protection Agency: Region 6, “EPA Human Health Medium-Specific Screening Levels (MSSLs),” January 13, 2004, P. 5. <http://www.epa.gov/sab/pdf/appendix_d_epa_r6_human_health_mssls.pdf>, (viewed 22 August 2007) 252Oklahoma Administrative Code, <http://www.oar.state.ok.us/oar/codedoc02.nsf/All/F1DF7E79048F64B48625730600109B0B?OpenDocument> Oklahoma Office of Administrative Rules. (viewed 22 August 2007) 253Oklahoma Legislature Home Page, <http://www.lsb.state.ok.us/>, (viewed 22 August 2007) See Title 27A Sections 2001-2003, Oklahoma Lead-Acid Battery and Used Motor Oil Recycling Act Oregon 254Department of Human Services. “OAR Chapter 33 Division 061,” February 1, 2006, P. 1. <http://oregon.gov/DHS/ph/dwp/docs/pwsrules/61-0030.pdf> (viewed 22 August 2007) 256Chapter 701 – Construction Contractors and Contracts, <http://www.leg.state.or.us/ors/701.html>, (viewed 22 August 2007) 257Relating to recycling of electronic devices; creating new provisions; and amending ORS 459.247, <http://www.leg.state.or.us/07reg/measures/hb2600.dir/hb2626.en.html>, (viewed 22 August 2007) 258Chapter 459—Solid Waste Management, <http://www.leg.state.or.us/ors/459.html>, (viewed 22 August 2007) Pennsylvania 259Pennsylvania Code, <http://www.pacode.com/secure/data/025/chapter109/chap109toc.html>, (viewed 22 August 2007) 260Pennsylvania Department of Environmental Protection. “Table 4 – Medium-Specific Concentrations (MSCs) for Inorganic Regulated Substances in Soil,” November 24, 2001. <http://www.depweb.state.pa.us/landrecwaste/lib/landrecwaste/land_recycling/table_4a.pdf>, (viewed 22 August 2007) 337Northeast Recycling Council, Inc. “Fact Sheet,” January 2005. <http://www.toxicsinpackaging.org/adobe/TPCH-fact-sheet.PDF>, (viewed 1 September 2007). Rhode Island
261State of Rhode Island and Providence Plantations Department of Health. “Rules and Regulations Pertaining to Public Drinking Water,” January 2005, P. 50. <http://www.rules.state.ri.us/rules/released/pdf/DOH/DOH_3355.pdf>, (viewed 21 August 2007). 262State of Rhode Island and Providence Plantations Department of Environmental Management. “Remediation Regulations,” February 2004, P. 38. <http://www.dem.ri.gov/pubs/regs/regs/waste/remreg04.pdf>, (viewed 21 August 2007) 263Chapter 23-24.6- Index of Sections, <http://www.rilin.state.ri.us/Statutes/TITLE23/23-24.6/INDEX.HTM>, (viewed 21 August 2007). 264Chapter 23-24.10 – Index of Sections, <http://www.rilin.state.ri.us/Statutes/TITLE23/23-24.10/INDEX.HTM>, (viewed 21 August 2007). 265Chapter 23-60 – Index of Sections, <http://www.rilin.state.ri.us/Statutes/TITLE23/23-60/INDEX.HTM>, (viewed 21 August 2007). 266Chapter 23-18.13- Index of Sections, <http://www.rilin.state.ri.us/Statutes/TITLE23/23-18.13/INDEX.HTM>, (viewed 21 August 2007). 336Chapter 42-128.1 – Index of Sections, <http://www.rilin.state.ri.us/Statutes/TITLE42/42-128.1/INDEX.HTM>, (viewed 31 August 2007).

208
South Carolina 267South Carolina Department of Health and Environmental Control. “R. 61-58 State Primary Drinking Water Regulation,” October 27, 2006, P. 303. <http://www.scdhec.gov/environment/water/regs/r.61-58/61-58.pdf>, (viewed 22 August 2007) 268 Personal Correspondence with Gary Stewart. August 23, 2007. 269S.C. Code of Laws Title 44 Chapter 53 Poisons, Drugs and Other Controlled Substances –www.scst, <http://www.scstatehouse.net/code/t44c053.htm>, (viewed 22 August 2007) 270South Carolina Department of Health and Environmental Control. “R. 61-107.8 SWM: Lead-Acid Batteries,” June 23, 1995. <http://www.scdhec.gov/lwm/regs/R61-107_8.pdf>, (viewed 22 August 2007) South Dakota 271SDDENR Drinking Water Standards, <http://www.state.sd.us/DENR/des/drinking/standard.htm>, (viewed 22 August 2007) 272 Personal Correspondence with Carrie Jacobson. August 24, 2007. 273South Dakota Codified Laws, <http://legis.state.sd.us/statutes/DisplayStatute.aspx?Statute=34A-6-91&Type=Statute>, (viewed 22 August 2007) Tennessee 274Tennessee Department of State. “Rules of Tennessee Department of Environment and Conservation,” October 2006, P. 87. <http://www.state.tn.us/sos/rules/1200/1200-05/1200-05-01.pdf>, (viewed 23 August 2007) 275Tennessee Department of Environment and Conservation. “Standard Operating Procedure of the State Remediation Program,” P. 36. <http://www.state.tn.us/environment/swm/pdf/srpsop.pdf> (viewed 23 August 2007) 276Michie’s Legal Resources, <http://www.michie.com/tennessee/lpext.dll/tncode/22996/2416b/24386/24472/2453b?f=templates&fn=document-frame.htm&2.0#JD_68-211-866>, (viewed 23 August 2007) 277Michie’s Legal Resources, <http://www.michie.com/tennessee/lpext.dll/tncode/22996/238d7/23f2c/23f9d?f=templates&fn=document-frame.htm&2.0#JD_t68un50dddch131p4>, (viewed 23 August 2007) Texas 278Texas Commission on Environmental Quality. “Drinking Water Standards Governing Drinking Water Quality and Reporting Requirements for Public Water Systems,” November 2005, P. 10. <http://www.tceq.state.tx.us/files/rg-346.pdf_4006148.pdf>, (viewed 21 August 2007) 279Figure: 30 TAC §335.568, <http://info.sos.state.tx.us/fids/30_0335_0568-1.html>, (viewed 21 August 2007) 280“Occupations Code Chapter 1955. Lead-Based Paint Abatement,” June 2003. <http://tlo2.tlc.state.tx.us/statutes/docs/OC/content/pdf/oc.012.00.001955.00.pdf>, (viewed 21 August 2007) 28180(R) HB 2714- Enrolled version – Bill Text, <http://www.capitol.state.tx.us/tlodocs/80R/billtext/html/HB02714F.htm>, (viewed 21 August 2007) 282Texas Administrative Code, <http://info.sos.state.tx.us/pls/pub/readtac$ext.ViewTAC?tac_view=5&ti=30&pt=1&ch=328&sch=C&rl=Y>, (viewed 21 August 2007) Utah 283UT Admin Code R309-200. Monitoring and Water Quality: Drinking Water Standards, <http://www.rules.utah.gov/publicat/code/r309/r309-200.htm#T5>, (viewed 23 August 2007) 284Personal Correspondence with Bob O’Brien. August 21, 2007.

209
285Utah Code Section 19-6-602, <http://le.utah.gov/~code/TITLE19/htm/19_06104.htm>, (viewed 23 August 2007) Vermont 286Vermont Department of Environmental Conservation. “Environmental Protection Rules Chapter 21 Water Supply Rule,” April 25, 2005, P. 43. <http://www.anr.state.vt.us/dec/watersup/wsrule/Vermont%20WSR%20April%202005.pdf>, (viewed 22 August 2007) 287cleanup 288The Vermont Statutes Online, <http://www.leg.state.vt.us/statutes/sections.cfm?Title=18&Chapter=038>, (viewed 22 August 2007) 289The Vermont Statutes Online, <http://www.leg.state.vt.us/statutes/fullsection.cfm?Title=10&Chapter=159&Section=06621c>, (viewed 22 August 2007) 290The Vermont Statutes Online, <http://www.leg.state.vt.us/statutes/fullsection.cfm?Title=10&Chapter=159&Section=06620a>, (viewed 22 August 2007) 291The Vermont Statutes Online, <http://www.leg.state.vt.us/statutes/fullsection.cfm?Title=10&Chapter=111&Section=04615>, (viewed 22 August 2007) 291bThe Vermont Statutes Online, http://www.leg.state.vt.us/statutes/sections.cfm?Title=09&Chapter=063>, (viewed 22 January 2009) Virginia 292Virginia Department of Health. “12 VAC 5-590, Waterworks Regulations,” December 14, 2006, Part II Article 1 – 64. <http://www.vdh.virginia.gov/drinkingwater/documents/completesetofwaterworksregulations-12-14-06.pdf> (viewed 21 August 2007) 293LIS > Administrative Code > 9VAC20-160-90, <http://leg1.state.va.us/cgi-bin/legp504.exe?000+reg+9VAC20-160-90>, (viewed 21 August 2007) 294LIS > Code of Virginia, <http://leg1.state.va.us/cgi-bin/legp504.exe?000+cod+TOC>, (viewed 21 August 2007) See <http://leg1.state.va.us/cgi-bin/legp504.exe?000+cod+10.1-1425.1> See <http://leg1.state.va.us/cgi-bin/legp504.exe?000+cod+10.1-1425.2> See <http://leg1.state.va.us/cgi-bin/legp504.exe?000+cod+10.1-1425.3> See <http://leg1.state.va.us/cgi-bin/legp504.exe?000+cod+10.1-1425.4> See <http://leg1.state.va.us/cgi-bin/legp504.exe?000+cod+10.1-1425.5> 295LIS > Administrative Code > 9VAC20-80-710, <http://leg1.state.va.us/cgi-bin/legp504.exe?000+reg+9VAC20-80-710>, (viewed 21 August 2007) 296LIS > Code of Virginia, <http://leg1.state.va.us/cgi-bin/legp504.exe?000+cod+TOC10010000014000000000000>, (viewed 21 August 2007) See 10.1.1425.20-10.1.1425.25 West Virginia 297West Virginia Regulatory Development and Compliance Program – Regulations Page, <http://www.wvdhhr.org/oehs/eed/c&e/regulations.asp>, (viewed 23 August 2007) 298West Virginia Division of Environmental Protection. “West Virginia Voluntary Remediation and Redevelopment Act,” March 13, 2001. Appendix C-1 P. 12. <http://www.wvdep.org/Docs/3200_RemediationGuidanceVersion2-1.pdf>, (viewed 23 August 2007) 299West Virginia Code, <http://www.legis.state.wv.us/WVCODE/16/masterfrmFrm.htm>, (viewed 23 August 2007) See WVC 16-35-1 thru WVC 16-35-13 300WVSOS – Administrative Law – CSR Rule Selected, <http://www.wvsos.com/csr/verify.asp?TitleSeries=33-04>, (viewed 23 August 2007)

210
Wisconsin 301Department of Natural Resources. “Chapter NR 809 Safe Drinking Water,” May 2005, P. 27. <http://www.legis.state.wi.us/rsb/code/nr/nr809.pdf>, (viewed 22 August 2007) 302Department of Natural Resources. “Chapter NR 720 Soil Cleanup Standards,” January, 2001, P. 5. <http://www.legis.state.wi.us/rsb/code/nr/nr720.pdf>, (viewed 22 August 2007) 303Revisor of Statutes. “Chapter 254 Environmental Health,” May 31, 2007, P. 2-8. <http://www.legis.state.wi.us/statutes/Stat0254.pdf>, (viewed 21 August 2007) 304Revisor of Statutes. “Chapter 287 Solid Waste Reduction, Recovery and Recycling” May 31, 2007, P. 10-11. <http://www.legis.state.wi.us/statutes/Stat0287.pdf>, (viewed 21 August 2007) 305Revisor of Statutes. “Chapter 100 Marketing; Trade Practices,” May 31, 2007, P. 28. <http://www.legis.state.wi.us/statutes/Stat0100.pdf>, (viewed 21 August 2007) Wyoming 306Wyoming Drinking Water – US EPA Region 8, <http://www.epa.gov/region08/water/dwhome/wycon/wycon.html>, (viewed 21 August 2007) 307Wyoming Department of Environmental Quality. “Fact Sheet 12: Soil Cleanup Level Look-Up Table,” August 3, 2007, P. 22. <http://deq.state.wy.us/volremedi/downloads/Current%20Fact%20Sheets/F.S.12%20standardized%20_8-3-07_R1.pdf>, (viewed 21 August 2007) 308Wyoming Statutes, <http://legisweb.state.wy.us/statutes/statutes.aspx?file=titles/Title35/T35CH11AR5.htm>, (viewed 21 August 2007)

211
International Sources 309Official Journal of the European Union. “Directive 2006/121/EC of the European Parliament and of the Council,” December 18, 2006. <http://eur-lex.europa.eu/LexUriServ/site/en/oj/2006/l_396/l_39620061230en08500856.pdf>, (viewed 27 August 2007) 310Official Journal of the European Union. “Regulation (EC) No 1907/2006 of the European Parliament and of the Council,” December 18, 2006. <http://eur-lex.europa.eu/LexUriServ/site/en/oj/2006/l_396/l_39620061230en00010849.pdf>, (viewed 27 August 2007) 311EUR-Lex – 32002L0095 – EN, <http://eur-lex.europa.eu/LexUriServ/LexUriServ.do?uri=CELEX:32002L0095:EN:HTML>, (viewed 27 August 2007) 312EUR-Lex – 32005D0618 – EN, <http://eur-lex.europa.eu/LexUriServ/LexUriServ.do?uri=CELEX:32005D0618:EN:HTML>, (viewed 27 August 2007) 313EUR-Lex – 32002L0096 – EN, <http://eur-lex.europa.eu/LexUriServ/LexUriServ.do?uri=CELEX:32002L0096:EN:HTML>, (viewed 27 August 2007) 314EUR-Lex – 32002L0053 – EN, <http://eur-lex.europa.eu/LexUriServ/LexUriServ.do?uri=CELEX:32000L0053:EN:HTML>, (viewed 27 August 2007) 315Official Journal of the European Union. “Commission Decision of 27 June 2002 amending Annex II of Directive 2000/53/EC of the European Parliament and of the Council on end-of-life vehicles,” June 27, 2002. <http://eur-lex.europa.eu/LexUriServ/site/en/oj/2002/l_170/l_17020020629en00810084.pdf>, (viewed 27 August 2007) 316Official Journal of the European Union. “Council Decision of 20 September 2005 amending Annex II of Directive 2000/53/EC of the European Parliament and of the Council on end-of-life vehicles,” September 20, 2005. <http://eur-lex.europa.eu/LexUriServ/site/en/oj/2005/l_254/l_25420050930en00690072.pdf>, (viewed 27 August 2007) 317EUR-Lex – 31998L0070 – EN, <http://eur-lex.europa.eu/LexUriServ/LexUriServ.do?uri=CELEX:31998L0070:EN:HTML>, (viewed 27 August 2007) 318Defra, UK – Environmental Protection – Chemicals – Lead paint advice sheet 4, <http://www.defra.gov.uk/environment/chemicals/lead/advice4.htm>, (viewed 27 August 2007) 319Official Journal of the European Union. “Directive 2006/66/EC of the European Parliament and of the Council,” September 6, 2006. <http://eur-lex.europa.eu/LexUriServ/site/en/oj/2006/l_266/l_26620060926en00010014.pdf>, (viewed 27 August 2007) 320EUR-Lex – 31994L0062 – EN, <http://eur-lex.europa.eu/LexUriServ/LexUriServ.do?uri=CELEX:31994L0062:EN:HTML>, (viewed 27 August 2007) 321Office for Official Publications of the European Communities. “Consleg: 1988L0378 – 02/08/1993,” August 2, 1993. <http://europa.eu.int/eur-lex/en/consleg/pdf/1988/en_1988L0378_do_001.pdf>, (viewed 27 August 2007) 322EUROPA – Consumer Affairs – Unsafe products, <http://ec.europa.eu/consumers/dyna/rapex/create_rapex.cfm?rx_id=93>, (viewed 27 August 2007) 323The Council of European Communities. “Council Directive of 27 July 1976 on the approximation of the laws of the Member States relating to cosmetic products,” August 9, 2006. <http://eur-lex.europa.eu/LexUriServ/site/en/consleg/1976/L/01976L0768-20060809-en.pdf>, (viewed 27 August 2007) 324Official Journal of the European Union. “Council Directive 98/83/EC of 3 November 1998 on the quality of water intended for human consumption,” December 5, 1998. <http://europa.eu.int/eur-lex/pri/en/oj/dat/1998/l_330/l_33019981205en00320054.pdf>, (viewed 27 August 2007) 325Official Journal of the European Union. “Council Directive 1999/30/EC of 22 April 1999 relating to limit values for sulphur dioxide, nitrogen dioxide and oxides of nitrogen, particulate matter and lead in ambient air,” June 29, 1999. <http://europa.eu.int/eur-lex/pri/en/oj/dat/1999/l_163/l_16319990629en00410060.pdf>, (viewed 27 August 2007) 326Ministry of Environment and Energy, Danish Environmental Protection Agency. “Statutory Order No. 1012 of November 13, 2000 on Prohibition of Import and Marketing of Products containing Lead” November, 2000. Accessed from <http://glwww.mst.dk/homepage/default.asp?Sub=http://glwww.mst.dk/rules/02030000.htm>, (viewed 27 August 2007) 327American Electronic Association. “Management Methods for Controlling Pollution by Electronic Information Products,” <http://www.aeanet.org/governmentaffairs/gabl_ChinaRoHS_FINAL_March2006.asp>, (viewed 27 August 2007) unofficial translation

212
328American Electronic Association. “Standard of the Electronics Industry of the People’s Republic of China,” November 6, 2006. <http://www.aeanet.org/governmentaffairs/gajl_MCV_SJT11363_2006ENG.asp>, (viewed 27 August 2007) 329Yun, J. and Park, I. Eco-Frontier. “Act for Resource Recycling of Electrical and Electronic Equipment and Vehicles English Translation,” April 2, 2007. <http://www.kece.eu/data/Korea_RoHS_ELV_April_2007_EcoFrontier.pdf>, (viewed 27 August 2007) 330Ministry of Environment Republic of Korea, <http://eng.me.go.kr/docs/common/common_view.html?idx=51&av_pg=1&mcode=10&classno=12>, (viewed 27 August 2007) 331Japan Ministry of Economy, Trade and Industry. “Obligation to Provide Information on Chemical Substances contained in Home Appliances and PCs from July 1, 2006.” <http://www.meti.go.jp/policy/recycle/main/3r_policy/policy/pdf/j-moss_english.pdf>, (viewed 27 August 2007) 332Print, <http://laws.justice.gc.ca/en/C-15.31/text.html>, (viewed 27 August 2007) 333“Basel Convention on the Control of Transboundary Movements of Hazardous Wastes and Their Disposal,” October 8, 2005. <http://www.basel.int/text/con-e-rev.pdf>, (viewed 27 August 2007) 334United Nations Environment Programme. “Report of the Parties on the Implementation of Decision II/12,” April 25, 2002. <http://www.basel.int/meetings/imp/wgi1/predocs/unep_chw_wgi_1_9_eng.pdf>, (viewed 27 August 2007)


213
VII Recommendations The recommendations in this chapter are part of a long-term plan to reduce lead exposure, use, and release. For the most part they build on existing programs and address the more urgent public health and environmental concerns while giving due consideration to feasibility, social impacts, and economic costs. Current lead exposure has large economic costs to society. Because there are so many sources of lead, and the potential for harmful lead exposure is relatively common, many different approaches are needed to address various aspects of exposure, use, and release. There is no single solution to the problem. Due to the widespread distribution of potential exposure sources, many of the approaches will take significant commitments of time and resources to implement effectively. Ecology and DOH will need to work with other agencies and the legislature to identify stable sources of funding. The following conclusions form the basis of the recommendations included in this chapter: Lead poisoning still occurs in Washington.
Although lead poisoning is preventable, children and adults with harmful exposures continue to be found. Currently, there is no amount of lead exposure that is known to be safe for children. Therefore it is prudent to recommend actions that reduce children’s exposure to lead as much as feasible. For adults, there is growing evidence that existing occupational standards are not fully protective of workers’ health.
In Washington, there is little reliable information about the number of highly exposed children and the sources of their lead exposure.
Although lead exposure can be assessed with a simple blood lead test, only about 5 percent of Washington children have ever been tested. Most people with harmful lead exposures are never identified. Due to the low rate of testing and infrequent follow-up investigation of childhood lead poisoning cases, the causes of elevated exposures are rarely determined.
Most homes in Washington have lead-based paint or other potential exposure sources that could cause lead poisoning.
Although there are many different sources of exposure, most lead poisonings today are linked to lead-based paint. The actual hazards in individual homes are more difficult to identify andfix.
Lead continues to be used in new products and is still released into the environment in Washington.
Although alternative materials are available for many products, lead is still used by manufacturers. New products may contribute to lead exposures and releases during production, use and disposal.

214
Many people in Washington do not have adequate knowledge of lead hazards and how to reduce exposure.
Although information about the hazards of lead is available to the public, preventable harmful lead exposures still occur from sources around the home (affecting mostly children) and through occupational contact (affecting mostly adults).
Many different approaches have been used by business, government, and nonprofit organizations in their efforts to reduce lead exposure, use, and release. In broad terms, successful approaches have included:
· Identifying existing lead-containing sources and preventing exposure by removing or controlling the hazards.
· Phasing out the use of lead, when feasible, to prevent exposure from the use of new products.
· Identifying highly exposed children and adults by appropriate screening methods and helping reduce their exposure.
· Phasing out the use of lead in manufacturing and better controlling the waste stream to reduce release of lead to the environment.
· Ensuring that people understand the dangers of lead by increasing public awareness about lead hazards and how harmful exposures can be prevented.
While prevention strategies are the most effective ways to reduce and eliminate exposures in the long run, it is important to continue to manage and reduce releases in the short term as well. A consistent challenge in developing recommendations to reduce lead exposures is the number of diverse uses and sources of lead. A truly comprehensive plan to reduce and phase-out lead uses, releases, and exposures to people and the environment in Washington would include:
· Preventing exposure before it happens by requiring the removal or reliable control of all existing lead in paint, soil, plumbing, and products in homes, schools, and child care facilities.
· Banning the unnecessary use of lead in new products. · Improving engineering controls to prevent the release of lead from sewage treatment
facilities and industrial facilities. · Cleaning up all lead contaminated sites, including contaminated soil along our roadways. · Testing all children for lead levels until we have made this unnecessary by removing
sources of lead However, since lead hazards are widespread and these measures would affect many people, they would likely be difficult to implement and would have undesirable social and economic impacts. The recommendations presented in this chapter are the first steps the agencies believe are necessary to practically and effectively reduce the most significant lead exposures and releases that are occurring in Washington. Recommendations are presented for each category of lead exposure sources (legacy, occupational, products and on-going releases). An additional category of recommendations specific to protecting children is also provided because children are the most vulnerable to lead exposures.

215
For each category we include key findings related to that category. We then present the goal associated with this category and options we considered when developing the final recommendations. These are followed by the recommendations and the rationale for each recommendation.
Recommendations identified for implementation:
While all of the recommendations are important, resource constraints require that choices be made. Priority should be given to recommendations that focus on reducing exposure to young children, the largest and most vulnerable group affected by lead. Lead-based paint, often found in older homes, is the largest single cause of lead poisoning for U. S. children. Therefore, the highest priority should be given to those actions that address lead-based paint as an exposure source for children. Lead-based paint is not the only significant source of lead to children and that lead can also harm adults and wildlife. Therefore, our actions should not be limited to only reducing children’s exposure to the most significant sources of lead. In Chapter VIII Implemenation Steps we discuss the recommendations we have selected for initial implementation of this plan.

216
Summary of Recommendations
Reducing Exposure to Children
1. Expand outreach activities.
2. Evaluate lead exposure for all young children. a. Evaluate lead exposure for all young children. b. Identify high risk populations to prioritize efforts. c. Work with WIC and Head Start to facilitate blood lead screening for eligible children. d. Screen Medicaid-eligible children.
3. Improve Childhood Blood Lead Registry. Reducing Exposures from Legacy Sources
4. Require remediation of lead hazards in rental housing if it is a confirmed source of an elevated blood lead level.
5. Require assessment of lead hazards in pre-1960 rental homes at change in tenancy. 6. Encourage assessment of lead hazards in homes, schools and childcares.
a. Develop guidelines for assessment of homes. b. Develop guidelines, standards, and protocols for lead hazard evaluation of child care
facilities. 7. Seek delegation of the EPA renovation rule. 8. Review current MCTA Method A cleanup levels for lead.
Reducing Exposures from Occupational Sources
9. Update education and outreach materials and continue to provide technical assistance. a. L&I and other agencies should continue to develop and provide up-to-date information
and materials for health care providers, business owners, and workers about the hazards of lead to adults and ways to reduce exposure.
b. L&I should encourage more businesses to utilize DOSH consultations. c. Ecology should continue to provide technical assistance to industry.
10. Conduct a statewide survey on occupational use and exposure to lead. 11. Harmonize and update occupational lead regulations for general industry and construction.
Reducing Exposures from New Products
12. Work with stakeholders to reduce the lead in products that have non-lead alternatives. 13. Build on existing programs to provide assistance to industry to reduce lead uses and releases. 14. Encourage additional recycling through education and product stewardship. 15. Participate in the process to update U. S. chemical policy.
Reducing Exposures from Ongoing Releases
16. Continue existing actions.

217
Reducing Exposure to Children
Key Findings:
· Young children are more vulnerable to environmental lead than older children and adults because their rapidly developing bodies are more sensitive to the harmful effects of lead and because they tend to have more exposure.
· In 1991, the Centers for Disease Control and Prevention (CDC) lowered the blood lead level of concern to 10 μg/dL, but there is growing evidence that harmful effects occur at blood lead levels as low as 2 µg/dL, and no safe level of exposure has been identified. Although lead can cause many different types of health effects, learning and behavior problems from damage to the brain are expected to be the most common based on typical childhood exposures.
· The best way to protect children from lead is
to minimize their exposure, preferably by preventing it before it occurs. Removing existing sources or effectively blocking exposure can be expensive. Therefore, until effective methods to prevent lead exposure are broadly implemented, there will be a need to evaluate lead exposure in children in order to identify highly exposed individuals so that they can be helped.
· Lead poisoned children, defined by the CDC as those with blood lead levels ≥ 10 µg/dL, continue to be identified in Washington. Testing children is the only way to evaluate their exposure and identify those with lead poisoning. The harmful effects of lead exposure are often subtle and even children with lead poisoning do not usually look or behave abnormally. A blood lead test is the most common way to evaluate exposure.
Terms Used in this Chapter
CDC Blood Lead Level of Concern: A blood lead level (BLL) >10 µg/dL. CDC acknowledges that lead may cause health problems at levels <10 µg/dL and that no threshold has been identified for the harmful effects of lead.
Lead Poisoning: When a child has a blood lead level >10 µg/dL. Health effects can be subtle and may not be easily observed at a routine medical examination.
Elevated Blood Lead Level (EBLL): As commonly used (and as used in this chapter), a blood lead level >10 µg/dL. Since the average childhood blood lead level in the U.S. is about 2 µg/dL, it could also be used to refer to levels above this average
Lead Exposure Screening: A discussion of lead poisoning risk factors between medical care providers and parents to decide if a blood lead test is indicated.
Blood Lead Level (BLL) Test: A blood test to determine an individual’s BLL. The results are usually given in µg/dL.
Universal Testing: Conducting blood lead tests on all children.
Targeted Testing: Performing blood lead tests on only those children with

218
· In Washington State, only a small percentage of children has ever had a blood lead test (about 5 %) and we do not know why they were tested and others were not. This has two consequences. First, the number of children with lead poisoning in Washington is unknown. Second, most children with lead poisoning in the state are probably never found.
· Although the true number of lead-poisoned children is not known, based on the limited data from recent testing we estimate that about 3000 Washington children under 6 years old have blood lead levels over the current CDC level of concern of 10 ug/dL and more than 10,000 have levels greater than 5 ug/dL.
· Washington is one of the few states that does not require or recommend either universal
or targeted childhood blood lead testing. DOH encourages health care providers to test when the need is indicated by a clinical evaluation. Although the federal government requires all children enrolled in certain programs such as Medicaid to have blood lead tests, these tests are rarely performed in Washington.
· Nationally, risk factors for childhood lead poisoning include living in a home built before
1950, being black or Hispanic, enrollment in Medicaid, and low family income. Based on these risk factors, many children in Washington are at risk for lead poisoning, and their risk appears to be about average compared to the risks for children in the other 49 states. However, compared to other states, Washington ranks near the bottom in both number and percentage of children who get blood lead tests. We have a poor understanding why only a small fraction of Washington children are tested.
· Many states recommend the use of a questionnaire to evaluate a child’s risk of lead
poisoning. While not 100% accurate, risk factor questionnaires can help identify those children who are at increased risk of lead poisoning and should get a blood lead test.
· In Washington, all blood lead test results are reported to DOH and entered into the
Childhood Blood Lead Registry. Most data are entered by hand, and follow-up is sometimes required because reports received by DOH often lack information (such as address and phone number) needed to contact the parents or guardians of children with EBLLs. Any significant expansion of blood lead testing is expected to require increased resources for data entry unless information supplied is more complete and reporting becomes more automated.

219
Goal: Collect better data on childhood blood lead levels to inform other actions. Goal: Find as many children with lead poisoning as possible. Goal: Reduce children’s exposure to lead. Options:
· Develop and provide up-to-date educational materials for health care providers, local health departments, parents, teachers, and community members. The materials would include information on the health effects of lead, sources of lead exposure and how to reduce lead exposure.
· Focus educational efforts on health care providers and parents on the need for blood lead level (BLL) testing.
· Focus educational efforts on adults who use lead at work or as part of a hobby about the potential for take-home lead to expose children.
· Require mandatory BLL testing for all children. · Require targeted mandatory BLL testing of children who live in high risk areas or have
other known risk factors. · Encourage voluntary BLL testing of all children. · Encourage voluntary BLL testing for children who live in high risk areas or have other
known risk factors. · Encourage voluntary screening of all children for risk factors. · Encourage voluntary screening of children who live in a high risk area or have other
known risk factors. · Enforce existing federal requirements for BLL testing. · Improve the Childhood Blood Lead Registry to include mandatory electronic data
reporting and expanded patient information, such as patient address. · Take no additional actions other than to maintain current practices and status quo.
Recommendation #1- Expand outreach activities to ensure that all Washingtonians are aware of the hazards of lead and understand how to reduce exposure.
DOH should work with Ecology and other agencies to increase education and outreach about the hazards of lead, the importance of childhood lead screening, and ways to reduce exposure. This includes developing and providing up-to-date information and materials for all people and organizations that can help reduce childhood lead exposure, including parents, health care providers, local health departments, child care providers, and community members. In addition to basic information for the general population, some targeted educational materials should be developed for people who use specific lead-containing products that are known hazards. For example, some lead poisonings have been linked to the use of certain ethnic remedies that contain significant amounts of lead. Further, adult hobbyists may expose themselves and their children to lead-containing products that are used to make glazed pottery, stained glass, ammunition, and fishing weights.

220
Agencies should work together to develop unified and consistent messages. Washington State agencies that already provide information on lead exposure include DOH, Ecology, Department of Community, Trade and Economic Development (CTED), Department of Early Learning (DEL), Department of Social and Health Services (DSHS), and Department of Labor and Industries (L&I). Federal agencies, including the CDC, Health and Human Services (HHS), Environmental Protection Agency (EPA), Occupational Safety and Health Administration (OSHA), and Housing and Urban Development (HUD) also have educational materials about lead hazards. Rationale DOH guidance forms the basis for education and outreach to health care providers and parents. Awareness of lead hazards is a lynchpin in any program to reduce lead exposure. A broad range of people and professions play a role in screening children for lead poisoning risks and identifying and removing lead exposure sources. The more that parents, health care providers, local health officials, community leaders, and workers know about lead hazards, the more likely those exposures can be reduced. Expanding education and outreach efforts will improve screening and result in an increase in the number of children tested. Since there is no known safe level of lead, all parents should receive information about ways to reduce lead exposure. Parents should understand the hazards of lead, how children are poisoned, and how to reduce or prevent exposure. Health care providers should understand lead hazards and sources, evaluate children to see if they’re at risk, and perform a blood lead test on children with risk factors. Policy makers should be aware of the problem and its extent. Recommendation #2- Evaluate lead exposure for all young children.
a. DOH, DSHS, local health agencies and health care providers should work together to ensure that all young children are evaluated for lead poisoning risks.
b. DOH should identify high risk populations to prioritize screening efforts. c. DOH should work with WIC and Head Start to help facilitate blood lead screening
for eligible children. d. Medicaid-eligible children should be screened for lead exposure risk factors at 12
and 24 months. All children should be screened for lead exposure risk factors at one and two years of age. Screening is a discussion of risk factors between medical care providers and parents to decide if a blood lead test is indicated. If risk factors are identified (or if there is uncertainty about the presence of one or more risk factors), a blood lead test should be performed. The subparts to this recommendation overlap in different ways to try to cover as many children as possible, while also prioritizing high risk children. Rationale More widespread screening combined with expanded education and outreach efforts will result in more testing of children with risk factors. Increasing the number of children who are screened

221
and tested will not only find more children with EBLLs, but will also help us better understand the extent and causes of lead poisoning in Washington. Testing children is the only way to determine their exposures and identify lead poisoning. Some states require that all children be tested, some require that children with certain lead poisoning risk factors be tested, and some, like Washington, have no testing requirements. We recommend universal screening for risk factors (such as low income or old housing), followed by voluntary testing when risk factors are identified or uncertain. This is expected to result in increased blood lead testing for children who are found to be at risk of lead poisoning. We are not recommending universal or targeted mandatory testing. Some states require testing for children with specific risk factors or all children. Mandatory universal testing would identify the most children with EBLLs and would provide the most data to better estimate BLLs statewide. Targeted mandatory testing would identify the majority of children with EBLLs, but would not identify as many as universal testing. Many parents and physicians are resistant to mandatory testing requirements. The time and resources available for medical care are limited, so there is some controversy within the medical community regarding the benefits of screening for lead exposure compared to other health services. Pursuing mandatory approaches before voluntary options are implemented is likely to distract available resources from the most important goal- which is to increase the number of children tested. If voluntary steps do not result in a significant increase in BLL testing, the state should reconsider requiring blood testing for all children or targeted higher risk populations. Testing for BLL could be added to the immunization form and required for all children to register for school or day care. Any requirement for mandatory testing would need a way for parents to opt out, similar to the way immunizations are handled. One way to screen children is with the use of a risk factor questionnaire. DOH is developing a risk factor questionnaire for Washington and plans to evaluate its effectiveness with a group of physicians. If the questionnaire is effective, then all health care providers should be encouraged to use it. Risk factor questionnaires aren’t 100% effective. Using a risk factor questionnaire is not expected to find all children with EBLLs, but it will increase testing among children who are most likely to experience exposure or poisoning. As more children are screened for lead exposure risk factors, it is likely that more will be tested statewide. Focused attention is needed, however, on the most vulnerable and high risk populations who are least likely to have access to quality medical care and are most likely to be exposed to lead. DOH should identify high risk areas considering factors such as age of housing, income, area-wide soil contamination and ethnicity. DOH should strongly encourage and track BLL testing in those areas. DSHS, DOH, local health agencies, physician/nurse organizations, and local health care providers should work together to promote increased screening for lead exposure risk factors. Using a risk factor questionnaire can help organizations and health care providers identify high risk populations in the areas they serve. Children who participate in the Special Supplemental Nutrition Program for Women, Infants and Children (WIC) and/or Head Start are at higher risk for lead exposure, since low income and poor nutrition are associated with higher blood lead levels in the U. S. Providing information

222
about lead exposure and testing to WIC and Head Start participants is a good opportunity to reach a higher risk population. The federal Medicaid agency requires blood lead level testing at 12 and 24 months (42 U.S.C. § 1396d(r)) as part of Medicaid’s early and periodic screening, diagnosis and treatment (EPSDT) requirement. The costs of blood lead screening and testing are covered by Medicaid as part of EPSDT. In the past Washington has not recommended universal blood lead level testing but has strongly supported screening. Historically most of the children in the U.S. with high BLLs have been enrolled in Medicaid. Not all children with high BLLs are in Medicaid, but screening children on Medicaid, with subsequent testing as appropriate, should identify more children with EBLLs. For most children the costs of testing are fully or partially covered by private insurance and Medicaid and the remaining costs to test all children are not large. [see Chapter X-Economic Analysis]. Subsequent actions may be refined or modified to reflect additional information about exposure levels and sources in Washington that is collected as a result of increased testing. Testing more children will also improve our understanding of childhood lead exposure and measure the success of intervention and prevention programs. Recommendation #3 Improve Childhood Blood Lead Registry DOH should request the Board of Health to modify the reporting requirements for blood lead tests to include mandatory electronic data reporting and expanded patient information. Rationale Improvements in data collection will aid efforts to both identify high risk populations and find children with EBLLs. Currently, reports of blood lead test results are sent to DOH by a variety of means and are entered by hand into the Childhood Blood Lead Registry. Over the past several years, when about 1% of children six years or younger have been tested each year, about 0.5 FTE has been required for data entry. If the number of blood lead tests increases significantly, a corresponding increase in staff would be needed for data entry. Mandatory electronic data reporting would significantly reduce the number of staff needed for this task. Blood lead test reports received by DOH often lack information (such as address and phone number) needed to contact the parents or guardians of children with EBLLs. Mandatory inclusion of relevant patient information would facilitate efforts to help children and enhance the identification of risk factors for lead exposure. The reporting system should also include which children are on Medicaid to track Medicaid screening rates and BLLs.

223
Reducing Exposures from Legacy Sources Key Findings:
· Substantial amounts of lead remain in the environment and in many homes from its past use in several products (paint, plumbing materials, pesticides, gasoline). Today, the lead in old paint, old plumbing materials, and soil contaminated with the residues of gasoline and pesticides contributes to many people’s exposure.
· We do not know how much exposure comes from each of the many lead-containing sources in Washington, but in the U.S., most childhood lead poisonings have been linked to dust, chips, and flakes from lead-based paint used in older homes.
· House paint contained up to 50% lead until about 1955, when lead content was
voluntarily reduced to less than 1% by manufacturers. In 1978 the CPSC limited the lead content of most consumer paint to 0.06% (600 ppm). Approximately 60% (1.4 million homes) of the 2.5 million housing units in Washington State were built before 1978 and half of those (700,000 homes) were built before 1960 when use of lead-based paint was common.
· Lead-based paint and lead hazards are common in older homes. A nationally representative study found that 87% of pre-1940 houses have some lead-based paint and 68% have lead hazards. Houses built between 1940 and 1959 were found to have lead-based paint 69% of the time and 43% had lead hazards. Only 24% of homes built between 1960 and 1977 were found to have lead-based paint and 8% had lead hazards.
· Exposure in the home, especially to deteriorating lead-based paint, is thought to be the main cause of lead poisoning in children. Preventing these exposures is the preferred method of reducing lead poisoning but, with 1.4 million homes in Washington with potential lead-based paint hazards, it will likely be many decades before exposure prevention activities will eliminate the sources. Until then, it is important to identify exposure sources in homes where lead poisoning has occurred and prevent these known sources from further endangering children.
· Children and adults can be exposed to lead contaminated soil and dust, both outdoors and after it has been tracked indoors. There are many potential sources contributing to elevated concentrations of lead in soil and, for the most part, the location and degree of contamination has not been well characterized. The federal agency HUD classifies soil contaminated with lead-based paint as a lead-based paint hazard. Soil in large areas of the state has elevated lead levels due to historic smelter emissions and lead arsenate pesticide use. Soil next to roadways may have elevated lead concentrations from the deposition of exhaust of vehicles that used leaded gasoline.
· Lead in drinking water is thought to contribute a small amount of lead exposure to many
people, but is not often identified as the main exposure source in lead poisoning cases. In nature, the amount of lead in water is usually low. Elevated levels are usually due to lead

224
that has leached out of plumbing materials into the water. The concentration in the water depends on the quality of the water, the amount of lead in the plumbing materials, and the amount of time the water is in contact with the leaded materials. Federal regulation requires some testing of drinking water at the faucet in housing to make sure the level of lead is below the action level. However, only a small percentage of homes are tested and many water systems are not required to test every year. While most lead pipes were used in pre-1940 homes, lead solder was legally used with copper pipes until 1988, and plumbing fixtures still contain some lead. New plumbing fixtures may contain up to 8% lead, as long as they do not leach more than 11 ppm lead in a laboratory test.
· When real estate is sold or rented, current federal law requires disclosure of the presence of lead-based paint. Washington law requires disclosure of all materials of environmental concern, with lead-based paint as an example. Both laws allow the property owner to declare that the presence or absence of lead is not known. As a result, there is a disincentive for owners to find out if their property has lead. In addition, home buyers and renters often do not ask for testing results. Older homes and neighborhoods are more likely to have lead hazards than newer ones.
· CTED has existing programs to certify
workers involved in lead-based paint activities such as risk assessment, home inspection, and remediation. For the past few years, CTED has been providing money and other assistance to remediate lead hazards in low-income housing units under its Lead Hazard Control Grant Program (LHCGP). This program partners with local agencies and put into place the infrastructure for targeting remediation in
U. S. Department of Housing and Urban Development (HUD) definitions are commonly used for terms associated with lead-based paint hazards.
Abatement: a measure or set of measures designed to permanently eliminate lead-based paint hazards or lead-based paint. Abatement strategies include the removal of lead-based paint, enclosure, encapsulation, replacement of building components coated with lead-based paint, removal of lead-contaminated dust, and removal of lead-contaminated soil or overlaying of soil with a durable covering such as asphalt.
Interim measures: a set of measures designed to temporarily reduce human exposure or possible exposure to lead-based paint hazards. Such measures include specialized cleaning, repairs, painting, temporary containment, and installation of soil coverings, such as grass or sod. Interim measures remove current hazards, but measures need to be taken to maintain the properties in good condition to prevent future exposures. Monitoring, conducted by owners, and reevaluations, conducted by professionals, are integral elements of interim control.
Remediation: a mix of abatement and interim control measures.
Assessment: a comprehensive investigation of a dwelling to identify lead-based paint hazards. It is performed by a certified risk assessor and includes paint testing, dust and soil sampling, and a visual evaluation. Risk assessment results are summarized in a written

225
high risk areas. The program encourages, but does not require, blood lead testing in children living in these homes.
· It will be difficult to identify and prevent exposure to legacy sources of lead without an ongoing, dedicated funding source. Ecology’s experience in the Tacoma Smelter Plume area has found that property owners have been reluctant to have their soil tested for lead unless funds are available for cleanup of contamination that is found. Also, the LHCGP administered through CTED has income eligibility requirements for which some families will not qualify.
Goal: Protect children and adults by reducing or eliminating existing sources of lead exposure. Goal: Help children with elevated levels of lead resulting from exposure to legacy sources of lead. Options:
· The following options could be either mandatory actions or voluntary actions. o Any measures to reduce exposure could be applied either to all homes with
potential lead hazards, or to only those that have been demonstrated to be sources of lead exposure for children with confirmed EBLLs
o Preventative actions range from abatement (which is the removal of the source of lead) to assessment (which identifies lead hazards in a household). Between abatement and assessment are interim measures (which temporarily prevent exposure) and remediation (which is a mix of abatement and interim measures).
o Actions focused on just lead hazards from lead-based paint, or also including soil and drinking water.
o Actions focused on lead hazards in all houses or only in some houses, such as in rental homes. These actions could also include schools and childcares.
o Actions applied based on the age of the home. Such actions could apply to all homes, only those built prior to 1978, or only those built before 1960. Lead hazards are most common in pre-1960 homes, before voluntary industry reductions in the amount of lead in paint. Lead hazards are rare in post-1978 homes, after the federal government limited lead in paint more strictly.
· Develop guidelines for individuals to assess the presence of lead and lead hazards in homes as well as measures individual homeowners can take to reduce exposures.
· Expand public funds available to both owners and landlords for assessment and remediation.
· Seek state delegation of the EPA renovation rule that takes effect in April 2010. · Review current Model Toxics Control Act (MTCA) Method A cleanup levels for lead.
This determines what is considered lead contaminated soil and needs to be cleaned up under state regulations.
· Take no additional actions other than to maintain current practices and status quo.

226
Recommendation #4- Require remediation of lead hazards in rental housing if it is a confirmed source of an elevated blood lead level. This recommendation requires new authority from the legislature and is similar to laws in other states. Remediation would be required if a child has an EBLL and if investigators determine that lead hazards present in the home are the source of the EBLL. Lead hazards may be from lead-based paint, contaminated soil, and drinking water. We used 20 µg/dL to estimate costs in Chapter X, but the some states require remediation in homes at lower BLLs. Measures would be included to ensure that the source of the EBLL was lead hazards in the home. CTED and DOH would be involved to ensure that the required remediation is completed appropriately and the homes are certified and placed on the Lead Housing Registry. Public funds for assessment and remediation services will be needed for these efforts to be successful. This could be grants, low interest loans, or other funding mechanisms. The state could also seek federal funding from Medicaid for some case management services, such as home visits from the health department for environmental investigations.
Rationale Maintaining the status quo will result in children continuing to be harmed by lead exposure and future exposures that can and should be prevented. An EBLL often indicates the presence of a lead hazard in a child’s home. To prevent further harm from occurring, it is important to identify the source of lead and stop the exposure. This recommendation removes identified sources of lead exposure to children that are known to have EBLLs. This recommendation will also prevent other children from being exposed to lead hazards from the same house. Other states that track the addresses of children with elevated BLL have found the same homes to be the source of lead for many different children. Children in rental homes are more vulnerable, because renters are not able to alter their homes without permission of the owner. Rental homes in good repair are not likely to have any lead hazards, so are not exposing children to lead and would not need remediation. Recommendation #5- Require mandatory assessment and disclosure of lead hazards in pre-1960 rental housing at new tenancy. This recommendation requires new authority from the legislature and is similar to laws in several other states. Assessment and disclosure will inform owners and renters about what areas need to be maintained to prevent lead hazards, such as keeping lead-based paint in good repair or lead contaminated soil covered. Knowing about the presence or absence of lead-based paint is important for renovations, especially with the new EPA rule (see recommendation #7) that requires lead-safe work practices unless the area has been shown to be free of lead-based paint. Several states have programs to assess and remediate lead hazards in rental homes, though the target age of housing varies. After the initial assessment, homes would need a less intensive lead hazard screen every three years to reevaluate the presence of lead hazards. Rental housing with no lead hazards may qualify to be placed on a Lead-Safe Housing list.

227
Rationale Lead-based paint and lead hazards are common in older homes. The current federal and state requirements for disclosure of the presence of known lead-based paint in pre-1978 homes at the time of transfer or new tenancy are inadequate to address lead-based paint hazards. There is an inherent disincentive to find out if a house contains lead-based paint, because only known lead-based paint must be disclosed. Requiring assessment addresses this deterrent to voluntary assessment. This recommendation is focused on rental housing because renters are more vulnerable than owners since they cannot alter their homes without permission of the owner. In addition, this recommendation focuses on assessment of pre-1960 homes, rather than pre-1978 homes, because lead-based paint and lead hazards are most common in pre-1960 homes. Hazards from lead paint in homes built between 1960 and 1978 mostly result from recent renovation activities that generate significant amounts of paint dust. Lead hazards are rare in post-1978 homes. While lead content in paint was limited to 600 ppm in 1978, pre-1960 homes have more lead-based paint and higher concentrations of lead in the paint. Required assessment may be expanded in the future to include all pre-1978 homes. There are approximately 2,500,000 homes in Washington- over 700,000 homes were built before 1960 and 600,000 built between 1960 and 1978. The focus on pre-1960 housing is based on the prevalence of lead-based paint, because lead-based paint is consistently found to be the largest source of childhood lead exposure. Lead in soil and drinking water may be significant sources of lead for some people, but are less of a concern for most people. One challenge for testing water is that the lead in water is affected by temperature, and how long the water has been sitting in the pipes, so many samples are needed to get sufficient data. More comprehensive testing would provide a more detailed picture of exactly how much lead exposure occurs from drinking water in Washington. Comprehensive testing is not recommended because significant exposure to lead in drinking water is likely a problem for only a small percentage of households. The existing testing scheme is thought to be sufficient to detect most system wide problems in public water supplies caused by past use of lead plumbing materials. Other options such as development of self-assessment guidance should be implemented before this more costly option is considered. If more homes are subject to assessment, then more lead hazards will be identified. This is a first and necessary step to achieve primary prevention. However, without the next step-the actual remediation of the hazard- an increase in assessments may not result in a significant and immediate reduction in lead exposure. This recommendation assumes that once people understand and know what lead hazards exist, the market will drive remediation. Other states have found this to be true, especially when citizens are well informed about lead hazards. As defined earlier, abatement is longer lasting than interim measures and remediation is a mix of both. Unless complete abatement is done, measures need to be taken to maintain the properties in good condition to prevent future exposures. Both abatement and remediation can be quite expensive (see Chapter X Economic Analysis). If more assessment does not result in more remediation, then Washington should consider requiring some remediation.

228
Mandatory abatement or interim measures for all lead in paint, soil, and drinking water in all homes at the time of property transfer or new tenancy would address the most common sources of lead exposure for all children. However, the costs are quite high and a mandatory, across the board, requirement such as this, in the absence of definitive proof that a specific location is the source of EBLLs, is not likely to gain the support needed to implement this option. Recommendation #6- Encourage assessment of lead hazards in homes, schools and childcares.
a. Develop guidelines for homeowners, landlords and tenants to assess their own homes for lead-based paint, lead in soil, and lead in water.
b. Develop guidelines, standards and protocols for lead hazard evaluation of child care facilities.
Ecology, in consultation with DOH and CTED, should develop guidelines to help homeowners, landlords and tenants assess their own homes for lead-based paint, lead in soil, and lead in water. The guidelines should include how to find certified laboratories and certified professional assessors. CTED, Department of Early Learning (DEL), DOH and Ecology should collaboratively review other state regulatory and/or health agencies’ practices concerning child care licensing and lead based paint hazards. As an example, Vermont requires all licensed child care programs (including homes) to perform annual essential maintenance practices to reduce lead hazards. Essential maintenance practices require the use of trained professionals to stabilize paint, use lead safe work practices, and complete annual specialized cleaning. The responsible agency in Vermont is the state’s Department of Health. Rationale
Education and guidance would encourage more voluntary assessment and measures to reduce exposures. Many people may be unaware that old lead-based paint is the most common source linked to childhood lead poisoning, and that other sources such as soil and drinking water may contribute to exposure. Residential use of lead paint was largely banned nationwide in 1978, but lead-based paint remains in many homes. Raising awareness of potential lead hazards around the home and offering simple ways to help identify exposure sources may encourage people to assess their own homes and/or seek the help of a professional inspector. People should be empowered to help themselves when possible, but renters and other vulnerable populations may need more direct assistance. Lead content in paint was limited to 600 ppm in 1978, but pre-1960 homes have more lead-based paint and higher concentrations of lead in the paint. Hazards from lead paint in homes built between 1960 and 1978 mostly result from recent renovation activities that generate significant amounts of paint dust. Knowing about the presence or absence of lead-based paint is important for renovations, especially with the new EPA rule (see recommendation #7) that requires lead-safe work practices unless the area has been shown to be free of lead-based paint. There are

229
approximately 2.5 million homes in Washington- over 700,000 homes were built before 1960 and 600,000 built between 1960 and 1978. Assessing lead hazards in schools and child cares is also important to prevent some exposures outside of homes. Although lead exposure may be harmful at all ages, we are most concerned about children under the age of 6, and most children that age are not in public schools. After protocols for lead hazard evaluation are developed and more facilities are assessed, we will have a better idea of the extent of lead hazards in child care centers in Washington. Once guidelines, standards and protocols have been developed, DEL, as the agency that licenses child cares, should consider requiring the evaluation and remediation of lead hazards in child care facilities as a requirement of licensing. A source of funds for mandatory abatement or remediation activities will be needed since these could impose significant new costs onto schools and child care facilities. Ecology has an on-going program to assess and remediate schools and child cares within the Tacoma Smelter Plume for lead in soil. This program could be expanded statewide and include lead-based paint and plumbing hazards. Recommendation #7- CTED should seek delegation of the EPA Renovation Rule. The Renovation Rule, published April 2008 applies to contractors who disturb lead based paint during renovation, repair and painting of pre-1978 housing and child-occupied facilities, and is meant to protect the health of both the residents of the housing and the workers. It becomes effective in April 2010. The rule includes worker training and will be phased in over three years. It does not apply to work done by an owner who lives in the house, housing where children under 6 do not reside, and areas that are shown to be free of lead-based paint. Renovation workers should be encouraged to follow lead-safe work practices before the EPA rule is in effect using existing programs such as the L&I’s DOSH program or currently established community outreach training such as the Lead Safe Work practices training. Rationale CTED should seek delegation of this EPA rule, since it is a natural extension of the EPA rule already delegated to CTED on training and certification for trainers, lead workers, inspectors, risk assessors, supervisors, and project designers. CTED also has a lead-based paint remediation grant program in place. Other agencies that may be appropriate include Ecology, DOH and L&I. Accepting delegation of this rule will increase compliance; however, EPA’s rule is not as protective of families as HUD’s rule for the Lead Hazard Control Grant Program. Recommendation #8- Review current MTCA Method A cleanup levels for lead. Ecology should work with DOH and the MTCA Science Advisory Board to determine which childhood blood lead levels would be most appropriate to use in setting Model Toxics Control Act (MTCA) clean up levels. The Method A soil cleanup level for lead is 250 mg/kg or ppm. It is set at a soil concentration that is unlikely (less than 5% chance) to result in child blood lead

230
concentrations to equal or exceed 10 µg/dL. The MTCA Science Advisory Board recently observed that “ available scientific information does not permit the identification of a safe or threshold concentration below which there are no health risks and there is an emerging scientific consensus that blood lead concentrations of <10 µg/dL can potentially be levels of concern with respect to children’s health.” Rationale Reviewing the current clean up levels is appropriate to protect human health in light of more recent scientific information that indicates that blood lead levels less than 10 µg/dL can harm young children.

231
Reducing Exposures from Occupational Sources Key Findings:
· Lead can affect adults, although the doses necessary to cause harm are generally higher than those for children. Adult lead poisoning has been recognized for centuries, but recent research has identified toxic outcomes such as increased blood pressure, effects on reproduction, and damage to the central and peripheral nervous system at doses that were previously thought to be safe. Many health care providers are not aware of these more recent findings of adverse health effects at relatively low lead levels.
· Workers are primarily exposed through inhalation of fumes and dusts as well as ingestion of lead contamination on hands and other objects. Workers can also inadvertently take lead home and expose family members. Laboratories in Washington are required to report all blood lead level test results to DOH and DOH forwards adult (16 years old and above) results to L&I for inclusion in the Occupational Lead Exposure Registry. In Washington, the most common known occupational exposures are related to battery manufacturing, production of specialty glass, bridge renovation and painting, indoor firing ranges, and telecommunication cable recycling. There are also occupational exposures in ammunition manufacturing and home renovation and repair.
· Washington has existing programs in the Department of Labor and Industry (L&I) to protect the health of workers in Washington. Direct evaluation of the workplace using proven exposure monitoring and evaluation techniques along with exposure controls can successfully identify and mitigate harmful worker lead exposures in a timely manner without requiring blood lead testing. In contrast, blood lead testing by itself cannot successfully address exposure prevention.
· Washington State has two comprehensive worker protection regulations related to workplace exposures to lead. These rules, which are identical to federal OSHA standards, cover general industry and construction work (both new construction and renovation). The two rules have differing requirements for air lead monitoring, BLL testing, and what BLL triggers removal of a worker.
· Studies in Washington and other states have documented that many companies do not conduct air lead- or blood lead testing even when they are required to do so under state and federal worker protection laws. Since many lead-exposed workers do not receive blood lead testing, lead exposure is likely more widespread than is indicated by Washington’s Occupational Lead Exposure Registry. New and emerging industries and occupations have been found to have high lead exposure, such as telecommunication cable recycling.
· The most effective way to reduce lead exposure is to reduce or eliminate lead use. If there
is no feasible alternative to lead-containing materials, then the exposure to workers can be minimized through best management practices. Occupational standards for general

232
industry currently rely on air lead testing to trigger BLL testing in workers. The OSHA standards for construction were issued in 1993, but were modeled on the 1978 general industry standards. Neither standard incorporates research since the 1970’s showing increased harm from lead exposure, especially chronic exposure.
· The EPA Renovation Rule will help reduce lead exposures to workers in the residential
construction industry [see recommendation #7]. Goal: Reduce adult exposures to lead from the work place. Options:
· Continue to update education and outreach for workers, employers and health care providers.
· Conduct a statewide survey on occupational use and exposure to lead to find new occupational exposures, identify vulnerable workers, and assess compliance with current regulations in known industries.
· Harmonize the two different Construction and General Industry occupational lead regulations.
· Update standards by adopting the comprehensive recommendations for lead workers put forward by the 2007 Association of Occupational and Environmental Clinics (AOEC)
· Increase technical assistance to help industry comply with the current regulations and further reduce lead use and exposures.
· Increase compliance visits. · Take no additional actions other than to maintain current practices and status quo.
Recommendation #9- Update education and outreach materials and continue to provide technical assistance
a. L&I and other agencies should continue to develop and provide up-to-date information and materials for health care providers, business owners, and workers about the hazards of lead to adults and ways to reduce exposure.
b. L&I should encourage more businesses to utilize DOSH consultations. c. Ecology should continue to provide technical assistance to industry.
Education and outreach efforts should be directed toward workers, employers and health care providers, including a Continuing Medical Education module on lead toxicity. Education and outreach materials should be updated as necessary to address take-home lead exposure, that is, lead contamination that may be brought home from work on employees’ clothes, hair, and hands and become sources of exposure for family members in vehicles and the home. Materials should be either updated or developed for vulnerable populations that are challenging to reach, such as recent immigrants, day laborers, young workers, and others with non-traditional employer-employee relationships. The Department of Labor and Industries (L&I), Division of Occupational Safety and Health (DOSH) Consultation Services currently completes more than 2,000 workplace health and safety

233
consultations every year. L&I should continue to reach out to employers to encourage more companies to take advantage of their program that provides no-charge safety and health consultations. Under this program an industrial hygiene consultant visits a facility or workplace and evaluates existing health and safety programs including those related to lead. These consultants can recommend monitoring for workplace exposure evaluation and assist with employee training and many of the other requirements relating to occupational lead exposure. In return, the employer must agree to make the corrections required by the consultant to comply with the rules. Consultants do not assess fines, nor do they share information with compliance staff. Ecology should continue to provide technical assistance to industry through programs such as the Lean Environment and Technical Resources for Engineering Efficiency (TREE) program. In addition, Ecology should support research on safe and effective alternatives to lead in products and manufacturing. This approach should be institutionalized with industry, academia, and communities to develop new alternatives and provide information about existing alternatives. A green chemistry initiative would support the design of chemical products and processes that reduce or eliminate the use and generation of hazardous chemicals. Rationale Most health care providers and employers appear to believe that lead hazards are not longer a concern in Washington. Recent studies that demonstrate the harm caused by chronic, low level exposures are not widely known. Updated education and outreach materials are needed to help employers, workers and health care providers understand that lead hazards are still quite common. Employers and workers should know whether lead is used in their business and be aware of the potential hazards and exposure sources. They should be familiar with and follow existing testing requirements and workplace rules and know how to protect workers on the job and prevent take-home lead exposure to workers’ families. Employers should understand the health and environmental advantages of reducing lead use and ways to do so. Consultations are helpful for employers to make sure they are following current standards and protecting the health of their workers. L&I’s DOSH program should also continue to investigate workplaces and occupational exposures by conducting compliance inspections after complaints and referrals and in high hazard industries to ensure compliance with the existing lead standards. Such compliance visits help to create a “level playing field” by making sure that companies that comply are not at a competitive disadvantage. Technical assistance is important for preventing the use of lead and other toxic chemicals. Support for development of green chemistry approaches to identify safer alternatives is needed to help employers eliminate the use of toxic chemicals such as lead.

234
Recommendation #10- L&I should conduct a statewide survey on occupational use and exposure to lead. The survey should be done by SHARP (Safety and Health Assessment and Research for Prevention), which is a research program within the L&I’s Industrial Insurance Services Division. SHARP uses research to improve worker health and safety in partnership with business and labor. The survey should assess compliance with current regulations in known industries, identify new industries with lead exposures, and identify vulnerable worker populations by targeting high hazard industries Rationale A survey is a cost-effective way of finding as yet unidentified lead-exposed workers. A new source of occupational lead exposure was indentified in Washington in 2007 only after a worker had her BLL tested by her personal physician. A survey would have helped L&I identify this industry and may have prevented a number of worker exposures. The New Jersey lead program found a lead users survey to have merit in assisting with targeting educational efforts. The survey will elicit interest in receiving health & safety assistance. Follow-up visits could provide voluntary blood lead testing for workers and technical assistance. Federal OSHA recently issued an updated National Emphasis Program (NEP) to reduce occupational exposures to lead. This effort looked at existing data from several states to determine which industries should be targeted. DOSH should use the NEP directive to update statewide programmed compliance inspection lists. While this is a good update for the existing program, the NEP relies on 2002 adult BLL data, so does not include emerging industries that did not have BLL monitoring at that time. Recommendation #11- L&I should harmonize and update occupational lead regulations L&I should harmonize the lead standards for general industry and construction to provide all workers with the same protections. Both standards should be updated to reflect our current understanding of lead toxicity and to bring worker protections into line with national public health goals. L&I should consider adopting the comprehensive recommendations for lead workers put forward by the 2007 Association of Occupational and Environmental Clinics (AOEC), which includes a recommendation for removal from work when chronic blood lead levels reach 30 µg/dL or more. The trigger for medical surveillance (including BLL testing) under the General Industry standard should not rely on exceedence of an air-lead level. Workers should be included in a medical surveillance program whenever they are handling or disturbing materials with a significant lead content in a manner that could reasonably be expected to cause potentially harmful exposure through inhalation or ingestion. Surface wipe sampling should be required to identify lead contamination in order to provide additional protection from ingestion of lead. Medical surveillance should be conducted according to the 2007 Association of Occupational and Environmental Clinics (AOEC) medical management guidelines.

235
Rationale Construction and general industry workers deserve equal protection. For example, the current medical removal level is a BLL of 50 or 60 µg/dL, depending on whether the worker is covered by the Construction or General Industry standard. There is no reason to provide a higher level of protection for one type of worker. Also, according to the AOEC, both standards are too high and adult workers should be removed from the source of lead whenever BLLs exceed 30 µg/dL. This would require a lengthy and expensive rule making process. An interim step may be to reconcile L&I’s General Industry and Construction Industry lead standards. The best protection for workers is to prevent any lead exposure, so L&I should continue to work with industry to prevent exposure and reduce the need for blood lead monitoring. The standard(s) should reflect new research on health effects.

236
Reducing Exposures from New Products Key Findings:
· The CDC has documented examples of situations where consumer products were found to be a source of lead exposure for children. Environmental investigations in Washington and other states have identified consumer products as a major source of lead for some children and a contributing source of lead for many children. Lead accumulates in people and relatively small amounts of lead from many products and other sources can add up to a significant exposure. Because there is no known level of lead exposure that is safe for children, lead should be used in the fewest products and at the lowest levels possible to prevent exposure. This is especially true for children’s products.
· Many consumer items that are currently for sale contain lead. Lead-containing products
differ in the amount of lead they contain, whether the lead is added intentionally or is a contaminant, and the potential exposure to consumers, especially children. The U.S. uses about 1,430 thousand metric tons of lead each year, with our use increasing each year. The largest use of lead (88%) in the U.S. is for automobile batteries. Some lead-containing products are recycled, but others are not. New products may contribute to lead exposures and releases during manufacturing, use and disposal.
· The largest releases of lead from consumer products in Washington are in automotive
batteries, ammunition, fishing weights, wheel weights, and aviation fuel. Most automotive batteries are recycled, but the small percentage that is not recycled is estimated to contribute 600 tons of lead each year, mostly in landfills. An estimated 550 tons of lead shot, 60 tons of lead fishing weights, 40 tons of lead wheel weights, and 27 tons of lead from aviation fuel are released into the environment in Washington each year. There are non-lead alternatives available for some ammunition, fishing tackle and wheel weights. There are currently no lead-free alternatives for automotive batteries. There is ongoing work at the federal level to develop lead-free aviation fuel, but there are still some propeller planes that require leaded fuel.
· Existing federal laws on lead ammunition prohibit the use of lead shot for hunting waterfowl. In addition, the Washington Department of Fish and Wildlife (WDFW) requires use of non-toxic shot in some additional areas where WDFW has determined that harm has already occurred to an animal population or there is a high potential for ingestion of lead by wildlife. Not all uses of ammunition on private land are under the jurisdiction of WDFW, such as ammunition used for target practice.
· Lead fishing tackle can be a significant source of lead, especially in popular fishing areas. Smaller pieces (less than an inch or an ounce) are most dangerous to waterfowl that accidentally ingest them and then die of lead poisoning. Loons are particularly affected by small lead fishing tackle, including loons in Washington State. People can also be exposed when they handle lead fishing tackle, especially when combined with eating, drinking and smoking. There are many non-lead alternatives available. Some states restrict the use or sale of lead fishing weights. Also there are lead-free fishing areas, such

237
as in Yellowstone Lake in Yellowstone National Park where use of lead fishing tackle is prohibited.
· The Consumer Product Safety Commission (CPSC) lowered the allowed amount of lead
in most consumer paint to 0.06% (600 ppm) in 1978 and issues recalls when products contain paint with higher levels of lead. Other products were evaluated on a case-by-case basis and recalls are initiated when lead levels are thought to cause childhood BLLs to be over 10 mg/dL. New laws now apply to consumer products, especially children’s products. The federal Consumer Product Safety Improvement Act (CPSIA) restricts the level of lead in children’s products to 600 ppm in February 2009, then 300ppm in August 2009, and then 100ppm in 2011 if feasible. CPSIA also lowers the limit for lead in paint on consumer products to 90ppm in August 2009.
· The Toxic Substances Control Act (TSCA) is the key statute around which U.S. chemical policy is formulated. EPA’s TSCA Inventory currently contains over 80,000 existing chemicals. TSCA requires testing information for new chemicals, but for chemicals already in commerce prior to TCSA implementation in 1979, such as lead and many lead compounds, EPA must promulgate a rule in order to obtain data. Under TSCA chemicals in use prior to 1979 were assumed safe until proven dangerous and companies do not need to provide chemical hazard data. As a result, there is little incentive for manufacturers using lead or lead compounds to conduct research on safer alternatives. The European Union has recently implemented REACH (Registration, Evaluation & Authorization of Chemicals). REACH mandates that chemical makers provide toxicity data on the substances they produce, including ones that have been on the market for decades.
Goal: Reduce or eliminate threats to human health and the environment from consumer products that are a source of lead exposure. Options:
· Ban lead in all products, with a short list of exceptions that is periodically reviewed. · Ban lead in certain products where the use of lead is not necessary. · Work with stakeholders to increase the availability and use of non-lead alternatives. · Require labels that either warn of the presence of lead or certify a product as being lead
free. · Require manufacturers to disclose the amount of lead in their products. · Increase assistance to industry to replace lead with less-toxic alternatives. · Work with other states to update U.S. chemical policy. · Voluntary or required product stewardship for certain products to reduce the use of lead
where possible and increase reuse and recycling. Product stewardship involves manufacturers, retailers, consumers, and government sharing responsibility for reducing the environmental and health impacts of products.
· Take no additional actions other than to maintain current practices and status quo.

238
Recommendation #12- Ecology should work with stakeholders to reduce the use of lead in products where non-lead alternatives are available. Lead is used in different products for different reasons, therefore, each product and its uses should be considered individually. Ideally, Ecology would work with the appropriate stakeholders for each product on voluntary steps to prevent exposures. Because lead is found in so many products, Ecology recommends focusing on the largest uses where safer alternatives are available. These products include lead shot, fishing weights and wheel weights. Ecology should work with WDFW, shooters, hunters, fishers, industry representatives and other stakeholders to promote non-toxic alternatives to lead ammunition and fishing tackle and reduce releases without negatively affecting hunting, shooting, or fishing. Some ammunition and fishing tackle are released into the environment during the intended use. Different uses and different types of ammunition and fishing tackle should be dealt with in individual ways. Ecology recommends collaborating with users on workable solutions to reduce exposures. Voluntary steps should be taken to prevent effects on wildlife and the creation of hazardous sites without new laws. Ecology should support WDFW in their efforts to determine where non-toxic shot or other types of non-toxic ammunition should be used. The 2009 legislature passed a bill banning the use of lead wheel weights as of January 2011. Ecology will provide information and technical assistance to tire manufacturers and repair shops on the requirements of the law and how to comply. Some lead wheel weights fall off tires and can be pulverized by daily tire traffic into finer and finer particles and are washed off of the road onto the shoulder, and into storm water. Many new cars now come with non-lead wheel weights. U.S. car manufacturers are already transitioning to steel as a good alternative because it is readily available and is less toxic. Some tire retailers are now offering non-lead wheel weights or switching entirely to non-lead wheel weights. Rationale Because it is beyond the capacity of state government to address all lead containing products, it is important to focus our efforts on the largest uses. An open dialogue among different stakeholders is critical. There are already many sportspeople who are voluntarily reducing the uses and releases of lead from ammunition and fishing tackle. Some people have switched to alternatives, such as upland game bird hunters who use non-lead shot and big game hunters who use copper bullets. Some shooting ranges require the use of non-lead ammunition for their members. Many ranges recover and recycle lead, which both reduces the release of lead to the environment and generates income. Hunters and shooters have a long history of wildlife conservation and concern for the environment and voluntary measures have been effective with these groups in other states. Education and outreach is important to build support for the use of alternatives, whether the use is required by law or not. In addition, some hunters and shooters are concerned that laws that limit access to any kind of ammunition will be misused and result in loss of the constitutional right to bear arms.

239
Focusing on educating consumers and encouraging the use of non-lead alternatives does two important things. It raises awareness of the problems caused by even small exposures to lead and it helps build demand (and therefore the supply) for safer alternatives. If voluntary measures do not succeed in reducing the uses and releases of lead from products, then Washington should consider requiring the use of less toxic alternatives. Such approaches require significant support from stakeholders. The most protective option evaluated was the option to ban lead in all products with a list of exceptions that is periodically reviewed. This approach was adopted by Denmark in 2000. Denmark limits lead in most products to 100 ppm. The burden is placed on the manufacturer to support their contention that lead is necessary and the product is not harmful. This approach is likely to lead to the greatest reductions in the use of lead in consumer products and is the most protective of human health and the environment. Examples of products that are exempt from the Danish ban are lead-acid car batteries, lead stabilizers in electrical cables, and lead-based paint for restoration of historical items. Such broad, sweeping approaches are more appropriately done at the federal level and would likely not be successful at the state level. Banning lead in certain products is less protective than banning all lead-containing products with a list of exceptions, but such an option can be targeted to address the products that are thought to contribute the most to lead exposure for humans and wildlife. If voluntary measures are not successful, then the state should reconsider the option of banning lead in certain products. In this option the burden is on the state to show that lead is not necessary or the risks to human health or the environment are too high. Ecology and DOH would have to evaluate each product to determine how much lead is in the product, how much potential exposure there is from lead in the product, where the lead goes after disposal, and possible alternatives to lead. Neither Ecology nor DOH have the resources necessary for this approach. Several states have programs to address specific lead containing products. For example, California and Vermont have limited lead in the wetted surfaces of plumbing fixtures to less than 0.25%, which is much lower than the federal definition of plumbing fixtures being lead free if they have less than 8% lead, and do not leach lead. Recent federal law (CPSIA) addresses the most vulnerable population by restricting lead in children’s products. Though not all products that children may interact with are covered by these laws, products that are specifically made for children are covered. After the new federal law is fully implemented, Washington State should evaluate whether new laws are needed to include additional products. We are not recommending labels or other types of manufacturer disclosure. Disclosure to the consumer directly through labels or to a state agency can be part of an education and outreach strategy to inform consumers and aid them in choosing among products. Disclosure helps some consumers avoid exposures and may be part of a comprehensive approach to lead in products. California requires a warning label on products that expose consumers to lead above de minimis levels. Labels can inform consumers and aid them in choosing among products, but this approach does not address the issue of what products are available to the consumer for purchase. Labeling laws are usually quite controversial and are likely to be opposed by manufacturers. Finally, labeling requirements have not been found to be effective in changing most consumer behavior and the costs of such approaches appear to outweigh the benefits.

240
Recommendation #13- Ecology should build on existing programs in an ongoing effort to provide assistance to industry to reduce lead uses and releases. Ecology should emphasize lead reduction in its technical assistance to industry through its pollution prevention plans and existing programs such as Lean Environment and Technical Resources for Engineering Efficiency (TREE) and Environmentally Preferable Purchasing programs. Lead solder is an example of a product that has some lead-free alternatives, especially since Europe now requires lead-free solder (defined as less than 1000 ppm lead). Washington should institutionalize research on safe and effective alternatives for lead and other toxic materials used in products. Ecology should work with industry, academia, and local communities to develop new alternatives and provide information about existing alternatives. Ecology should evaluate emerging green chemistry programs, such as the one recently passed in California, to identify programs that may be effective in Washington to support the design of chemical products and processes that reduce or eliminate the use and generation of hazardous chemicals. Rationale Reducing the use of lead in products reduces the overall lead in circulation, resulting in less opportunity for release of lead from these products. Businesses could benefit from technical assistance to transition to the use of products such as lead-free solders. Ecology should also favor lead-free alternatives through its environmentally preferred purchasing program. Toxics use reduction efforts can be more efficient and cost effective than the continuing use of hazardous chemicals. Establishing and institutionalizing a partnership between state and local government, academia, and industry to develop green chemistry approaches to manufacturing could contribute significantly to development of a green economy. Recommendation #14- Ecology should encourage additional recycling through education and product stewardship.
Lead is not just hazardous waste, but it is also a valuable commodity. Automobile batteries are recycled at a very high rate, but an even higher recycling rate would recover hundreds of tons of lead in Washington each year. Many shooting ranges recover and recycle spent ammunition. New ranges should be encouraged to start with a recycling program and older ranges should be assisted with developing recycling. Ecology should explore whether a manufacturer supported product stewardship approach to design, manufacture, and take back of lead-containing products would be an effective tool in improving the recycleability of these products. Washington’s new electronics recycling law requires manufactures to take back covered electronic products (TVs, monitors, and computers) and took effect on January 1, 2009. The electronics recycling law does not cover all electronics that have lead. After the new recycling program is fully implemented, Ecology should evaluate whether it should be expanded to cover more items.

241
Rationale Improving recycling reduces the amount of lead that ends up in landfills and decreases the need for virgin material. One reason that more than 95% of car batteries are recycled is because of the core charge. Battery retailers are also required to take back batteries. Large encapsulated weights like boat keels are valuable and relatively easy to recycle. The lead in other products cannot be recycled as easily, such as lead in PVC. Lead in PVC would have to be removed in the design and manufacture. Recycling is important, but is not the perfect answer because it is sometimes done in a way that is not protective of human health, especially in other countries. The U.S. Congress should ratify the Basel Convention on international movements of lead to ensure lead is recycled in a safer manner. Product stewardship involves manufacturers, retailers, consumers, and government, sharing responsibility for reducing the environmental impacts of products. The long term goal of product stewardship is to affect product design so the product is less toxic and more easily reused or recycled. A manufacturer supported product stewardship approach to design, manufacture, and take back lead-containing products would make a closed loop. We are not recommending required product stewardship for all lead containing products because the number of lead containing products is simply too diverse and complex for a single product stewardship approach to be effective. Also, developing unique product stewardship rules for individual products is beyond the scope of current or foreseeable resources to support. If a broad based product stewardship framework is developed, this option should be reconsidered. Recommendation #15- Ecology should work to facilitate and participate in a process for the U.S. to update its chemical policy. Ecology and DOH should actively seek opportunities to work with other states and interested parties to contribute to the national dialogue regarding needed improvements to U.S. chemical policy, with a goal of developing and advocating practical solutions. Rationale It will be more effective to work on a larger reform of chemical policy instead of addressing lead by itself in specific products. Change must occur at the federal level, but Washington can work to facilitate and participate in a process to develop solutions. Washington companies are affected by foreign regulations, such as REACH and RoHS in the EU. Companies in the U. S., including those in Washington, will be at a competitive disadvantage if they cannot participate in the global marketplace.

242
Reducing Exposures from Ongoing Releases Key Findings:
· In Washington, ongoing lead releases occur from permitted facilities allowed to release lead into air, land and water. Other releases of lead come from products, such as lead wheel weights, fishing tackle, ammunition, and other consumer products. The amount of lead that is released into the environment from permitted industrial facilities and sewage treatment plants is low compared to other sources. Actions that reduce lead use in products will also reduce the ongoing releases of lead. The foremost method of reducing ongoing lead releases is to reduce or eliminate lead use. Where there is no feasible alternative to lead-containing materials, releases and exposures should be reduced as much as possible.
· Ecology and other agencies include lead in many of their ongoing environmental
monitoring efforts. Ecology also requires measurements for lead in many, but not all, permits for discharging pollutants into air, water, and land. Ecology and local air agencies share regulation of air discharges.
Goal: Eliminate or reduce on-going releases of lead into the environment. Options:
· Review all rules and permits issued by Ecology and assess for opportunities to reduce lead releases.
· Increase research and monitoring on the presence of lead in Washington’s environment. · Eliminate mixing zones for permitted releases of lead in water. · Reduce lead in stormwater through permits. · Take no additional actions other than to maintain current practices and status quo.
Recommendation #16- Take no additional actions other than to maintain current practices and status quo. Ecology should continue monitoring lead releases and lead in the environment. This includes evaluating lead in stormwater permits, especially in areas where lead releases have already been identified, such as the Asarco smelter plume, or historic lead-arsenate pesticide application areas. Most industrial and municipal individual permits, such as NPDES permits, should continue to require monitoring for lead as part of the permit application or renewal. The new federal air limit on lead is likely to require new air monitoring for lead by Ecology or local air agencies. Rationale Continuing our current actions will further our goal towards eliminating or reducing releases of lead into the environment. Our findings do not demonstrate a need for increasing research or monitoring of lead in the environment.

243
We are not recommending amending the current water quality rules to eliminate mixing zones for lead. Current practice is to authorize mixing zones only after “all known, available, and reasonable methods of treatment and control” have been required of the permittee. Amending the current water quality rules that govern mixing zones would be a multi-year process. Ecology will continue to evaluate the use of mixing zones for all pollutants.


244
VIII. Implementation Steps The PBT rule requires that Ecology outline steps it will take to implement the CAP recommendations. This chapter outlines the steps Ecology will take and includes an estimate of additional resources needed, potential funding sources, stakeholder outreach, and needed regulatory actions. This chapter does not address implementation by other agencies. The recommendations in the previous chapter outlined a set of first steps in a long-term plan to reduce or phase out lead exposures, uses, and releases. Due to the magnitude and diversity of lead uses and releases, many of the approaches will take significant commitments of time and resources to implement effectively. In addition, many of the recommendations are directed to other state agencies. Ecology can support other agencies, but it is up to the other agencies to carry out the recommendations. While all of the recommendations are important, resource constraints require that choices be made. If the range of actions must be limited, Ecology recommends that priority be given to those actions that best help reduce exposure to young children, the largest and most vulnerable group affected by lead. We should focus on prevention to find and remove sources of lead exposure before children are exposed to harmful levels. Lead paint often found in older homes is the largest single source of lead for children. Therefore, we are recommending that the highest priority be given to those actions that address lead paint as a source of lead to children. Because lead paint is not the only significant source of lead to children and because adults and wildlife can also be harmed, other actions that focus on encouraging lead users to switch to safer alternatives should be implemented as resources become available.
Ecology will focus on the following recommendations:
· Recommendation #4- Require remediation of lead hazards in rental housing if it is a confirmed source of an elevated blood lead level.
· Recommendation #5- Require assessment of lead hazards in pre-1960 rental homes at change in tenancy.
· Recommendation #6- Encourage assessment of lead hazards in homes, schools and childcares. · Recommendation #12- Work with stakeholders to reduce the lead in products that have non-lead
alternatives. · Recommendation #13- Provide technical assistance to industry to reduce lead uses and releases. · Recommendation #14- Encourage additional recycling through education and product
stewardship. · Recommendation #15- Participate in the process to update U. S. chemical policy.

245
Coordination To implement all the recommendations requires action by a number of other state agencies over the next several years. Additional funding will be needed to coordinate efforts of these agencies, which include DOH, DSHS, L&I, CTED, DEL, DOT, DOC, and WDFW, as well as several different programs within Ecology and to track activities and results. This position will be needed for up to 6 years. Education and Outreach Several recommendations require extensive education and outreach. These activities will be done using existing staff. Ecology will work with stakeholders to develop support for assessing lead hazards in homes and reducing the use of lead in products. Ecology will support CTED, DOH, DSHS, L&I, and other agencies in outreach and will lead the effort to develop guidelines to homeowners to assess their own homes. Despite input from a very diverse advisory committee, Ecology believes that additional outreach to landlord groups, realtors, sportsmen, tire retailers, and other industries is essential to the success of these recommendations to pursue voluntary reductions. Technical Assistance Some additional funding is needed to provide technical assistance to help users and releasers of lead improve their practices to reduce lead impacts. Where safer alternatives to lead are not available, improved recycling or producer responsibility systems will be evaluated. More resources will be needed to significantly expand current technical assistance from Ecology, L&I, or other agencies. New Regulatory Actions While a number of lead reducing activities can be accomplished using existing statutory authority, some require new authority to accomplish. Ecology will take the lead in pursuing this authority using existing resources. Recommendation #4 would require landlords to remediate any rental unit found to be the source of an elevated blood lead level. Recommendation #5 would require landlords to assess lead hazards in pre-1960 rental units at all changes in tenancy. Implementing these two recommendations, along with increased blood lead testing in children, will go a long way to creating an effective program to address the most common cause of lead poisoning in children. Additional Resources Ecology estimates that an additional 3.0 additional FTE and $920,000 will be needed to implement these recommendations over the course of the next 6 years. If, by the end of that time, the goals of the recommendations have not been met, Ecology will re-examine the options and determine if additional lead reduction actions are needed.

246
IX. Performance Measures Performance measures are used to assess progress toward meeting the goals of the CAP. The measures may include a set of interim milestones but they should also objectively measure outcomes. This section describes how Ecology will measure progress toward meeting the goals of the CAP. As mentioned in the chapters on recommendations and implementation, a truly comprehensive plan to reduce and phase-out all lead uses, releases, and exposures to people and the environment is not feasible at this time. The implementation plan focuses on preventing children’s exposure to lead from old paint. Achieving these milestones depends on other factors, such as funding, and work done by other agencies. Some also require new authority from the legislature. Because completing the milestones requires additional resources in this time of budgetary constraints, we have not included dates for the milestones. A. Goal: Better data on childhood blood lead levels for other actions Milestone: DOH updates informational materials to reflect new science Milestone: Board of Health requires new reporting requirements for registry Milestone: More children tested for BLL at least once Measure: Number of BLL reports received by DOH Measure: Number of children on Medicaid tested for BLL Measure: Number of children in Washington with blood lead levels over 10µg/dL Measure: Median BLL for children in Washington State Rationale: In the past, policy makers and others have expressed their view that lead poisoning is no longer a problem in Washington State. In the U.S., lead-based paint is the largest single source of lead poisoning. In Washington, 60% of housing was built before lead-based paint was banned in 1978 and our research had given us no reason to think that Washington is different from other states where lead based paint in older homes is still the most significant source of lead exposures to children. It will be useful to have more data on childhood BLLs in Washington and Washington-specific risk factors. Improved data may show that lead poisoning is not a problem in Washington, which would lead to implementing fewer of the Lead CAP recommendations. More information on which children are more likely to have higher BLLs will be useful for targeting actions to the most at risk populations. Testing more children will also find more children with EBLLs, so we can help them. B. Goal: Help children with EBLLs from rental housing sources Milestone: Ecology seeks legislation to require remediation in rental housing after a confirmed EBLL Milestone: Legislature passes legislation to require remediation in rental housing after a confirmed EBLL Measure: Number of rental houses remediated Rationale: This goal is to help specific children who have already have EBLLs. Increased testing of children will help identify children in need of assistance. Requiring remediation of the source will help children with elevated blood lead levels and may prevent exposures. Targeting rental housing will help focus our first step efforts on our most vulnerable citizens.

247
C. Goal: Prevent lead exposure from housing Milestone: Ecology completes self-assessment guidance for homeowners. Milestone: CTED requests delegation of the EPA Renovation Rule Milestone: Ecology requests legislation to require assessment of all pre-1960 rental homes Milestone: Legislature passes legislation to require assessment of all pre-1960 rental homes Measure: Number of rental homes assessed Measure: Number of homes on the CTED registry of lead safe housing Measure: Number of children in Washington with blood lead levels over 10µg/dL Measure: Median BLL for children in Washington State Rationale: Lead-based paint is the most common source linked to EBLLs in children in the U. S. These milestones will help prevent further exposures and help families while also emphasizing measures to protect the most vulnerable. We have no reason to believe that Washington State is different from other states, especially since 60% of housing in Washington was built before lead-based paint was banned in 1978 and 30% was built before 1960 when lead-based paint was more commonly used and had higher concentrations of lead. D. Goal: Comprehensively assess occupational use and exposure in Washington Milestone: Complete SHARP (L&I) occupational lead use survey to identify current exposures to lead for adults from occupational sources. Rationale: The current standards are based on how lead was used in the workplace in the past. Finding out how workers are currently using and being exposed to lead in the workplace is essential to targeting resources to better protect them. This information will also be useful to L&I in their efforts to update and harmonize the occupational lead regulations. E. Goal: Further protect worker health and prevent occupational exposures. Milestone: L&I updates education and outreach materials Milestone: L&I updates and harmonize occupational lead standards to reflect new science Measure: Number of adults with BLLs > 25 µg/dl Measure: Number of adults removed from the workplace due to lead exposure Rationale: More recent findings show currently allowable lead exposures to adults in the workplace may be associated with significant health effects. Many health care providers are not aware of these more recent findings of adverse health effects at relatively low lead levels. Both occupational standards (general industry and construction) should be updated to reflect our current understanding of lead toxicity and to bring worker protections into line with national public health goals. Construction and general industry workers deserve equal protection.

248
F. Goal: Reduce ongoing releases and exposures from new products Milestone: Complete outreach program with stakeholders Measure: WDFW survey of hunter attitudes towards non-toxic ammunition Measure: The amount of toxic products, such as automobile batteries, in landfills Measure: Availability of non-toxic products Rationale: Ecology needs the support of stakeholders and the public to encourage the use of non-toxic alternatives by building demand for currently available alternatives and supporting the development of safer alternatives where they are not currently available. Continuing widespread use of lead in many products means most people have the potential to be exposed. Reducing this potential will require significant reductions in use. This first recommendation focuses on products using the most lead. G. Goal: Eliminate or reduce exposures from past uses of lead Measure: WDFW data on annual swan mortality from past uses of lead shot in Whatcom and Skagit counties Measure: Number of lead contaminated sites cleaned up under MTCA Measure: Number of schools and childcares assessed and cleaned up in the Tacoma Smelter Plume Rationale: Lead contaminated sites from past uses of lead need to be cleaned up to prevent future exposures to people and wildlife. Swan deaths are very visible evidence of lead poisoning and there are ongoing studies on swan mortality from past uses of lead shot in Whatcom and Skagit counties. There are no similar, ongoing studies for other species in Washington.


249
X. Economic Analysis of Lead Exposure Overview Ecology has estimated the costs of our current lead exposure and the costs of reducing lead exposure for Washington State. The PBT Rule requires a CAP to consider economic impacts associated with implementing our recommendations. For the Lead CAP we also looked at the most direct costs associated with some options as part of our process to pick which options we should recommend. The economic analysis shows that our current lead exposure has a large economic cost to society, so it is worth preventing lead exposure. The economic analysis also shows that actions to prevent lead exposure also have a large economic cost. Below are key findings regarding costs associated with lead exposures and costs to treat and prevent it. Estimate of Costs of Current Lead Exposure due to Income Losses · The estimated costs from lifetime income losses from blood lead levels greater or equal to 2
μg/dL in Washington is between $675 million and $2.3 billion for each age group, in other words annually.
· The estimated 50 year present value of these losses for continued exposure of small children for all the birth years 2008 through 2057 is $6.8 billion to $33 billion.
· The estimates vary an order of magnitude, from $185 million to $2.3 billion per year. · These estimates do not include other known costs of lead exposure, such as higher blood
pressure in adults or impacts on wildlife. Estimates for Costs to Reduce Lead Exposure Housing
Lead-based paint in homes is the largest source of lead poisoning for children. Soil is also an important source of lead exposure. Soil may be contaminated from lead-based paint or other sources.
· Recommendation 4 requires remediation of lead hazards in rental housing if it is a
confirmed source of an elevated blood lead level (EBLL). The expected annual estimate to require remediation of lead-based paint in rental homes after a child is confirmed to have an EBLL, if all EBLLs are caused by lead-based paint, is $662,500. If the environmental investigation indicated lead contaminated soil was the source of lead exposure for all children in rental homes with an EBLL, then the annual cost would be approximately $490,000 for soil remediation.
· Recommendation 5 requires lead hazard assessments in pre-1960 rental homes at change of tenancy. Assessment of lead hazards in all pre-1960 rental homes is estimated to cost $212 million. This is not an annualized cost.
· The estimated cost to remediate lead-based paint in all homes in Washington is $5.9 billion.
· The estimated cost to remediate lead contaminated soil on residential properties is $1.2 to $1.4 billion.

250
· The estimated cost to remediate both lead-based paint and lead contaminated soil for all the homes in Washington would be between $7.1 and $7.8 billion.
Products
We did not recommend any product ban, but we estimated the direct costs of switching to an alternative for lead shot, small fishing weights, and wheel weights. There are available non-lead alternatives for these products. Wheel Weights · The estimated annual cost of shifting from lead to steel wheel weights is $3.3 million.
The quality of the data leading to this estimate is excellent. Lead Shot · The estimated annual cost of shifting from lead to steel in shotgun shells is $13 million.
The quality of the data leading to this estimate is moderate.
Lead Fishing Weights · The estimated cost of shifting from lead to non-lead fishing weights ranges from 1.04 to
4.5 times the cost of lead weights. The more likely estimate is a doubling of prices. The estimate price increase ranges from $1.8 to $11.5 million per year. The quality of the price data is good but the quality of the total estimate is marginal.
Blood Lead Level Testing Recommendation 2 is to evaluate lead exposure for all young children, which is expected to lead to an increase in testing for childhood blood lead levels. The estimated annual cost of testing 1 and 2 year old children is $200,000 to $3.8 million per year, depending on how many children are tested. The CAP is not recommending mandatory universal testing, so the lower estimate is more realistic. Finding additional children with EBLLs will lead to additional costs in case management, including environmental assessments. The quality of the data leading to this estimate is moderate to good.

251
Estimate of Costs of Current Lead Exposure Current lead exposures in Washington impact the health of children, adults, and wildlife. The health effects of lead exposure include: · IQ loss · Stroke · Crime and impulse control · Immune system damage · Liver damage · Early aging of the brain · Heart damage · Premature mortality · Hypertension · Reproductive effects
· Wildlife Impacts
Ecology used the effects of lead on lowering IQ in children 0-6 years old, and the subsequent effect on lifetime income, to estimate the costs of current lead exposure. The costs of IQ loss are the most well documented method of estimating the cost of lead exposure. In adults, lead is well documented to cause higher blood pressure and that cost was estimated by the EPA as part of the new Repair, Renovation and Painting (RRP) rule. The recent cost benefit analysis for the RRP rule contains that analysis, plus information on the analysis for the air lead level and the studies that support the connection between lead exposure and high blood pressure in adults (U.S. Environmental Protection Agency). Estimates of the costs due to lead caused high blood pressure in adults were not included because current lead exposure for adults in Washington is unknown. Data on the costs of other known health effects listed above are also insufficient for use in this analysis. We have also not attempted to estimate the cost of effects to wildlife. We have not included the costs due to crime in the costs of current lead exposure, because we do not want to count effects on IQ more than once. Lead exposure lead to decreases in IQ and increases in criminal behavior. Decreased IQ is also associated with increased criminal behavior. The link between lead exposure and crime may be due both to lead’s effects on IQ and behavior. If we included the costs of increased crime, we would be counting lead’s effects on both IQ and behavior, and thus counting the effect on IQ again. Since we have not included all of the costs of lead exposure, our estimate of the cost of our current exposure is an underestimate. Income Effects from IQ loss in Childhood The impact of lead on IQ is well documented and is frequently used to estimate the costs of lead exposure. Ecology estimates the current annual damages to IQ from lead exposure at $675 million per year. This is the estimate of IQ losses down to blood lead levels of 2 µg/dL. The IQ loss between 10 and 2 µg/dL is greater than the IQ loss between 10 and 20 µg/dL, with no evidence of a threshold for the effect.

252
The estimated value is based on very conservative values. In other words, the calculation is likely to underestimate the level of current damages. The estimate of $675 million per year of births is a low estimate because it relies on: · Low estimates of the IQ impact. · Mid range estimates of the value of IQ. · No effects on IQ in children with BLLs less than 2 µg/dL · It does not include other effects on children, effects on adults or effects on wildlife. Using lower values of IQ effects due to blood lead levels (BLLs) and a value of $9,076 per IQ point, produces a value of $675 million to $1 billion in forgone income each year children are born into Washington’s current lead exposure structure. The present value of 50 years of current level exposure to lead ranges from $6.8 billion to $33 billion. The range of the estimates created by using different, reasonable, consistently low or consistently high assumptions is large, from $185 million to over $2.3 billion per year. See Appendix E for details on the value of $9,076 per IQ point from research by Scott Grosse (Grosse 2007). Any benefit which may accrue depends on the effectiveness of Ecology’s Chemical Action Plan (CAP) for reducing childhood lead exposure. The CAP will only generate these estimated values if it reduces the BLLs for a great many children. If all children in Washington had a BLL of less than 5 ug/dL, the resulting benefit would equal $215 million, assuming the low estimate of IQ impact. If all children have a BLL of less than 2 ug/dL, and using the higher estimates of IQ impact, the benefit generated would be $1 billion. Estimate Model Description and Background Lead has significant impacts on cognitive development. Therefore, economic evaluation of policies on reducing exposure of children to lead relies on understanding that changes in IQ affect future earnings. This analysis is based on past work in this area and presents a model which predicts long-term income losses due to blood lead levels in Washington children. The model is a simple set of multipliers which applies the following formula. Value IQ Loss = Ni x Li x V Where
Ni = Number of Washington children in the BLL range Li = Lanphear IQ change for the BLL range V = Value of an IQ point
Each of these multipliers is described in its own section below. Number of Washington Children in each BLL Range (Ni) Laboratories in Washington must report all blood lead test results to the Washington State Department of Health (DOH). The model used blood lead data from DOH collected from 2001 through 2007 for children 0 through 6 years of age. Some of the uncertainties regarding this data set are discussed in Appendix C. The number of children born each year, who will eventually be

253
in each BLL category, is estimated based on the percentages in the raw data from DOH. This assumes that each year, all infants born that year will experience the same lead exposures as those children tested from 2001 through 2007. Table 26- Washington Childhood Blood Lead Level Data 2001-2007
BLL ug/dL
Mid range BLL
# children born annually
Percent of children
0-1.9 1 55,462 63.75 2-4.9 2.6 25,947 29.82 5-9.9 6 4,665 5.36 10-14.9 11.15 559 0.64 15-19.9 16 205 0.24 20-29.9 24.25 102 0.12 30-39.9 34.2 44 0.05 40-49.9 46 12 0.01 50-59.9 52.6 2 0 60+ 62.6 2 0 Total
87,000 100
≥2
31,538 36.25 ≥5
5,591 6.43
≥10
926 1.06 ≥15
367 0.42
≥20
162 0.19 A breakdown of totals which are above various cutoff points is at the bottom of Table 26. · Two is the median blood lead level for children in Washington, with 63% falling into the 0.0
to 1.9 BLL. · 1.06% of childhood BLLs are above the CDC level of concern of 10 μg/dL. · The 20 μg/dL level triggers federal Medicaid actions for removing lead from the child’s
environment with only 0.19% falling into that category. Some states use lower levels to trigger remediation.
The data on BLLs in Washington children is the weakest data set used in this analysis. It is based on less than a one percent sample of the population and is not a random sample. The outcome of the model is sensitive to adjustments to this data. Figure 11 shows the percentage of the children in each BLL range. The graph presents the data on a natural log axis so the small percentages of children with high BLL scores can still be viewed. Over the past 7 years the percentage of the population in each BLL range has remained

254
0.01%
0.10%
1.00%
10.00%
100.00%
2001 2002 2003 2004 2005 2006 2007
Perc
ent o
f Pop
ulat
ion
Test
ed in
the
BLL
Cat
egor
y
0-1.9
2-4.9
5-9.9
10-14.9
15-19.9
20-29.9
30-39.9
40-49.9
50-59.9
60+
relatively constant, so Ecology has not adjusted the data for a trend. There appears to be a slight downward trend in blood lead in children over the last 6 years, especially in the groups between 5 and 20 μg/dL, but the 2007 data is not statistically significantly different from the 2001 data. Further, at the higher BLLs there is a small numbers problem, which creates a larger relative variance when the total number of data points is so small. The year 2003 may be an anomaly but is only 2 standard deviations from the mean. 2007 may be an anomaly because higher income parents were having their children tested due to the lead-in-toys-scare. None of this warrants deletion of any part of the data.
Figure 11- Blood Lead Levels in ug/dL Over Time IQ Change from Blood Lead Levels (Li) The model estimates the impact of BLLs on IQ using coefficients from Bruce Lanphear’s data on IQ impacts of BLLs. Details on this method are in Appendix D. The model uses both the log form from Lanphear (Lanphear et al. 2005) and the linear form used by EPA. The model does not include children with BLL below 2 μg/dL, nor does it forecast an ability to reduce the BLLs of the age cohorts below 2 μg/dL. It may, therefore, underestimate the IQ gain from reducing exposure and provide a low estimate of the monetary benefits for reduction of BLL in children. The multipliers in the formula are displayed in Table 27.

255
Table 27- Multipliers for each BLL Range
Multipliers used in the log form model Multipliers used in the linear form model BLL (μg/dL) change IQ decrease BLL (μg/dL) change IQ decrease 2.4 to 10 3.9 over range 2 to 7.5 2.94 per BLL 10 to 20 Cumulative value of 5.8
in range 7.5 up 2.94 + .16 per BLL
20 to 30 Cumulative value of 6.9 in range
Table 28- Estimated IQ Point Loss for each BLL Range in the population of Washington children each year
BLL range (ug/dL)
Mid of BLL range
Low estimate of IQ point loss (log form)
Middle estimate of IQ point loss (log form)
High estimate of IQ point loss (linear form)
0-1.9 1 2-4.9 2.6 31,136 50,597 45,770 5-9.9 6 11,196 18,193 54,860 10-14.9 11.15 2,011 3,240 9,359 15-19.9 16 740 1,192 3,601 20-29.9 24.25 437 701 1,914 30-39.9 34.2 189 303 897 40-49.9 46 50 80 258 50-59.9 52.6 10 16 54 60+ 62.6 10 16 58 Total 45,778 74,336 116,771 ≥2 45,778 74,336 116,771 ≥5 14,641 23,740 71,000 ≥10 3,445 5,546 16,140 ≥15 1,434 2,306 6,782 ≥20 695 1,115 3,180
In Table 28 the actual formulas are embedded, with the resulting values created by the calculations. The IQ impacts are in the rest of the table. The totals for multiple blood lead level cutoffs are at the bottom of the table. Table 28 shows the number of IQ points lost for all the children born in one year in Washington using the different estimates of IQ loss. The IQ point loss estimates in Table 28 feed into the total monetary values in Table 29. None of the IQ impacts for children in the 0.0 to 2.0 BLL are included. Half of the children in the 2 to 4.9 BLL range are removed because the mean value is 2.6 and the Lanphear multiplier begins at 2.4, not 2. For example the total change of 50,597 IQ points represents an average change of 3.9 IQ points per child for only half of the children in that BLL range.

256
This is not as large a shift as that created by removing lead from gasoline. Further, there are multiple other environmental insults occurring which affect IQ. However, given a typical range of IQ for normal individuals from 80 to 120 IQ points, a 2 point shift represents a 4% drop within the typical range and has consequences. For an individual such a loss can be overwhelmed by additional resources from a parent and community or by effort on the part of the affected individual. However, for an economy as a whole it is significant because individuals will display a range of income responses. Income Effects from Decreased IQ (V) The model multiplies the IQ effects for each BLL group of children by the low, mid-range, and high income effect described by Grosse (Grosse 2007). Additional information on this subject is in Appendix E. The range of income effects is created by using different discount rates to estimate the present value of future earnings. The interest rates are “real” interest rates, which do not include inflation because inflation was not built into the income portion of the model. Table 29 presents the estimated income losses for each BLL range and sums them for different BLL cut off levels. As Table 29 shows, the low estimate ($4053) for the lifetime value of an IQ point is based on using a 5% rate. The mid-range estimate ($9076) is based on using a 3% rate. Finally the high estimate ($20,169) is based on using a 1% rate. In discounting the income benefits of a change in lifetime earnings, an inflation free interest rate should be used. The average interest rate for I Bonds (inflation protected U.S. government bonds) for the last ten years is 2.04%. In Table 29 the values of an IQ point in the boxes at the top, which vary by discount rate, are applied to the estimated IQ point losses in Table 28. The two columns in the middle apply the expected dollar values using the same discount rate to the IQ predictions from the log function to obtain the lower cost figures and to the IQ predictions from the linear function to obtain the higher cost figures. Ecology has selected the log model in conjunction with the mid-range income effect (3% discount rate) to generate its total estimate of the value of lead related income costs. These are conservative values. The model generates a wide range of annual income loss values with the most likely values in the $675 million to $1 billion range.

257
Table 29- Estimated Costs of Lost Income for each BLL Range
discount rate 5% 3% 3% 1%
value of an IQ point
$4,053 $9,076 $9,076 $20,169
BLL range
(ug/dL)
Income loss using low estimate log
form
Income loss using middle estimate log
form
Income loss using linear
basis
Income loss using linear
basis 0-1.9
2-4.9 $126,190,628 $459,196,248 $415,395,990 $923,148,887 5-9.9 $45,375,191 $165,116,203 $497,888,857 $1,106,475,640 10-14.9 $8,150,022 $29,403,710 $84,936,165 $188,756,580 15-19.9 $2,997,322 $10,813,761 $32,683,661 $72,634,031 20-29.9 $1,769,954 $6,360,050 $17,374,920 $38,612,885 30-39.9 $764,298 $2,746,385 $8,136,465 $18,081,948 40-49.9 $201,131 $722,733 $2,338,931 $5,197,888 50-59.9 $40,226 $144,547 $489,908 $1,088,740 60+ $40,226 $144,547 $523,426 $1,163,228
≥2 $185,528,999 $674,648,183 $1,059,768,324 $2,355,159,827 ≥5 $59,338,371 $215,451,935 $644,372,333 $1,432,010,940 ≥10 $13,963,180 $50,335,733 $146,483,476 $325,535,299 ≥15 $5,813,158 $20,932,023 $61,547,311 $136,778,720 ≥20 $2,815,836 $10,118,262 $28,863,650 $64,144,689
Note: The values in the top box are applied to the IQ shift in Table 28. The two middle columns apply the expected dollar values to the IQ predictions from the Lanphear log function to obtain the lower cost figures and to the IQ predictions from the Lanphear linear function to obtain the higher cost figures. Uncertainty The reader can see from the wide range of estimates that the estimated values include wide latitude for interpretation. The primary issues are: · The blood lead levels collected by DOH are not a random sample and do not represent the
population. Therefore, the actual number of children in each BLL range is not known. · The range of estimates for IQ effects is large. · The range of income effects does not include other drivers beyond IQ especially behavior
issues (e.g., crime) which may arise from higher BLLs. · To reduce IQ losses across the population will require BLLs to be reduced for a large
number of children. This is made difficult because the origin of exposure is rarely identified.

258
If lead is removed in one source there are multiple other sources which could offset the change if they are not also removed.
Finally, the developing brains of children in this culture are subject to multiple environmental assaults and lead is only one of them. The expected IQ effects of lead reductions may accrue but could be moderated due to exposures to other contaminants.

259
Estimates of Costs to Reduce Exposure to Lead The costs presented below include costs associated with the CAP recommendations as well as some additional options as part of our process to select recommendations. Ecology did not estimate the costs of eliminating all sources. The estimate of the costs of our current lead exposure was based on lead’s effects on IQ in children, but implementation of the recommendations will result in reduced lead exposure to adults and wildlife too. This section estimates the costs of: · Required remediation in rental homes after a child is confirmed to have an EBLL due to lead
in the house. · Required assessment of lead hazards in all pre-1960 rental homes. · Remediation of lead-based paint in all homes in Washington. · Remediation of lead contaminated soil in all residential properties in Washington. · Switching to non-lead shot. · Switching to non-lead fishing weights. · Switching to non-lead wheel weights. · Increased childhood blood lead level testing. Costs to require remediation in rental homes after a confirmed EBLL Costs for paint remediation The cost of remediation depends on whether lead hazards are abated or remediated. Lead abatement refers to the permanent removal of lead-based paint hazards, while interim measures are more temporary. Generally people use remediation, which is a mix of abatement and interim measures. . Lead-based paint can be scraped or wet sanded and then disposed. Walls can be removed or papered or painted over. Windows and doors can be replaced or painted over. Siding can be removed, or covered with new siding, or painted. Ecology estimated remediation costs from government grants and private contractor estimates. Government grants costs in Washington Community, Trade & Economic Development (CTED) has a Lead Hazard Control Grant from HUD to remediate homes in Washington. The average cost of lead related interim controls for the 51 units recently completed by CTED is currently $12,000 but the HUD limit for such work is $7,500. Abatement typically costs $19,000 and the HUD maximum is $10,000. Private sector costs in Washington Ecology surveyed 38 contractors listed as doing lead abatement: 17 respondents, 11 non-respondents, 10 unreachable or no longer do this work. The contractor’s average reported costs range from $1,200 for the lowest cost interior encapsulation to over $30,000 for full abatement. The average reported charge for an individual home is $12,500. Individuals who own homes may

260
have more financial constraints than those who can obtain government support. Therefore the lower values reported may involve limited abatement with interim controls on most areas of the home. However, on average, the private sector does appear to be willing to pay more than HUD limits for cleanups. Ecology has used this estimate of $12,500 per housing unit for our cost estimate. Table 30- Contractors' Average Cost Estimates
Activity Low ($) High ($) Average ($) Scrape paint and dispose 3,000
Interior encapsulation 1,500 7,250 Exterior encapsulation 7,000 15,500 Interior and exterior
encapsulation 8,500 22,750 Stabilization only 10,000 16,000 Full abatement 3,625 28,100 Typical estimates for all
services 2,300 29,500 12,500 Costs for Soil Remediation HUD considers lead contaminated soil to be a lead-based paint hazard. There are other sources of lead contamination in soil, such as past use of leaded gasoline, lead arsenate pesticides, and industrial sources, such as the Asarco Plume centered in Tacoma. There are several different remediation methods to reduce lead hazards from soil: · Soil Safety Practices (such as covering bare soil) · Education and Outreach · Soil amendments which reduce mobility/bioavailability · Blending which includes covering playground and child use areas with mats · Capping which includes covering the top only · In-situ containment which includes a lead barrier on 5 or 6 sides of the soil · Excavation must be combined with in-situ containment, off-site treatment or disposal, or on-
site consolidation and stockpiling. Sometimes soil must be disposed of as dangerous waste but this is rare.
· Private land owners with no state support, who wish to remove lead, may also use phytoremediation.
Generally, “Soil Safety Practices” is the least costly and least effective option. This is followed by dig-and-haul, capping, blending and in-situ containment. In rare cases, some soil contains so much contaminant and more than one kind of contamination that it could exceed the dangerous waste threshold. If this is the case, then disposal costs are eight times higher. In addition, transportation costs increase due to longer haul distances and the

261
need to use licensed haulers. Other site- and remediation-specific variables can also affect the costs. For example, contractors can try to separate the contaminated soil from the other soil to reduce disposal costs. Costs of Excavation and Replacement of Contaminated Soil Excavation of contaminated soil and replacement with clean soil is effective but expensive. Housing and Urban Development (HUD) estimated costs at as high as $15,000 per unit (Federal Register 2004). In Washington soil excavation and disposal is estimated to cost $150 per cubic yard, and replacing the soil is estimated to cost $80 per cubic yard. In Washington most contaminated soils can be used as landfill cover and is not treated as dangerous waste. The costs depend on how much soil is removed. Generally the top layer of 2 inches to 6 inches is removed. Costs of Phytoremediation of Soil Phytoremediation is one option for landowners with no state support. It takes much longer than other methods but costs less. The average cost for a residential lot is $5,000. In residential areas turf grass removes the lead slowly (Elless et al. 2007). It may also maintain a vegetative cover which prevents exposure to the soil if it is well maintained. Turf grass slowly removes the lead from the soil. Then the grass itself is removed through mowing. The process includes seeding, sprinkler system, fertilization, a sprinkler timer, chelates, adjusting soil pH, extraction, and reduction/oxidation reaction. Costs of Encapsulation of Soil Encapsulation with no removal costs about $1.70 per square foot. This involves putting a geotextile cover over contaminated soil for about $1.00 per square foot. Then a surface such as gravel, woodchips, beauty bark, or play chips which costs $0.50 to $0.70 per square foot is placed on top of the geotextile to a depth of 2 to 4 inches. This is a temporary solution. Costs of Recent Soil Remediation in the Asarco Plume In the Asarco plume Ecology recently conducted minimal excavations and some encapsulation at 5 day care centers and has received bids for cleanup at 18 other sites. The most recent bids average $9,244 per site with a range from $3,500 to $18,500. Ecology used this estimate in our estimated costs for remediation of soil in rental homes. Annual costs for requiring remediation in rental homes after an EBLL If the BLL was tested for all one and two-year-old children Ecology expects up to 162 children per year could be identified as having BLL above 20 μg/dL. See table 26 for how many children we estimate in each BLL range. Ecology used this level for our estimate because this is the level at which the CDC recommends remediation and many states that require remediation use this BLL to trigger remediation. If the environmental investigation indicated lead-based paint was the source of lead exposure for all 162 children, the annual cost for remediation would be approximately $2 million. Approximately 32.5% of residences were rented in 2000 (U.S. Census

262
Bureau 2008), so we have estimated that 53 children with EBLL would live in rental homes. The estimated cost of remediating 53 homes is $662,500. If the action level for required remediation was less than 20 µg/dL, then more housing units would be required to be remediated and the costs would be higher. Since not every child is likely to have lead-based paint as the source of lead exposure, this estimate is considered to be an upper estimate of costs. While lead-based paint is the largest cause of lead poisoning for children, lead-based paint will not be the source of every EBLL, so the actual total cost of remediation will be less than $662,500. Ecology estimated the costs of remediating soil for the same 53 children expected to have EBLLs and live in rental housing. Using an average soil cleanup cost of $9,244 per site (from 18 sites in the Asarco plume) and assuming lead contaminated soil was the source of lead exposure for all 53 children, then the annual cost would be approximately $490,000. Lead contaminated soil will not be the source of every EBLL, so the actual total cost of remediation will be less. The recommendation focuses on rental homes because renters are more vulnerable than owners. We have not estimated whether children who live in rental homes are more or less likely to be exposed to lead-based paint or lead contaminated soil, compared to children who live in owner-occupied homes. Costs to require assessment of lead hazards in pre-1960 rental homes About 1 million of Washington’s homes were built before 1960. Of these about 330,000 are likely rental units, based on the percentage of rental homes in Washington. The expected cost of requiring a lead assessment on the rental units is $212 million. This is not an annual cost. Any unit that is certified as “lead-free” would not need to be re-assessed. Units certified as “lead-safe” would need to be screened for lead hazards at change of tenancy. Ecology expects there will be an overlap between these assessment costs and the costs from assessing homes due to elevated blood lead levels. Ecology did a survey of 62 remediation and lead abatement contractors. Only 12 of these contractors indicated they do lead assessment without having the activity linked to further work. The range of costs they quoted for assessment was $330 to $4000. The average of those, which are not high end outliers, was $636. CTED's Lead Hazard Control Grant Program indicates a typical figure for both in home and soils testing is $750. Ecology used $636 to estimate the cost of assessing all rental homes. Landlord Liability Costs accrue on the other side of the ledger for individuals and companies who rent to other people. Lack of abatement can generate liability if renters have children. Claims against landlords have had awards as high as $50 million. According to Mealeys (Lead Verdict Data 2001), for awards not complicated by interest or multiple damages, there have been: · 61 awards of $0 · 13 awards between $1 and $50,000 · 12 awards between $50,001 and $100,000

263
· 46 awards between $100,001 and $500,000 · 15 awards between $500,001 and $1 million · 37 greater than $1 million The awards come from the failure to abate lead paint hazards. Manufacturer Liability Paint manufacturers may have some liability for cleanups (Tucker 2007). In February, Providence Superior Court Judge Michael Silverstein ordered three former lead paint manufacturers to clean up properties which contain toxic lead paint in Rhode Island. Sherwin-Williams Co., NL Industries Inc. and Millennium Holdings LLC are affected by the ruling. Rhode Island estimated the costs at $1.37 billion to $3.74 billion. This ruling is under appeal. Costs for remediation of all lead-based paint in Washington homes The CAP does not recommend remediation of all lead-based paint and contaminated soil in Washington homes, but the estimates are presented here for informational purposes. Based on Jacobs et al. (Jacobs et al. 2002) survey of U.S. housing, Ecology estimates that 472,035 housing units in Washington have lead hazards (table 31). The estimate of how many houses there are in Washington State in each age group is from the Office of Financial Management (OFM), which uses U.S. Census data. At an average cost of $12,500 remediation of all lead based paint hazards in all homes in Washington would cost $5.9 billion. Remediation of all rental units would cost $1.9 billion. Table 31- Estimate of Washington Homes with Lead Hazards
Year of construction
Percent of U. S. homes with
lead hazards # Homes in Washington
# Homes in Washington with
lead hazards 1978-1998 3 1,067,844 32,035 1960-1977 8 661,598 52,928 1940-1959 43 414,555 178,259 Pre-1940 68 307,078 208,813 Total
2,451,075 472,035
Costs for remediation of all lead contaminated soil in Washington homes The CAP does not recommend remediation of all lead contaminated soil in Washington homes, but the estimates are presented here for informational purposes. Based on the survey of lead hazards in U.S. housing (Jacobs et al. 2002), between 193,000 and 300,643 homes in Washington need soil remediation. The likelihood that a home needs remediation for lead in the soil depends on whether the home has lead paint, its age, and the cut off level for remedial action. The federal remediation level

264
used for play areas is 400 ppm. In Washington, the Model Toxics Control Act (MTCA) specifies 250 ppm as the lead cleanup level. This means the number of homes in Washington which don’t meet this limit probably falls between 193,000 to 300,643 homes. Table 32- Soil Lead Levels by Housing Age
Year of construction > 200 ppm >400 ppm >1200 ppm
Percent of U.S. homes
# Homes in Washington
Percent of U.S. homes
# Homes in Washington
Percent of U.S. homes
# Homes in Washington
1978-1998 1% 10,678 0%
0% 1960-1977 6% 39,696 4% 26,464 0% 1940-1959 30% 124,367 18% 74,620 14% 58,038
Pre-1940 41% 125,902 30% 92,123 19% 58,345 Total
300,643
193,207
116,383
The deterioration of the lead based paint on homes is one major reason lead may be in the soil but it is not the only one. Between 30% and 39% of homes with deteriorating lead paint would be expected to have soil contamination sufficient to require remediation or encapsulation (Jacobs et al. 2002). Table 33- Soil Lead and its Relationship to Exterior Lead-Based Paint from Jacobs et al. 2002 >200 ppm >400 ppm >1200 ppm No exterior lead-based paint 5% 3% 1% Good condition 13% 8% 4% Significantly deteriorated 39% 30% 24% · Remediation of lead contaminated soils in residential areas would cost between $1.2 and $1.4
billion. · Ecology is using average soil clean up costs of $9,244, based on data from 18 sites in the
Asarco plume, to estimate the cost of remediation at rental units and $5,000 for phytoremediation of private residences.
Table 34- Estimated Costs of Remediation of Soil for Housing # Homes 193,207 300,643 Low cost private remediation $652,498,624 $1,015,329,612 Remediation for rental units $579,696,031 $902,044,118 Total cost $1,232,194,655 $1,917,373,730

265
Costs for remediation of all homes for paint and soil The CAP does not recommend remediation of all lead-based paint and contaminated soil in Washington homes, but the estimates are presented here for informational purposes. If all remediation of homes and soils were done today, the expected cost would be between $7.1 and $7.8 billion. However, not all these costs will accrue because some homes will be demolished and replaced before renovation occurs. Costs to switch to non-lead wheel weights, shot and small fishing weights The Lead CAP does not recommend any new product bans. These estimates are provided for informational purposes. Lead wheel weights Ecology expects that switching from lead to steel in wheel weights would cost Washington approximately $3.3 million per year. Wheel weights are installed on new vehicles and when tires are replaced. We did not include additional wheel weights used in re-balancing tires. Data on new vehicles is from the Department of Licensing. The $0.34 difference in price between lead and steel wheel weights is based on state contract bids. This cost would be approximately 50 cents per car annually. Table 35- Estimated Cost of Replacing Lead Wheel Weights Purchase data # purchased # weights each total # weights New passenger cars 226,282 10 2,262,820 New trucks 40,713 10 407,130 Motorcycles 17,622 4 70,488 Replacement tires 3,511,200 2 7,022,400 Total weights
9,762,838
Lead wheel weights
$0.65 Steel wheel weights
$0.99
Difference
$0.34
Total cost difference
$ 3,319,365 Lead shot Ecology expects that switching from lead shot to non-lead alternatives would cost Washington approximately $13 million per year. This would be $19-128 per small game hunter annually, depending on how much shot is used by other users. The USFWS reports that the average hunter

266
spent $56 per year on ammunition and $1,830 on all hunting related costs (U.S. Department of Interior, Fish and Wildlife Service 2006). Table 36- Estimated Cost of Lead Shot Alternatives
Metal Average cost/shell Ratio to lead N Bismuth $2.46 4.73 20 Steel $1.14 2.19 215 Tungsten $3.72 7.15 63 Misc. $3.44 6.62 7 Lead $0.52
78
Average
5.17
Shot can be made from a variety of metals. Lead shot is much cheaper than other metals. The price of non-lead shells may be two to seven times more expensive than lead. Ecology is not positive which metal to use for the extrapolation, however most people discuss the shift in terms of shifting to steel. Therefore, Ecology used the steel cost ratio of 2.19 as the low cost estimate and then averaged all metals for a high cost estimate of 5.17. Non-lead shot is more readily available than other types of non-lead ammunition. Table 36 shows the different retail costs of shotgun shells. The table includes N, which is how many different prices of shotgun shells were looked at for each metal. Unfortunately Ecology also does not have reliable information on the total sales of lead shot or shells in Washington. The federal Alcohol and Tobacco Tax and Trade Bureau (TTB) collects an excise tax on guns and ammunition.
1. TTB indicates that an average of $315,000 was collected directly from Washington in the years 2005 through 2007. Extrapolating from this value to total expenditure, Ecology assumes 25% of this revenue comes from ammunition and a tax rate of 11%. This yields a total expenditure of $731,000. However, the TTB cautions that this misses retail sales that come into the state through a distribution site and direct sales into Washington from multiple sources. It is likely that this value underestimates total ammunition sales. Ecology then used the figures from Table 36 to estimate the new expenditure for shot made of steel or other metals, and then the increased costs. Using this extrapolation would yield a $0.9 to $3 million dollar cost increase for users of lead shot.
2. TTB indicates that $204 million was collected nationwide in 2002. Extrapolating from this value to total expenditure, Ecology assumes Washington State would represent approximately 2% of this based on both population and state gross domestic product, 25% of this revenue comes from ammunition, and a tax rate of 11%. This yields a total current expenditure of $9.5 million and an increased cost estimate ranging from $11 to $40 million.
The assumption that 25% of revenue comes from ammunition sales is based on national USFWS data (U.S. Department of Interior, Fish and Wildlife Service 2006). According to the USFWS survey, hunters’ expenditures on ammunition are 25% of their expenditures on shotguns and rifles. Ecology believes the second estimate is the more likely value for total ammunition sales.

267
However, the value estimated this way includes all ammunition, not just shot. Therefore, the estimate must be very high. This high estimate would mean a range of $11 million to $40 million in costs. The more likely value is the $11 million, given the emphasis in the hunting community of shifting to steel shot. Table 37- Estimated Cost of Replacing Lead Shot Share of Revenue for ammunition 25.54%
Shift to Steel Shift to Multiple Metals
Multiplier for the Change in Shot 2.19 5.17 TTB Washington Tax Revenue $ 315,103 Expenditure $ 731,534 New Expenditure $ 1,603,749 $ 3,784,284 Net Increase in Cost $ 872,214 $ 3,052,750 National TTB Data $ 204,966,986 Washington as 2% of Economy and Population $ 4,099,340 Expenditure $ 9,516,913 New Expenditure $ 20,864,002 $ 49,231,724 Net Increase in Cost $ 11,347,089 $ 39,714,811 WA Fiscal Note Estimate for Increase in Cost $ 13,509,056 $ 47,281,696
The share of this that would actually accrue to shot rather than other ammunition is estimated using WDFW data. Based on WDFW data, $13 million is more likely to be the correct value. In comparing this data with other data on the amount of lead, Ecology used a fiscal note (Washington Department of Fish and Wildlife 2005) that was prepared for a lead tax that was proposed in HB 2211 in 2005. Using the ratios in the fiscal note, the state estimate of how much lead shot is used each year is in between the high and low estimates from the TTB tax base estimates. Using the lower TTB value may understate the expected costs by more than tenfold. Table 38 provides the basis for the extrapolation from the TTB data to the WDFW data. It shows the WDFW data provides a moderate value. Thus, if the WDFW data on the amount of lead shot was an accurate assessment which can be applied to the TTB data, the approximate cost of switching to steel shot would range from $13 million to $47 million, with the $13 million, based on steel shot, being closer to the likely amount.

268
Table 38- Estimates of Lead Shot Used in Washington
Price survey Fiscal Note Ammo Expenditure N rounds ounces Metric Tons TTB WA data $ 731,534 1,406,797 1,406,797 40 TTB National Data (WA = 2%) $ 9,516,913 18,301,756
18,301,756 520
Estimate from WA fiscal note $ 11,330,176 21,788,800
21,788,800 556
Fishing weights Ecology expects that replacing lead fishing weights with other metals will increase the cost of fishing weights by a factor of one to 4.5 depending on the metal used and the shape of the weight. Table 39 displays a variety of sizes and shapes made from different metals. The results for each type are relatively consistent. The total expenditure for this estimate is based on a Canadian study (Scheuhammer et al. 2003) of lost fishing weights. This study estimated that 3977 metric tons of fishing weights are lost each year in the U.S. Extrapolation to Washington is based on a 2% multiplier used against the US estimate, since Washington has approximately 2% of the U.S. population. This yields an estimate of 80 metric tons and a range of costs for weights from $1.8 to $7.9 million per year. Costs per angler per year range from $3 to $14. The USFWS estimates $13 was spent, per angler, in 2006 for hooks, sinkers, swivels, and other items attached to a line. However, multiplying this figure by the number of people participating in fishing in Washington gives an estimated cost of $11.5 million per year, though not all of this cost is for sinkers. Ecology believes this number is high. The USFWS reports that the average fisherman spent $1,407 per year for costs related to fishing (U.S. Department of Interior, Fish and Wildlife Service 2006). Table 39- Comparison of Fishing Weight Costs Split Shot Per Unit Cost by Size
Lead Tin Ratio T/L Cost Estimate Size BB $0.01 $ 0.05 5.74 Size 3/0 $.01 $ 0.07 5.92 Size 7 $ .02 $ 0.10 4.01 Size 5 $ 0.03 $ 0.14 4.20 Size 4 $ 0.04 $ 0.15 3.74 Size 1 $ 0.08 $ 0.29 3.46 Average 4.51 $ 7,942,895

269
Sling Shot Worm Weights Per Unit Cost by Size Lead Tungsten Ratio T/L Cost Estimate 1/8 oz $ 0.87 $ 1.25 1.43 ¼ oz $ 0.87 $ 1.83 2.10 ½ oz $ 0.16 $ 3.50 3.00 Average 2.18 $ 3,832,087 Ultra Steel Egg Sinkers Per Unit Cost by Size Lead Steel Ratio S/L Cost Estimate Steel. ¼ oz $ 0.13 $ 0.17 1.28 Steel. ½ oz $ 0.21 $ 0.21 0.99 Steel. ¾ oz $ 0.34 $ 0.37 1.10 Steel. 1 oz $ 0.42 $ 0.46 1.09 Average 1.12 $ 1,963,806 Bullet Weights Lead Brass Ratio B/L Cost Estimate Assorted $ 0.28 $ 0.295 1.04 $ 1,835,088 Skinny Drop Shot Weights Per Unit Cost by Size Lead Tungsten Ratio T/L Cost Estimate 1/8 oz. Tungsten. $ 0.33 $ 0.80 2.40 3/16 oz. Tungsten. $ 0.39 $ 0.80 2.05 ¼ oz. Tungsten. $ 0.39 $ 1.00 2.57 3/8 oz. Tungsten. $ 0.47 $ 1.66 3.57 ½ oz. Tungsten. $ 0.58 $ 1.80 3.08 Average 2.73 $ 4,813,867 Current Estimated Costs $ 8,758,750 Number of People Fishing* 673,750 Average Annual Expenditures** $ 13 Average Ratio 2.32 $ 11,532,034 * SCORP, 2002, Interagency Committee for Outdoor Recreation, An Assessment of Outdoor Recreation in Washington State.
** 2006 National Survey of Fishing, Hunting, and Wildlife-Associated Recreation, USFWS

270
Costs to Increase Childhood Blood Lead Level Testing Ecology looked at several different estimates for the cost of a blood lead level test. Ecology used the higher estimate of $21.50 per test in the estimated costs. · Based on data from a major private lab, the average cost of BLL testing is $20, including $8
for a blood draw. · In fiscal notes DOH assumed combined testing costs of $21.50 per child, which included
expected costs of follow-up testing for one in every 158 children given the preliminary BLL test.
· The Medicaid reimbursement rate for a blood lead level test is $14. In its fiscal note DOH assumes an implementation date of the pilot program in January 2009. Prior to implementation, DOH will have one-time expenditures for the purchase of 100 LeadCare II machines for $250,000 (estimated $2,500 each) and 20,000 test kits for $160,000 ($8 each). DOH assumes it will supply the initial round of test kits, and that clinics will use Medicaid reimbursements to purchase future supplies. In FY 2009, follow-up blood tests for the estimated 130 children, contracted through a private laboratory, for $3,250 ($25 each). In FY 2010, this cost will increase to $6,500 for a full year (260 children) of follow-up blood tests and in FY 2011, the figure will drop down to FY 2009 level of $3,250 since the pilot program will end six months into the fiscal year. The cost for increased testing depends on how many children are tested. Even in states with mandatory universal testing, the testing rates do not approach 100%. For example, Vermont has recently set the goal of testing at least 85% of one year olds and 75% of two year olds. Medicaid requires blood lead level testing for all children on Medicaid at 12 and 24 months. However, the General Accounting Office has found that only 18% of children who are eligible for testing are actually tested (U.S. Government Accountability Office, 1999 400 /id). The national average is about 11% of children are tested for BLL. Table 40- Estimates of Costs for Childhood Blood Lead Level Testing
Percent 1 and 2 year old children tested annual expense 100 $3,741,000 80 $2,992,800 50 $1,870,500 18 $673,380 10 $374,100
Percent tested at least once 100 $1,870,500
80 $1,496,400 50 $935,250 18 $336,690 10 $187,050

271
Table 40 shows costs for childhood blood lead testing. If all children in Washington are tested for BLL at both 12 and 24 months, the estimated cost is $3.7 million. If all children in Washington are tested for BLL once, then the cost is $1.9 million. If 18% of children in Washington are tested for BLL once, then the annual cost is $337,000. The 18% figure was chosen because the GAO report found 18% of children who are eligible for testing are actually tested. The CAP does not recommend universal mandatory testing, so the lower estimates are more likely. The cost for increased childhood blood lead testing is linked to the costs for environmental investigations and case management for additional children that are identified with EBLLs. Based on an Ecology survey of contractors, the cost of home risk assessments is $636 each. According to recent Medicaid records, approximately 33% of the children tested will be eligible for Medicaid, which will cover some of the costs of environmental investigations and case management. Table 41 looks at the cost of testing 18% of all 1 and 2 year olds, linked to the costs of environmental investigations and case management. The investigation and case management costs assume that all children with higher BLLs will be captured if 18% of children are tested, which is not likely. This leads to an overestimate of the costs associated with environmental investigations and case management. The columns in Table 41 show different estimates for different BLL triggers. If lower BLLs are used to trigger assessment, then the number of children and the costs increase. Table 41- Range of Costs of BLL Testing with Case Management
20 ug/dL 10 ug/dL 5 ug/dL
Cost per test $21.50 $21.50 $21.50 Annual births (non military) 87,000 87,000 87,000 Percent of children tested 18 18 18 Total cost for testing two age cohorts $673,380 $673,380 $673,380 Estimated percent of children above trigger BLL 0.19% 1.06% 6.43% # Children above trigger BLL (2 cohorts) 323 1,851 11,181
Cost per home risk assessment $636 $636 $636 Total cost for home risk assessments $205,607 $1,177,833 $7,113,994 Total cost for testing and risk assessments $878,987 $1,851,213 $7,787,374 Medicaid reimbursement each BLL test $14
Medicaid cost for testing and risk assessment $212,756


272
XI. General References There are additional references at the end of the section on human health effects and at the end of the chapter on current laws and regulations. Agency for Toxic Substances and Disease Registry. Draft Toxicological Profile for Lead. 2005.
Area-Wide Soil Contamination Task Force. Area-Wide Soil Contamination Task Force Report. 6-30-2003.
Association of Occupational and Environmental Clinics. Medical Management Guidelines for Lead-Exposed Adults. www.aeoc.org/documents/positions/MMG_FINAL.pdf . 12-19-2007.
Australian Government. Lead alert facts: lead in ceramincs. 2008a.
-----. Lead alert facts: lead in stained glass. 2008b.
Bindler R, Brannvall M-L, Renberg I. Natural Lead Concentrations in Pristine Boreal Forest Soils and Past Pollution Trends: A Reference for Critical Load Models. Environ.Sci.Technol. 33[No. 19], 3362-3367. 1999.
Blando J, Lefkowitz D, Valiente D, Gerwel B, Bresnitz E. Survey of Current Lead Use, Handling, Hygiene, and Containment Controls Among New Jersey Industries. Journal of Occupational and Environmental Hygiene 4[8], 539-546. 2007.
Bleiwas DI. Stocks and Flows of Lead-Based Wheel Weights in the United States. USGS. 2006.
Blus LJ, Henny CJ, Hoffman DJ, Grove RA. Lead Toxicosis in Tundra Swans near a Mining and Smelting Complex in Northern Idaho. Archives of Environmental Contamination and Toxicology 21, 549-555. 1991.
Brannvall M-L, Bindler R, Renberg I, Emteryd O, Bartnicki J, Billstrom K. Medieval Metal Industry Was the Cradle of Modern Large-Scale Atmospheric Lead Pollution in Northern Europe. Environ.Sci.Technol. 33[No. 24], 4391-4395. 2007.

273
Brønnum J, Hansen E. Lead: Uses, Problems and Further Efforts. 1999. Danish Ministry of the Environment and Energy.
Brown S, Chaney R, Hallfrisch J, Ryan JA, Berti WR. In Situ Soil Treatment to Reduce the Phyto- and Bioavailability of Lead, Zinc, and Cadmium. Journal of Environmental Quality 33, 522-531. 2004.
Bureau of Transportation Statistics. National Transportation Statistics. 2002.
The Campaign for Safe Cosmetics. A Poison Kiss: The Problem of Lead in Lipstick. 2007.
California Air Resources Board. Lead: Evaluation of Current California Air Quality Standards with Respect to Protection of Children. 2000.
California Department of Toxic Substances Control. California's Lead-Containing Jewelry Law Questions and Answers. 9-6-2007.
California Office of Environmental Health Assessment. Proposed Identification of Inorganic Lead as a Toxic Air Contaminant. 1996.
California Office of Environmental Health Hazard Assessment. Guidelines for Safe Arts and Crafts Materials. 2007.
Cao X, Ma LQ, Chen M, Hardison DW, Harris WG. Weathering of Lead Bullets and Their Environmental Effects at Outdoor Shooting Ranges. Journal of Environmental Quality 32, 526-534. 2003.
Center for Environmental Health. Lead in Baby and Talcum Powder. 1999.
-----. A Back to School Warning: Children's Vinyl Lunch Boxes Can Contain Dangerous Levels of Lead. 2006.
Centers for Disease Control and Prevention. Lead Poisoning from Mexican Folk Remedies. Morbidity and Mortality Weekly Report 32[42], 554-555. 10-28-1983.

274
-----. CPSC Announces Recalls Of Imported Crayons Because Of Lead Poisoning Hazard. 1994.
-----. Facts on... Lead. 1997.
-----. Brief Report: Lead Poisoning from Ingestion of a Toy Necklace --- Oregon, 2003. 2004a.
-----. Lead Poisoning Associated with Ayurvedic Medications. Morbidity and Mortality Weekly Report 53[26], 582-584. 7-9-2004b.
-----. Preventing Lead Poisoning in Young Children. Gerberding, Julie L. Sinks Tom Rabb Jim Brown Mary Jean. 2005.
-----. Adult Blood Lead Epidemiology and Surveillance- United States, 2003-2004. Morbidity and Mortality Weekly Report 55[32], 876-879. 8-18-2006a.
-----. Death of a Child After Ingestion of a Metallic Charm --- Minnesota, 2006. 2006b.
-----. Lead Recalls: Jewelry and Accessories. 2008a.
-----. Toys and Childhood Lead Exposure. 2008b.
Church ME, Gwiazda R, Risebrough RW, Sorenson K, Chamberlain CP, Farry S, Heinrich W, Rideout BA, Smith DR. Ammunition is the Principal Source of Lead Accumulated by California Condors Re-Introduced to the Wild. Environ.Sci.Technol. 40[No. 19], 6143-6150. 2006.
Community, Trade, and Economic Development. Lead Hazards in Housing. Childhood Lead Exposure in Washington's Communities. 2005.
Cornicelli L, Grund M. Examining Variability Associated with Bullet Fragmentation and Deposition in White-Tailed Deer and Domestic Sheep: Preliminary Results. 2008.
Craig JR, Rimstidt JD, Bonnaffon CA, Collins TK, Scanlon PF. Surface Water Transport of Lead at a Shooting Range. Bulletin of Environmental Contamination and Toxicology 63, 312-319. 1999.

275
Cummings School of Veterinary Medicine at Tufts University. Lead Poisoning. http://www.tufts.edu/vet/lead/index.html#dom . 2008. 5-28-2008.
Degernes L, Heilman S, Trogdon M, Jordon M, Davison M, Kraege D, Correa M, Cowen P. Epidemiologic Investigation of Lead Poisoning in Trumpeter and Tundra Swans in Washington State, USA, 200-2002. Journal of Wildlife Diseases 42[2], 345-358. 2006.
Department of Health and Human Services. ToxFAQs™: Chemical Agent Briefing Sheets (CABS)-Lead. 2008.
DiGangi J. Lead and Cadmium in Vinyl Consumer Products: A Greenpeace Expose. 1997. Greenpeace USA.
The Disney Corporation. Disney Debuts New Safer, Quieter and More Environmentally-Firendly Fireworks Technology-Press Release. 2004.
Dobson M. Verifying Vinyl Siding. Building Safety Journal . 2006. International Code Council.
The Ecology Center. Citizen Petition under TSCA to Prohibit the Production and Use of Lead Wheel Weights in the United States. 5-13-2005.
-----. Lead, Arsenic, Other Harmful Chemicals Found in Popular Toys-Press Release. 2007.
Eisler R. Lead Hazards to Fish, Wildlife, and Invertebrates: A Synoptic Review. 1988.
Elless MP, Bray CA, Blaylock MJ. Chemical Behavior of Residential Lead in Urban Yards in the United States. Environmental Pollution 148, 291-300. 2007.
Elstrodt D, Rose JE, Puszynski JA. Lead-free pyrotechnic composition. 2003.
Environmental Defense. Getting the Lead Out- Impacts of and Alternatives for Automotive Lead Uses. 2003.
EnviroVision and Herrera Environmental Consultants. Evaluation of Washington's Industrial Stormwater General Permit. 2006.

276
EnviroVision Corp., Herrera Environmental Consultants, Washington Department of Ecology. Phase 2: Improved Estimates of Toxic Chemical Loadings to Puget Sound from Dischargers of Municipal and Industrial Wastewater. Ecology PublicationNumber 08-10-089 . 2008a.
-----. Phase 2: Improved Estimates of Toxic Chemical Loadings to Puget Sound from Surface Runoff and Roadways. Ecology Publication Number 08-10-084 . 2008b.
Farmer JG, Eades LJ, Atkins H, Chamberlin DF. Historical Trends in the Lead Isotopic Composition of Archival Sphagnum Mosses from Scotland (1838-2000). Environ.Sci.Technol. 36[No. 2], 152-157. 2002.
Farmer JG, Eades LJ, MacKenzie AB, Kirika A, Bailey-Watts TE. Stable Lead Isotope Record of Lead Pollution in Loch Lomond Sediments since 1630 A.D. Environ.Sci.Technol. 30[No. 10], 3080-3083. 1996.
Federal Aviation Administration. Unleaded Fuels Research Program- press release. 2008.
Federal Register. Prohibition on Gasoline Containing Lead or Lead Additives for Highway Use. 61[23], 3832-3938. 2-2-1996.
-----. Healthy Homes Technical Studies Program. 69[94], 27235-27243. 5-14-2004.
Fosmire D, Curtis D, Stone WB. Lead in low-cost jewelry: Do you know what your child is wearing [draft]. 2007.
Foulke J. Lead threat lessens, but mugs pose problem. FDA Consumer Magazine . 1993.
Franson JC. 1996. Interpretation of tissue lead residues in birds other than waterfowl. In: Environmental Contaminants in Wildlife: Interpreting Tissue Concentrations (Beyer WJ, Heinz GH, Redmon-Norwood AW, eds.).Lewis Publishers, 265-280.
Gao D, Modal TK, Lawrence DA. Lead effects on development and function of bone marrow-derived dendritic cells promotes Th2 immune response. Toxicology and Applied Pharmacology in press. 2007.
Geibig JR, Socolof ML. Solders in Electronics: A Life-Cycle Assessment. 2005. University of Tennessee Center for Clean Products and Clean Technologies.

277
Gray T. Tire Derived Fuel: Environmental Characteristics and Performance. 2004.
Green Solutions. Waste Composition Analysis for the State of Washington. 2003.
Grosse SD. How Much Does IQ Raise Earnings? Implications for Regulatory Impact Analyses. Association of Environmental and Resource Economists Newsletter 27[2], 17-21. 2007.
Guidotti TL, Calhoun T, Davies-Cole JO, Knuckles ME, Stokes L, Glymph C, Lum G, Moses MS, Goldsmith DF, Ragain L. Elevated Lead in Drinking Water in Washington, DC, 2003-2004: The Public Health Response. Environmental Health Perspectives 115[No. 5], 695-701. 2007.
Haley VB, Talbot TO. Geographic Analysis of Blood Lead Levels in New York State Children Born 1994-1997. Environmental Health Perspectives 112[No. 15], 1577-1582. 2004.
Hart Crowser, Inc, Washington Department of Ecology, U.S.Environmental Protection Agency, Puget Sound Partnership. Control of Chemicals in Puget Sound. Phase I: Initial Estimate of Loadings. 2007.
Health Canada. Lead Crystalware and Your Health. 2003.
Heyvaert AC, Reuter JE, Slotton DG, Goldman CR. Paleolimnological Reconstruction of Historical Atmospheric Lead and Mercury Deposition at Lake Taho, California-Nevada. Environ.Sci.Technol. 34[No. 17], 3588-3597. 2000.
Hunt WG, Burnham W, Parish CN, Burnham KK, Mutch B, Oaks JL. Bullet Fragments in Deer Remains: Implications for Lead Exposure in Avian Scavengers. Wildlife Society Bulletin 34[1], 167-170. 2006.
Illinois General Assembly. Public Act 094-0879. 2006.
International Programme on Chemical Safety. Lead Environmental Aspects. Environmental Health Criteria 85. 1989.
Iqbal S. Epi-Aid Trip Report: Assessment of human health risk from consumption of wild game meat with possible lead contamination among the residents of the State of North Dakota. National Center for Environmental Health, Centers for Disease Control and Prevention . 10-14-

278
2008.
Isaac RA, Gil L, Cooperman AN, Hulme K, Eddy B, Ruiz M, Jacobson K, Larson C, Pancorbo OC. Corrosion in Drinking Water Distribution Systems: A Major Contribution of Copper & Lead to Wastewaters and Effluents. Environ.Sci.Technol. 31, 3198-3203. 1997.
Jacobs DE, Clickner RP, Zhou JY, Viet SM, Marker DA, Rogers JW, Zeldin DC, Broene P, Friedman W. The Prevalence of Lead-Based Paint Hazards in U.S. Housing. Environmental Health Perspectives 110[No. 10], A599-A606. 2002.
Jordan CM, Yust BL, Robison LL, Hannan P, Deinard AS. A Randomized Trial of Education to Prevent Lead Burden in Children at High Risk for Lead Exposure: Efficacy as Measured by Blood Lead Monitoring. Environmental Health Perspectives 111[No. 16], 1947-1951. 2003.
King County Department of Natural Resources and Parks. 2006 Biosolids Quality Summary. 2007.
Kinross Gold Corporation. 2006 Annual Report-Deliverying Disciplined Growth. 2006.
-----. Kettle River- Buckthorn. http://www.kinross.com/operations/usa-kettle-river.html . 2009. 5-19-2009.
Kitman JL. Timeline: 8,500 Years of Lead... 79 Years of LEADED Gasoline. The Nation . 2000.
Kjølhot J, Vigsø D, Arnberg K, Hansen E, Ringgaard KW, Rasmussen PE. Possible Control of EU Priority Substances in Danish Waters. 2007. Danish Environmental Protection Agency.
Kosnett MJ, Wedeen RP, Rothenberg SJ, Hipkins KL, Materna BL, Schwartz BS, Hu H, Woolf A. Recommendations for Medical Management of Adult Lead Exposure. Environmental Health Perspectives 115[No. 3], 463-471. 2007.
Lambert TW, Lane S. Lead, Arsenic, and Polycyclic Aromatic Hydrocarbons in Soil and House Dust in the Communities Surrounding the Sydney, Nova Scotia, Tar Ponds. Environmental Health Perspectives 112[No. 1], 35-41. 2004.

279
Landau Associates. Summary of 2008 Groundwater and Surface Water Runnoff Investigation Triangle Pit. 3-25-2009.
Lanphear B, Hornung R, Khoury J, Yolton K, Baghurst P, Bellinger D, Canfield RL, Dietrich KN, Bornschein RL, Greene T, Rothenberg SJ, Needleman HL, Schnaas L, Wasserman G, Graziano J, Roberts R. Low-Level Environmental Lead Exposure and Children's Intellectual Function: An International Pooled Analysis. Environmental Health Perspectives 113[No. 7], 894-899. 2005.
Lassen C. Mass Flow Analysis for Lead in 2000. Christensen, Claus L. and Cowi, Susanne S. Environmental Project Nr. 917. 2004. Danish Environmental Protection Agency.
Laumann AE. Tattoos and Body Piercings in the United States: A National Data Set. Derick, A. J. Journal of the American Academy of Dermatology 55[3], 413-421. 2006.
Lead Education and Abatement Design Group. Countries where Leaded Petrol is Possibly Still Sold for Road Use. http://www.lead.org.au/fs/fst27.html . 2008.
Lead Group Incorporated. Firework Pollution. 1999.
Lead Verdict Data. www.mealeys.com/LedVerdictCv1001.pdf . 2001. 3-5-2008.
Lefcort H, Freedman Z, House S, Pendleton M. Hormetic Effects of Heavy Metals in Aquatic Snails: Is a Little Bit of Pollution Good? EcoHealth 5[1], 10-17. 2008.
Lejune K. Report of Injury Assessment and Injury Determination: Coeur d'Alene Basin Natural Resource Damage Assessment. 6-1-6-92. 2000.
Lovejoy A. 2007. Do You Know What's Really in that Hose? Seattle Post Intelligencer.
Ma WC. 1996. Lead in Mammals. In: Environmental Contaminants in Wildlife: Interpreting Tissue Concentrations (Beyer WJ, Heinz GH, Redmon-Norwood AW, eds.).Lewis Publishers, 281-296.
Maas R, Patch S, Pandolfo TJ. Artificial Christmas Trees: How Read are the Lead Exposure Risks? Journal of Environmental Health 67[5], 20-24. 2004.

280
Maas R, Patch S, Parker A. An Assessment of Lead Exposure Potential from Residential Cutoff Valves. Journal of Environmental Health 65[1], 9. 2002.
Maas R, Patch S, Pope J, Thornton L. Lead-Leaching Characteristics of Submersible Residential Water Pumps. Journal of Environmental Health 60, 8. 2008.
Maboeta MS, Reinecke AJ, Reinecke SA. Effects of low levels of lead on growth and reproduction in the asian earthworm Perionyx excavatus. Ecotoxicology and Environmental Safety 44[3], 236-240. 1999.
Mayer R. 1979. In: The Painters CraftPenguin Books, 37-38.
McNeil DJr, Schoenfeld A. 2007. In a Contaminated World, Play Isn't the Only Hazard. New York Times.
Michael P. 2006. Fish and Wildlife Issues Related to the use of Lead Fishing Gear. Washington Department of Fish and Wildlife.
Mielke H, Dugas D, Mielke PWJr, Smith K, Smith S, Gonzales CR. Associations Between Soil Lead and Childhood Blood Lead in Urban New Orleans and Rural Lafourche Parish of Louisiana. Environmental Health Perspectives 105[9], 950-954. 1997.
Minnesota Department of Natural Resources. The Case for Non-toxic Shot. 2008.
Minnesota Nontoxic Shot Advisory Committee. Report of the Nontoxic Shot Advisory Committee. 12-12-2006.
Minnesota Pollution Control Agency. Legislative Report on Sources and Effects of Lead Presented to the Committees on the Environment and Natural Resources. 1999.
Miranda ML, Kim D, Hull AP, Paul CJ, Galeano MAO. Changes in Blood Lead Levels Associated with Use of Chloramines in Water Treatments Systems. Environmental Health Perspectives 115, 221-225. 2007.
Nakayama A, Kimura H, Watanabe K, Kondo Y, Ota Y, Iwata S. Development of Ecological Wire and Cable "ECO-GREEN". Hitachi Cble Review No. 18. 1999.
NASCAR. NASCAR set to use unleaded fuel in 2008- press release. 1-21-2006.

281
-----. Unleaded fuel passing Cup test at Las Vegas- press release. 2-1-2007.
National Institute for Occupational Safety and Health. NIOSH Safety and Health Topic: Lead. www.cdc.gov/niosh/topics/lead/ . 12-19-2007. 4-7-2008.
Navas-Acien A, Silbergeld EK, Sharrett AR, Calderon-Aranda E, Selvin E, Guallar E. Metals in Urine and Peripheral Arterial Disease. Environmental Health Perspectives 113[No. 2], 164-169. 2005.
Nelson NA, Kaufman JD. Employees Exposed to Lead in Washington State Non-Construction Workplaces: A Starting Point for Hazard Surveillance. American Industrial Hygiene Association Journal 59, 269-277. 1988.
New South Wales lead reference centre. Traditional remedies reported to contain lead. 12-12-2001.
North Dakota. Lead in Venison. http://www.ndhealth.gov/lead/venison/ . 2009. 11-5-0008.
Northeast Waste Management Officials' Association. Lead: Lead Prevention. 2007.
NSF International. Frequently Asked Questions: General Questions on NSF/ANSI Standard 61. 2008.
The Olympian. Emaciated Eagles treated at WSU Die. 2008
Organisation for Economic Co-operation and Development. Risk Reduction Monograph No. 1: Lead-Background and National Experience with Reducing Risk. 1993.
Pain DJ. 1996. Lead in Waterfowl. In: Environmental Contaminants in Waterfowl: Interpreting Tissue Concentrations (Beyer WJ, Heinz GH, Redmon-Norwood AW, eds.).Lewis Publishers, 251-264.
Parker SP. McGraw-Hill Encyclopedia of Chemistry, Second Edition. 1993. McGraw-Hill.

282
Patch S, Maas R, Pope J. Lead Leaching from Faucet Fixtures Under Residential Conditions. Journal of Environmental Health , 18. 1998.
People for Puget Sound. Toxic Chemicals in Puget Sound. The Impact of Mixing Zones on Permitted Discharges. 6-2-2008.
Peryea FJ. Historical use of lead arsenate insecticides, resulting contamination and implications for soil remediation. Proceedings, 16th World Congress of Soil Science . 1998.
Puget Sound Clean Air Agency. 2005 Air Quality Data Summary. 2006.
Rankin CW, Nriagu JO, Aggarwal JK, Arowolo TA, Adebayo K, Flegal AR. Lead Contamination in Cocoa and Cocoa Products: Isotopic Evidence of Global Contamination. Environmental Health Perspectives 113[No. 10], 1344-1348. 2005.
Rattner BA, Franson JC, Sheffield CI, Goddard NJ, Leonard DS, Wingate PJ. Sources and Implications of Lead Ammunition and Fishing Tackle on Natural Resources. Wildlife Society Technical Review . 2008.
Ridley-Tree Condor Preservation Act. 10-13-2007.
Root RA. Lead Loading of Urban Streets by Motor Vehicle Wheel Weights. Environmental Health Perspectives 108[No. 10], 937-940. 2000.
Rosman KJR, Chisholm W, Hong S, Candelone J-P, Boutron CF. Lead from Carthaginian & Roman Spanish Mines Isotopically Identified in Greenland Ice Dated from 600 B.C. to 300 A.D. Environ.Sci.Technol. 31[12], 3413-3416. 1997.
Rudolph L, Sharp DS, Samuels S, Perkins C, Rosenberg J. Environmental and Biological Monitoring for Lead Exposure in California Workplaces. American Journal of Public Health 80[8], 921-925. 1990.
Scelfo GM, Flegal AR. Lead in Calcium Supplements. Environmental Health Perspectives 108[No. 4], 309-313. 2000.

283
Scheuhammer AM, Money SL, Kirk DA, Donaldson G. Lead Fishing sinkers and jigs in Canada. 2003.
Scheuhammer AM, Norris SL. A review of the Environmental Impacts of Lead Shotshell Ammunition and Lead Fishing Weights in Canada. 1995.
Scheuhammer AM, Perrault JA, Routhier E, Braune BM, Campbell GD. Elevated Lead Concentrations in Edible Portions of Game Birds Harvested with Lead Shot. Environmental Pollution 102, 251-257. 12-21-1998.
Schulz J, Reitz RA, Sheriff S, Millspaugh JJ, Padding PI. Small Game Hunter Attitudes Toward Nontoxic Shot, and Crippling Rates with Nontoxic Shot. Ingestion of Spent Lead Ammunition Conference Abstracts , 66. 2008.
Schwikowski M, Barbante C, Doering T, Gaeggeler HW, Boutron C, Schotterer U, Tobler L, van de Velde K, Ferrari C, Cozzi G, Rosman K, Cescon P. Post-17th-Century Changes of European Lead Emissions Recorded in High-Altitude Alpine Snow and Ice. Environ.Sci.Technol. 38, 957-964. 2004.
Seattle Public Schools. Drinking Water Quality Report. http://www.seattleschools.org/area/ehs/drinkingwater/waterreports.htm . 2008.
Seely O. http://www.csudh.edu/oliver/chemdata/alloys.htm . 8-18-2007. 4-7-2008.
Sieg R, Sullivan KA, Parish CN. Voluntary Lead Reduction Efforst withing the Northern Arizona Range of the California Condor. Ingestion of Spent Lead Ammunition Conference Abstracts , 69. 2008.
Smith M, Davison M, Schexnider CM, Wilson L, Bohannon J, Grassley JM, Jordon M, Grue CE. Lead Shot Poisoning in Swans: Sources of Pellets within Whatcom County, WA and Sumas Prairie, B.C. Ingestion of Spent Lead Ammunition Conference Abstracts , 43. 2008.
State of California Legislative Council. HEALTH AND SAFETY CODE SECTION 25214.1-25214.4.2. 2007.
State of Massachusetts. Taking of Certain Fish. 2000. 1-14-0009.

284
State of Washington. State Fireworks Law. Chapter 70.77 RCW. 1995.
-----. Chapter 70.95N RCW Electronic product recycling. 2006.
Sunoco. Material Safety Data sheet. http://www.bazellracefuels.com/MSDS/Sunoco%20Standard%20MSDS.htm . 2008.
Sushko A. Recreational Impacts on the Environment as an Impetus to Updating Recreational Regulations in the Washington State. Int.J.of Global Environmental Issues 7[4], 288-299. 2007.
Teck Cominco. U.S. Secruities and Exchange Commission Form 40-F. 2008.
Thornton I, Rautiu R, Brush S. Lead: the Facts. 2001. IC Consultants Ltd.
Townsend T, Musson S, Jang Y-C, Chung I-H. Characterization of Lead Leachability from Cathode Ray Tudes Using the Toxicity Characteristic Leaching Procedure. Report #99-5. 1999. State Unversity System of Florida.
Toxics in Packaging Clearinghouse. Fact Sheet. 2005.
Toxics Use Reduction Institute. Five Chemicals Altrenatives Asessment Study. University of Massachusetts Lowell. 2006.
Tsuji LJ, Karagatzides JD, Katapatuk B, Young J, Kozlovic DR, Hanning RM, Nieboer E. Elevated Dentine-Lead Levels in Deciduous Teeth Collected from Remote First Nation Communities Located in the Western James Bay Region of Northern Ontario, Canada. Journal of Environmental Monitoring 3, 702-705. 2001.
Tucker E. 2007. Judge Orders Former Lead Paint Makers to Clean Up Contamination. South Coast Today.
U.S. Census Bureau. DP-4. Profile of Selected Housing Characteristics:2000. http://factfinder.census.gov/servlet/QTTable?_bm=y&-geo_id=04000US53&-qr_name=DEC_2000_SF3_U_DP4&-ds_name=DEC_2000_SF3_U . 3-4-2008. 3-4-2008.

285
U.S. Consumer Product Safety Commission. CPSC Warns of Potential Risk Associated with Certain Candles with Lead-Core Wicks. 1976.
-----. Report on Lead in Vinyl Miniblinds. 1996.
-----. CPSC Staff Report on Lead and Cadmium in Children's Polyvinyl Chloride (PVC) Products. 1997.
-----. Summary of Firework Regulations, 16 C.F.R. Part 1500 & 1507. 2001.
-----. Metal-Cored Candle Wicks Containing Lead and Canddles With Such Wicks; Notice of Proposed Rulemaking. 2002a.
-----. Requirements under the Federal Hazardous Substances Act: Labeling and Banning Requirements for Chemicals and Other Hazardous Substances. Office of Compliance. 2002b.
-----. Metal-Cored Candlewicks Contain Lead and Candles with Such Wicks. 2003.
-----. Interim Enforcement Policy for Children's Metal Jewelry Containing Lead. 2-3-2005.
-----. CPSC Staff* Analysis of Lead Content and Accessible Lead in Vinyl Baby Bibs. 2007a.
-----. CPSC Warns About Worn Vinyl Baby Bibs. 2007b.
U.S. Department of Agriculture, Food Safety and Inspection Service. Heinz Recalls Vegetable Chicken Dinner Baby Food. FSIS-98-RC-16 . 10-9-1998.
U.S. Department of Health and Human Services, Food and Drug Administration. Center for Food Safety and Applied Nutrition (CFSAN). Supporting Document for Recommended Maximum Level for Lead in Candy Likely To Be Consumed Frequently by Small Children. 2005.
U.S. Department of Health and Human Services. Toxicological Profile for Lead. 2007.

286
U.S. Department of Interior, Fish and Wildlife Service. 2006 National Survey of Fishing, Hunting, and Wildlife-Associated Recreation. U. S. Department of Commerce and U.S.Census Bureau. 2006.
U.S. Environmental Protection Agency. Economic Analysis for the Renovation, Repair and Painting Program Proposed Rule.
-----. Federal Hazardous Substances Act. 1960.
-----. Lead fishing sinkers; response to citizens' petition and proposed ban: proposed rule. Federal Register Part III, vol 40 (Part 745) , 11121-11143. 3-9-1994. 1994.
-----. EPA Takes Final Step in Phaseout of Leaded Gasoline- press release. 1-29-1996.
-----. Air Emissions from Scrap Tire Combustion. 1997.
-----. Effect of the Lead Ban on Sale of Plumbing Fixtures Containing Lead Solder. Lassovszky, Peter. 1998a.
-----. The Safe Drinking Water Act (SDWA) Lead Ban-Memorandum. Silver, Margaret B. 1998b.
-----. Emergency Planning and Community Right-to-Know Act-Section 313: Guidance for Reporting Releases and Other Waste Management Quantities of Toxic Chemicals: Lead and Lead Compounds. 2001.
-----. PBT National Action Plan for Alkyl-lead. 2002.
-----. National Air Quality an Emissions Trends Report. 2003.
-----. Lead and Copper Rule: A Quick Refernce Guide. 2004.
-----. Best Management Practices for Lead at Outdoor Shooting Ranges. 2005.

287
-----. Hazardous Waste Management System; Modification of the Hazardous Waste Program; Cathode Ray Tubes. Volume 71, Number 145, 42927-42949. 2006a. Federal Register.
-----. Technical Fact Sheet on Lead. 2006b.
-----. Commonly Asked Questions: Section 1417 of the Safe Drinking Water Act and the NSF Standard. 2007a.
-----. Elevated Lead in D.C.Drinking Water- A Study of Potential Causative Events, Final Summary. 2007b.
-----. Lead in Drinking Water-Basic Information. U.S.Environmental Protection Agency . 10-2-2007c.
-----. Waste Minimization-Lead Tire Weights. http://www.epa.gov/minimize/leadtire.htm . 10-29-2007d.
-----. EPA Rule Covers CRT Recycling In and Out of the U.S.-Press Release. Heron, Donna. 2008.
U.S. Fish and Wildlife Service. Use of lead shot for hunting migratory birds in the United States. Final Supplemental Environmental Impact Statement. 1986.
U.S. Food and Drug Administration. Guidance Document for Lead in Shellfish. 1993.
-----. Kohl, Kajal, Al-Kahl, or Surma: By Any Name, Beware of Lead Poisoning. 2003.
-----. Federal Food, Drug and Cosmetics Act. 2004.
-----. Letter to Manufacturers and Suppliers Concerning the Presence of Lead in Soft Vinyl Lunchboxes. 2006a.
-----. Total Diet Study Statistics on Element Results. 8-21-2006b.

288
U.S. Geological Survey. Apparent Consumption vs. Total Consumption-A Lead-Acid Battery Case Study. 2006.
-----. 2005 Minerals Yearbook-Lead. Gabby, Peter N. 2007a.
-----. Lead Fact Sheet. 2007b.
-----. Mineral Commodity Summary. 2008.
U.S. Government Accountability Office. LEAD POISONING: Federal Health Care Programs Are Not Effectively Reaching At-Risk Children. 1999.
-----. Drinking Water: EPA Should Strengthen Ongoing Efforts to Ensure That Consumers Are Protected from lead Contamination. 2006.
U.S. Pharmacopeia (USP). 2003. Food Chemicals Codex. 5th ed.
United Nations Environment Programme. http://www.unep.org/pcfv/PDF/MapWorldLead-June06.pdf . 2008b.
-----. http://www.unep.org/pcfv/about/dakar.asp . 2008a.
Vilomet JD, Veron A, Ambrosi JP, Moustier S, Bottero JY, Chatelet-Snidaro L. Isotopic Tracing of Landfill leachates and Pollutant Lead Mobility in Soil and Groundwater. Environ.Sci.Technol. 37[No. 20], 4586-4591. 2003.
The Vinyl Institute Stewardship Committee. Use of Metal Compound Additives in the U.S. Vinyl Processing Industry. 2007.
Warner Stained Glass. The Copper Foil Technique. 2008.
Washington State Department of Fish and Wildlife. Report to the Washington Fish and Wildlife Commission: The Use of Nontoxic Shot for Hunting in Washington. 2-12-2001.

289
-----. Shooting Ranges. http://wdfw.wa.gov/enf/huntered/shootingranges2004.pdf . 2004. 4-11-2008.
-----. HB2211 Fiscal Note. 2005.
Washington State Department of Ecology. Natural Background Soil Metals Concentrations in Washington State. 1994.
-----. The Use of Sediment Cores to Track Persistent Pollutants in Washington State. A Review. Yake, Bill. 2001.
-----. Area-Wide Soil Contamination Project Task 3.4: Preliminary Estimates. 2003.
-----. Washington Recycles: Electronics. 2007.
-----. Lead and Copper Concentrations in North Creek, Gig Harbor. 2008.
Washington State Department of Health. State/EPA Agreement: State of Washington Department of Health, Office of Drinking Water and U.S. Environmental Protection Agency. US EPA. 2005.
Two Eagles Brought to WSU Die of Lead Poisoning. http://www.vetmed.wsu.edu/features/eaglesJan08/ . 1-28-2008. 1-21-0009.
Weidenhamer J, Clement ML. 2007. Leaded electronic waste is a possible source material for lead-contaminated jewelry. Chemosphere 76.
Whittaker S. Lead Exposure in Radiator Repair Workers: A Survey of Washington State Radiator Repair Shops and Review of Occupational Lead Exposure Registry Data. Journal of Occupational and Environmental Medicine 45[7], 724-733. 2003.
Wiemeyer SN, Scott JM, Anderson MP, Bloom PH, Staffor CJ. Environmental Contaminants in California Condors. The Journal of Wildlife Management 52[2], 238-247. 1988.
Zhang Y, Griffin A, Edwards M. Nitrification in Premise Plumbing: Role of Phosphate, pH and Pipe Corrosion. Environ.Sci.Technol. 2008.