Embed Size (px)
Citation preview
110 Fifth Avenue SE, Suite 214 ● PO Box 40999 ● Olympia, WA 98504 ● 360.586.2677 ● www.wsipp.wa.gov
Washington S tate Inst i tute for Publ ic Pol icy
Preventing and Treating Youth Marijuana Use:
An Updated Review of the Evidence
Benefit-Cost & Meta-Analysis Results
October 2014
Matt Lemon
Annie Pennucci
Sean Hanley &
Steve Aos
For further information, contact:
Matt Lemon at 360.586.2744, [email protected]
W a s h i n g t o n S t a t e I n s t i t u t e f o r P u b l i c P o l i c y
The Washington State Legislature created the Washington State Institute for Public Policy in 1983. A Board of Directors—representing the legislature, the governor, and public universities—governs WSIPP and guides the development of all activities. WSIPP’s mission is to carry out practical research, at legislative direction, on issues of importance to Washington State.
The benefit-cost results in this document are current as of October 2014.
For the most up-to-date benefit-cost results, please visit our website.
http://www.wsipp.wa.gov/BenefitCost

Table of contents:
Adolescent Assertive Continuing Care…………………………….…………………………………..................3
Caring School Community (formerly Child Development Project)…………………………………...5
Case management in schools…………………….…………………………………............…….……………..……7
Communities That Care…………………….…………………………………............…….……………………….…10
Family Check-Up (also known as Positive Family Support) …….…………………………………..…12
Guiding Good Choices (formerly Preparing for the Drug Free Years)………………………….…15InShape…………………….…………………………………............…….………………………….…………………….…17
keepin’ it REAL………………………………………………………………………………………………………………..19
Life Skills Training…………………….…………………………………............…….………………………………..…21
Lions Quest Skills for Adolescence…………………………………………………………………………..….…24
Mentoring for students: community-based (with volunteer costs) …….…………………………26
Multidimensional Family Therapy (MDFT) for substance abusers…….……………………………29
Multidimensional Treatment Foster Care…………………….…………………………………....................31
Project ALERT…………………….…………………………………............…….………………………….…………..…33
Project Northland……………………………………………………………………………………………………....….35
Project STAR…………………….…………………………………............…….………………………….………………37
Project SUCCESS…………………….…………………………………............…….………………………….……..…39
Project Towards No Drug Abuse (TND) ……………………………………………………………………..…41
SPORT…………………….…………………………………............…………………….……………………………….......43
Strengthening Families for Parents and Youth 10-14…………………….…………………….............45
Teen Marijuana Check-Up…………………….…………………………………............…….…………………..…47

Adolescent Assertive Continuing Care Benefit-cost estimates updated August 2014. Literature review updated June 2013.
Program Description: This intervention was designed for youth returning to the community after residential substance abuse treatment. The aim of the intervention is to encourage youth to continue in outpatient treatment. Case workers make weekly home visits, advocate for needed services, and aid in job search and other pro-social activities.
The estimates shown are present value, life cycle benefits and costs. All dollars are expressed in the base year chosen for this analysis (2013). The economicdiscount rates and other relevant parameters are described in our technical documentation.
Benefit-Cost Summary
Program benefits Summary statistics
Participants $7,190 Benefit to cost ratio $5.09Taxpayers $3,387 Benefits minus costs $8,907Other (1) $625 Probability of a positive net present value 68 %Other (2) ($114)Total $11,089Costs ($2,181)Benefits minus cost $8,907
Detailed Monetary Benefit Estimates
Source of benefitsBenefits to
Participants Taxpayers Other (1) Other (2) Total benefits
From primary participantCrime $0 $77 $278 $38 $393Labor market earnings (alcohol abuse/dependence) $7,087 $3,023 $0 $791 $10,901Health care (alcohol abuse/dependence) $90 $287 $323 $143 $843Property loss (alcohol abuse/dependence) $13 $0 $24 $0 $37Adjustment for deadweight cost of program $0 $0 $0 ($1,086) ($1,086)
Totals $7,190 $3,387 $625 ($114) $11,089
We created the two “other” categories to report results that do not fit neatly in the “participant” or “taxpayer” perspectives. In the “Other (1)” category weinclude the benefits of reductions in crime victimization and the economic spillover benefits of improvement in human capital outcomes. In the “Other (2)”category we include estimates of the net changes in the value of a statistical life and net changes in the deadweight costs of taxation.
Detailed Cost Estimates
Annual cost Program duration Year dollars Summary statistics
Program costs $2,037 1 2008 Present value of net program costs (in 2013 dollars) ($2,181)Comparison costs $0 1 2008 Uncertainty (+ or - %) 10 %
The figures shown are estimates of the costs to implement programs in Washington. The comparison group costs reflect either no treatment or treatmentas usual, depending on how effect sizes were calculated in the meta analysis. The uncertainty range is used in Monte Carlo risk analysis, described in ourtechnical documentation.
Adolescent Assertive Continuing Care
3

Meta-Analysis of Program EffectsOutcomes measured Primary or
secondaryparticipant
No. of effectsizes
Unadjusted effect size(random effects
model)
Adjusted effect sizes and standard errors used in thebenefit-cost analysis
First time ES is estimated Second time ES is estimatedES p-value ES SE Age ES SE Age
Substance abuse Primary 1 -0.215 0.306 -0.159 0.210 16 -0.159 0.210 26Alcohol abuse or dependence Primary 1 -0.146 0.181 -0.108 0.181 16 -0.108 0.181 26Cannabis abuse or dependence Primary 1 -0.318 0.082 -0.236 0.183 16 -0.236 0.183 26
Citations Used in the Meta-AnalysisGodley, M.D., Godley, S.H., Dennis, M.L., Funk, R.R., & Passetti, L.L. (2007). Research report: The effect of assertive continuing care on continuing care
linkage, adherence and abstinence following residential treatment for adolescents with substance use disorders. Addiction, 102(1), 81-93.Godley, M., Godley, S.H., Dennis, M.L., Funk, R.R., Passetti, L.L. , Petry, N.M. (n.d.) A randomized trial of Assertive Continuing Care and Contingency
Management for adolescents with substance use disorders. Manuscript under review.
Adolescent Assertive Continuing Care
4

Caring School Community (formerly Child Development Project) Benefit-cost estimates updated August 2014. Literature review updated June 2014.
Program Description: Caring School Community, formerly called the Child Development Project, is a whole-school program aimed at promoting positive youth development. Designed for elementary schools, the program attempts to promote prosocial values, improve academic achievement, and prevent drug use, violence, and delinquency by encouraging collaboration among students, staff, and parents.Caring School Community includes four components designed to be implemented throughout the year: 1) Class Meetings, which promote communication and decision-making between teachers and students to improve the classroom climate; 2) Cross-Age Buddies, which pairs classes of younger and older students for academic and recreational activities to facilitate supportive relationships across ages; 3) Homeside Activities, which include parent-child activities completed at home that complement and reinforce the program's school components; and 4) School wide Community-Building Activities, which include a variety of activities designed to engage parents in the school environment and to link parents and their children to the greater community.
The estimates shown are present value, life cycle benefits and costs. All dollars are expressed in the base year chosen for this analysis (2013). The economicdiscount rates and other relevant parameters are described in our technical documentation.
Benefit-Cost Summary
Program benefits Summary statistics
Participants $4,696 Benefit to cost ratio $7.06Taxpayers $2,171 Benefits minus costs $7,393Other (1) $2,271 Probability of a positive net present value 62 %Other (2) ($527)Total $8,611Costs ($1,218)Benefits minus cost $7,393
Detailed Monetary Benefit Estimates
Source of benefitsBenefits to
Participants Taxpayers Other (1) Other (2) Total benefits
From primary participantCrime $0 $16 $51 $8 $75Labor market earnings (test scores) $4,714 $2,011 $2,325 $0 $9,050Property loss (alcohol abuse/dependence) $1 $0 $2 $0 $3Health care (educational attainment) ($19) $144 ($107) $71 $90Adjustment for deadweight cost of program $0 $0 $0 ($607) ($607)
Totals $4,696 $2,171 $2,271 ($527) $8,611
We created the two “other” categories to report results that do not fit neatly in the “participant” or “taxpayer” perspectives. In the “Other (1)” category weinclude the benefits of reductions in crime victimization and the economic spillover benefits of improvement in human capital outcomes. In the “Other (2)”category we include estimates of the net changes in the value of a statistical life and net changes in the deadweight costs of taxation.
Caring School Community (formerly Child Development Project)
5

Detailed Cost Estimates
Annual cost Program duration Year dollars Summary statistics
Program costs $192 7 2013 Present value of net program costs (in 2013 dollars) ($1,218)Comparison costs $0 7 2013 Uncertainty (+ or - %) 10 %
Cost data come from CSC developer (http://www.devstu.org/caring-school-community) and WA Office of Superintendent of Public Instruction.
The figures shown are estimates of the costs to implement programs in Washington. The comparison group costs reflect either no treatment or treatmentas usual, depending on how effect sizes were calculated in the meta analysis. The uncertainty range is used in Monte Carlo risk analysis, described in ourtechnical documentation.
Meta-Analysis of Program EffectsOutcomes measured Primary or
secondaryparticipant
No. of effectsizes
Unadjusted effect size(random effects
model)
Adjusted effect sizes and standard errors used in thebenefit-cost analysis
First time ES is estimated Second time ES is estimatedES p-value ES SE Age ES SE Age
Smoking before end of middleschool
Primary 1 -0.018 0.902 -0.006 0.146 13 -0.006 0.146 18
Alcohol use before end of middleschool
Primary 1 -0.178 0.221 -0.059 0.146 13 -0.059 0.146 18
Cannabis use before end of middleschool
Primary 1 -0.149 0.306 -0.049 0.146 13 -0.049 0.146 18
Test scores Primary 1 0.109 0.544 0.109 0.179 13 0.065 0.197 18High school grad via test scores Primary n/a n/a n/a 0.018 0.052 18 0.018 0.052 18
Citations Used in the Meta-AnalysisBattistich, V., Schaps, E., Watson, M., Solomon, D., & Lewis, C. (2000). Effects of the child development project on students' drug use and other problem
behaviors. Journal of Primary Prevention, 21(1), 75-99.Muñoz, M.A., & Vanderhaar, J.E. (2006). Literacy-embedded character education in a large urban district. Journal of Research in Character Education,
Caring School Community (formerly Child Development Project)
6
4(1&2), 27-44.

Case management in schools Benefit-cost estimates updated August 2014. Literature review updated June 2014.
Program Description: Case management involves placing a full-time social worker or counselor in aschool to help identify at-risk students’ needs and connect students and families with relevantservices in and outside of the K–12 system. Three such models have been evaluated and are includedin this analysis (in no particular order): Communities in Schools, City Connects, and Comer SchoolDevelopment Program. In practice, each of these models includes other services (such as extendedlearning time and educator training), but the program evaluations focus on the impact of the casemanagement component.
The estimates shown are present value, life cycle benefits and costs. All dollars are expressed in the base year chosen for this analysis (2013). The economicdiscount rates and other relevant parameters are described in our technical documentation.
Benefit-Cost Summary
Program benefits Summary statistics
Participants $2,650 Benefit to cost ratio $21.21Taxpayers $1,479 Benefits minus costs $5,005Other (1) $1,084 Probability of a positive net present value 66 %Other (2) $39Total $5,252Costs ($248)Benefits minus cost $5,005
Detailed Monetary Benefit Estimates
Source of benefitsBenefits to
Participants Taxpayers Other (1) Other (2) Total benefits
From primary participantCrime $0 $0 $0 $0 $0Labor market earnings (hs grad) $2,692 $1,148 $1,328 $0 $5,169Property loss (alcohol abuse/dependence) $0 $0 $0 $0 $0Health care (educational attainment) ($42) $331 ($244) $163 $207Adjustment for deadweight cost of program $0 $0 $0 ($123) ($123)
Totals $2,650 $1,479 $1,084 $39 $5,252
We created the two “other” categories to report results that do not fit neatly in the “participant” or “taxpayer” perspectives. In the “Other (1)” category weinclude the benefits of reductions in crime victimization and the economic spillover benefits of improvement in human capital outcomes. In the “Other (2)”category we include estimates of the net changes in the value of a statistical life and net changes in the deadweight costs of taxation.
Case management in schools
7

Detailed Cost Estimates
Annual cost Program duration Year dollars Summary statistics
Program costs $248 1 2013 Present value of net program costs (in 2013 dollars) ($248)Comparison costs $0 1 2013 Uncertainty (+ or - %) 10 %
To calculate a per-student annual cost, we use average compensation costs (including benefits) for a social worker as reported by the Office of theSuperintendent of Public Instruction, divided by the number of students in a prototypical elementary school and add per-student annual materials, supplies,and operating costs. The estimate also includes a half-hour of principal and administrative support time per week.
The figures shown are estimates of the costs to implement programs in Washington. The comparison group costs reflect either no treatment or treatmentas usual, depending on how effect sizes were calculated in the meta analysis. The uncertainty range is used in Monte Carlo risk analysis, described in ourtechnical documentation.
Meta-Analysis of Program EffectsOutcomes measured Primary or
secondaryparticipant
No. of effectsizes
Unadjusted effect size(random effects
model)
Adjusted effect sizes and standard errors used in thebenefit-cost analysis
First time ES is estimated Second time ES is estimatedES p-value ES SE Age ES SE Age
Alcohol use before end of middleschool
Primary 3 0.032 0.705 0.002 0.085 12 0.002 0.085 18
School attendance Primary 9 -0.002 0.966 -0.002 0.045 12 0.002 0.054 13Externalizing behavior symptoms Primary 1 -0.325 0.044 -0.016 0.161 12 -0.016 0.161 18Grade point average Primary 7 0.078 0.238 0.033 0.066 12 0.115 0.148 13High school graduation Primary 3 0.048 0.583 0.040 0.089 18 0.040 0.089 18Internalizing symptoms Primary 4 -0.030 0.075 -0.002 0.075 12 -0.002 0.075 18Cannabis use before end of middleschool
Primary 3 0.013 0.880 0.001 0.085 12 0.001 0.085 18
Office discipline referrals Primary 2 0.194 0.192 0.194 0.149 12 0.141 0.162 13Illicit drug use before end of middleschool
Primary 4 -0.034 0.654 -0.002 0.075 12 -0.002 0.075 18
Test scores Primary 11 0.023 0.533 0.009 0.037 12 0.007 0.041 17Smoking before end of middleschool
Primary 3 0.015 0.862 0.001 0.085 12 0.001 0.085 17
Case management in schools
8
Citations Used in the Meta-AnalysisCook, T.D., Phillips, M., Settersten, R.A., Shagle, S.C., Degirmencioglu, S.M., & Habib, F.N. (1999). Comer's School Development Program in Prince George's
County, Maryland: A theory-based evaluation. American Educational Research Journal, 36(3), 543-597.Cook, T.D., Murphy, R.F., & Hunt, H.D. (2000). Comer's school development program in Chicago: A theory-based evaluation. American Educational Research
Journal, 37(2), 535-597.ICF International. (2008). Communities in Schools National Evaluation, Volume 1: School-level report. Retrieved from
http://www.communitiesinschools.org/media/uploads/attachments/CIS_School_Level_Report_Volume_1.pdf.ICF International. (2010). Communities in Schools National Evaluation Volume 6: Randomized Controlled Trial Study, Wichita, Kansas.
Http://www.communitiesinschools.org/media/uploads/attachments/CIS_RCT_Study_Wichita_Volume_6.pdfICF International. (2010). Communities in Schools National Evaluation Volume 4: Randomized Controlled Trial Study, Jacksonville, Florida.
Http://www.communitiesinschools.org/media/uploads/attachments/CIS_RCT_Study_Jacksonville_Volume_4.pdfICF International. (2010). Communities in Schools National Evaluation Volume 5: Randomized Controlled Trial Study, Austin, Texas.
Http://www.communitiesinschools.org/media/uploads/attachments/CIS_RCT_Study_Austin_Volume_5_final.pdfWalsh, M., Foley, C., Denny, B.R., Lindsay, L., Coyle, J., & Howard, M. (2012). The impact of City Connects (Progress report 2012). Boston: Boston College
Center for Optimized Student SupportWalsh, M., Foley, C., Denny, B.R., Lindsay, L., Coyle, J., & Howard, M. (2011). The impact of City Connects (Annual report 2011). Boston: Boston College
Center for Optimized Student Support
Case management in schools
9

Communities That Care Benefit-cost estimates updated August 2014. Literature review updated April 2012.
Program Description: Communities that Care (CTC) is a coalition-based community prevention program that aims to prevent youth problem behaviors including underage drinking, tobacco use, violence, delinquency, school dropout, and substance abuse. CTC works through a community board to assess risk and protective factors among the youth in their community. The board works to implement tested and effective programs to address the issues and needs that are identified.
The estimates shown are present value, life cycle benefits and costs. All dollars are expressed in the base year chosen for this analysis (2013). The economicdiscount rates and other relevant parameters are described in our technical documentation.
Benefit-Cost Summary
Program benefits Summary statistics
Participants $862 Benefit to cost ratio $3.70Taxpayers $626 Benefits minus costs $1,505Other (1) $739 Probability of a positive net present value 85 %Other (2) ($148)Total $2,079Costs ($574)Benefits minus cost $1,505
Detailed Monetary Benefit Estimates
Source of benefitsBenefits to
Participants Taxpayers Other (1) Other (2) Total benefits
From primary participantCrime $0 $225 $683 $111 $1,019Labor market earnings (alcohol abuse/dependence) $825 $352 $0 $1 $1,178Property loss (alcohol abuse/dependence) $2 $0 $3 $0 $4Health care (illicit drug abuse/dependence) $36 $49 $53 $25 $163Adjustment for deadweight cost of program $0 $0 $0 ($285) ($285)
Totals $862 $626 $739 ($148) $2,079
We created the two “other” categories to report results that do not fit neatly in the “participant” or “taxpayer” perspectives. In the “Other (1)” category weinclude the benefits of reductions in crime victimization and the economic spillover benefits of improvement in human capital outcomes. In the “Other (2)”category we include estimates of the net changes in the value of a statistical life and net changes in the deadweight costs of taxation.
Detailed Cost Estimates
Annual cost Program duration Year dollars Summary statistics
Program costs $103 5 2004 Present value of net program costs (in 2013 dollars) ($574)Comparison costs $0 1 2004 Uncertainty (+ or - %) 35 %
Weighted average of per-child costs across twelve CtC demonstration communities. Provided by M. Kuklinski, Social Development Research Group, January2013.
The figures shown are estimates of the costs to implement programs in Washington. The comparison group costs reflect either no treatment or treatmentas usual, depending on how effect sizes were calculated in the meta analysis. The uncertainty range is used in Monte Carlo risk analysis, described in ourtechnical documentation.
Communities That Care
10

Meta-Analysis of Program EffectsOutcomes measured Primary or
secondaryparticipant
No. of effectsizes
Unadjusted effect size(random effects
model)
Adjusted effect sizes and standard errors used in thebenefit-cost analysis
First time ES is estimated Second time ES is estimatedES p-value ES SE Age ES SE Age
Crime Primary 1 -0.135 0.001 -0.051 0.042 16 -0.051 0.042 26Smoking in high school Primary 1 -0.092 0.017 -0.035 0.039 16 -0.035 0.039 26Alcohol use in high school Primary 1 -0.150 0.001 -0.057 0.045 16 -0.057 0.045 26Cannabis use in high school Primary 1 -0.041 0.291 -0.015 0.039 16 -0.015 0.039 26Illicit drug use in high school Primary 1 -0.039 0.314 -0.015 0.039 16 -0.015 0.039 26
Citations Used in the Meta-AnalysisKuklinski, M.R., Briney, J.S., Hawkins, J.D., & Catalano, R.F. (2012). Cost-benefit analysis of communities that care outcomes at eighth grade. Prevention
Science, 13(2), 150-61.
Communities That Care
11

Family Check-Up (also known as Positive Family Support) Benefit-cost estimates updated August 2014. Literature review updated June 2014.
Program Description: Positive Family Support/Family Check-Up (formerly Adolescent Transitions Program) is a three-tiered intervention implemented in middle schools.The first level is a universal component that involves the establishment of a family resource center and the implementation of a six-week prevention curriculum. The second tier is Family Check-Up, an assessment and brief motivational interview component for students identified as at-risk. The third tier is the Family Intervention Menu, which directs parents of substance-using adolescents to treatment options, parenting groups, and family therapy sessions. Our review is of the entire Positive Family Support model and not solely the second tier Family Check-Up component.
The estimates shown are present value, life cycle benefits and costs. All dollars are expressed in the base year chosen for this analysis (2013). The economicdiscount rates and other relevant parameters are described in our technical documentation.
Benefit-Cost Summary
Program benefits Summary statistics
Participants $0 Benefit to cost ratio $0.24Taxpayers $53 Benefits minus costs ($244)Other (1) $161 Probability of a positive net present value 47 %Other (2) ($135)Total $79Costs ($323)Benefits minus cost ($244)
Detailed Monetary Benefit Estimates
Source of benefitsBenefits to
Participants Taxpayers Other (1) Other (2) Total benefits
From primary participantCrime $0 $51 $154 $26 $230Property loss (alcohol abuse/dependence) $2 $0 $4 $0 $6Labor market earnings (major depression) ($3) ($1) $0 $0 ($4)Health care (major depression) $1 $3 $4 $1 $9Adjustment for deadweight cost of program $0 $0 $0 ($163) ($163)
Totals $0 $53 $161 ($135) $79
We created the two “other” categories to report results that do not fit neatly in the “participant” or “taxpayer” perspectives. In the “Other (1)” category weinclude the benefits of reductions in crime victimization and the economic spillover benefits of improvement in human capital outcomes. In the “Other (2)”category we include estimates of the net changes in the value of a statistical life and net changes in the deadweight costs of taxation.
Family Check-Up (also known as Positive Family Support)
12
Detailed Cost Estimates
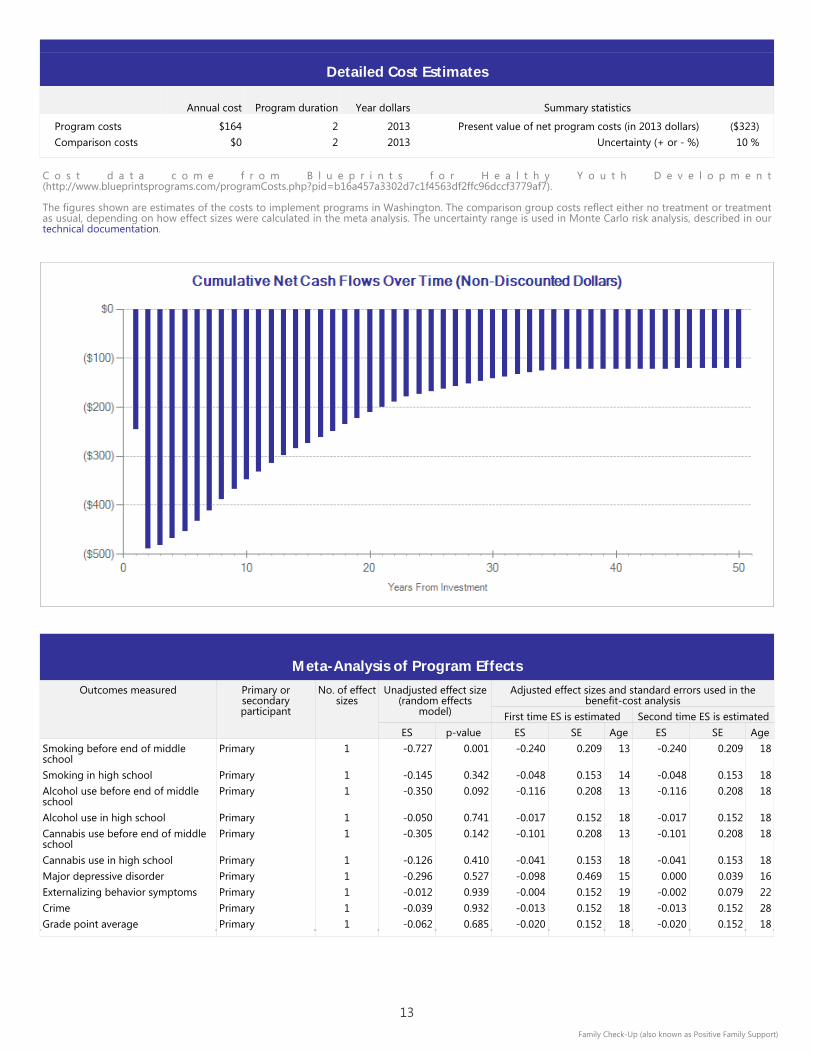
Annual cost Program duration Year dollars Summary statistics
Program costs $164 2 2013 Present value of net program costs (in 2013 dollars) ($323)Comparison costs $0 2 2013 Uncertainty (+ or - %) 10 %
C o s t d a t a c o m e f r o m B l u e p r i n t s f o r H e a l t h y Y o u t h D e v e l o p m e n t(http://www.blueprintsprograms.com/programCosts.php?pid=b16a457a3302d7c1f4563df2ffc96dccf3779af7).
The figures shown are estimates of the costs to implement programs in Washington. The comparison group costs reflect either no treatment or treatmentas usual, depending on how effect sizes were calculated in the meta analysis. The uncertainty range is used in Monte Carlo risk analysis, described in ourtechnical documentation.
Meta-Analysis of Program EffectsOutcomes measured Primary or
secondaryparticipant
No. of effectsizes
Unadjusted effect size(random effects
model)
Adjusted effect sizes and standard errors used in thebenefit-cost analysis
First time ES is estimated Second time ES is estimatedES p-value ES SE Age ES SE Age
Smoking before end of middleschool
Primary 1 -0.727 0.001 -0.240 0.209 13 -0.240 0.209 18
Smoking in high school Primary 1 -0.145 0.342 -0.048 0.153 14 -0.048 0.153 18Alcohol use before end of middleschool
Primary 1 -0.350 0.092 -0.116 0.208 13 -0.116 0.208 18
Alcohol use in high school Primary 1 -0.050 0.741 -0.017 0.152 18 -0.017 0.152 18Cannabis use before end of middleschool
Primary 1 -0.305 0.142 -0.101 0.208 13 -0.101 0.208 18
Cannabis use in high school Primary 1 -0.126 0.410 -0.041 0.153 18 -0.041 0.153 18Major depressive disorder Primary 1 -0.296 0.527 -0.098 0.469 15 0.000 0.039 16Externalizing behavior symptoms Primary 1 -0.012 0.939 -0.004 0.152 19 -0.002 0.079 22Crime Primary 1 -0.039 0.932 -0.013 0.152 18 -0.013 0.152 28Grade point average Primary 1 -0.062 0.685 -0.020 0.152 18 -0.020 0.152 18
Family Check-Up (also known as Positive Family Support)
13
Connell, A.M., & Dishion, T.J. (2008). Reducing depression among at-risk early adolescents: three-year effects of a family-centered intervention embeddedwithin schools. Journal of Family Psychology (division 43), 22(4), 574-85.
Connell, A.M., Dishion, T.J., Yasui, M., & Kavanagh, K. (2007). An adaptive approach to family intervention: linking engagement in family-centeredintervention to reductions in adolescent problem behavior. Journal of Consulting Clinical Psychology, 75, 568-579.
Stormshak, E.A., Connell, A., & Dishion, T.J. (2009). An adaptive approach to family-centered intervention in schools: Linking intervention engagement toacademic outcomes in middle and high school. Prevention Science, 10(3), 221-235.
Stormshak, E.A., Connell, A.M., Veronneau, M.H., Myers, M.W., Dishion, T.J., Kavanagh, K., & Caruthers, A.S. (2011). An ecological approach to promotingearly adolescent mental health and social adaptation: Family-centered intervention in public middle schools. Child Development, 82(1), 209-225.
Van, R.M.J., & Dishion, T.J. (2012). The impact of a family-centered intervention on the ecology of adolescent antisocial behavior: modeling developmentalsequelae and trajectories during adolescence. Development and Psychopathology, 24(3), 1139-55.
Family Check-Up (also known as Positive Family Support)
Citations Used in the Meta-Analysis
14

Guiding Good Choices (formerly Preparing for the Drug Free Years) Benefit-cost estimates updated August 2014. Literature review updated June 2014.
Program Description: Guiding Good Choices, formerly known as Preparing for the Drug-Free Years, is a skills-training program for middle school students and their parents typically implemented outside normal school hours. The five-session drug resistance and education program, implemented one night per week for five weeks, aims to improve parent-child interactions that reduce the risk for substance use initiation. Sessions typically last two hours each and include a mix of group discussions, workbook activities, role plays, and multimedia presentations. Program content includes education about the prevalence of substance use and risk and protective factors associated with use, and the development of strategies in the home to prevent use (Session 1), establishing expectations and guidelines within the home regarding substance use (Session 2), education and opportunities to practice refusal skills (Session 3), managing family conflict and constructively handling disputes between family members (Session 4), and strategies for engaging the adolescent in family activities and ways to create supportive networks among parents (Session 5). Parents are required to attend all five sessions while the adolescents is required to attend Session 3.
The estimates shown are present value, life cycle benefits and costs. All dollars are expressed in the base year chosen for this analysis (2013). The economicdiscount rates and other relevant parameters are described in our technical documentation.
Benefit-Cost Summary
Program benefits Summary statistics
Participants $1,243 Benefit to cost ratio $2.99Taxpayers $653 Benefits minus costs $1,296Other (1) $308 Probability of a positive net present value 64 %Other (2) ($253)Total $1,951Costs ($655)Benefits minus cost $1,296
Detailed Monetary Benefit Estimates
Source of benefitsBenefits to
Participants Taxpayers Other (1) Other (2) Total benefits
From primary participantCrime $0 $66 $213 $32 $311Labor market earnings (alcohol abuse/dependence) $1,180 $503 $0 $1 $1,684Property loss (alcohol abuse/dependence) $2 $0 $4 $0 $7Health care (illicit drug abuse/dependence) $61 $84 $91 $44 $279Adjustment for deadweight cost of program $0 $0 $0 ($330) ($330)
Totals $1,243 $653 $308 ($253) $1,951
We created the two “other” categories to report results that do not fit neatly in the “participant” or “taxpayer” perspectives. In the “Other (1)” category weinclude the benefits of reductions in crime victimization and the economic spillover benefits of improvement in human capital outcomes. In the “Other (2)”category we include estimates of the net changes in the value of a statistical life and net changes in the deadweight costs of taxation.
Guiding Good Choices (formerly Preparing for the Drug Free Years)
15

Detailed Cost Estimates
Annual cost Program duration Year dollars Summary statistics
Program costs $655 1 2013 Present value of net program costs (in 2013 dollars) ($655)Comparison costs $0 1 2012 Uncertainty (+ or - %) 10 %
Cost data come from Spoth, R. L., Guyll, M., & Day, S. X. (2002). Universal family-focused interventions in alcohol-use disorder prevention: Cost-effectiveness and cost-benefit analyses of two interventions. Journal of Studies on Alcohol and Drugs, 63(2), 219.
The figures shown are estimates of the costs to implement programs in Washington. The comparison group costs reflect either no treatment or treatmentas usual, depending on how effect sizes were calculated in the meta analysis. The uncertainty range is used in Monte Carlo risk analysis, described in ourtechnical documentation.
Meta-Analysis of Program EffectsOutcomes measured Primary or
secondaryparticipant
No. of effectsizes
Unadjusted effect size(random effects
model)
Adjusted effect sizes and standard errors used in thebenefit-cost analysis
First time ES is estimated Second time ES is estimatedES p-value ES SE Age ES SE Age
Alcohol use in high school Primary 1 -0.256 0.030 -0.085 0.118 16 -0.085 0.118 18Cannabis use in high school Primary 1 -0.305 0.345 -0.101 0.324 16 -0.101 0.324 18Smoking in high school Primary 1 -0.187 0.175 -0.062 0.138 16 -0.062 0.138 18Internalizing symptoms Primary 1 -0.237 0.189 -0.078 0.180 18 -0.057 0.142 20Illicit drug use in high school Primary 2 -0.082 0.619 -0.027 0.164 16 -0.027 0.164 18
Citations Used in the Meta-AnalysisMason, W.A., Kosterman, R., Hawkins, J.D., Haggerty, K.P., & Spoth, R.L. (2003). Reducing adolescents' growth in substance use and delinquency:
Randomized trial effects of a parent-training prevention intervention. Prevention Science, 4(3), 203-212.Spoth, R.L., Clair, S., Shin, C., & Redmond, C. (2006). Long-term effects of universal preventive interventions on methamphetamine use among adolescents.
Archives of Pediatrics & Adolescent Medicine, 160(9), 876-882.Spoth, R.L., Redmond, C., & Shin, C. (2001). Randomized trial of brief family interventions for general populations: Adolescent substance use outcomes 4
years following baseline. Journal of Consulting and Clinical Psychology, 69(4), 627-642.Spoth, R., Trudeau, L., Guyll, M., Shin, C., & Redmond, C. (2009). Universal intervention effects on substance use among young adults mediated by delayed
adolescent substance initiation. Journal of Consulting and Clinical Psychology, 77(4), 620-32.
Guiding Good Choices (formerly Preparing for the Drug Free Years)
16

InShape Benefit-cost estimates updated August 2014. Literature review updated June 2014.
Program Description: InShape is a college-based brief motivational interviewing intervention that aims to increase physical activity, diet, and stress management while reducing substance use through the promotion of positive self-image. The program components are typically delivered to young adults in a college health clinic setting by a designated fitness specialist. The first component includes a self-administered behavior image survey, followed by a brief (25-minute) motivational interview with the fitness specialist, and a set of recommendations to increase fitness and health through improved self-image.
The estimates shown are present value, life cycle benefits and costs. All dollars are expressed in the base year chosen for this analysis (2013). The economicdiscount rates and other relevant parameters are described in our technical documentation.
Benefit-Cost Summary
Program benefits Summary statistics
Participants ($225) Benefit to cost ratio ($21.00)Taxpayers ($90) Benefits minus costs ($324)Other (1) $25 Probability of a positive net present value 47 %Other (2) ($19)Total ($309)Costs ($15)Benefits minus cost ($324)
Detailed Monetary Benefit Estimates
Source of benefitsBenefits to
Participants Taxpayers Other (1) Other (2) Total benefits
From primary participantCrime $0 $13 $33 $6 $52Labor market earnings (smoking) ($218) ($93) $0 ($13) ($325)Health care (smoking) ($7) ($9) ($10) ($5) ($31)Property loss (alcohol abuse/dependence) $1 $0 $1 $0 $2Adjustment for deadweight cost of program $0 $0 $0 ($7) ($7)
Totals ($225) ($90) $25 ($19) ($309)
We created the two “other” categories to report results that do not fit neatly in the “participant” or “taxpayer” perspectives. In the “Other (1)” category weinclude the benefits of reductions in crime victimization and the economic spillover benefits of improvement in human capital outcomes. In the “Other (2)”category we include estimates of the net changes in the value of a statistical life and net changes in the deadweight costs of taxation.
Detailed Cost Estimates
Annual cost Program duration Year dollars Summary statistics
Program costs $15 1 2014 Present value of net program costs (in 2013 dollars) ($15)Comparison costs $0 1 2014 Uncertainty (+ or - %) 10 %
Cost data come from developer website (http://preventionpluswellness.com/programs/inshape/).
The figures shown are estimates of the costs to implement programs in Washington. The comparison group costs reflect either no treatment or treatmentas usual, depending on how effect sizes were calculated in the meta analysis. The uncertainty range is used in Monte Carlo risk analysis, described in ourtechnical documentation.
InShape
17
Meta-Analysis of Program EffectsOutcomes measured Primary or
secondaryparticipant
No. of effectsizes
Unadjusted effect size(random effects
model)
Adjusted effect sizes and standard errors used in thebenefit-cost analysis
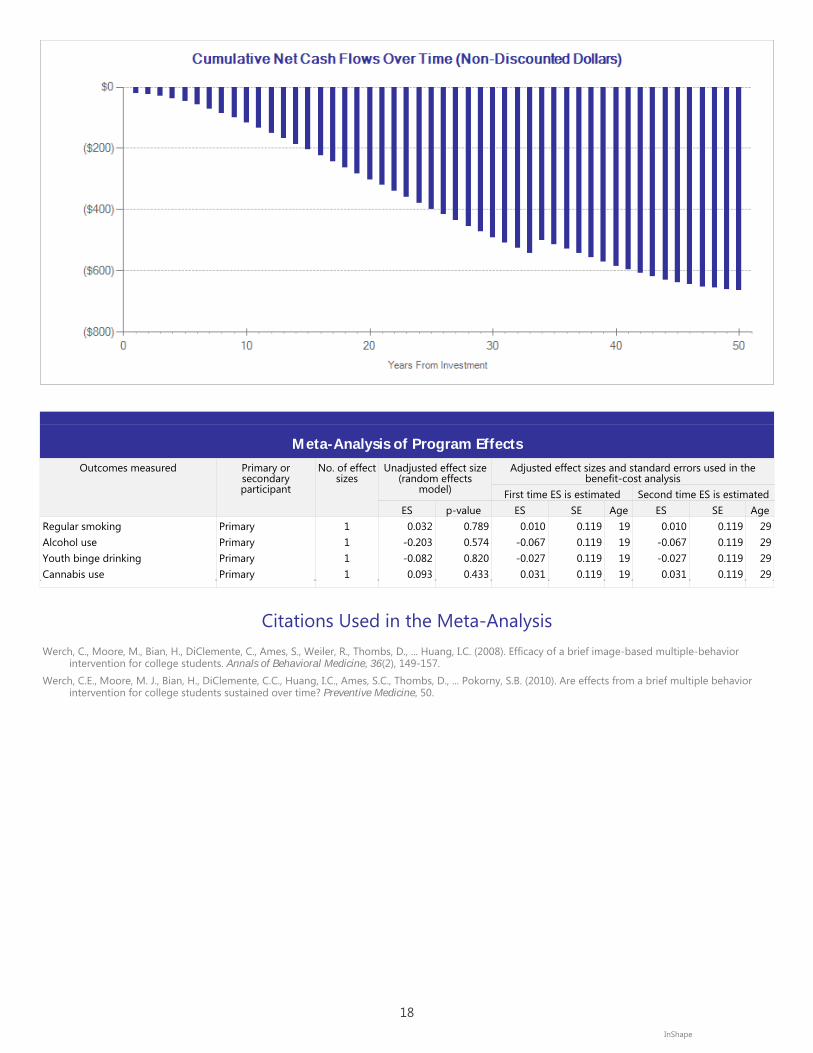
First time ES is estimated Second time ES is estimatedES p-value ES SE Age ES SE Age
Regular smoking Primary 1 0.032 0.789 0.010 0.119 19 0.010 0.119 29Alcohol use Primary 1 -0.203 0.574 -0.067 0.119 19 -0.067 0.119 29Youth binge drinking Primary 1 -0.082 0.820 -0.027 0.119 19 -0.027 0.119 29Cannabis use Primary 1 0.093 0.433 0.031 0.119 19 0.031 0.119 29
Citations Used in the Meta-AnalysisWerch, C., Moore, M., Bian, H., DiClemente, C., Ames, S., Weiler, R., Thombs, D., ... Huang, I.C. (2008). Efficacy of a brief image-based multiple-behavior
intervention for college students. Annals of Behavioral Medicine, 36(2), 149-157.Werch, C.E., Moore, M. J., Bian, H., DiClemente, C.C., Huang, I.C., Ames, S.C., Thombs, D., ... Pokorny, S.B. (2010). Are effects from a brief multiple behavior
intervention for college students sustained over time? Preventive Medicine, 50.
InShape
18

keepin' it REAL Benefit-cost estimates updated August 2014. Literature review updated June 2014.
Program Description: Keepin' it REAL is a universal school-based substance use prevention program designed in multicultural settings for middle school students. The curriculum is taught by classroom teachers in 45-minute sessions once a week for 10 weeks. Classroom sessions include group discussions, role plays, games, and five videos produced by youth designed to teach students drug resistance skills. Our review of the program is limited to the curriculum as implemented by the original developers and does not reflect the alternative implementation model used by D.A.R.E. America.
The estimates shown are present value, life cycle benefits and costs. All dollars are expressed in the base year chosen for this analysis (2013). The economicdiscount rates and other relevant parameters are described in our technical documentation.
Benefit-Cost Summary
Program benefits Summary statistics
Participants $513 Benefit to cost ratio $16.98Taxpayers $244 Benefits minus costs $765Other (1) $65 Probability of a positive net present value 73 %Other (2) ($9)Total $813Costs ($48)Benefits minus cost $765
Detailed Monetary Benefit Estimates
Source of benefitsBenefits to
Participants Taxpayers Other (1) Other (2) Total benefits
From primary participantCrime $0 $14 $46 $7 $67Labor market earnings (alcohol abuse/dependence) $504 $215 $0 $0 $719Health care (alcohol abuse/dependence) $8 $15 $17 $8 $48Property loss (alcohol abuse/dependence) $1 $0 $2 $0 $3Adjustment for deadweight cost of program $0 $0 $0 ($24) ($24)
Totals $513 $244 $65 ($9) $813
We created the two “other” categories to report results that do not fit neatly in the “participant” or “taxpayer” perspectives. In the “Other (1)” category weinclude the benefits of reductions in crime victimization and the economic spillover benefits of improvement in human capital outcomes. In the “Other (2)”category we include estimates of the net changes in the value of a statistical life and net changes in the deadweight costs of taxation.
Detailed Cost Estimates
Annual cost Program duration Year dollars Summary statistics
Program costs $48 1 2014 Present value of net program costs (in 2013 dollars) ($48)Comparison costs $0 1 2014 Uncertainty (+ or - %) 10 %
Cost data come from developer website (http://www.kir.psu.edu/curriculum/order.shtml) and personal communication with developer.
The figures shown are estimates of the costs to implement programs in Washington. The comparison group costs reflect either no treatment or treatmentas usual, depending on how effect sizes were calculated in the meta analysis. The uncertainty range is used in Monte Carlo risk analysis, described in ourtechnical documentation.
keepin' it REAL
19

Meta-Analysis of Program EffectsOutcomes measured Primary or
secondaryparticipant
No. of effectsizes
Unadjusted effect size(random effects
model)
Adjusted effect sizes and standard errors used in thebenefit-cost analysis
First time ES is estimated Second time ES is estimatedES p-value ES SE Age ES SE Age
Smoking before end of middleschool
Primary 2 -0.113 0.171 -0.037 0.083 15 -0.037 0.083 18
Alcohol use before end of middleschool
Primary 2 -0.150 0.072 -0.050 0.083 15 -0.050 0.083 18
Cannabis use before end of middleschool
Primary 1 -0.141 0.269 -0.046 0.127 15 -0.046 0.127 18
Citations Used in the Meta-AnalysisHecht, M.L., Marsiglia, F.F., Elek, E., Wagstaff, D.A., Kulis, S., Dustman, P., & Miller-Day, M. (2003). Culturally grounded substance use prevention: an
evaluation of the keepin' it R.E.A.L. curriculum. Prevention Science, 4(4), 233-48.Marsiglia, F.F., Booth, J. M., Ayers, S.L., Nuntildeo-Gutierrez, B.L., Kulis, S., & Hoffman, S. (2013). Short-term effects on substance use of the keepin' it REAL
pilot prevention program: Linguistically adapted for youth in Jalisco, Mexico. Prevention Science, 15(5), 694-704..
keepin' it REAL
20
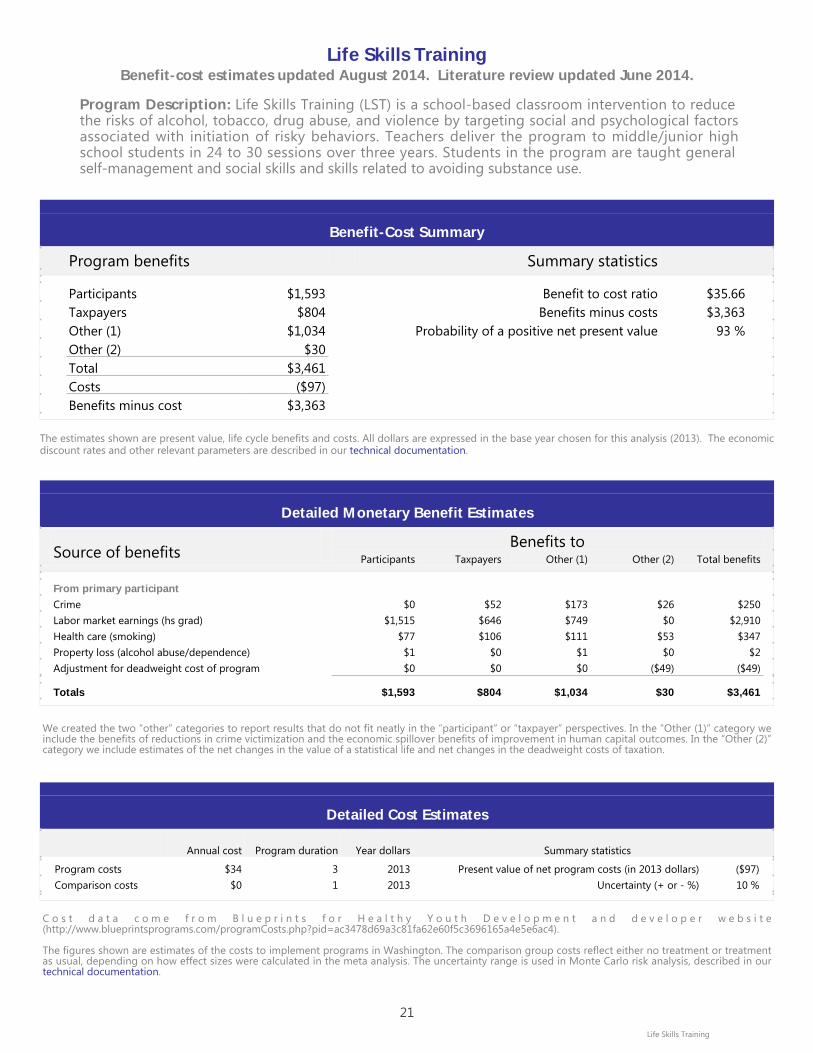
Life Skills Training Benefit-cost estimates updated August 2014. Literature review updated June 2014.
Program Description: Life Skills Training (LST) is a school-based classroom intervention to reduce the risks of alcohol, tobacco, drug abuse, and violence by targeting social and psychological factors associated with initiation of risky behaviors. Teachers deliver the program to middle/junior high school students in 24 to 30 sessions over three years. Students in the program are taught general self-management and social skills and skills related to avoiding substance use.
The estimates shown are present value, life cycle benefits and costs. All dollars are expressed in the base year chosen for this analysis (2013). The economicdiscount rates and other relevant parameters are described in our technical documentation.
Benefit-Cost Summary
Program benefits Summary statistics
Participants $1,593 Benefit to cost ratio $35.66Taxpayers $804 Benefits minus costs $3,363Other (1) $1,034 Probability of a positive net present value 93 %Other (2) $30Total $3,461Costs ($97)Benefits minus cost $3,363
Detailed Monetary Benefit Estimates
Source of benefitsBenefits to
Participants Taxpayers Other (1) Other (2) Total benefits
From primary participantCrime $0 $52 $173 $26 $250Labor market earnings (hs grad) $1,515 $646 $749 $0 $2,910Health care (smoking) $77 $106 $111 $53 $347Property loss (alcohol abuse/dependence) $1 $0 $1 $0 $2Adjustment for deadweight cost of program $0 $0 $0 ($49) ($49)
Totals $1,593 $804 $1,034 $30 $3,461
We created the two “other” categories to report results that do not fit neatly in the “participant” or “taxpayer” perspectives. In the “Other (1)” category weinclude the benefits of reductions in crime victimization and the economic spillover benefits of improvement in human capital outcomes. In the “Other (2)”category we include estimates of the net changes in the value of a statistical life and net changes in the deadweight costs of taxation.
Detailed Cost Estimates
Annual cost Program duration Year dollars Summary statistics
Program costs $34 3 2013 Present value of net program costs (in 2013 dollars) ($97)Comparison costs $0 1 2013 Uncertainty (+ or - %) 10 %
C o s t d a t a c o m e f r o m B l u e p r i n t s f o r H e a l t h y Y o u t h D e v e l o p m e n t a n d d e v e l o p e r w e b s i t e(http://www.blueprintsprograms.com/programCosts.php?pid=ac3478d69a3c81fa62e60f5c3696165a4e5e6ac4).
The figures shown are estimates of the costs to implement programs in Washington. The comparison group costs reflect either no treatment or treatmentas usual, depending on how effect sizes were calculated in the meta analysis. The uncertainty range is used in Monte Carlo risk analysis, described in ourtechnical documentation.
Life Skills Training
21
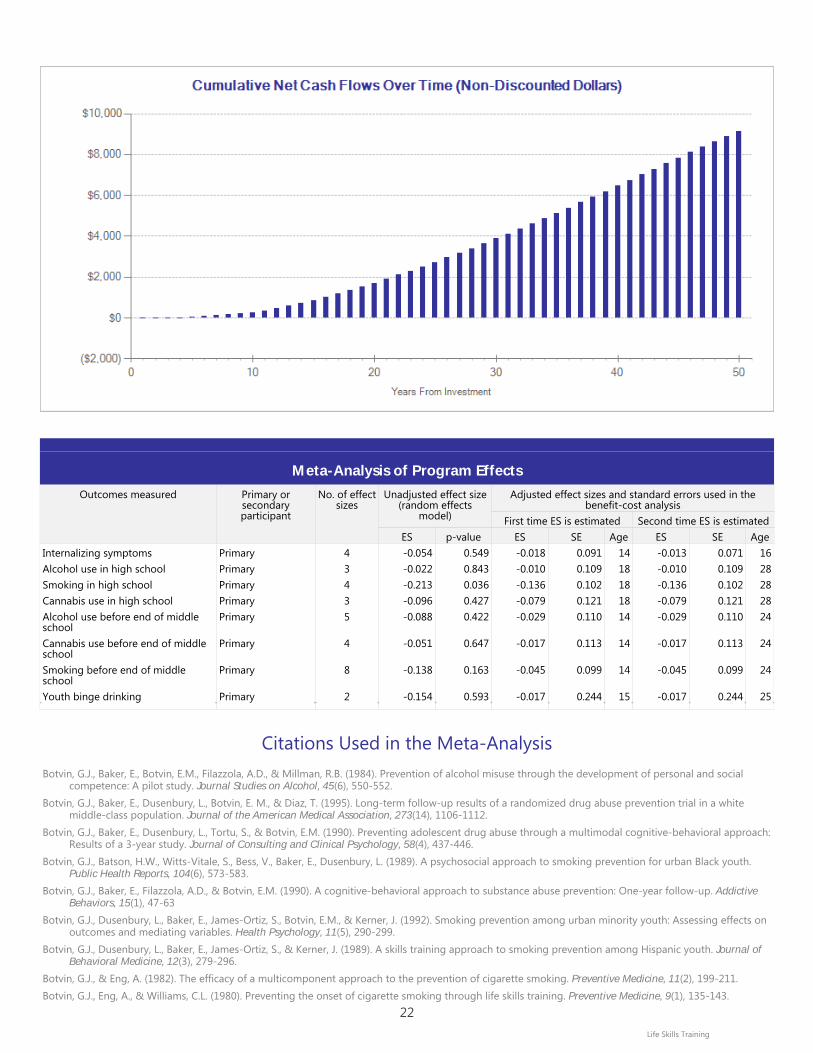
Meta-Analysis of Program EffectsOutcomes measured Primary or
secondaryparticipant
No. of effectsizes
Unadjusted effect size(random effects
model)
Adjusted effect sizes and standard errors used in thebenefit-cost analysis
First time ES is estimated Second time ES is estimatedES p-value ES SE Age ES SE Age
Internalizing symptoms Primary 4 -0.054 0.549 -0.018 0.091 14 -0.013 0.071 16Alcohol use in high school Primary 3 -0.022 0.843 -0.010 0.109 18 -0.010 0.109 28Smoking in high school Primary 4 -0.213 0.036 -0.136 0.102 18 -0.136 0.102 28Cannabis use in high school Primary 3 -0.096 0.427 -0.079 0.121 18 -0.079 0.121 28Alcohol use before end of middleschool
Primary 5 -0.088 0.422 -0.029 0.110 14 -0.029 0.110 24
Cannabis use before end of middleschool
Primary 4 -0.051 0.647 -0.017 0.113 14 -0.017 0.113 24
Smoking before end of middleschool
Primary 8 -0.138 0.163 -0.045 0.099 14 -0.045 0.099 24
Youth binge drinking Primary 2 -0.154 0.593 -0.017 0.244 15 -0.017 0.244 25
Citations Used in the Meta-AnalysisBotvin, G.J., Baker, E., Botvin, E.M., Filazzola, A.D., & Millman, R.B. (1984). Prevention of alcohol misuse through the development of personal and social
competence: A pilot study. Journal Studies on Alcohol, 45(6), 550-552.Botvin, G.J., Baker, E., Dusenbury, L., Botvin, E. M., & Diaz, T. (1995). Long-term follow-up results of a randomized drug abuse prevention trial in a white
middle-class population. Journal of the American Medical Association, 273(14), 1106-1112.Botvin, G.J., Baker, E., Dusenbury, L., Tortu, S., & Botvin, E.M. (1990). Preventing adolescent drug abuse through a multimodal cognitive-behavioral approach:
Results of a 3-year study. Journal of Consulting and Clinical Psychology, 58(4), 437-446.Botvin, G.J., Batson, H.W., Witts-Vitale, S., Bess, V., Baker, E., Dusenbury, L. (1989). A psychosocial approach to smoking prevention for urban Black youth.
Public Health Reports, 104(6), 573-583.Botvin, G.J., Baker, E., Filazzola, A.D., & Botvin, E.M. (1990). A cognitive-behavioral approach to substance abuse prevention: One-year follow-up. Addictive
Behaviors, 15(1), 47-63Botvin, G.J., Dusenbury, L., Baker, E., James-Ortiz, S., Botvin, E.M., & Kerner, J. (1992). Smoking prevention among urban minority youth: Assessing effects on
outcomes and mediating variables. Health Psychology, 11(5), 290-299.Botvin, G.J., Dusenbury, L., Baker, E., James-Ortiz, S., & Kerner, J. (1989). A skills training approach to smoking prevention among Hispanic youth. Journal of
Behavioral Medicine, 12(3), 279-296.Botvin, G.J., & Eng, A. (1982). The efficacy of a multicomponent approach to the prevention of cigarette smoking. Preventive Medicine, 11(2), 199-211.Botvin, G.J., Eng, A., & Williams, C.L. (1980). Preventing the onset of cigarette smoking through life skills training. Preventive Medicine, 9(1), 135-143.
Life Skills Training
22
Botvin, G.J., Epstein, J.A., Baker, E., Diaz, T., Ifill-Williams, M. (1997). School-based drug abuse prevention with inner-city minority youth. Journal of Child andAdolescent Substance Abuse, 6(1), 5-19.
Botvin, G.J., Griffin, K W., Diaz, T., & Ifill-Williams, M. (2001). Drug abuse prevention among minority adolescents: Posttest and one- year follow-up of aschool-based preventive intervention. Prevention Science, 2(1), 1-13.
Botvin, G.J., Griffin, K.W., Diaz, T., & Ifill-Williams, M. (2001). Preventing binge drinking during early adolescence: One- and two-year follow-up of a school-based preventive intervention. Psychology of Addictive Behaviors, 15, 360-365.
Botvin, G.J., Renick, N.L., & Baker, E. (1983). The effects of scheduling format and booster sessions on a broad spectrum psychosocial approach to smokingprevention. Journal of Behavioural Medicine, 6(4), 359-379.
Botvin, G.J., Schinke, S.P., Epstein, J.A., Diaz, T., & Botvin, E.M. (1995). Effectiveness of culturally focused and generic skills training approaches to alcohol anddrug abuse prevention among minority adolescents: Two-year follow-up results. Psychology of Addictive Behaviors, 9(3), 183-194.
Spoth, R.L., Randall, G.K., Trudeau, L., Shin, C., & Redmond, C. (2008). Substance use outcomes 5 1/2 years past baseline for partnership-based, family-school preventive interventions. Drug and Alcohol Dependence, 96(1), 57-68.
Vicary, J., Smith, E., Swisher, J., Hopkins, A., Elek, E., Bechtel, L., & Henry, K. (2006). Results of a 3-year study of two methods of delivery of life skills training.Health Education & Behavior, 33(3), 325-339.
Life Skills Training
23

Lions Quest Skills for Adolescence Benefit-cost estimates updated August 2014. Literature review updated June 2014.
Program Description: Lions Quest Skills for Adolescence is a school-based life skills education program designed for students in middle school grades. The curriculum's 45-minute sessions are designed to prevent substance use and bullying behaviors while also teaching anger and stress management skills. Although Lions Quest Skills for Adolescence typically comprises 80 or more sessions and may include whole-school components, our review is based on the 40-lesson version evaluated by Eisen et al. (2002).
The estimates shown are present value, life cycle benefits and costs. All dollars are expressed in the base year chosen for this analysis (2013). The economicdiscount rates and other relevant parameters are described in our technical documentation.
Benefit-Cost Summary
Program benefits Summary statistics
Participants $168 Benefit to cost ratio $4.88Taxpayers $89 Benefits minus costs $366Other (1) $245 Probability of a positive net present value 75 %Other (2) ($41)Total $461Costs ($95)Benefits minus cost $366
Detailed Monetary Benefit Estimates
Source of benefitsBenefits to
Participants Taxpayers Other (1) Other (2) Total benefits
From primary participantCrime $0 $26 $85 $13 $123Labor market earnings (hs grad) $353 $150 $174 $0 $677Labor market earnings (alcohol abuse/dependence) ($173) ($74) $0 $0 ($247)Health care (alcohol abuse/dependence) $6 $11 $12 $5 $34Property loss (alcohol abuse/dependence) $0 $0 $1 $0 $1Health care (illicit drug abuse/dependence) ($18) ($24) ($26) ($12) ($80)Adjustment for deadweight cost of program $0 $0 $0 ($47) ($47)
Totals $168 $89 $245 ($41) $461
We created the two “other” categories to report results that do not fit neatly in the “participant” or “taxpayer” perspectives. In the “Other (1)” category weinclude the benefits of reductions in crime victimization and the economic spillover benefits of improvement in human capital outcomes. In the “Other (2)”category we include estimates of the net changes in the value of a statistical life and net changes in the deadweight costs of taxation.
Lions Quest Skills for Adolescence
24
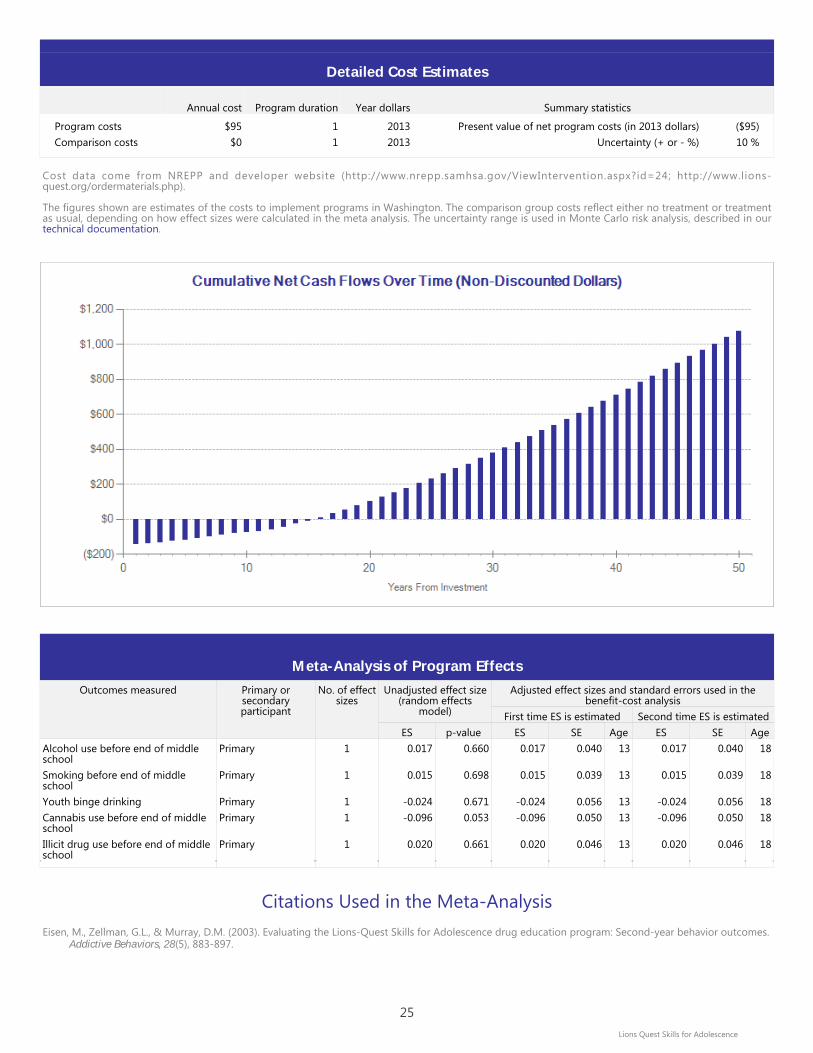
Detailed Cost Estimates
Annual cost Program duration Year dollars Summary statistics
Program costs $95 1 2013 Present value of net program costs (in 2013 dollars) ($95)Comparison costs $0 1 2013 Uncertainty (+ or - %) 10 %
Cost data come from NREPP and developer website (http://www.nrepp.samhsa.gov/ViewIntervention.aspx?id=24; http://www.lions-quest.org/ordermaterials.php).
The figures shown are estimates of the costs to implement programs in Washington. The comparison group costs reflect either no treatment or treatmentas usual, depending on how effect sizes were calculated in the meta analysis. The uncertainty range is used in Monte Carlo risk analysis, described in ourtechnical documentation.
Meta-Analysis of Program EffectsOutcomes measured Primary or
secondaryparticipant
No. of effectsizes
Unadjusted effect size(random effects
model)
Adjusted effect sizes and standard errors used in thebenefit-cost analysis
First time ES is estimated Second time ES is estimatedES p-value ES SE Age ES SE Age
Alcohol use before end of middleschool
Primary 1 0.017 0.660 0.017 0.040 13 0.017 0.040 18
Smoking before end of middleschool
Primary 1 0.015 0.698 0.015 0.039 13 0.015 0.039 18
Youth binge drinking Primary 1 -0.024 0.671 -0.024 0.056 13 -0.024 0.056 18Cannabis use before end of middleschool
Primary 1 -0.096 0.053 -0.096 0.050 13 -0.096 0.050 18
Illicit drug use before end of middleschool
Primary 1 0.020 0.661 0.020 0.046 13 0.020 0.046 18
Citations Used in the Meta-AnalysisEisen, M., Zellman, G.L., & Murray, D.M. (2003). Evaluating the Lions-Quest Skills for Adolescence drug education program: Second-year behavior outcomes.
Addictive Behaviors, 28(5), 883-897.
Lions Quest Skills for Adolescence
25

Mentoring for students: community-based (with volunteer costs) Benefit-cost estimates updated August 2014. Literature review updated June 2014.
Program Description: In community-based mentoring programs, volunteer adults are paired withat-risk middle- and high-school students to meet weekly at locations of their choosing forrelationship building and guidance. Community-based organizations provide the adult mentors withtraining and oversight. Mentors are expected to build relationships with mentees with the aim ofimproving a variety of outcomes including crime rates, academic achievement, and substance abuse.This analysis includes evaluation findings (in no particular order) for the Washington State Mentorsprogram, Big Brothers Big Sisters, Across Ages, Sponsor-a-Scholar, Career Beginnings, the BuddySystem, and other, locally developed programs.
The estimates shown are present value, life cycle benefits and costs. All dollars are expressed in the base year chosen for this analysis (2013). The economicdiscount rates and other relevant parameters are described in our technical documentation.
Benefit-Cost Summary
Program benefits Summary statistics
Participants $6,946 Benefit to cost ratio $3.36Taxpayers $3,513 Benefits minus costs $7,501Other (1) $1,587 Probability of a positive net present value 60 %Other (2) ($1,353)Total $10,694Costs ($3,193)Benefits minus cost $7,501
Detailed Monetary Benefit Estimates
Source of benefitsBenefits to
Participants Taxpayers Other (1) Other (2) Total benefits
From primary participantCrime $0 ($399) ($1,242) ($200) ($1,841)Labor market earnings (hs grad) $7,060 $3,011 $3,491 $0 $13,562Property loss (alcohol abuse/dependence) $2 $0 $3 $0 $5Health care (educational attainment) ($115) $901 ($665) $454 $575Adjustment for deadweight cost of program $0 $0 $0 ($1,607) ($1,607)
Totals $6,946 $3,513 $1,587 ($1,353) $10,694
We created the two “other” categories to report results that do not fit neatly in the “participant” or “taxpayer” perspectives. In the “Other (1)” category weinclude the benefits of reductions in crime victimization and the economic spillover benefits of improvement in human capital outcomes. In the “Other (2)”category we include estimates of the net changes in the value of a statistical life and net changes in the deadweight costs of taxation.
Mentoring for students: community-based (with volunteer costs)
26

Detailed Cost Estimates
Annual cost Program duration Year dollars Summary statistics
Program costs $2,748 1 2005 Present value of net program costs (in 2013 dollars) ($3,193)Comparison costs $0 1 2005 Uncertainty (+ or - %) 10 %
Cost estimates are based on the Big Brothers/Big Sisters program as described in Herrera, C., Grossman, J.B., Kauh, T.J., Feldman, A.F., & McMaken, J. (2007).Making a difference in schools: The Big Brothers Big Sisters school-based mentoring impact study. Philadelphia, PA: Public/Private Ventures. The cost ofvolunteer time is based on the Office of Financial Management State Data Book average adult salary for 2012 multiplied by 1.44 to account for benefits. Inthe evaluated community-based programs, mentors meet with mentees, on average, once per week over the course of one year. Cost estimates excludedonated space.
The figures shown are estimates of the costs to implement programs in Washington. The comparison group costs reflect either no treatment or treatmentas usual, depending on how effect sizes were calculated in the meta analysis. The uncertainty range is used in Monte Carlo risk analysis, described in ourtechnical documentation.
Meta-Analysis of Program EffectsOutcomes measured Primary or
secondaryparticipant
No. of effectsizes
Unadjusted effect size(random effects
model)
Adjusted effect sizes and standard errors used in thebenefit-cost analysis
First time ES is estimated Second time ES is estimatedES p-value ES SE Age ES SE Age
Grade point average Primary 5 0.095 0.027 0.077 0.043 14 0.077 0.043 17School attendance Primary 4 0.007 0.886 -0.005 0.114 14 -0.005 0.114 17High school graduation Primary 2 0.293 0.040 0.101 0.143 18 0.101 0.143 18Crime Primary 6 0.093 0.025 0.082 0.041 14 0.082 0.041 24Alcohol use before end of middleschool
Primary 1 -0.295 0.178 -0.091 0.219 14 -0.091 0.219 17
Cannabis use before end of middleschool
Primary 1 -0.179 0.412 -0.056 0.218 14 -0.056 0.218 17
Smoking in high school Primary 1 -0.212 0.343 -0.212 0.223 17 -0.212 0.223 17Illicit drug use in high school Primary 1 -0.406 0.005 -0.406 0.143 17 -0.406 0.143 17
Citations Used in the Meta-AnalysisAseltine, R.H., Dupre, M., & Lamlein, P. (2000). Mentoring as a drug prevention strategy: An evaluation of across ages. Adolescent and Family Health, 1(1),
11-20.
Mentoring for students: community-based (with volunteer costs)
27
Buman, B., & Cain, R. (1991). The impact of short term, work oriented mentoring on the employability of low-income youth. (Available from MinneapolisEmployment and Training Program, Minneapolis, MN).
Cave, G., & Quint, J. (1990). Career Beginnings impact evaluation: Findings from a program for disadvantaged high school students. New York: MDRC.Fo, W.S.O., & O'Donnell, C.R. (1979). The Buddy System: Relationship and contingency conditions in a community intervention program for youth with
nonprofessionals as behavior change agents. In J. S. Stumphauzer (Ed.), Progress in behavior therapy with delinquents (pp.302-316). Springfield, IL:Charles C. Thomas.
Grossman, J.B., & Tierney, J.P. (1998). Does mentoring work? An impact study of the Big Brothers Big Sisters program. Evaluation Review, 22(3), 403-426.Hanlon, T.E., Bateman, R.W., Simon, B.D., O'Grady, K.E., & Carswell, S.B. (2002). An early community-based intervention for the prevention of substance
abuse and other delinquent behavior. Journal of Youth and Adolescence, 31(6), 459-471.Harmon, M.A. (1996). Reducing drug use among pregnant and parenting teens: A program evaluation and theoretical examination. Dissertation Abstracts
International, 56(08), 3319A.Herrera, C., DubBois, D.L., & Grossman, J.B. (2013). The Role of Risk: Mentoring Experiences and Outcomes for Youth with Varying Risk Profiles. Philadelphia,
PA: Public/Private Ventures, MDRC.Johnson, A. (1999). Sponsor-a-Scholar: Long-term impacts of a youth mentoring program on student performance (Document No. PR99-99). Princeton, NJ:
Mathematica Policy Research.O'Donnell, C.R., Lydgate, T., & Fo, W.S.O. (1979). The Buddy System: Review and follow-up. Child Behavior Therapy, 1, 161-169.
Mentoring for students: community-based (with volunteer costs)
28
Multidimensional Family Therapy (MDFT) for substance abusers Benefit-cost estimates updated August 2014. Literature review updated December 2012.
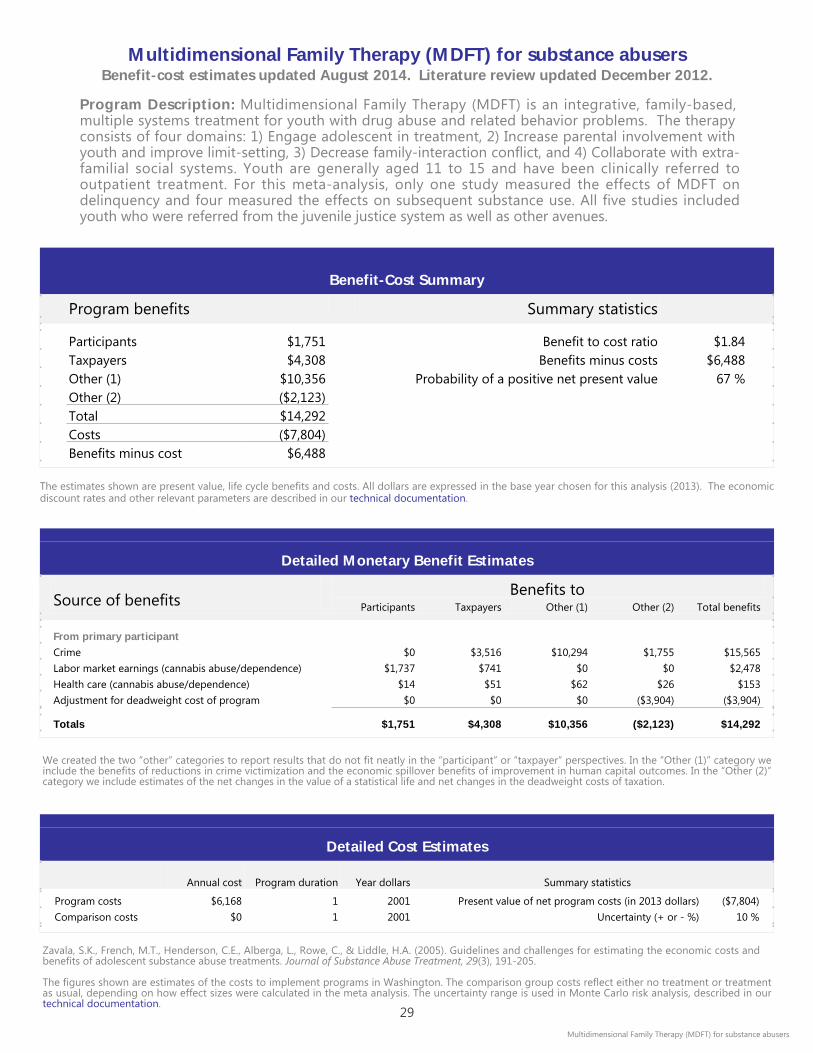
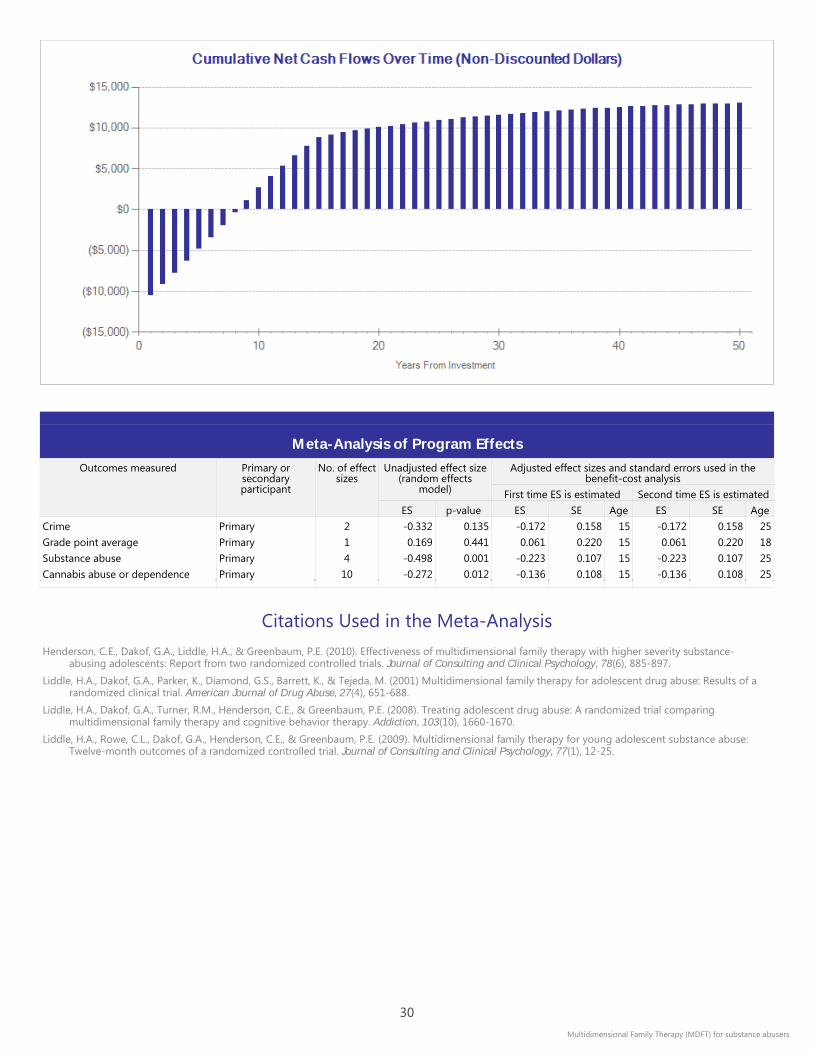
Program Description: Multidimensional Family Therapy (MDFT) is an integrative, family-based, multiple systems treatment for youth with drug abuse and related behavior problems. The therapy consists of four domains: 1) Engage adolescent in treatment, 2) Increase parental involvement with youth and improve limit-setting, 3) Decrease family-interaction conflict, and 4) Collaborate with extra-familial social systems. Youth are generally aged 11 to 15 and have been clinically referred to outpatient treatment. For this meta-analysis, only one study measured the effects of MDFT on delinquency and four measured the effects on subsequent substance use. All five studies included youth who were referred from the juvenile justice system as well as other avenues.
The estimates shown are present value, life cycle benefits and costs. All dollars are expressed in the base year chosen for this analysis (2013). The economicdiscount rates and other relevant parameters are described in our technical documentation.
Benefit-Cost Summary
Program benefits Summary statistics
Participants $1,751 Benefit to cost ratio $1.84Taxpayers $4,308 Benefits minus costs $6,488Other (1) $10,356 Probability of a positive net present value 67 %Other (2) ($2,123)Total $14,292Costs ($7,804)Benefits minus cost $6,488
Detailed Monetary Benefit Estimates
Source of benefitsBenefits to
Participants Taxpayers Other (1) Other (2) Total benefits
From primary participantCrime $0 $3,516 $10,294 $1,755 $15,565Labor market earnings (cannabis abuse/dependence) $1,737 $741 $0 $0 $2,478Health care (cannabis abuse/dependence) $14 $51 $62 $26 $153Adjustment for deadweight cost of program $0 $0 $0 ($3,904) ($3,904)
Totals $1,751 $4,308 $10,356 ($2,123) $14,292
We created the two “other” categories to report results that do not fit neatly in the “participant” or “taxpayer” perspectives. In the “Other (1)” category weinclude the benefits of reductions in crime victimization and the economic spillover benefits of improvement in human capital outcomes. In the “Other (2)”category we include estimates of the net changes in the value of a statistical life and net changes in the deadweight costs of taxation.
Detailed Cost Estimates
Annual cost Program duration Year dollars Summary statistics
Program costs $6,168 1 2001 Present value of net program costs (in 2013 dollars) ($7,804)Comparison costs $0 1 2001 Uncertainty (+ or - %) 10 %
Zavala, S.K., French, M.T., Henderson, C.E., Alberga, L., Rowe, C., & Liddle, H.A. (2005). Guidelines and challenges for estimating the economic costs and benefits of adolescent substance abuse treatments. Journal of Substance Abuse Treatment, 29(3), 191-205.
The figures shown are estimates of the costs to implement programs in Washington. The comparison group costs reflect either no treatment or treatmentas usual, depending on how effect sizes were calculated in the meta analysis. The uncertainty range is used in Monte Carlo risk analysis, described in ourtechnical documentation.
Multidimensional Family Therapy (MDFT) for substance abusers
29
Meta-Analysis of Program EffectsOutcomes measured Primary or
secondaryparticipant
No. of effectsizes
Unadjusted effect size(random effects
model)
Adjusted effect sizes and standard errors used in thebenefit-cost analysis
First time ES is estimated Second time ES is estimatedES p-value ES SE Age ES SE Age
Crime Primary 2 -0.332 0.135 -0.172 0.158 15 -0.172 0.158 25Grade point average Primary 1 0.169 0.441 0.061 0.220 15 0.061 0.220 18Substance abuse Primary 4 -0.498 0.001 -0.223 0.107 15 -0.223 0.107 25Cannabis abuse or dependence Primary 10 -0.272 0.012 -0.136 0.108 15 -0.136 0.108 25
Citations Used in the Meta-AnalysisHenderson, C.E., Dakof, G.A., Liddle, H.A., & Greenbaum, P.E. (2010). Effectiveness of multidimensional family therapy with higher severity substance-
abusing adolescents: Report from two randomized controlled trials. Journal of Consulting and Clinical Psychology, 78(6), 885-897.Liddle, H.A., Dakof, G.A., Parker, K., Diamond, G.S., Barrett, K., & Tejeda, M. (2001) Multidimensional family therapy for adolescent drug abuse: Results of a
randomized clinical trial. American Journal of Drug Abuse, 27(4), 651-688.Liddle, H.A., Dakof, G.A., Turner, R.M., Henderson, C.E., & Greenbaum, P.E. (2008). Treating adolescent drug abuse: A randomized trial comparing
multidimensional family therapy and cognitive behavior therapy. Addiction, 103(10), 1660-1670.Liddle, H.A., Rowe, C.L., Dakof, G.A., Henderson, C.E., & Greenbaum, P.E. (2009). Multidimensional family therapy for young adolescent substance abuse:
Twelve-month outcomes of a randomized controlled trial. Journal of Consulting and Clinical Psychology, 77(1), 12-25.
Multidimensional Family Therapy (MDFT) for substance abusers
30
Multidimensional Treatment Foster Care Benefit-cost estimates updated August 2014. Literature review updated June 2014.
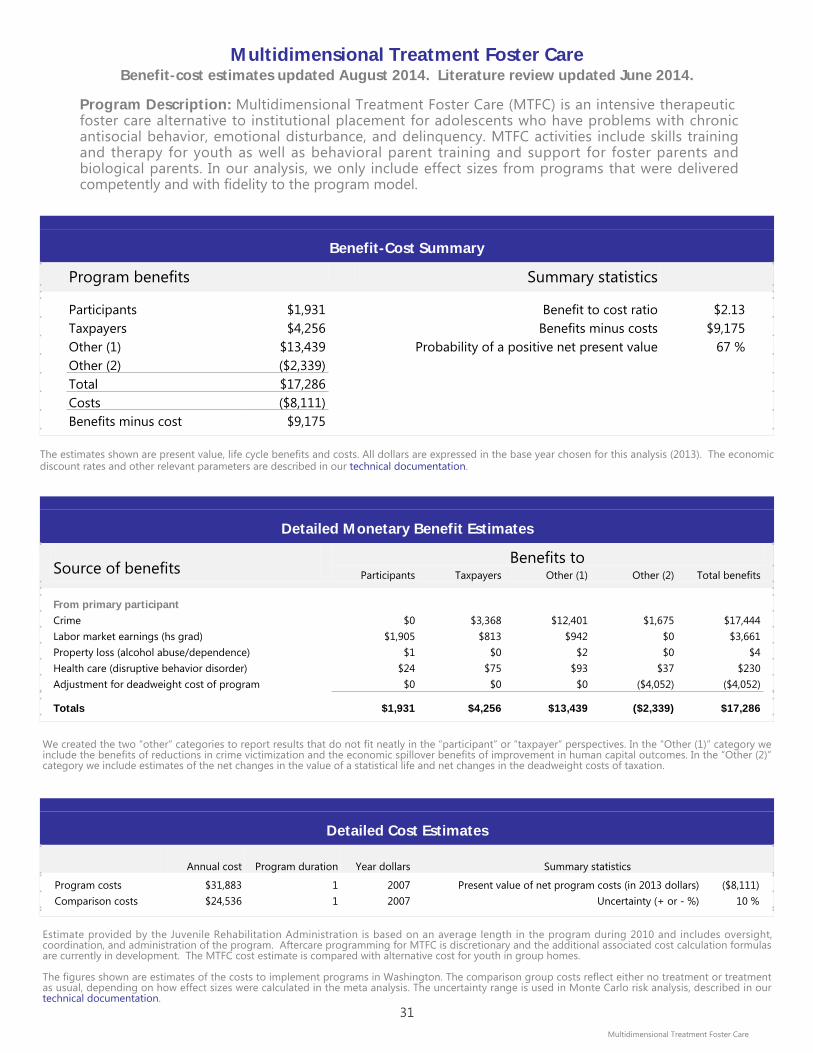
Program Description: Multidimensional Treatment Foster Care (MTFC) is an intensive therapeutic foster care alternative to institutional placement for adolescents who have problems with chronic antisocial behavior, emotional disturbance, and delinquency. MTFC activities include skills training and therapy for youth as well as behavioral parent training and support for foster parents and biological parents. In our analysis, we only include effect sizes from programs that were delivered competently and with fidelity to the program model.
The estimates shown are present value, life cycle benefits and costs. All dollars are expressed in the base year chosen for this analysis (2013). The economicdiscount rates and other relevant parameters are described in our technical documentation.
Benefit-Cost Summary
Program benefits Summary statistics
Participants $1,931 Benefit to cost ratio $2.13Taxpayers $4,256 Benefits minus costs $9,175Other (1) $13,439 Probability of a positive net present value 67 %Other (2) ($2,339)Total $17,286Costs ($8,111)Benefits minus cost $9,175
Detailed Monetary Benefit Estimates
Source of benefitsBenefits to
Participants Taxpayers Other (1) Other (2) Total benefits
From primary participantCrime $0 $3,368 $12,401 $1,675 $17,444Labor market earnings (hs grad) $1,905 $813 $942 $0 $3,661Property loss (alcohol abuse/dependence) $1 $0 $2 $0 $4Health care (disruptive behavior disorder) $24 $75 $93 $37 $230Adjustment for deadweight cost of program $0 $0 $0 ($4,052) ($4,052)
Totals $1,931 $4,256 $13,439 ($2,339) $17,286
We created the two “other” categories to report results that do not fit neatly in the “participant” or “taxpayer” perspectives. In the “Other (1)” category weinclude the benefits of reductions in crime victimization and the economic spillover benefits of improvement in human capital outcomes. In the “Other (2)”category we include estimates of the net changes in the value of a statistical life and net changes in the deadweight costs of taxation.
Detailed Cost Estimates
Annual cost Program duration Year dollars Summary statistics
Program costs $31,883 1 2007 Present value of net program costs (in 2013 dollars) ($8,111)Comparison costs $24,536 1 2007 Uncertainty (+ or - %) 10 %
Estimate provided by the Juvenile Rehabilitation Administration is based on an average length in the program during 2010 and includes oversight,coordination, and administration of the program. Aftercare programming for MTFC is discretionary and the additional associated cost calculation formulasare currently in development. The MTFC cost estimate is compared with alternative cost for youth in group homes.
The figures shown are estimates of the costs to implement programs in Washington. The comparison group costs reflect either no treatment or treatmentas usual, depending on how effect sizes were calculated in the meta analysis. The uncertainty range is used in Monte Carlo risk analysis, described in ourtechnical documentation.
Multidimensional Treatment Foster Care
31

Meta-Analysis of Program EffectsOutcomes measured Primary or
secondaryparticipant
No. of effectsizes
Unadjusted effect size(random effects
model)
Adjusted effect sizes and standard errors used in thebenefit-cost analysis
First time ES is estimated Second time ES is estimatedES p-value ES SE Age ES SE Age
Crime Primary 3 -0.544 0.015 -0.111 0.127 17 -0.111 0.127 27Teen pregnancy (under age 18) Primary 1 -0.469 0.001 -0.352 0.028 17 -0.352 0.028 19Smoking in high school Primary 1 -0.190 0.429 -0.068 0.240 17 -0.068 0.240 18Alcohol use in high school Primary 1 -0.126 0.601 -0.045 0.240 17 -0.045 0.240 18Cannabis use in high school Primary 1 -0.230 0.015 -0.083 0.240 17 -0.083 0.240 18Illicit drug use in high school Primary 1 -0.261 0.279 -0.094 0.240 17 -0.094 0.240 18Internalizing symptoms Primary 1 -0.428 0.216 -0.428 0.346 17 -0.312 0.296 19Externalizing behavior symptoms Primary 1 -0.627 0.073 -0.627 0.350 17 -0.299 0.221 20
Citations Used in the Meta-AnalysisRhoades, K.A., Leve, L.D., Harold, G.T., Kim, H.K., & Chamberlain, P. (2014). Drug use trajectories after a randomized controlled trial of MTFC: Associations
with partner drug use. Journal of Research on Adolescence, 24(1), 40-54.Smith, D.K., Chamberlain, P., & Eddy, J.M. (2010). Preliminary support for multidimensional treatment foster care in reducing substance use in delinquent
boys. Journal of Child & Adolescent Substance Abuse, 19(4), 343-358.Westermark, P.K., Hansson, K., & Olsson, M. (2011). Multidimensional treatment foster care (MTFC): Results from an independent replication. Journal of
Family Therapy, 33(1), 20-41.
Multidimensional Treatment Foster Care
32

Project ALERT Benefit-cost estimates updated August 2014. Literature review updated July 2014.
Program Description: Project ALERT is a middle/junior high school-based program to prevent tobacco, alcohol, and marijuana use. Over 11 sessions in the 7th grade and three boosters in the 8th grade, the program helps students understand that most people do not use drugs and teaches them to identify and resist the internal and social pressures that encourage substance use.
The estimates shown are present value, life cycle benefits and costs. All dollars are expressed in the base year chosen for this analysis (2013). The economicdiscount rates and other relevant parameters are described in our technical documentation.
Benefit-Cost Summary
Program benefits Summary statistics
Participants $248 Benefit to cost ratio $2.25Taxpayers $119 Benefits minus costs $184Other (1) $30 Probability of a positive net present value 55 %Other (2) ($65)Total $331Costs ($147)Benefits minus cost $184
Detailed Monetary Benefit Estimates
Source of benefitsBenefits to
Participants Taxpayers Other (1) Other (2) Total benefits
From primary participantCrime $0 $5 $16 $2 $23Health care (smoking) $9 $12 $13 $6 $41Labor market earnings (alcohol abuse/dependence) $238 $102 $0 $0 $340Property loss (alcohol abuse/dependence) $0 $0 $1 $0 $1Adjustment for deadweight cost of program $0 $0 $0 ($74) ($74)
Totals $248 $119 $30 ($65) $331
We created the two “other” categories to report results that do not fit neatly in the “participant” or “taxpayer” perspectives. In the “Other (1)” category weinclude the benefits of reductions in crime victimization and the economic spillover benefits of improvement in human capital outcomes. In the “Other (2)”category we include estimates of the net changes in the value of a statistical life and net changes in the deadweight costs of taxation.
Detailed Cost Estimates
Annual cost Program duration Year dollars Summary statistics
Program costs $60 2 2002 Present value of net program costs (in 2013 dollars) ($147)Comparison costs $0 2 2002 Uncertainty (+ or - %) 10 %
$120 in 2002 dollars (Miller and Hendrie 2005)
The figures shown are estimates of the costs to implement programs in Washington. The comparison group costs reflect either no treatment or treatmentas usual, depending on how effect sizes were calculated in the meta analysis. The uncertainty range is used in Monte Carlo risk analysis, described in ourtechnical documentation.
Project ALERT
33

Meta-Analysis of Program EffectsOutcomes measured Primary or
secondaryparticipant
No. of effectsizes
Unadjusted effect size(random effects
model)
Adjusted effect sizes and standard errors used in thebenefit-cost analysis
First time ES is estimated Second time ES is estimatedES p-value ES SE Age ES SE Age
Alcohol use in high school Primary 4 -0.035 0.465 -0.016 0.047 15 -0.016 0.047 25Smoking in high school Primary 4 -0.048 0.200 -0.015 0.038 15 -0.015 0.038 25Cannabis use in high school Primary 4 -0.045 0.677 -0.007 0.108 15 -0.007 0.108 25
Citations Used in the Meta-AnalysisBell, R.M., Ellickson, P.L., & Harrison, E.R. (1993). Do drug prevention effects persist into high school? How Project ALERT did with ninth graders. Preventive
Medicine, 22(4), 463-483.Ellickson, P.L., McCaffrey, D.F., Ghosh-Dastidar, B., & Longshore, D.L. (2003). New inroads in preventing adolescent drug use: Results from a large-scale
trial of Project ALERT in middle schools. American Journal of Public Health, 93(11), 1830-1836.Ringwalt, C.L., Clark, H K., Hanley, S., Shamblen, S.R., Flewelling, R.L. (2009). Project ALERT: A cluster randomized trial. Archives of Pediatrics and Adolescent
Medicine, 163(7), 625-632.St Pierre, T.L., Osgood, D.W., Mincemoyer, C C., Kaltreider, D.L., & Kauh, T.J. (2005). Results of an independent evaluation of Project ALERT delivered in
schools by cooperative extension. Prevention Science, 6(4), 305-317.
Project ALERT
34
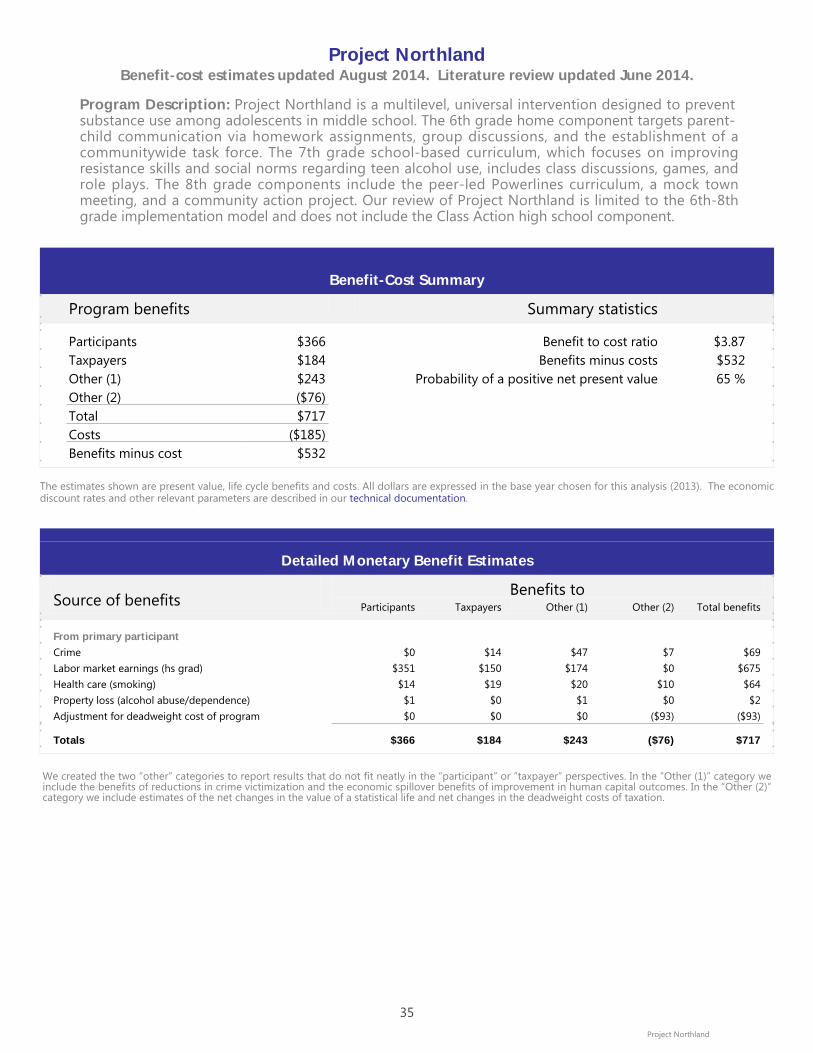
Project Northland Benefit-cost estimates updated August 2014. Literature review updated June 2014.
Program Description: Project Northland is a multilevel, universal intervention designed to prevent substance use among adolescents in middle school. The 6th grade home component targets parent-child communication via homework assignments, group discussions, and the establishment of a communitywide task force. The 7th grade school-based curriculum, which focuses on improving resistance skills and social norms regarding teen alcohol use, includes class discussions, games, and role plays. The 8th grade components include the peer-led Powerlines curriculum, a mock town meeting, and a community action project. Our review of Project Northland is limited to the 6th-8th grade implementation model and does not include the Class Action high school component.
The estimates shown are present value, life cycle benefits and costs. All dollars are expressed in the base year chosen for this analysis (2013). The economicdiscount rates and other relevant parameters are described in our technical documentation.
Benefit-Cost Summary
Program benefits Summary statistics
Participants $366 Benefit to cost ratio $3.87Taxpayers $184 Benefits minus costs $532Other (1) $243 Probability of a positive net present value 65 %Other (2) ($76)Total $717Costs ($185)Benefits minus cost $532
Detailed Monetary Benefit Estimates
Source of benefitsBenefits to
Participants Taxpayers Other (1) Other (2) Total benefits
From primary participantCrime $0 $14 $47 $7 $69Labor market earnings (hs grad) $351 $150 $174 $0 $675Health care (smoking) $14 $19 $20 $10 $64Property loss (alcohol abuse/dependence) $1 $0 $1 $0 $2Adjustment for deadweight cost of program $0 $0 $0 ($93) ($93)
Totals $366 $184 $243 ($76) $717
We created the two “other” categories to report results that do not fit neatly in the “participant” or “taxpayer” perspectives. In the “Other (1)” category weinclude the benefits of reductions in crime victimization and the economic spillover benefits of improvement in human capital outcomes. In the “Other (2)”category we include estimates of the net changes in the value of a statistical life and net changes in the deadweight costs of taxation.
Project Northland
35
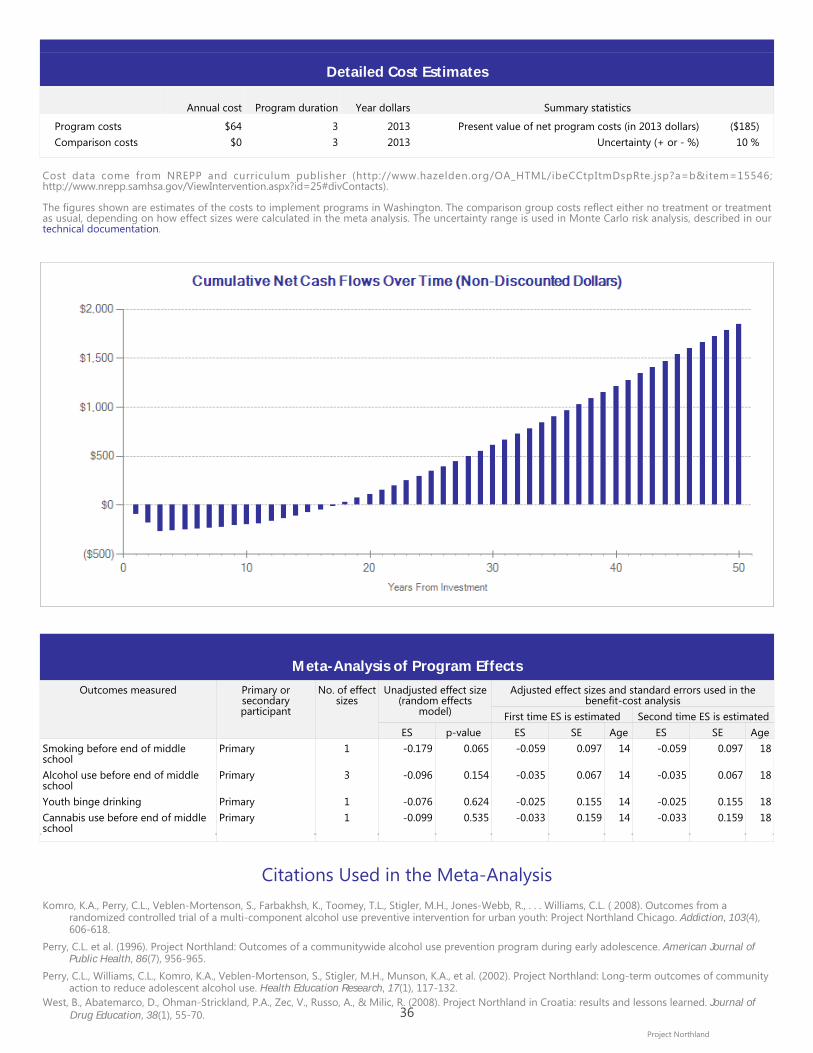
Detailed Cost Estimates
Annual cost Program duration Year dollars Summary statistics
Program costs $64 3 2013 Present value of net program costs (in 2013 dollars) ($185)Comparison costs $0 3 2013 Uncertainty (+ or - %) 10 %
Cost data come from NREPP and curriculum publisher (http://www.hazelden.org/OA_HTML/ibeCCtpItmDspRte.jsp?a=b&item=15546;http://www.nrepp.samhsa.gov/ViewIntervention.aspx?id=25#divContacts).
The figures shown are estimates of the costs to implement programs in Washington. The comparison group costs reflect either no treatment or treatmentas usual, depending on how effect sizes were calculated in the meta analysis. The uncertainty range is used in Monte Carlo risk analysis, described in ourtechnical documentation.
Meta-Analysis of Program EffectsOutcomes measured Primary or
secondaryparticipant
No. of effectsizes
Unadjusted effect size(random effects
model)
Adjusted effect sizes and standard errors used in thebenefit-cost analysis
First time ES is estimated Second time ES is estimatedES p-value ES SE Age ES SE Age
Smoking before end of middleschool
Primary 1 -0.179 0.065 -0.059 0.097 14 -0.059 0.097 18
Alcohol use before end of middleschool
Primary 3 -0.096 0.154 -0.035 0.067 14 -0.035 0.067 18
Youth binge drinking Primary 1 -0.076 0.624 -0.025 0.155 14 -0.025 0.155 18Cannabis use before end of middleschool
Primary 1 -0.099 0.535 -0.033 0.159 14 -0.033 0.159 18
Citations Used in the Meta-AnalysisKomro, K.A., Perry, C.L., Veblen-Mortenson, S., Farbakhsh, K., Toomey, T.L., Stigler, M.H., Jones-Webb, R., . . . Williams, C.L. ( 2008). Outcomes from a
randomized controlled trial of a multi-component alcohol use preventive intervention for urban youth: Project Northland Chicago. Addiction, 103(4),606-618.
Perry, C.L. et al. (1996). Project Northland: Outcomes of a communitywide alcohol use prevention program during early adolescence. American Journal ofPublic Health, 86(7), 956-965.
Perry, C.L., Williams, C.L., Komro, K.A., Veblen-Mortenson, S., Stigler, M.H., Munson, K.A., et al. (2002). Project Northland: Long-term outcomes of communityaction to reduce adolescent alcohol use. Health Education Research, 17(1), 117-132.
Project Northland
West, B., Abatemarco, D., Ohman-Strickland, P.A., Zec, V., Russo, A., & Milic, R. (2008). Project Northland in Croatia: results and lessons learned. Journal ofDrug Education, 38(1), 55-70. 36

Project STAR Benefit-cost estimates updated August 2014. Literature review updated July 2014.
Program Description: Also known as the Midwestern Prevention Project, Project STAR is a multi-component prevention program with the goal of reducing adolescent tobacco, alcohol, andmarijuana use. The program consists of a 6th- and 7th-grade intervention supported by parent,community, and mass media components addressing the multiple influences of substance use.
The estimates shown are present value, life cycle benefits and costs. All dollars are expressed in the base year chosen for this analysis (2013). The economicdiscount rates and other relevant parameters are described in our technical documentation.
Benefit-Cost Summary
Program benefits Summary statistics
Participants $1,722 Benefit to cost ratio $7.86Taxpayers $941 Benefits minus costs $3,418Other (1) $1,383 Probability of a positive net present value 84 %Other (2) ($129)Total $3,917Costs ($499)Benefits minus cost $3,418
Detailed Monetary Benefit Estimates
Source of benefitsBenefits to
Participants Taxpayers Other (1) Other (2) Total benefits
From primary participantCrime $0 $136 $456 $68 $659Labor market earnings (hs grad) $1,644 $701 $813 $0 $3,158Health care (smoking) $76 $104 $109 $52 $340Property loss (alcohol abuse/dependence) $3 $0 $6 $0 $9Adjustment for deadweight cost of program $0 $0 $0 ($248) ($248)
Totals $1,722 $941 $1,383 ($129) $3,917
We created the two “other” categories to report results that do not fit neatly in the “participant” or “taxpayer” perspectives. In the “Other (1)” category weinclude the benefits of reductions in crime victimization and the economic spillover benefits of improvement in human capital outcomes. In the “Other (2)”category we include estimates of the net changes in the value of a statistical life and net changes in the deadweight costs of taxation.
Detailed Cost Estimates
Annual cost Program duration Year dollars Summary statistics
Program costs $400 1 2002 Present value of net program costs (in 2013 dollars) ($499)Comparison costs $0 1 2002 Uncertainty (+ or - %) 10 %
$400 per pupil (Miller and Hendrie 2005).
The figures shown are estimates of the costs to implement programs in Washington. The comparison group costs reflect either no treatment or treatmentas usual, depending on how effect sizes were calculated in the meta analysis. The uncertainty range is used in Monte Carlo risk analysis, described in ourtechnical documentation.
Project STAR
37

Meta-Analysis of Program EffectsOutcomes measured Primary or
secondaryparticipant
No. of effectsizes
Unadjusted effect size(random effects
model)
Adjusted effect sizes and standard errors used in thebenefit-cost analysis
First time ES is estimated Second time ES is estimatedES p-value ES SE Age ES SE Age
Alcohol use in high school Primary 2 -0.323 0.025 -0.107 0.144 15 -0.107 0.144 25Cannabis use in high school Primary 2 -0.667 0.003 -0.220 0.225 15 -0.220 0.225 25Smoking in high school Primary 2 -0.401 0.006 -0.132 0.145 15 -0.132 0.145 25
Citations Used in the Meta-AnalysisChou, C.P., Montgomery, S., Pentz, M.A., Rohrbach, L.A., Johnson, C.A., Flay, B.R., & MacKinnon, D.P. (1998). Effects of a community-based prevention
program on decreasing drug use in high-risk adolescents. American Journal of Public Health, 88(6), 944-948.Pentz, M.A., Dwyer, J.H., MacKinnon, D.P., Flay, B.R., Hansen, W.B., Wang, E.Y., Johnson, C.A. (1989). A multicommunity trial for primary prevention of
adolescent drug abuse: Effects on drug use prevalence. JAMA, 261(22), 3259
Project STAR
38

Project SUCCESS Benefit-cost estimates updated August 2014. Literature review updated August 2014.
Program Description: Project SUCCESS is a school-based prevention program that focuses on high-risk youth. The program’s four components include: 1) prevention education provided in small groups by a professional counselor; 2) individual and group counseling; 3) communications with parents; and 4) referrals to community agencies. A program counselor is situated in the school throughout the academic year.
The estimates shown are present value, life cycle benefits and costs. All dollars are expressed in the base year chosen for this analysis (2013). The economicdiscount rates and other relevant parameters are described in our technical documentation.
Benefit-Cost Summary
Program benefits Summary statistics
Participants $45 Benefit to cost ratio ($1.35)Taxpayers ($20) Benefits minus costs ($364)Other (1) ($140) Probability of a positive net present value 46 %Other (2) ($95)Total ($209)Costs ($155)Benefits minus cost ($364)
Detailed Monetary Benefit Estimates
Source of benefitsBenefits to
Participants Taxpayers Other (1) Other (2) Total benefits
From primary participantCrime $0 ($41) ($141) ($21) ($203)Labor market earnings (smoking) $45 $19 $0 $3 $66Health care (smoking) $1 $2 $3 $1 $7Property loss (alcohol abuse/dependence) ($1) $0 ($1) $0 ($2)Adjustment for deadweight cost of program $0 $0 $0 ($77) ($77)
Totals $45 ($20) ($140) ($95) ($209)
We created the two “other” categories to report results that do not fit neatly in the “participant” or “taxpayer” perspectives. In the “Other (1)” category weinclude the benefits of reductions in crime victimization and the economic spillover benefits of improvement in human capital outcomes. In the “Other (2)”category we include estimates of the net changes in the value of a statistical life and net changes in the deadweight costs of taxation.
Detailed Cost Estimates
Annual cost Program duration Year dollars Summary statistics
Program costs $155 1 2013 Present value of net program costs (in 2013 dollars) ($155)Comparison costs $0 1 2013 Uncertainty (+ or - %) 10 %
To calculate a per-student annual cost, we use average compensation costs (including benefits) for a counselor as reported by the Office of theSuperintendent of Public Instruction, divided by the number of students in a prototypical high school. The estimate also includes training costs available atthe developer’s website (http://www.sascorp.org/CurrentFiles/SUCCESS_Order_Form.pdf).
The figures shown are estimates of the costs to implement programs in Washington. The comparison group costs reflect either no treatment or treatmentas usual, depending on how effect sizes were calculated in the meta analysis. The uncertainty range is used in Monte Carlo risk analysis, described in ourtechnical documentation.
Project SUCCESS
39
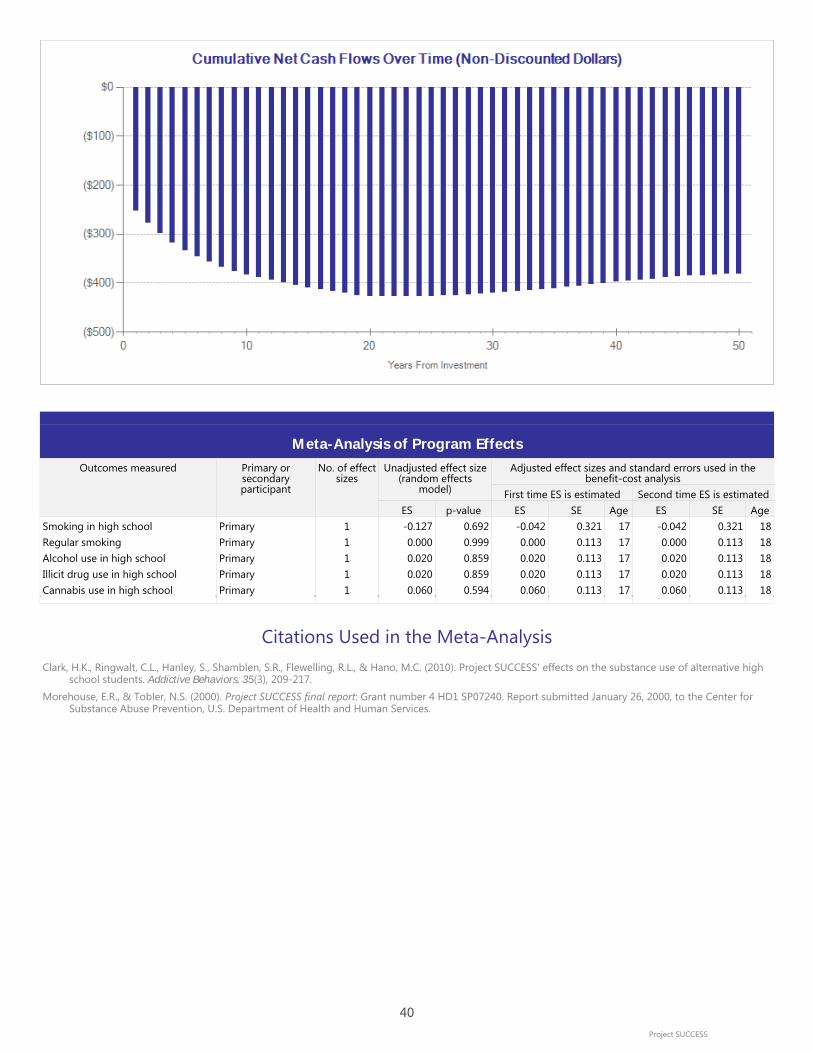
Meta-Analysis of Program EffectsOutcomes measured Primary or
secondaryparticipant
No. of effectsizes
Unadjusted effect size(random effects
model)
Adjusted effect sizes and standard errors used in thebenefit-cost analysis
First time ES is estimated Second time ES is estimatedES p-value ES SE Age ES SE Age
Smoking in high school Primary 1 -0.127 0.692 -0.042 0.321 17 -0.042 0.321 18Regular smoking Primary 1 0.000 0.999 0.000 0.113 17 0.000 0.113 18Alcohol use in high school Primary 1 0.020 0.859 0.020 0.113 17 0.020 0.113 18Illicit drug use in high school Primary 1 0.020 0.859 0.020 0.113 17 0.020 0.113 18Cannabis use in high school Primary 1 0.060 0.594 0.060 0.113 17 0.060 0.113 18
Citations Used in the Meta-AnalysisClark, H.K., Ringwalt, C.L., Hanley, S., Shamblen, S.R., Flewelling, R.L., & Hano, M.C. (2010). Project SUCCESS' effects on the substance use of alternative high
school students. Addictive Behaviors, 35(3), 209-217.Morehouse, E.R., & Tobler, N.S. (2000). Project SUCCESS final report: Grant number 4 HD1 SP07240. Report submitted January 26, 2000, to the Center for
Substance Abuse Prevention, U.S. Department of Health and Human Services.
Project SUCCESS
40

Project Towards No Drug Abuse (TND) Benefit-cost estimates updated August 2014. Literature review updated June 2014.
Program Description: Project Towards No Drug Abuse is a substance use prevention program foryouth in regular and alternative high schools. The curriculum comprises 12 45-minute lessonsimplemented in classroom settings by teachers or health educators. Using a variety of activities, theprogram aims to increase self-control, communication, decision-making, and motivation to not usesubstances.
The estimates shown are present value, life cycle benefits and costs. All dollars are expressed in the base year chosen for this analysis (2013). The economicdiscount rates and other relevant parameters are described in our technical documentation.
Benefit-Cost Summary
Program benefits Summary statistics
Participants $96 Benefit to cost ratio $2.73Taxpayers $44 Benefits minus costs $110Other (1) $65 Probability of a positive net present value 51 %Other (2) ($31)Total $174Costs ($64)Benefits minus cost $110
Detailed Monetary Benefit Estimates
Source of benefitsBenefits to
Participants Taxpayers Other (1) Other (2) Total benefits
From primary participantCrime $0 $6 $21 $3 $30Labor market earnings (hs grad) $97 $41 $48 $0 $186Property loss (alcohol abuse/dependence) $0 $0 $0 $0 $0Health care (disruptive behavior disorder) ($1) ($3) ($4) ($2) ($10)Adjustment for deadweight cost of program $0 $0 $0 ($32) ($32)
Totals $96 $44 $65 ($31) $174
We created the two “other” categories to report results that do not fit neatly in the “participant” or “taxpayer” perspectives. In the “Other (1)” category weinclude the benefits of reductions in crime victimization and the economic spillover benefits of improvement in human capital outcomes. In the “Other (2)”category we include estimates of the net changes in the value of a statistical life and net changes in the deadweight costs of taxation.
Detailed Cost Estimates
Annual cost Program duration Year dollars Summary statistics
Program costs $63 1 2012 Present value of net program costs (in 2013 dollars) ($64)Comparison costs $0 1 2012 Uncertainty (+ or - %) 10 %
Cost data come from program developer (http://tnd.usc.edu).
The figures shown are estimates of the costs to implement programs in Washington. The comparison group costs reflect either no treatment or treatmentas usual, depending on how effect sizes were calculated in the meta analysis. The uncertainty range is used in Monte Carlo risk analysis, described in ourtechnical documentation.
Project Towards No Drug Abuse (TND)
41

Meta-Analysis of Program EffectsOutcomes measured Primary or
secondaryparticipant
No. of effectsizes
Unadjusted effect size(random effects
model)
Adjusted effect sizes and standard errors used in thebenefit-cost analysis
First time ES is estimated Second time ES is estimatedES p-value ES SE Age ES SE Age
Alcohol use in high school Primary 6 0.025 0.915 -0.003 0.073 18 -0.003 0.073 18Illicit drug use in high school Primary 6 -0.070 0.381 -0.023 0.080 18 -0.023 0.080 18Cannabis use in high school Primary 6 0.027 0.777 -0.009 0.094 18 -0.009 0.094 18Smoking in high school Primary 6 -0.033 0.723 -0.011 0.092 18 -0.011 0.092 18Externalizing behavior symptoms Primary 1 0.047 0.814 0.016 0.202 18 0.008 0.105 21
Citations Used in the Meta-AnalysisRohrbach, L.A., Gunning, M., Sun, P., & Sussman, S. (2010). The Project Towards No Drug Abuse (TND) dissemination trial: Implementation fidelity and
immediate outcomes. Prevention Science, 11(1), 77-88.Simon, T.R., Sussman, S., Dahlberg, L.L., & Dent, C.W. (2002). Influence of a substance-abuse-prevention curriculum on violence-related behavior.
American Journal of Health Behavior, 26, 2.Sun, W., Skara, S., Sun, P., Dent, C.W., & Sussman, S. (2006). Project Towards No Drug Abuse: Long-term substance use outcomes evaluation. Preventive
Medicine, 42(3), 188-192.Sun, P., Sussman, S., Dent, C.W., & Rohrbach, L.A. (2008). One-year follow-up evaluation of Project Towards No Drug Abuse (TND-4). Preventive Medicine,
47(4), 438-442.Sussman, S., Sun, P., McCuller, W.J., & Dent, C.W. (2003). Project Towards No Drug Abuse: Two-year outcomes of a trial that compares health educator
delivery to self-instruction. Preventive Medicine, 37(2), 155-162.Sussman, S., Sun, P., Rohrbach, L.A., & Spruijt-Metz, D. (2012). One-year outcomes of a drug abuse prevention program for older teens and emerging
adults: evaluating a motivational interviewing booster component. Health Psychology: Official Journal of the Division of Health Psychology, AmericanPsychological Association, 31(4), 476-85.
Valente, T.W., Ritt-Olson, A., Stacy, A., Unger, J.B., Okamoto, J., & Sussman, S. (2007). Peer acceleration: Effects of a social network tailored substance abuseprevention program among high-risk adolescents. Addiction, 102(11), 1804-1815.
Project Towards No Drug Abuse (TND)
42

SPORT Benefit-cost estimates updated August 2014. Literature review updated June 2014.
Program Description: SPORT is a school-based brief intervention implemented in high schools designed to promote a healthy lifestyle via improved physical activity, diet, and sleep. Students participate in a 12-minute one-on-one counseling session with a fitness specialist during which they receive a booklet and tailored consultation. Students then complete a fitness plan designed to create behavior change and an improved self-image. Flyers that complement the intervention's core content are sent to parents for four weeks post-intervention.
The estimates shown are present value, life cycle benefits and costs. All dollars are expressed in the base year chosen for this analysis (2013). The economicdiscount rates and other relevant parameters are described in our technical documentation.
Benefit-Cost Summary
Program benefits Summary statistics
Participants $604 Benefit to cost ratio $34.84Taxpayers $308 Benefits minus costs $1,300Other (1) $414 Probability of a positive net present value 73 %Other (2) $13Total $1,339Costs ($38)Benefits minus cost $1,300
Detailed Monetary Benefit Estimates
Source of benefitsBenefits to
Participants Taxpayers Other (1) Other (2) Total benefits
From primary participantCrime $0 $26 $87 $13 $126Labor market earnings (hs grad) $574 $245 $284 $0 $1,104Health care (smoking) $28 $38 $40 $19 $124Property loss (alcohol abuse/dependence) $1 $0 $2 $0 $4Adjustment for deadweight cost of program $0 $0 $0 ($19) ($19)
Totals $604 $308 $414 $13 $1,339
We created the two “other” categories to report results that do not fit neatly in the “participant” or “taxpayer” perspectives. In the “Other (1)” category weinclude the benefits of reductions in crime victimization and the economic spillover benefits of improvement in human capital outcomes. In the “Other (2)”category we include estimates of the net changes in the value of a statistical life and net changes in the deadweight costs of taxation.
Detailed Cost Estimates
Annual cost Program duration Year dollars Summary statistics
Program costs $38 1 2013 Present value of net program costs (in 2013 dollars) ($38)Comparison costs $0 1 2013 Uncertainty (+ or - %) 10 %
Cost data come from developer website (http://preventionpluswellness.com/programs/inshape/).
The figures shown are estimates of the costs to implement programs in Washington. The comparison group costs reflect either no treatment or treatmentas usual, depending on how effect sizes were calculated in the meta analysis. The uncertainty range is used in Monte Carlo risk analysis, described in ourtechnical documentation.
SPORT
43

Meta-Analysis of Program EffectsOutcomes measured Primary or
secondaryparticipant
No. of effectsizes
Unadjusted effect size(random effects
model)
Adjusted effect sizes and standard errors used in thebenefit-cost analysis
First time ES is estimated Second time ES is estimatedES p-value ES SE Age ES SE Age
Smoking in high school Primary 1 -0.144 0.103 -0.047 0.088 18 -0.047 0.088 18Alcohol use in high school Primary 1 -0.027 0.762 -0.009 0.088 18 -0.009 0.088 18Youth binge drinking Primary 1 -0.144 0.104 -0.047 0.088 18 -0.047 0.088 18Cannabis use in high school Primary 1 -0.083 0.346 -0.027 0.088 18 -0.027 0.088 18
Citations Used in the Meta-AnalysisWerch, C.C., Moore, M., DiClemente, C., Bledsoe, R., & Jobli, E. (2005). A Multihealth Behavior Intervention Integrating Physical Activity and Substance Use
Prevention for Adolescents. Prevention Science, 6(3), 213-226.
SPORT
44

Strengthening Families for Parents and Youth 10-14 Benefit-cost estimates updated August 2014. Literature review updated April 2012.
Program Description: Strengthening Families for Parents and Youth 10-14 (also known as the IowaStrengthening Families Program) is a family-based program that attempts to reduce behaviorproblems and substance use by enhancing parenting skills, parent-child relationships, and familycommunication. The seven-week intervention is designed for 6th-grade students and their families.
The estimates shown are present value, life cycle benefits and costs. All dollars are expressed in the base year chosen for this analysis (2013). The economicdiscount rates and other relevant parameters are described in our technical documentation.
Benefit-Cost Summary
Program benefits Summary statistics
Participants $2,043 Benefit to cost ratio $3.89Taxpayers $1,061 Benefits minus costs $3,160Other (1) $1,606 Probability of a positive net present value 70 %Other (2) ($452)Total $4,259Costs ($1,098)Benefits minus cost $3,160
Detailed Monetary Benefit Estimates
Source of benefitsBenefits to
Participants Taxpayers Other (1) Other (2) Total benefits
From primary participantCrime $0 $178 $575 $89 $842Labor market earnings (hs grad) $2,036 $869 $1,008 $0 $3,912Property loss (alcohol abuse/dependence) $2 $0 $4 $0 $7Health care (disruptive behavior disorder) $5 $15 $19 $7 $46Adjustment for deadweight cost of program $0 $0 $0 ($549) ($549)
Totals $2,043 $1,061 $1,606 ($452) $4,259
We created the two “other” categories to report results that do not fit neatly in the “participant” or “taxpayer” perspectives. In the “Other (1)” category weinclude the benefits of reductions in crime victimization and the economic spillover benefits of improvement in human capital outcomes. In the “Other (2)”category we include estimates of the net changes in the value of a statistical life and net changes in the deadweight costs of taxation.
Detailed Cost Estimates
Annual cost Program duration Year dollars Summary statistics
Program costs $880 1 2002 Present value of net program costs (in 2013 dollars) ($1,098)Comparison costs $0 1 2002 Uncertainty (+ or - %) 10 %
$880 per family (Miller and Hendrie 2005).
The figures shown are estimates of the costs to implement programs in Washington. The comparison group costs reflect either no treatment or treatmentas usual, depending on how effect sizes were calculated in the meta analysis. The uncertainty range is used in Monte Carlo risk analysis, described in ourtechnical documentation.
Strengthening Families for Parents and Youth 10-14
45

Meta-Analysis of Program EffectsOutcomes measured Primary or
secondaryparticipant
No. of effectsizes
Unadjusted effect size(random effects
model)
Adjusted effect sizes and standard errors used in thebenefit-cost analysis
First time ES is estimated Second time ES is estimatedES p-value ES SE Age ES SE Age
Disruptive behavior disordersymptoms
Primary 1 -0.246 0.172 -0.081 0.181 13 -0.039 0.095 16
Smoking in high school Primary 1 -0.523 0.222 -0.172 0.222 15 -0.172 0.222 18Alcohol use in high school Primary 1 -0.210 0.359 -0.069 0.228 15 -0.069 0.228 18Cannabis use in high school Primary 1 -0.874 0.011 -0.288 0.345 15 -0.288 0.345 18Illicit drug use in high school Primary 1 -0.317 0.038 -0.105 0.153 15 -0.105 0.153 18Alcohol use before end of middleschool
Primary 1 -0.387 0.036 -0.128 0.184 13 -0.128 0.184 18
Citations Used in the Meta-AnalysisSpoth, R., Redmond, C., & Lepper, H. (1999). Alcohol initiation outcomes of universal family-focused preventive interventions: One- and two-year follow-ups
of a controlled study. Journal of Studies on Alcohol, 13, 103-111.Spoth, R., Reyes, M.L., Redmond, C., & Shin, C. (1999). Assessing a public health approach to delay onset and progression of adolescent substance use:
Latent transition and loglinear analyses of longitudinal family preventive intervention outcomes. Journal of Consulting and Clinical Psychology, 67(5),619-630.
Spoth, R.L., Redmond, C., & Shin, C. (2000). Reducing adolescents' aggressive and hostile behaviors: Randomized trial effects of a brief family intervention 4years past baseline. Archives of Pediatrics & Adolescent Medicine, 154(12), 1248-1258.
Spoth, R.L., Redmond, C., & Shin, C. (2001). Randomized trial of brief family interventions for general populations: Adolescent substance use outcomes 4years following baseline. Journal of Consulting and Clinical Psychology, 69(4), 627-642.
Spoth, R.L., Clair, S., Shin, C., & Redmond, C. (2006). Long-term effects of universal preventive interventions on methamphetamine use among adolescents.Archives of Pediatrics & Adolescent Medicine, 160(9), 876-882.
Trudeau, L., Spoth, R., Randall, G., & Azevedo, K. (2007). Longitudinal Effects of a Universal Family-Focused Intervention on Growth Patterns of AdolescentInternalizing Symptoms and Polysubstance Use: Gender Comparisons. Journal of Youth and Adolescence, 36(6), 725-740.
Strengthening Families for Parents and Youth 10-14
46

Teen Marijuana Check-Up Benefit-cost estimates updated August 2014. Literature review updated July 2014.
Program Description: Teen Marijuana Check-Up is a brief, school-based intervention for youthmeeting diagnostic criteria for cannabis use disorders. Youth are introduced to the program viaclassroom presentations. Students receive two 45 to 60 minute motivational interviews a week apart.The intervention is provided during the school day without parental involvement. We are unable toestimate costs at this time.
The estimates shown are present value, life cycle benefits and costs. All dollars are expressed in the base year chosen for this analysis (2013). The economicdiscount rates and other relevant parameters are described in our technical documentation.
Benefit-Cost Summary
Program benefits Summary statistics
Participants $1,293 Benefit to cost ratio $17.94Taxpayers $588 Benefits minus costs $1,793Other (1) $50 Probability of a positive net present value 100 %Other (2) ($32)Total $1,898Costs ($106)Benefits minus cost $1,793
Detailed Monetary Benefit Estimates
Source of benefitsBenefits to
Participants Taxpayers Other (1) Other (2) Total benefits
From primary participantLabor market earnings (cannabis abuse/dependence) $1,281 $546 $0 $0 $1,828Health care (cannabis abuse/dependence) $12 $41 $50 $21 $124Adjustment for deadweight cost of program $0 $0 $0 ($53) ($53)
Totals $1,293 $588 $50 ($32) $1,898
We created the two “other” categories to report results that do not fit neatly in the “participant” or “taxpayer” perspectives. In the “Other (1)” category weinclude the benefits of reductions in crime victimization and the economic spillover benefits of improvement in human capital outcomes. In the “Other (2)”category we include estimates of the net changes in the value of a statistical life and net changes in the deadweight costs of taxation.
Detailed Cost Estimates
Annual cost Program duration Year dollars Summary statistics
Program costs $106 1 2013 Present value of net program costs (in 2013 dollars) ($106)Comparison costs $0 1 2013 Uncertainty (+ or - %) 10 %
Cost data provided by program developer. Includes recruitment, screening, and direct intervention hours.
The figures shown are estimates of the costs to implement programs in Washington. The comparison group costs reflect either no treatment or treatmentas usual, depending on how effect sizes were calculated in the meta analysis. The uncertainty range is used in Monte Carlo risk analysis, described in ourtechnical documentation.
Teen Marijuana Check-Up
47
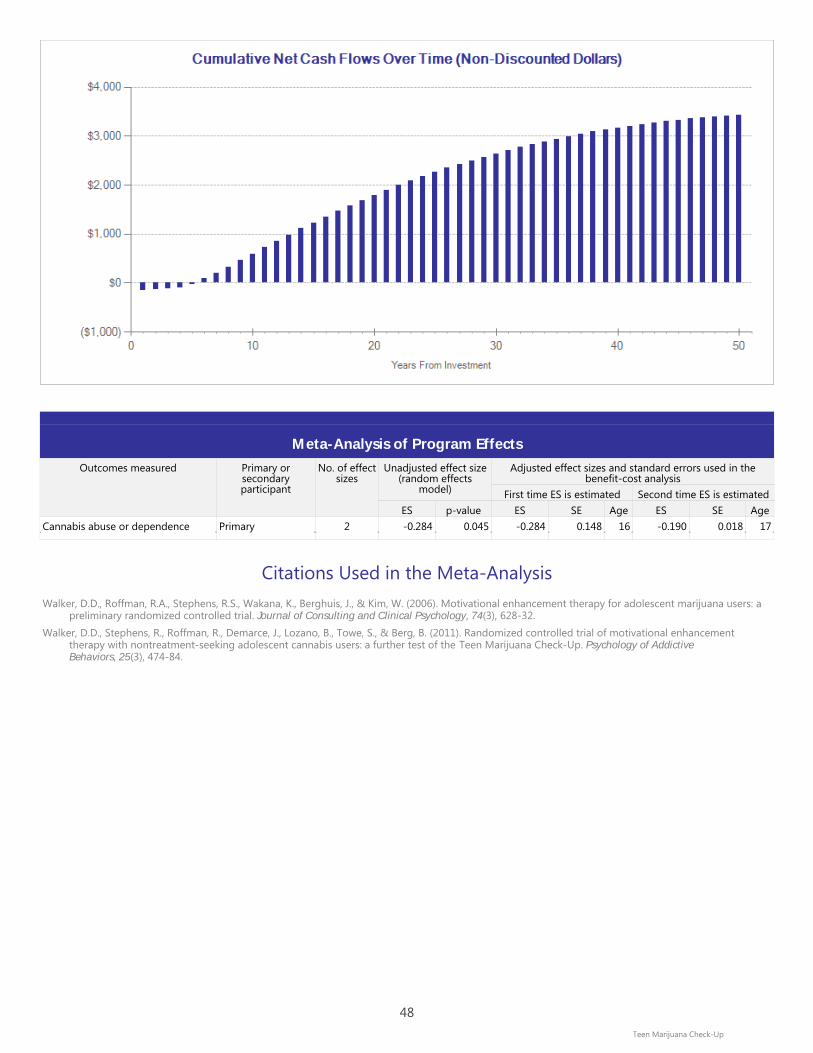
Meta-Analysis of Program EffectsOutcomes measured Primary or
secondaryparticipant
No. of effectsizes
Unadjusted effect size(random effects
model)
Adjusted effect sizes and standard errors used in thebenefit-cost analysis
First time ES is estimated Second time ES is estimatedES p-value ES SE Age ES SE Age
Cannabis abuse or dependence Primary 2 -0.284 0.045 -0.284 0.148 16 -0.190 0.018 17
Citations Used in the Meta-AnalysisWalker, D.D., Roffman, R.A., Stephens, R.S., Wakana, K., Berghuis, J., & Kim, W. (2006). Motivational enhancement therapy for adolescent marijuana users: a
preliminary randomized controlled trial. Journal of Consulting and Clinical Psychology, 74(3), 628-32.Walker, D.D., Stephens, R., Roffman, R., Demarce, J., Lozano, B., Towe, S., & Berg, B. (2011). Randomized controlled trial of motivational enhancement
therapy with nontreatment-seeking adolescent cannabis users: a further test of the Teen Marijuana Check-Up. Psychology of Addictive Behaviors, 25(3), 474-84.
Teen Marijuana Check-Up
48

49

Document No. 14-10-3201
Washington State Institute for Public PolicyThe Washington State Legislature created the Washington State Insititute for Public Policy in 1983. A Board of Directors—representing the legislature, the governor, and public universities—governs WSIPP and guides the development of all activities. WSIPP's mission is to carry out practical research, at legislative direction, on issues of importance to Washington State.
WSIPP's Preventing and Treating Youth Marijuana Use: An Updated Review of the Evidence can be found on our website at www.wsipp.wa.gov/ReportFile/1571/Wsipp_Preventing-and-Treating-Youth-Marijuana-Use-An-Updated-Review-of-the-Evidence_Report.pdf