Embed Size (px)
Citation preview

Washington State
County Road Administration Board
2004 Annual Report Prepared for the Legislative Transportation Committee and The Washington State Transportation Commission
Special thanks to Franklin, Garfield, Lewis, Pierce, Skamania, Spokane and Walla Walla Counties for their contributions to this report.

December 31, 2004 The Honorable Mary Margaret Haugen Washington State Senator Chair, Senate Highways and Transportation Committee The Honorable Ed Murray Washington State Representative Chair, House Transportation Committee Dear Senator Haugen and Representative Murray: In accordance with the requirement of law, the Washington State County Road Administration Board presents to the legislature this report of the activities of this agency for the year 2004. CRAB staff continues to promote the integration of engineering, information technology, and grants administration among the counties of the state. We believe this report will accurately indicate to you the effectiveness of that effort. The Board and its staff remain steadfast in their commitment to achieving your legislative mandates to provide statutory oversight of the state’s thirty-nine county road departments, and in so doing, to provide to you and to the people of this state the assurance that these counties’ operations remain accountable in their stewardship of public assets and public trust. Respectfully submitted:
______________________________________ Don Scheibe, CRABoard Chairman
______________________________________ Jay P. Weber, Executive Director

________________________________________________________________________________________________________________________________________________________________________________________________
County Road Administration Board
Chairman Don Scheibe, Asotin County Commissioner 2006
Vice-Chairman Dean Burton, Garfield County Commissioner 2007
Tim Snead, Grant County Commissioner 2005
Judie Stanton, Clark County Commissioner 2005
Robert Breshears, P.E., Lincoln County Engineer 2005
Patty Lent, Kitsap County Commissioner 2006
Brian Stacy, P.E., Pierce County Engineer 2006
David Carey, Walla Walla County Commissioner 2007
Jim Whitbread, P.E., Stevens County Engineer 2007
County Road Administration Board Staff
Executive Director, Jay Weber
Executive Assistant, Karen Pendleton
Administration Toni Cox, Engineering Technician
Rhonda Mayner, Secretary
Deputy Director, Walter Olsen, P.E.
Engineering Alan King, P.E., Intergovernmental Policy Manager
Randy Hart, P.E., Grant Programs Manager
Don Zimmer, P.E., Inventory Systems Manager
Larry Pearson, P.E., Maintenance Programs Manager
Assistant Director, Steven Hillesland
Technology Daniel Dickson, Systems Manager
Jim Ayres, P.E., Design Systems Engineer
Jim Oyler, Support Specialist
Kathy O’Shea, Database Development Specialist
________________________________________________________________________________________________________________________________________________________________________________________________
i

________________________________________________________________________________________________________________________________________________________________________________________________
Table of Contents From the Executive Director ......................................................1 Engineering Services ................................................................2 Information Services ..................................................................3 Grant Programs ......................................................................4-7 2004 Grant Program Projects ...............................................8-14 Tables ......................................................................................15 A:County Bridge Data ............................................................16 B:Actual County Road Related Expenditures ........................17 C:Anticipated County Road Fund Revenues .........................18 D:Anticipated County Road Fund Expenditures ....................19 E:County Road Levy Summary..............................................20 F:County Road Mileage .........................................................21 G:County Arterial Preservation Program................................22 H:County Freight and Goods System ....................................23
________________________________________________________________________________________________________________________________________________________________________________________________
ii

__________________________________________________________________________________________________________________________________________________________
From the Executive Director This annual report of the Washington State County Road Administration Board for the year 2004 shows basically who we are at CRAB, what we do here, and how our administrative services and grants programs foster a better, more efficient and safer road system throughout the thirty-nine counties of the state. It is not possible to prepare these annual reports without noticing certain trends as they develop over time. It is just such a trend to which I would like to call your attention this year. The two principal sources of county road fund monies are the motor vehicle fuel tax and the local property tax. Both sources are directed toward road purposes and are constitutionally and statutorily protected for those uses. Traffic policing and patrol are themselves road purposes and the local property tax authority for roads may be legally shifted to general government purposes by action of the county legislative authority. While these actions are fully legal, they do result in a diminished capacity from which to address the traditional functions of maintenance and construction of the county road system. Current data indicate that it is more and more difficult to balance county current expense budgets without increased levels of diversion of maintenance and construction dollars to traffic policing and patrol or without shifting levy authority from county road for general government needs and purposes. It is understood that the county road system does not function in a vacuum and we do not mean to suggest that general government
purposes are not vitally important. Still, it is equally important to understand that a trend of this sort cannot and does not continue without negative impacts to the surface transportation system. We also need to recognize that these impacts are long term in nature and will directly impact the economies of the regions in which they occur and that of the state as well. It is also well indicated that this trend has not occurred due to a lack of due diligence nor without the best efforts of local authorities to avoid it. All evidence shows us this situation is upon us more from a lack of funding capacity and funding alternatives than from any other cause. The near-term effect will be that counties will have greater difficulty capitalizing and managing the cash flow demands of construction projects and maintenance of the road system generally, and the arterial system particularly will be deferred or conducted at a lower level of service. The long term result will be a deteriorated system, with a growing price tag to remedy, and a more seriously constrained financial position from which to deal with it. This situation, while seriously important, is not a system failure nor need it be. There is time to seek revenue and management solutions which will protect and build upon the enormously successful investments in transportation which the citizens of the state have already made. The County Road Administration Board stands ready to assist the counties and the legislature in any way we can toward that end.
__________________________________________________________________________________________________________________________________________________________
- 1 -

__________________________________________________________________________________________________________________________________________________________
Engineering Services The Engineering Services Division, under the direction of Deputy Director Walt Olsen, includes Intergovernmental Policy Manager Al King, Maintenance Program Manager Larry Pearson, Grant Programs Engineer Randy Hart, and Inventory Systems Manager Don Zimmer. This small staff, most of whom hold Professional Engineer licenses, is directly responsible for: • Functions related to the administration of the Rural Arterial Program, the County Arterial Preservation Program, and the Capital Ferry Program, • Functions related to the maintenance of the County Road Log and the computations and updates to the distribution of the counties’ share of the motor vehicle fuel tax, • Management of the reports and other information necessary for recommendations related to the Annual Certificate of Good Practice for each county. • Guidance and research on statutory and regulatory issues affecting county road and public works departments, • Assistance in representation of county engineer interests on a variety of state-level committees and task forces, • Design and traffic engineering assistance to counties as requested, including consultant selection assistance, • Liaison services on behalf of county engineers with various state agencies, especially the H&LP Division of WSDOT. CRAB acts as a clearinghouse for information requests, questions, and the exchange of ideas. With an emphasis on good communication, Engineering Services staff has worked with state transportation officials, resource agencies personnel, and public works departments as they strive to meet the transportation needs of their counties.
Beginning in 2001, a major focus of the Engineering Services Division was placed on developing a Maintenance Management System and assisting the counties in its implementation. The intent of the maintenance management initiative is to increase the use of formal maintenance management systems in county maintenance operations rather than to tell counties how to perform their maintenance activities. The Maintenance Management Program moved into the implementation phase in 2003 and a draft Maintenance Management manual was prepared. It is intended to provide initial support and guidance for implementation and operation of a formal Maintenance Management System (MMS). In 2004, work began to revise the WAC for implementing Standards of Good Practice related to maintenance management and counties will be encouraged to examine their maintenance processes
A final responsibility of the Engineering Services Division is the maintenance and updating of the County Engineers’ and Public Works Directors’ Manual and the provision of training to County Engineers and their staffs. Two sessions were conducted in 2004 to address the recent turnover of county engineers and public works directors as well as provide an opportunity for senior staff members to understand the challenges and develop the knowledge base for possible advancement.
__________________________________________________________________________________________________________________________________________________________
- 2 -

__________________________________________________________________________________________________________________________________________________________
Information Services The Information Services Division at CRAB is a small team of professionals dedicated to the smooth and efficient operation of this agency and to ensuring that Washington's counties continue to effectively apply current and emerging technology to the improvement and preservation of the public's investment in transportation infrastructure. The first goal is accomplished by providing a progressive, stable and secure computing environment for agency staff. The second, by developing and providing systems, training and consulting services specific to the needs of county road departments in Washington. In 2004 the Information Services team again made significant, unique and creative contributions to agency staff and to the design and management efforts of Washington counties.
An outstanding accomplishment of 2004 was the release and deployment of Mobility in Washington counties. Mobility is an application, developed by CRAB, to replace the
aging County Road Inventory System, used in our counties since the late 1980's. Mobility is a comprehensive road inventory and management system which enhances a county’s ability to make quality decisions through consistent, equitable, and defensible management plans and operations. The systematic application of sound business logic, embedded in Mobility, ensures accountability in county road departments and assists county personnel in their compliance with reporting requirements to CRAB, the State Legislature, and federal entities. Mobility was deployed to nearly half of the Washington counties in 2004 and will reach the rest of the counties in early 2005. Deployment and training for Mobility has shown broad acceptance and enthusiasm by county personnel who are using the application. Mobility is a prime example of the economy-of-scale for which CRAB is well known, in that it will save the counties from spending millions on management systems that are neither as responsive to nor as specific to their needs as Mobility. A mainstay in the assistance role of the CRAB Information Services team is the Design Systems program. Since 1985, Design Systems has consistently provided Washington county personnel with state-of-the-art engineering road design software, support, and training. This program has enabled county design staff to effectively collect, develop and manipulate the geometric information necessary for site design and construction planning which has contained costs, and improved productivity throughout the life of road projects.
__________________________________________________________________________________________________________________________________________________________
- 3 -

____________________________________________________________________________________________________________________________________________________________ Grant Programs Utilizing 1.03 cents of the total 28 cents per gallon state gas tax, the County Arterial Preservation Program and the Rural Arterial Program ($14 million and $19 million per year respectively) make large annual contributions to the health of county arterial roads. These programs provide funding that improves
freight haul and access to agricultural markets in local areas. When projects are approved with these funds, mobility and safety needs are also addressed. The two programs compliment each other with their unique focus on different road deficiencies.
COUNTY ARTERIAL PRESERVATION PROGRAM CAPP use is limited to preserving of the road structure, preventing costly surface and substructure failures later on. Roads fail at predictable rates, and counties are required to monitor this through an automated pavement management system in order to be eligible to
use CAPP funds. The system ensures that funds are applied to the right roads at the right time, resulting in the greatest system-wide benefit and cost savings. CRAB uses less than 3% of the revenue to administer CAPP.
LANE MILES OF PRESERVATION WORK DONE TO DATE, ALL FUNDS 1990 - 2003
Leveling, 6,664
Structural Overlays, 5,635
Thin Overlays, 8,323
Seals, 60,741
__________________________________________________________________________________________________________________________________________________________
- 4 -

__________________________________________________________________________________________________________________________________________________________ RURAL ARTERIAL PROGRAM Sometimes a road’s failings are more than structural, and safety and capacity needs are present. This is where the RAP comes in, focusing on correcting adverse geometry, narrow widths, and safety hazards as well as major structural failure. Using less than 3% of the tax for administration, the CRABoard manages the RAP via a biennial cycle that includes:
• Project submittal • Rating • Determining eligibility through six year program and road levy review • Funding approval • Reimbursement and field review of completed projects
Rural Arterial Program BIENNIUM CYCLE
__________________________________________________________________________________________________________________________________________________________
- 5 -

__________________________________________________________________________________________________________________________________________________________ Rural Arterial Program Expenditures by County And Legislative District in 2003
__________________________________________________________________________________________________________________________________________________________
- 6 -

__________________________________________________________________________________________________________________________________________________________ History of RATA funds per county
__________________________________________________________________________________________________________________________________________________________
- 7 -
__________________________________________________________________________________________________________________________________________________________
2004 GRANT PROGRAM PROJECTS Franklin County constructs Sagehill Road Truck Climbing Lane
RAP Funds: $630,000 Awarded in 1996 Total Project Cost: $1,506,496 Design: Franklin County and J-U-B Engineers, Inc. of Kennewick Construction: -Canal modifications: Apollo, Inc. of Kennewick, Washington -Road construction: Hilmes Construction, of Othello, Washington
This project consisted of the acquisition of right-of-way, irrigation and canal modifications, horizontal and vertical realignment, crushed surfacing, drainage, Asphalt Concrete Pavement, the addition of a truck climbing lane and turn lanes, and illumination.
Ample room for safe passing maneuvers. Franklin County Commissioners, in their letter of November 17, 2004 to the CRABoard, shared their sincere thanks for the RAP funding. “Without Rural Arterial Program funding, Sagehill Truck Climbing Lane would still just be on Franklin County’s Wish List”. __________________________________________________________________________________________________________________________________________________________
- 8 -
__________________________________________________________________________________________________________________________________________________________ LEWIS COUNTY SUMMARY OF 2003 CAPP Lewis County used CAPA funds judiciously in 2003 as a part of their overall pavement preservation program, funneling dollars where they were most needed. Below is a summary of their priorities and project descriptions. PROJECT TITLE: 2003 Prelevel Paving and Thin Overlays CRP NUMBER: 2080 PROJECT SCOPE: Lewis County’s 2003 Thin Lift Overlay program addressed three priorities. 1. Pavement Surface Condition Ratings Repaving certain road surfaces that were rated at the
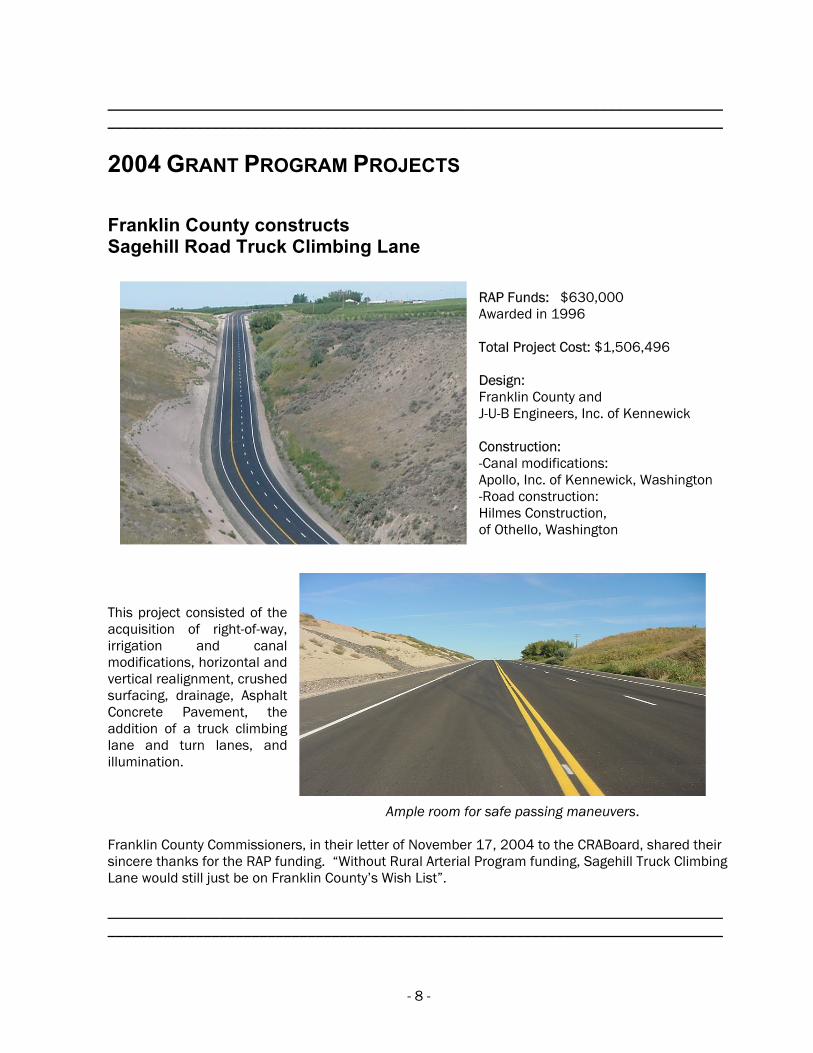
“must repair” level. 2. Heavy Truck Usage Strengthening 4.17 miles of
Big Hanaford Road.
Big Hanaford Road serves the TransAlta Steam Plant and Coal Mine from SR507. The TransAlta Company employs 850 to 900 permanent and temporary employees who travel this route twice daily. Also, four trucking companies haul quarry rock, fly ash, limestone, and gypsum every day over this route. In addition there are occasional very large over-sized loads using this route.
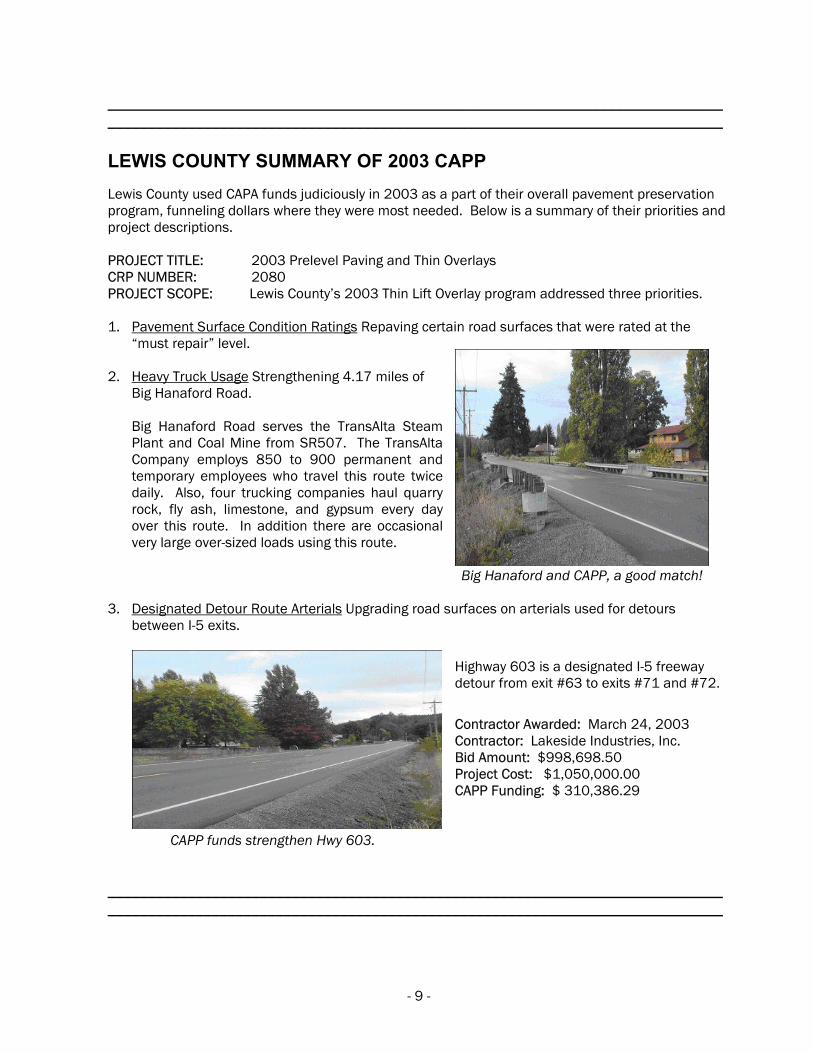
Big Hanaford and CAPP, a good match! 3. Designated Detour Route Arterials Upgrading road surfaces on arterials used for detours
between I-5 exits.
Highway 603 is a designated I-5 freeway detour from exit #63 to exits #71 and #72.
Contractor Awarded: March 24, 2003 Contractor: Lakeside Industries, Inc. Bid Amount: $998,698.50 Project Cost: $1,050,000.00 CAPP Funding: $ 310,386.29
CAPP funds strengthen Hwy 603. __________________________________________________________________________________________________________________________________________________________
- 9 -

__________________________________________________________________________________________________________________________________________________________ Pierce County completes 2nd phase of busy 120th Street While phase 1 was completed in 1999, Pierce County completed phase 2 during the 2002 & 2003 construction seasons. This project provided for the widening and reconstruction of 0.83 miles of 120th Street East from 214th Avenue East to South Prairie Road East and
0.20 miles of South Prairie Road East north and south of the 120th Street East intersection. The work included construction of a stormwater retention pond, infiltration system, and other drainage improvements.
The narrow, obsolete 120th Street.
Contractor: Ceccanti, Inc.; Spanaway, Washington Funding: RAP - $400,000 Pierce County - $1,450,952
Opening sight distance and widening improve safety. __________________________________________________________________________________________________________________________________________________________
- 10 -

__________________________________________________________________________________________________________________________________________________________ Spokane County Constructs 4.10 miles of Prairie View Road Prairie View Road is a major East-West rural arterial linking the Town of Waverly, Highway 27, and Southeast Spokane County Grain Growers to Old Highway 195 and the rail heads for grain shipments in the Towns of Plaza and Rosalia. Since the abandonment of the railroad that served the grain centers of Waverly, Griffith and Spring Valley, Prairie View Road provides the transportation link for all the grain storage facilities in the area.
Narrow lanes and nonexistent shoulders along with sub-standard horizontal and vertical curves were unsettling to the most experienced drivers when meeting oncoming traffic in any weather. Inadequate drainage and areas of unsuitable material were the main causes of pavement deterioration.
Prairie View Road was rough and narrow. Steelman-Duff, Inc. of Clarkston completed the 1st phase in 2002 and S.A. Gonzales Construction, Inc. of Newman Lake completed the 2nd phase in 2003. Project cost: $3,063,600.00 RAP funding: $2,216,869.00 The new road is comfortable and safe to drive.
- 11 -

__________________________________________________________________________________________________________________________________________________________ Walla Walla County replaces deficient Whitman Bridge Located near the Whitman Mission National Historic Site in Walla Walla County, the Whitman Bridge was structurally, functionally, and hydraulically deficient with five piers in the Walla Walla River, debris built up constantly and scour of the support structure reducing the bridge’s structural capacity over the years. Maintenance and inspection of the bridge was a constant and costly chore. The new two-span, 200-foot-long bridge is on an improved alignment with an increased waterway opening. The roadway width was increased from 20 feet to 36 feet.
With many piers, river borne debris was often trapped.
Now the Walla Walla River can pass under the bridge without missing a beat, flood or no flood. Constructed by: Apollo, Inc.; Kennewick, Washington Total Cost: $1,190,487.00 RATA Funds: $188,100.00
A wide channel to handle future flooding. __________________________________________________________________________________________________________________________________________________________
- 13 -

__________________________________________________________________________________________________________________________________________________________
Garfield County Public Works replaces rough section of Gould City – Mayview Road
The project involved constructing 2.10 miles of new county road, replacing 3.37 miles of very narrow and curvy roadway and failed pavement. These conditions combined to make for slow and dangerous travel. The adverse alignment and drainage made maintenance far too expensive to continue. County residents and farmers often chose alternative routes in order to avoid traveling this section of road. Since the improvements however, it has become the primary access road for most of the Northern county residents.
The new road required extensive grading. Total Project Cost: $2,085,392 RATA Funding: $1,876,853 County Funding: $208,539 Design Consultant: Progressive Engineering; Lewiston, Idaho Prime Contractor: Westway Construction; Airway Heights, Washington
- 14 -

__________________________________________________________________________________________________________________________________________________________ Skamania County improves school access, pedestrian and vehicle movements on Wahhougal River Road
This project was the final piece of a 5-mile improvement done over a 6-year period. This section emphasized safety and mobility due to a traffic volume of 2000 cars a day and a school within the project that doubled in size after a middle school was added.
Improvements include:
• Lane widening
• Increased site distance
• Left turn lane for the school a
5 foot shoulder to accom
pproach
• modate
•
ge
vert
Road Type: Major Collector n :
2003 ns, Inc. of Washougal, Washington
pedestrians
Crosswalks
• Storm draina
• Fish passage cul
Total RATA Fu ds $237,960 Total Project Cost: $378,138 Completion Date: August 12, Contractor: George Schmidt and So
- 16 -

__________________________________________________________________________________________________________________________________________________________
TABLES A: County Bridge Data 18 B: Actual County Road Related Expenditures 19 C: Anticipated County Road Fund Revenues 20 D: Anticipated County Road Fund Expenditures 21 E: County Road Levy Summary 22 F: County Road Mileage 23 G: County Arterial Preservation Program 24 H: County Freight and Goods System 25
- 18 -

Table A
COUNTY BRIDGE DATA - NOVEMBER 2004Washington State Bridge Inventory System
Bridges 20 Feet or Greater in Length on Federal Aid (FAR) and Non Federal Aid (NFAR) Routes Posting Consideration Based on HS-20 Design Load, less than 28 Tons at Operating Rating
COUNTY County Owned Bridges Posted or May Consider Posting Bridges With Posting Not Required Deficient Bridges FAR Square Feet NFAR Square Feet FAR Square Feet NFAR Square Feet Bridges**
ADAMS 124 1 514 18 25,700 35 68,010 70 75,086 27
ASOTIN 18 0 0 0 0 14 143,738 4 4,321 2
BENTON 53 0 0 1 593 19 80,336 33 32,668 9
CHELAN 44 1 10,060 4 3,947 15 80,720 23 64,078 10
CLALLAM 31 1 10,960 1 1,426 10 53,242 19 53,333 8
CLARK 60 1 1,535 2 4,152 27 90,690 30 48,591 19
COLUMBIA 64 0 0 3 2,612 20 30,707 41 64,436 8
COWLITZ 51 4 10,258 6 24,650 14 75,645 27 72,814 20
DOUGLAS 26 1 6,861 4 2,545 12 21,039 9 8,619 2
FERRY 21 0 0 1 3,195 5 8,493 15 22,091 6
FRANKLIN 88 0 0 3 2,490 19 36,415 66 90,266 8
GARFIELD 36 1 868 0 0 16 14,181 19 18,964 9
GRANT 187 3 4,520 8 9,089 45 125,255 131 221,686 21
GRAYS HARBOR 146 3 2,480 4 23,887 55 298,583 84 188,916 30
ISLAND 0 0 0 0 0 0 0 0 0 0
JEFFERSON 23 1 1,078 0 0 7 15,092 15 54,249 4
KING 144 8 36,837 10 27,501 69 331,718 57 119,643 67
KITSAP 23 0 0 2 8,373 15 69,494 6 6,790 4
KITTITAS 110 5 5,130 15 12,474 22 74,091 68 114,685 6
KLICKITAT 57 1 522 7 10,767 12 36,001 37 72,524 14
LEWIS 192 7 10,044 7 8,689 38 146,623 140 261,598 27
LINCOLN 125 0 0 13 9,289 31 48,525 81 104,877 17
MASON 50 1 1,750 0 0 10 70,159 39 70,097 13
OKANOGAN 50 0 0 1 924 12 61,868 37 53,348 11
PACIFIC 61 0 0 2 2,045 9 28,944 50 128,799 13
PEND OREILLE 22 1 1,552 0 0 9 98,997 12 12,389 5
PIERCE 103 5 70,318 0 0 61 288,817 37 54,031 41
SAN JUAN 3 0 0 0 0 0 0 3 2,364 2
SKAGIT 101 0 0 11 14,777 42 193,617 48 99,020 25
SKAMANIA 26 0 0 2 3,570 5 30,218 19 55,471 7
SNOHOMISH 165 4 5,089 12 15,738 77 388,524 72 239,864 54
SPOKANE 101 10 16,152 14 17,181 24 168,007 53 113,824 33
STEVENS 51 0 0 1 1,277 7 20,799 43 74,951 10
THURSTON 89 0 0 0 0 24 117,185 65 180,934 21
WAHKIAKUM 17 1 2,419 0 0 7 22,354 9 16,640 2
WALLA WALLA 102 0 0 1 504 46 113,614 55 110,905 18
WHATCOM 123 1 2,684 0 0 32 90,157 90 154,143 28
WHITMAN 245 6 12,253 27 24,238 47 86,385 165 254,389 62YAKIMA 312 5 11,166 8 13,678 79 126,959 220 383,543 56TOTAL 3,244 72 225,050 188 275,311 991 3,755,202 1,992 3,704,947 719Total Replacement Cost* ($ Million): $68 $83 $1,127 $1,111*At $300 per Square Foot ** Deficient Bridges are listed as Structurally Deficient (SD) or Functionally Obsolete (FO).

Table B
MAINT. BOND TRAFFIC TOTALCOUNTY CONST. & ADMIN. REIMB. FERRY WARRANT OTHER POLICING RAP CAPP
PRES. RET'T *** **
ADAMS 641 3,258 1,074 255 0 0 1,361 60 6,649 975 586
ASOTIN 293 1,415 505 0 0 0 81 0 2,294 89 106
BENTON 5,011 4,337 692 187 0 0 305 0 * 10,532 937 325
CHELAN 1,669 4,937 655 0 0 0 852 0 8,113 314 258
CLALLAM 2,833 4,343 2,133 281 0 28 714 256 10,588 261 141
CLARK 37,474 13,609 1,456 0 0 68 15,546 14 * 68,167 241 526
COLUMBIA 18 2,267 254 0 0 0 513 40 3,092 182 146
COWLITZ 3,627 7,116 1,503 8 0 0 264 0 * 12,518 153 241
DOUGLAS 4,205 4,107 959 55 0 292 1,447 0 11,065 651 332
FERRY 669 1,638 441 49 0 0 776 0 3,573 26 191
FRANKLIN 3,424 2,616 974 143 0 168 71 0 7,396 449 373
GARFIELD 2,118 1,126 336 11 0 0 34 0 3,625 1,041 131
GRANT 5,948 6,259 1,550 114 0 24 3,078 180 17,153 0 890
GRAYS HARBOR 3,522 5,986 861 859 0 0 1,202 0 12,430 1,148 241
ISLAND 3,898 4,641 1,567 519 0 226 7,796 0 18,647 297 232
JEFFERSON 328 3,018 740 66 0 19 1,335 0 * 5,506 73 138
KING 64,953 45,863 5,310 0 0 580 37,102 1,080 154,888 58 623
KITSAP 7,567 9,234 3,749 502 0 100 3,735 0 * 24,887 437 341
KITTITAS 1,728 3,014 1,059 97 0 276 42 0 * 6,216 888 329
KLICKITAT 3,249 3,819 486 16 0 5 108 0 7,683 683 341
LEWIS 6,056 7,784 914 0 0 0 2,322 0 * 17,076 0 310
LINCOLN 825 4,006 1,006 218 0 0 100 0 * 6,155 515 401
MASON 5,646 3,285 1,019 0 0 0 1,863 0 * 11,813 0 283
OKANOGAN 1,653 5,925 1,407 6 0 26 393 133 9,543 925 431
PACIFIC 2,112 3,515 290 15 0 0 244 248 6,424 0 128
PEND OREILLE 1,384 2,354 366 315 0 204 207 0 4,830 987 169
PIERCE 23,577 17,022 15,395 20 2,088 62 16,043 6,689 80,896 1,037 776
SAN JUAN 647 2,445 494 465 0 0 567 0 * 4,618 0 94
SKAGIT 1,611 5,320 4,412 4,171 1,396 0 2,799 0 * 19,709 0 386
SKAMANIA 899 2,371 400 1 0 0 120 0 3,791 238 96
SNOHOMISH 56,072 20,878 7,474 6,633 0 582 12,259 1,794 105,692 960 536
SPOKANE 14,384 15,172 3,888 2,883 0 0 5,129 0 41,456 1,351 970
STEVENS 2,965 4,949 579 14 0 0 149 0 8,656 257 499
THURSTON 4,743 11,724 2,653 0 0 0 2,387 273 21,780 196 387
WAHKIAKUM 534 1,054 194 35 611 0 442 0 2,870 0 85
WALLA WALLA 3,475 3,295 1,105 1,049 0 0 169 0 9,093 775 418
WHATCOM 4,319 9,599 2,897 177 1,327 0 1,266 0 * 19,585 0 391
WHITMAN 3,393 3,520 890 0 0 0 92 65 7,960 185 445YAKIMA 15,226 7,096 3,842 424 0 1,128 708 137 28,561 822 816
TOTAL 302,696 263,917 75,529 19,588 5,422 3,788 123,621 10,969 805,530 17,154 14,114
% OF TOTAL 37.6% 32.8% 9.4% 2.4% 0.7% 0.5% 15.3% 1.3%Construction expenditure amounts do not include State ad & award Federal Aid participation.Source: County Reports to D.O.T. Secretary of Transportation*Traffic Policing funds paid from diverted road levy.** Road Fund portion only*** "Other" includes facilities, operations and transfers.
RAP & CAPP
Including RAP and CAPP ACTUAL COUNTY ROAD RELATED EXPENDITURES
2003(thousands of dollars)
includes

Table C
ANTICIPATED COUNTY ROAD FUND REVENUE 2004 BUDGETS
(thousands of dollars)
BEGIN. FED. MOTOR VEHICLE FUEL TAX TAXES MISC.COUNTY FUND PROG. GAS MVFT PROP- OTHER TOTAL FED. TOTAL
BAL. TAX TIB RAP CAPP TOTAL ERTY TIMBER TAXES TAXES LANDS REIMB. OTHERADAMS 180 1,316 3,672 0 220 594 4,486 1,025 0 10 1,035 0 37 12 7,066ASOTIN 1,110 215 1,400 0 1,516 0 2,916 686 1 2 689 0 0 19 4,949BENTON 3,280 2,733 2,940 1,158 910 329 5,337 3,880 0 88 3,968 0 120 3,460 18,898CHELAN 4,058 1,158 2,141 0 1,079 261 3,481 4,717 12 35 4,764 1,040 3 273 14,777CLALLAM 7,133 1,884 1,798 0 434 142 2,374 5,090 200 9 5,299 900 134 1,268 18,992CLARK 12,062 7,339 6,319 5,808 0 618 12,745 27,251 182 82 27,515 7 0 12,793 72,461COLUMBIA 426 717 1,250 0 1,561 145 2,956 192 5 1 198 178 0 368 4,843COWLITZ 2,600 4,140 2,112 40 1,386 240 3,778 7,076 500 35 7,611 166 210 450 18,955DOUGLAS 1,013 1,221 3,450 198 3,040 0 6,688 3,144 0 15 3,159 0 100 862 13,043FERRY 300 200 1,540 0 508 180 2,228 152 5 0 157 391 0 177 3,453FRANKLIN 570 2,004 2,493 0 1,125 370 3,988 2,019 0 10 2,029 0 84 67 8,742GARFIELD 1,549 870 1,160 0 555 131 1,846 220 4 2 226 100 0 288 4,879GRANT 15,212 4,768 5,628 858 0 909 7,395 5,808 0 90 5,898 0 100 358 33,731GRAYS HARBOR 3,923 5,307 2,098 0 1,400 243 3,741 3,799 1,800 5 5,604 150 43 1,673 20,441ISLAND 3,697 0 1,969 0 2,430 233 4,632 6,173 0 1 6,174 0 0 5,664 20,167JEFFERSON 2,509 590 1,273 0 438 138 1,849 2,579 130 5 2,714 1,250 90 509 9,511KING 54,249 26,444 13,796 9,737 1,737 624 25,894 63,864 35 40 63,939 901 14,002 14,887 200,316KITSAP 4,876 2,369 4,928 0 172 346 5,446 18,538 0 30 18,568 0 369 5,678 37,306KITTITAS 4,477 5,461 1,721 434 2,282 319 4,756 2,860 0 0 2,860 250 70 1,395 19,269KLICKITAT 518 952 2,430 0 92 343 2,865 1,908 190 0 2,098 72 65 1,130 7,700LEWIS 8,375 7,084 3,110 0 76 301 3,487 6,911 1,381 8 8,300 0 87 1,636 28,969LINCOLN 285 1,460 3,816 0 192 403 4,411 585 0 4 589 0 2 422 7,169MASON 4,232 0 2,055 0 720 283 3,058 6,603 475 75 7,153 251 2 445 15,141OKANOGAN 1,293 925 3,325 0 0 439 3,764 2,643 20 10 2,673 743 39 188 9,625PACIFIC 2,586 415 1,228 0 360 120 1,708 2,383 415 5 2,803 0 12 284 7,808PEND OREILLE 524 1,150 1,435 0 600 169 2,204 1,260 200 1 1,461 0 240 462 6,041PIERCE 21,597 5,371 9,604 5,706 448 779 16,537 36,723 188 0 36,911 473 4,620 17,885 103,394SAN JUAN 300 65 887 0 1,000 93 1,980 1,650 1 5 1,656 0 67 3,151 7,219SKAGIT 8,478 4,539 2,621 569 0 388 3,578 8,938 250 35 9,223 300 1,939 1,418 29,475SKAMANIA 3,000 0 814 0 0 96 910 1,061 100 3 1,164 1,100 45 69 6,288SNOHOMISH 9,688 7,490 9,261 1,850 730 581 12,422 41,240 250 150 41,640 917 224 17,880 90,261SPOKANE 13,763 4,271 9,984 1,316 592 980 12,872 12,700 0 0 12,700 0 886 12,043 56,535STEVENS 3,000 780 3,337 0 1,273 500 5,110 3,439 350 2 3,791 140 40 85 12,946THURSTON 9,242 2,131 4,450 849 1,010 387 6,696 13,952 300 17 14,269 0 338 1,157 33,833WAHKIAKUM 560 1 800 0 80 80 960 320 150 1 471 0 0 591 2,583WALLA WALLA 7,200 1,993 2,622 0 963 419 4,004 3,900 12 30 3,942 1 0 1,431 18,571WHATCOM 8,708 1,604 3,629 40 0 393 4,062 12,827 200 25 13,052 800 39 2,236 30,501WHITMAN 1,816 1,879 3,749 0 1,851 450 6,050 1,735 0 20 1,755 0 60 7 11,567YAKIMA 1,850 955 5,198 3,239 1,376 800 10,613 9,706 0 0 9,706 1,427 0 11,146 35,697TOTALS 230,239 111,801 136,043 31,802 32,156 13,826 213,827 329,557 7,356 851 337,764 11,557 24,067 123,867 1,053,122
% OF TOTAL 21.9% 10.6% 12.9% 3.0% 3.1% 1.3% 20.3% 31.3% 0.7% 0.1% 32.1% 1.1% 2.3% 11.7%

Table D
ANTICIPATED COUNTY ROAD FUND EXPENDITURES2004 BUDGETS (thousands of dollars)
MAINT. ADMIN. BOND ENDCOUNTY CONST. & & FACIL. FERRY REIMB. WARRANT OTHER SUB FUND GRAND
PRES. OPER. RET'T TOTAL CASH TOTAL
ADAMS 1,659 4,312 976 0 0 40 0 79 7,066 0 7,066ASOTIN 1,991 1,651 459 0 0 0 0 20 4,121 828 4,949BENTON 10,887 2,506 929 0 0 1,415 0 3,161 18,898 0 18,898CHELAN 4,053 6,199 1,335 1,225 0 0 3 199 13,014 1,763 14,777CLALLAM 5,010 5,051 1,845 0 0 104 0 676 12,686 6,306 18,992CLARK 44,381 16,071 8,861 68 0 0 0 3,080 72,461 0 72,461COLUMBIA 2,552 1,471 235 0 0 0 0 436 4,694 149 4,843COWLITZ 7,586 6,158 1,925 124 0 0 0 650 16,443 2,512 18,955DOUGLAS 4,649 4,566 967 109 0 83 394 1,780 12,548 495 13,043FERRY 100 2,299 506 0 0 133 0 15 3,053 400 3,453FRANKLIN 4,543 3,000 850 70 0 115 164 0 8,742 0 8,742GARFIELD 1,591 1,258 420 0 0 5 0 1 3,275 1,604 4,879GRANT 8,175 7,419 1,040 0 0 100 28 4,134 20,896 12,835 33,731
GRAYS HARBOR 9,345 6,460 1,377 0 0 800 0 1,918 19,900 541 20,441ISLAND 9,349 6,303 1,669 29 0 80 178 2,559 20,167 0 20,167JEFFERSON 2,192 3,597 764 0 0 90 44 842 7,529 1,982 9,511KING 141,518 35,538 14,138 2,792 0 6,330 0 0 200,316 0 200,316KITSAP 7,916 8,772 1,683 0 0 702 0 12,843 31,916 5,390 37,306KITTITAS 8,741 3,624 1,074 0 0 71 0 101 13,611 5,658 19,269KLICKITAT 3,925 2,441 495 4 0 20 752 63 7,700 0 7,700LEWIS 9,074 8,051 1,221 0 0 0 0 2,538 20,884 8,085 28,969LINCOLN 1,680 3,469 947 0 0 341 0 210 6,647 522 7,169MASON 7,942 4,573 1,334 0 0 0 0 903 14,752 389 15,141OKANOGAN 1,249 6,830 1,387 0 0 0 26 133 9,625 0 9,625PACIFIC 1,706 4,046 466 0 0 17 0 401 6,636 1,172 7,808PEND OREILLE 2,094 2,516 399 0 0 0 202 370 5,581 460 6,041PIERCE 38,326 19,954 20,495 19,865 2,509 0 202 2,043 103,394 0 103,394SAN JUAN 2,178 2,868 665 0 0 67 0 1,138 6,916 303 7,219SKAGIT 5,943 6,773 5,190 314 959 5,063 0 0 24,242 5,233 29,475
SKAMANIA 453 3,227 0 0 0 0 0 35 3,715 2,573 6,288SNOHOMISH 36,454 26,083 20,810 0 0 6,355 559 0 90,261 0 90,261SPOKANE 17,467 13,692 3,905 0 0 2,010 0 8,053 45,127 11,408 56,535STEVENS 3,713 5,642 894 0 0 35 0 662 10,946 2,000 12,946THURSTON 7,912 12,713 9,441 0 0 205 0 573 30,844 2,989 33,833WAHKIAKUM 624 820 190 0 610 10 0 329 2,583 0 2,583WALLA WALLA 4,391 4,111 1,197 223 0 1,350 0 50 11,322 7,249 18,571WHATCOM 13,657 11,100 4,824 0 1,322 150 0 40 31,093 (592) 30,501WHITMAN 5,664 4,710 1,019 0 0 0 0 174 11,567 0 11,567YAKIMA 22,388 8,083 2,798 0 0 0 992 689 34,950 747 35,697TOTALS 463,078 277,957 118,730 24,823 5,400 25,691 3,544 50,898 970,121 83,001 1,053,122
% OF TOTAL 44.0% 26.4% 11.3% 2.4% 0.5% 2.4% 0.3% 4.8% 92.1% 7.9%

Table E
COUNTY ROAD LEVY SUMMARYAs shown in 2004 Budgets
(thousands of dollars)
(RCW 36.33.220)Revenue Actual Traffic Policing expense paid by: Revenue
COUNTY VALUATION Produced by Levy Remaining Full Levy Revenue Payment Transfer County Road Property Tax in $2.25/$1,000 Produced Diversion for Out Expenditures for Other Purposes Road Fund
Services
ADAMS 698,827 1,572 1,101 75 1,026ASOTIN 594,916 1,339 686 686BENTON 2,206,718 4,965 3,959 383 3,576CHELAN 2,787,313 6,271 4,717 4,717CLALLAM 3,077,979 6,925 5,066 262 4,805CLARK 13,238,337 29,786 27,860 2,195 25,665COLUMBIA 179,697 404 403 40 Divert - S. Waste/Cur. Exp. 210 153COWLITZ 3,677,294 8,274 7,722 671 7,051DOUGLAS 1,315,813 2,961 2,961 2,961FERRY 334,309 752 752 Divert - Cur. Exp. 600 152FRANKLIN 1,006,333 2,264 1,999 1,999GARFIELD 97,630 220 197 197GRANT 2,583,156 5,812 5,812 195 5,617GRAYS HARBOR 1,683,695 3,788 3,788 200 3,588ISLAND 6,571,882 14,787 6,062 416 Transfer -Trails/Pub. Wks. 1,334 4,312JEFFERSON 2,186,730 4,920 2,937 363 2,573KING 36,005,263 81,012 64,532 3,134 61,398KITSAP 10,912,777 24,554 20,512 1,913 18,599KITTITAS 1,701,253 3,828 2,749 85 2,665KLICKITAT 1,000,165 2,250 1,977 1,977LEWIS 3,588,917 8,075 7,485 579 6,906LINCOLN 588,470 1,324 790 210 580MASON 3,594,982 8,089 7,401 378 Divert - Indirect Costs 421 6,602OKANOGAN 1,499,473 3,374 2,639 133 2,506PACIFIC 1,191,527 2,681 2,292 283 2,009PEND OREILLE 619,700 1,394 1,381 1,381PIERCE 21,101,449 47,478 45,653 8,928 * Payment - Admin. Refund 57 36,669SAN JUAN 4,245,153 9,552 2,164 514 1,651SKAGIT 4,951,571 11,141 9,800 733 9,068SKAMANIA 653,471 1,470 1,061 1,061SNOHOMISH 23,879,820 53,730 41,742 1,813 39,929SPOKANE 6,947,091 15,631 12,784 1,000 11,784STEVENS 1,762,907 3,967 3,439 3,439THURSTON 8,238,121 18,536 14,950 1,000 13,950WAHKIAKUM 238,241 536 355 355WALLA WALLA 1,702,717 3,831 3,810 48 3,762WHATCOM 6,468,831 14,555 13,506 707 12,799WHITMAN 793,131 1,785 1,735 70 1,664YAKIMA 4,447,521 10,007 10,007 10,007
TOTALS 188,373,176 423,840 348,789 9,059 13,235 4,032 2,622 319,840* Increased by voter approval (RCW 84.55.050)

Table F
COUNTY ROAD MILEAGE - 1/1/04
URBAN ROADS RURAL ROADS SYSTEM PAVED PAVEDCOUNTY CENTERLINE ARTERIAL ARTERIAL UNPAVED
ACCESS ARTERIAL TOTAL ACCESS ARTERIAL TOTAL TOTAL C/L MILES LANE-MILES C/L MILES
ADAMS 1,106.64 668.84 1,775.47 1,775.47 545.48 1,091.71 1,127.13ASOTIN 58.49 19.48 77.98 168.00 152.07 320.07 398.05 95.06 195.59 242.72BENTON 98.38 38.79 137.17 428.82 313.76 742.58 879.74 303.36 607.20 271.58CHELAN 34.95 20.68 55.63 395.63 218.68 614.31 669.94 238.86 479.02 133.01CLALLAM 18.79 7.72 26.51 339.72 123.45 463.17 489.68 131.17 262.20 3.31CLARK 366.97 197.36 564.33 280.84 263.36 544.20 1,108.53 460.22 999.68 45.73COLUMBIA 274.21 229.87 504.08 504.08 137.70 275.39 361.17COWLITZ 52.06 28.64 80.70 258.07 196.10 454.17 534.87 224.74 449.48 10.52DOUGLAS 59.94 39.20 99.14 1,156.61 390.07 1,546.68 1,645.82 295.74 596.85 1,200.10FERRY 508.02 221.86 729.88 729.88 177.87 356.12 527.35FRANKLIN 22.80 12.87 35.67 612.78 342.89 955.67 991.34 341.78 686.12 436.70GARFIELD 234.08 213.62 447.69 447.69 126.86 253.71 315.59GRANT 25.84 17.90 43.74 1,591.03 899.69 2,490.72 2,534.46 831.11 1,672.95 1,163.24GRAYS HARBOR 10.03 7.90 17.93 312.35 221.93 534.28 552.21 224.71 449.42 47.34ISLAND 51.08 22.61 73.69 320.25 192.61 512.87 586.56 215.22 433.70 9.74JEFFERSON 8.88 1.54 10.42 249.12 136.31 385.43 395.85 127.83 256.29 81.01KING 901.81 274.91 1,176.71 439.27 267.40 706.67 1,883.38 542.18 1,151.52 84.84KITSAP 355.81 151.20 507.01 259.84 162.39 422.22 929.23 313.58 634.38 11.59KITTITAS 1.19 3.84 5.03 248.11 306.46 554.57 559.60 306.15 614.61 70.82KLICKITAT 708.22 375.83 1,084.05 1,084.05 330.49 661.08 597.96LEWIS 59.82 19.17 78.99 699.94 273.38 973.32 1,052.32 287.53 575.06 57.95LINCOLN 1,330.77 659.23 1,990.00 1,990.00 373.27 746.53 1,551.29MASON 11.94 5.66 17.60 336.27 266.42 602.69 620.29 261.50 523.21 52.82OKANOGAN 854.07 514.89 1,368.96 1,368.96 404.36 808.85 700.13PACIFIC 217.55 130.12 347.67 347.67 119.57 239.27 51.00PEND OREILLE 368.54 181.22 549.76 549.76 168.35 336.70 256.44PIERCE 599.85 433.39 1,033.24 249.87 251.58 501.45 1,534.69 681.12 1,434.22 38.46SAN JUAN 184.03 86.52 270.55 270.55 86.52 173.04 58.89SKAGIT 40.46 45.12 85.58 403.85 313.96 717.81 803.39 359.08 719.54 37.83SKAMANIA 156.15 86.25 242.40 242.40 86.25 172.97 30.70SNOHOMISH 745.09 205.38 950.46 440.60 285.58 726.19 1,676.65 487.90 1,005.60 14.91SPOKANE 294.10 150.45 444.55 1,447.00 637.32 2,084.32 2,528.87 700.68 1,440.14 1,239.71STEVENS 929.40 562.78 1,492.18 1,492.18 464.28 928.59 855.01THURSTON 244.13 80.09 324.22 441.79 271.05 712.84 1,037.06 351.14 716.74 36.40WAHKIAKUM 58.39 85.18 143.57 143.57 78.81 157.62 17.04WALLA WALLA 49.69 31.26 80.95 444.87 434.23 879.10 960.05 388.45 777.01 388.06WHATCOM 79.99 43.23 123.22 509.38 319.46 828.84 952.06 362.69 728.40 51.09WHITMAN 1,295.79 618.49 1,914.28 1,914.28 417.43 834.86 1,478.75YAKIMA 102.26 92.63 194.89 822.00 674.93 1,496.93 1,691.82 743.75 1,500.82 602.50
STATEWIDE 4,294.35 1,951.01 6,245.35 21,081.86 12,549.76 33,631.62 39,876.97 12,792.78 25,946.20 14,260.40
EASTERN 747.64 427.10 1,174.73 14,924.59 8,616.72 23,541.31 24,716.04 7,391.02 14,863.86 13,519.24WESTERN 3,546.71 1,523.91 5,070.62 6,157.27 3,933.04 10,090.32 15,160.93 5,401.75 11,082.34 741.16Data from County Road Logs certified 1/1/04 by the County Road Administration Board

Table G
COUNTY ARTERIAL PRESERVATION PROGRAM 2003 ACCOMPLISHMENT SUMMARY
1/1/03Eligible Total Total Total CAPP 2003 2003 2003 2003Arterial CAPP CAPP Eligible Contri- Arterial Arterial Total PercentSystem Rec'd Expended Expenses bution Sealcoat Overlay Resurf. System
COUNTY C/Line Resurf'd(miles) ($1,000) ($1,000) ($1,000) (% ) (miles) (miles) (miles)
ADAMS 545.4 586.4 586.4 940.0 62.4 59.8 0.0 59.8 11.0ASOTIN 95.8 105.7 105.7 153.0 69.1 7.0 0.0 7.0 7.3BENTON 304.3 324.9 324.9 1,172.1 27.7 65.1 0.0 65.1 21.4CHELAN 239.1 258.3 258.3 943.4 27.4 24.8 2.2 26.9 11.3CLALLAM 131.5 141.4 141.4 531.7 26.6 9.4 1.0 10.4 7.9CLARK 459.8 526.2 526.2 3,251.0 16.2 30.2 24.5 54.8 11.9COLUMBIA 137.7 146.1 146.1 211.9 68.9 15.0 0.0 15.0 10.9COWLITZ 225.3 240.7 240.7 444.8 54.1 17.8 0.4 18.2 8.1DOUGLAS 295.7 332.0 332.0 389.0 85.3 19.7 0.0 19.7 6.7FERRY 177.6 191.2 191.2 191.2 100.0 3.7 0.0 3.7 2.1FRANKLIN 341.1 373.1 0.0 213.5 0.0 25.6 0.0 25.6 7.5GARFIELD 121.1 131.4 131.4 308.5 42.6 25.1 0.1 25.1 20.7GRANT 830.8 890.4 934.9 1,221.3 76.5 119.9 0.0 119.9 14.4GRAYS HARBOR 224.7 241.5 241.5 466.3 51.8 18.9 0.0 18.9 8.4ISLAND 214.0 232.0 232.0 1,286.9 18.0 14.6 10.7 25.3 11.8JEFFERSON 127.8 137.8 129.0 127.0 101.6 4.8 0.0 4.8 3.8KING 542.8 622.9 622.9 2,840.0 21.9 0.0 22.8 22.8 4.2KITSAP 313.6 340.9 341.0 823.0 41.4 2.4 6.7 9.1 2.9KITTITAS 306.5 329.4 0.0 753.6 0.0 38.4 0.0 38.4 12.5KLICKITAT 318.4 340.9 340.9 865.6 39.4 24.5 1.0 25.5 8.0LEWIS 289.3 310.4 310.4 1,595.6 19.5 21.9 10.1 32.0 11.1LINCOLN 373.3 401.4 401.4 946.3 42.4 35.2 0.0 35.2 9.4MASON 261.9 282.7 282.7 507.0 55.8 0.0 7.4 7.4 2.8OKANOGAN 403.5 430.7 430.7 777.7 55.4 54.3 0.0 54.3 13.4PACIFIC 118.6 127.6 7.6 833.9 0.9 17.6 5.4 23.0 19.4PEND OREILLE 156.9 168.6 168.6 330.8 51.0 37.0 0.0 37.0 23.6PIERCE 683.4 775.8 775.8 1,834.5 42.3 40.6 4.1 44.8 6.6SAN JUAN 86.5 93.9 93.9 145.0 64.8 6.5 0.0 6.5 7.5SKAGIT 358.8 386.4 386.4 460.3 83.9 27.0 0.0 27.0 7.5SKAMANIA 86.2 95.7 0.0 327.5 0.0 3.0 0.8 3.8 4.4SNOHOMISH 485.9 536.4 536.4 2,175.0 24.7 37.0 6.9 43.9 9.0SPOKANE 824.2 970.0 970.0 3,370.1 28.8 72.8 4.1 76.8 9.3STEVENS 464.3 499.2 499.2 533.0 93.7 0.0 39.3 39.3 8.5THURSTON 351.4 387.3 387.3 1,891.8 20.5 15.1 14.0 29.1 8.3WAHKIAKUM 78.8 84.7 84.7 117.7 72.0 9.0 0.0 9.0 11.4WALLA WALLA 388.7 418.0 418.0 489.0 85.5 29.0 0.0 29.0 7.5WHATCOM 362.7 390.9 390.9 2,375.5 16.5 19.8 0.0 19.8 5.5WHITMAN 417.4 445.4 542.9 637.3 85.2 14.1 8.1 22.2 5.3YAKIMA 742.8 815.9 815.9 1,269.0 64.3 32.3 5.1 37.5 5.0TOTALS 12,887.5 14,114.0 13,329.2 37,750.9 35.3% 998.6 174.8 1,173.4* Additional CAPP Funds expended from previous years. AVERAGE 9.4

Table H
COUNTY FREIGHT AND GOODS SYSTEM
COUNTY Freight and Goods System - Truck Route Class Total Total %T-1 T-2 T-3 T-4 T-5 FGTS Adequate Adequate
ADAMS 0.530 31.575 346.570 204.570 583.245 176.989 30.3%ASOTIN 0.150 22.999 19.976 43.125 34.147 79.2%BENTON 116.958 126.981 85.338 329.277 86.149 26.2%CHELAN 33.620 39.820 51.670 125.110 36.130 28.9%CLALLAM 34.470 100.050 9.990 144.510 3.310 2.3%CLARK 5.170 29.490 50.310 5.320 90.290 57.580 63.8%COLUMBIA 10.303 49.829 147.074 207.206 25.534 12.3%COWLITZ 80.620 57.570 3.000 141.190 113.210 80.2%DOUGLAS 7.570 84.370 171.550 263.490 155.650 59.1%FERRY 108.860 106.320 215.180 22.810 10.6%FRANKLIN 103.740 162.110 252.340 518.190 329.240 63.5%GARFIELD 10.130 117.275 127.405 112.195 88.1%GRANT 10.460 273.460 263.540 310.230 857.690 113.040 13.2%GRAYS HARBOR 1.031 212.011 7.210 220.252 188.764 85.7%ISLAND 14.938 27.440 0.370 42.748 42.718 99.9%JEFFERSON 40.810 33.160 73.970 63.010 85.2%KING 24.210 31.721 296.301 117.991 470.223 448.665 95.4%KITSAP 2.938 5.882 30.278 3.870 42.968 0.925 2.2%KITTITAS 6.400 203.740 72.606 6.080 288.826 260.716 90.3%KLICKITAT 174.810 111.370 286.180 7.630 2.7%LEWIS 140.466 205.459 48.715 394.640 230.434 58.4%LINCOLN 99.490 57.120 94.257 250.867 69.680 27.8%MASON 40.120 81.910 1.460 123.490 2.060 1.7%OKANOGAN 106.121 110.195 182.006 398.322 84.422 21.2%PACIFIC 134.599 134.599 17.379 12.9%PEND OREILLE 37.987 118.222 52.896 209.105 29.040 13.9%PIERCE 6.980 17.150 239.550 29.340 7.700 300.720 37.200 12.4%SAN JUAN 43.188 52.631 95.819 66.068 69.0%SKAGIT 12.808 205.939 21.841 240.588 112.296 46.7%SKAMANIA 23.402 58.616 82.018 80.368 98.0%SNOHOMISH 4.931 5.435 315.721 132.423 52.664 511.174 320.917 62.8%SPOKANE 26.600 321.360 249.870 112.670 710.500 584.490 82.3%STEVENS 145.650 190.840 336.490 12.800 3.8%THURSTON 1.141 170.968 34.906 4.131 211.146 23.467 11.1%WAHKIAKUM 12.000 2.670 10.830 25.500 12.170 47.7%WALLA WALLA 71.925 287.494 359.419 4.316 1.2%WHATCOM 109.800 94.390 204.190 73.110 35.8%WHITMAN 2.890 37.974 253.599 294.463 37.044 12.6%YAKIMA 8.660 395.560 140.110 69.640 613.970 595.890 97.1%TOTAL 44.229 157.458 4,329.510 3,786.843 2,250.055 10,568.095 4,671.563 44.2%County Road Log Certified 1/1/2004 Adequacy defined by Cost Responsibility Study - All Weather Roads