Embed Size (px)
Citation preview

Warrants for Exclusive Left Turn Lanes at Unsignalized
Intersections and Driveways Dr. John N. Ivan, PI
Dr. Adel W. Sadek, Co PI Hongmei Zhou Surang Ranade
Prepared for
The New England Transportation Consortium February 12, 2009
NETCR72 Project No. 05-7 This report, prepared in cooperation with the New England Transportation Consortium, does not constitute a standard, specification, or regulation. The contents of this report reflect the views of the authors who are responsible for the facts and the accuracy of the data presented herein. The contents do not necessarily reflect the views of the New England Transportation Consortium or the Federal Highway Administration.

ACKNOWLEDGMENTS
The following are the members of the Technical Committee that developed the scope of work for the project and provided technical oversight throughout the course of the research:
Bernard Byrne, Vermont Agency of Transportation, Chairman Eric Feldblum, Connecticut Department of Transportation Stephen Landry, Maine Department of Transportation John McAvoy, Federal Highway Administration, Rhode Island Division Office William Oldenburg, New Hampshire Department of Transportation Robert Rocchio, Rhode Island Department of Transportation
ii
Technical Report Documentation Page 1. Report No. NETCR72
2. Government Accession No.
N/A 3. Recipient’s Catalog No.
N/A
4. Title and Subtitle
5. Report Date
February 12, 2009 6. Performing Organization Code
N/A 7. Author(s) 8. Performing Organization Report No.
Dr. John N. Ivan, PI Dr. Adel W. Sadek, Co PI Hongmei Zhou Surang Ranade
NETCR72
9. Performing Organization Name and Address 10 Work Unit No. (TRAIS)
Department of Civil and Environmental Engineering, University of Connecticut, Storrs, CT 06269
N/A
11. Contract or Grant No.
N/A 13. Type of Report and Period Covered
12. Sponsoring Agency Name and Address
New England Transportation Consortium C/O Advanced Technology & Manufacturing Center University of Massachusetts Dartmouth 151 Martine Street Fall River, MA 02723
14. Sponsoring Agency Code
NETC 05-7 A study conducted in cooperation with the U.S. DOT
15 Supplementary Notes
N/A 16. Abstract
Accommodating left turns at unsignalized intersections is one of the most challenging problems in traffic engineering. Over the last forty years, a small number of studies developed guidelines for traffic engineers to help in deciding when a left turn lane is warranted for a given situation. Building on these previous attempts, this report describes the development of a refined decision support system (DSS) for assessing the likely benefits of left-turn lane installations as an aid to deciding whether a left-turn lane is warranted. The developed DSS is designed to predict these likely benefits based on several measures including delay savings, reductions in percent stops, increases in fuel efficiency, and reductions in emissions. The first step in developing the DSS was to use microscopic simulation to model several real-world unsignalized intersections with different geometric configurations and located in different area types. After carefully calibrating these models, several scenarios covering a wide range of operational conditions were simulated. The output from these simulation runs was then used to train a set of Multi-layer Perceptron Neural Networks (NNs), and to generalize the results from the models’ runs. The NNs were then incorporated into a DSS that can help an analyst quantify the impacts of a proposed new development as well as estimate the benefits of left-turn lane installations.
The report also presents an investigation of the safety effects of exclusive left turn lane installation at unsignalized intersections. Crash prediction models were estimated using crash and volume data from intersections without left turn lanes by intersection category and crash category. Intersections throughout Connecticut were selected, representing six different types of intersections based on rural versus urban location, number of approach legs and number of through lanes on the main road. Negative binomial modeling was used with generalized estimation equations to account for the correlation among the crash counts for an intersection through the years. The expected number of crashes was predicted using the prediction models for intersections with left turn lanes assuming no left turn lanes were present. If the observed crash counts were significantly lower than the predicted, then there was evidence that the left turn lane created a safer condition. The results of comparing the observed and predicted crashes showed that the intersections were safer for same direction crashes when left turn lanes were installed, except for those on urban two lane roads, at which no ty effect is discernable. safe17. Key Words Left turn lanes, volume warrants, safety, design,
18. Distribution Statement
No restrictions. This document is available to the public through the National Technical Information Service, Springfield, Virginia 22161.
19. Security Classif. (of this report) Unclassified
20. Security Classif. (of this page)
Unclassified 21. No. of Pages
22. Price
N/A Form DOT F 1700.7 (8-72) Reproduction of completed page authorized
Warrants for Exclusive Left Turn Lanes at Unsignalized Intersections and Driveways
FINAL REPORT
133
iii

iv

NETC 05-7 Warrants for Exclusive Left Turn Lanes at Unsignalized Intersections and Driveways
Executive Summary
The objectives of this project were to develop warrants for installing exclusive left turn lanes (LTL) at unsignalized intersections and driveways considering operations and safety. The operational warrants were developed by determining the volume at which the average delay or the number of stops becomes unacceptable without a LTL. Safety was considered by investigating the conditions under which a LTL improves the safety of the intersection. A second objective was to learn how to design exclusive LTL at unsignalized intersections and driveways to make them safer. The project was motivated by the following concerns: left turning vehicles waiting in the through lane impose potentially unacceptable delay on through vehicles that can be avoided by installing a LTL, and left turning vehicles waiting in the through lane are exposed to the potential for being struck by through vehicles. The question to be answered is “when do conditions warrant a LTL based on each factor?”
For the operational analysis, microscopic simulation models were developed for a representative set of real-world unsignalized intersections with different geometric configurations (i.e. two and four lanes) and different locations (i.e. urban, suburban, and rural). The selected intersections were videotaped during the peak hour and the following data were extracted:
• Advancing, opposing and left turning volumes • Basic geometric information • Discharge headway from a queue; • Average & maximum queue length • Stopped delay at the subject link; and • Gap acceptance behavior
The following parameters were adjusted to calibrate the models: queue discharge headway, gap acceptance behavior, and vehicle entry distribution. Calibration aimed to match the following measures of effectiveness (MOE): stopped delay at the subject link, the average queue on the subject link and the maximum queue on the subject link.
The calibrated models were run 150 times for different volume and speed combinations, with the output used to train two separate neural networks for two cases: one with a left turn lane and the second one without. The NN training results were used to generate warrants based on two criteria: control delay and the number of stops in the advancing traffic stream. Then a decision support system (DSS) was developed using artificial neural networks for predicting the likely benefits of left-turn installations. From this analysis, new warrants were developed and compared against the existing ones endorsed by AASHTO. These warrants are presented in the report as a series of graphs indicating thresholds above which a LTL is warranted. Also, a series of graphs is provided to illustrate the expected benefits of a LTL in different scenarios.
The objectives of the safety analysis were to examine the safety effects of LTL at unsignalized intersections and driveways, and in particular to answer the following questions:
• Where does a LTL significantly reduce accidents? • Where does a LTL have no appreciable effect on accidents? • Is there any conflict between these findings and those of the operational analysis?
Intersections were selected to represent all combinations of the following criteria: (1) with and without LTL (Y or N), rural and urban/suburban areas (R or U), two-lane and four-lane roads (2 or 4), T- and four-way intersections (T or X). The crash counts observed at intersections with LTL were compared to counts predicted using crash prediction models estimated for intersections without LTL. Differences between what was observed with a LTL and what was predicted without are then used to identify the potential safety effects of installing LTL.
A sample of intersections was selected from roads in Connecticut using the Connecticut Department of Transportation (ConnDOT) photolog system. For each combination, a target of five intersections with LTL for study and fifty intersections without LTL for estimating the prediction functions were selected. Data were collected from ConnDOT archives describing crashes within 250 ft of the intersection and the Annual Average Daily Traffic (AADT) on the main road for ten years from 1995 to 2004. Intersections on four-lane rural roads were not studied because there were not enough intersections available from which to select. Statistical models were estimated for predicting same direction crashes and injury and fatal crashes. We focused on these crash subsets because same direction crashes are the category expected to be reduced by having a LTL, and because injury and fatal crashes have more severe consequences and are therefore of greater interest for crash reduction.
v

NETC 05-7 Warrants for Exclusive Left Turn Lanes at Unsignalized Intersections and Driveways
The models were estimated using negative binomial regression, which permits estimation of a dispersion parameter (k) that represents how much the variance of expected crashes differs from the mean. We also used a repeated measures framework, in which each year of data was considered a separate observation. This required that we also use the Generalized Estimating Equations procedure to account for potential correlation among years at the same site. The results were the following:
• For four-leg intersections on rural two-lane roads and three-leg intersections on urban four-lane roads, there is strong evidence that installing a LTL will reduce rear-end crashes.
• For three-leg intersections on rural two-lane roads and four-leg intersections on urban four-lane roads, there is some evidence that installing a LTL will reduce rear-end crashes.
• For three-leg and four-leg intersections on urban two-lane roads, there is no evidence that installing a LTL will reduce rear-end crashes.
In no situations was it found that installing a LTL is likely to increase the number of rear-end crashes. The results for injury and fatal crashes are similar.
Physical intersection characteristics were also examined to identify how their characteristics affect safety with and without left turn lanes. It was found that LTL safety benefits are limited when taper and storage length are short, multiple driveways use the same LTL and other geometric features increase the crash potential (e.g., horizontal curves). Consequently, it is recommended to follow AASHTO guidelines for taper and storage length and avoid designing the LTL to serve multiple driveways. These situations can likely lead to confusion for drivers behind the left turning vehicle as to where the turn will be made. In any case, the benefits of a left turn lane will be difficult to achieve under these conditions.
In conclusion, there is no contradiction between the operational and safety findings. That is, there are no cases where the volume warrants suggest a LTL but safety analysis recommends none. It is, however, possible that a LTL may not be warranted by volume, but it could improve safety substantially. The recommendation therefore is that a LTL should be considered at all four-leg intersections on rural two-lane roads and three-leg intersections on urban four-lane roads on the basis of safety irrespective of whether or not the LTL is warranted on the basis of traffic volume. At other locations, the warrants in the report should be followed.
vi
NETC 05-7 Warrants for Exclusive Left Turn Lanes at Unsignalized Intersections and Driveways
Table of Contents
EXECUTIVE SUMMARY .......................................................................................................................... V
TABLE OF CONTENTS .......................................................................................................................... VII
LIST OF FIGURES..................................................................................................................................... IX
LIST OF TABLES....................................................................................................................................... XI
LIST OF SYMBOLS AND ACRONYMS ............................................................................................... XII
1 INTRODUCTION ......................................................................................................................... 1
1.1 BACKGROUND AND MOTIVATION ............................................................................................. 1 1.2 OBJECTIVES AND SCOPE ........................................................................................................... 1 1.3 OUTLINE OF REPORT ................................................................................................................ 1
2 LITERATURE REVIEW ............................................................................................................. 3
2.1 HARMELINK’S STUDY .............................................................................................................. 3 2.2 KIKUCHI AND CHAKRABORTY STUDY ...................................................................................... 4
2.2.1 Probability criteria as suggested by Harmelink .................................................................. 4 2.2.2 Delay to Through Vehicles as a Warrant Criteria ............................................................... 6 2.2.3 Degradation of Level of Service from A to B as a Warrant Criteria ................................... 7
2.3 FITZPATRICK, BREWER AND PARHAM ...................................................................................... 7 2.4 VIRGINIA TRANSPORTATION RESEARCH COUNCIL STUDY ........................................................ 9 2.5 NCHRP REPORT 279................................................................................................................ 9 2.6 OTHER STUDIES ...................................................................................................................... 10 2.7 SAFETY IMPLICATIONS ........................................................................................................... 10 2.8 SIMULATION MODELING ........................................................................................................ 12
2.8.1 CORSIM ............................................................................................................................ 13 2.8.2 SCRIPT TOOL ................................................................................................................... 13
3 VOLUME WARRANTS: METHODOLOGY .......................................................................... 14
3.1 GENERAL APPROACH ............................................................................................................. 14 3.2 SITE SELECTION ..................................................................................................................... 15 3.3 DATA COLLECTION AND REDUCTION ..................................................................................... 15
3.3.1 Gap acceptance distribution data ...................................................................................... 17 3.4 SIMULATION MODEL DEVELOPMENT AND CALIBRATION ....................................................... 19 3.5 DEVELOPMENT OF DECISION SUPPORT SYSTEM ..................................................................... 19
3.5.1 Generation of the Different Operational Scenarios ........................................................... 19 3.5.2 Neural Network Development, Training and Testing ........................................................ 22
3.6 APPLICATIONS AND DISCUSSION ............................................................................................ 23
4 VOLUME WARRANTS: DEVELOPMENT ........................................................................... 26
4.1 URBAN TWO-LANE ROADS .................................................................................................... 27 4.1.1 Total Delay ........................................................................................................................ 27 4.1.2 Number of Stops ................................................................................................................. 30 4.1.3 Comparison between Criteria ............................................................................................ 33
4.2 RURAL TWO-LANE ROADS ..................................................................................................... 35 4.2.1 Total Delay ........................................................................................................................ 35 4.2.2 Number of Stops ................................................................................................................. 35 4.2.3 Comparison between Criteria ............................................................................................ 35
4.3 URBAN FOUR-LANE ROADS ................................................................................................... 37 4.3.1 Total Delay ........................................................................................................................ 37 4.3.2 Number of Stops ................................................................................................................. 38
4.4 COMPARISON AMONG ROAD CATEGORIES ............................................................................. 38
5 SAFETY ANALYSIS: METHODOLOGY ............................................................................... 40
5.1 GENERAL STUDY APPROACH ................................................................................................. 40
vii

NETC 05-7 Warrants for Exclusive Left Turn Lanes at Unsignalized Intersections and Driveways
viii
5.2 SELECTION OF STUDY SITES ................................................................................................... 40 5.3 COMPILATION OF DATA .......................................................................................................... 41 5.4 NEGATIVE BINOMIAL MODELING ........................................................................................... 43 5.5 SAFETY PERFORMANCE FUNCTIONS ....................................................................................... 44
5.5.1 Model Specification ........................................................................................................... 45 5.5.2 By Crash Category ............................................................................................................. 45 5.5.3 By Crash Severity............................................................................................................... 46
5.6 PREDICTION AND COMPARISON .............................................................................................. 47 5.7 CONSIDERATION OF PHYSICAL CHARACTERISTICS ................................................................. 48
6 SAFETY ANALYSIS: RESULTS .............................................................................................. 49
6.1 SAFETY PERFORMANCE FUNCTIONS ....................................................................................... 49 6.1.1 By Crash Category ............................................................................................................. 49 6.1.2 By Crash Severity............................................................................................................... 55
6.2 ASSESSMENT OF PHYSICAL CHARACTERISTICS ...................................................................... 59
7 CONCLUSIONS AND FUTURE RESEARCH DIRECTIONS .............................................. 60
7.1 DEVELOPMENT OF VOLUME WARRANTS ................................................................................ 60 7.2 SAFETY ANALYSIS .................................................................................................................. 60
REFERENCES ............................................................................................................................................ 62
APPENDIX A: LEFT TURN LANE WARRANTS ................................................................................. 64
APPENDIX B: BENEFITS OF LEFT TURN LANE INSTALLATION ............................................... 69
APPENDIX C: CRASH PREDICTION MODEL FIT STATISTICS .................................................... 97
APPENDIX D: SPF ESTIMATES ........................................................................................................... 102
APPENDIX E: PHYSICAL CHARACTERISTICS OF INTERSECTIONS ...................................... 118

NETC 05-7 Warrants for Exclusive Left Turn Lanes at Unsignalized Intersections and Driveways
List of Figures FIGURE 2.1: WARRANTS DEVELOPED BY KIKUCHI AND CHAKRABORTY BASED ON THE AVERAGE DELAY TO
THROUGH VEHICLES AS WARRANT CRITERIA .......................................................................................... 7 FIGURE 2.2: WARRANTS DEVELOPED BY KIKUCHI AND CHAKRABORTY (1991) BASED ON THE DEGRADATION
OF LEVEL OF SERVICE FROM A TO B AS WARRANT CRITERIA .................................................................. 8 FIGURE 2.3: COMPARISON OF THE HARMELINK’S WARRANTS AND MODIFIED HARMELINK’S WARRANTS ...... 8 FIGURE 2.4: WARRANTS DEVELOPED BY FITZPATRICK, BREWER AND PARHAM .............................................. 9 FIGURE 2.5: LEFT TURN LANE WARRANTS BY VTRC .................................................................................... 10 FIGURE 2.6: WARRANTS DEVELOPED IN NCHRP REPORT 279 ...................................................................... 11 FIGURE 2.7: WARRANTS DEVELOPED BY OPENLANDER AND BIANCHI FOR 30 MPH OPERATING SPEED ......... 12 FIGURE 3.1: STEPS IN THE STUDY METHODOLOGY......................................................................................... 14 FIGURE 3.2: LOCATION OF SELECTED INTERSECTIONS ................................................................................... 16 FIGURE 3.3: TYPICAL LAYOUT OF T-INTERSECTIONS ..................................................................................... 17 FIGURE 3.4: GAP ACCEPTANCE DISTRIBUTIONS FOR THE DIFFERENT SITES ................................................... 18 FIGURE 3.5: A SIMULATION MODEL OF THE INTERSECTION OF WILLISTON ROAD AND COMMERCE STREET 19 FIGURE 3.6: RESULTS OF THE CALIBRATION PROCEDURE (STOPPED DELAY) ................................................ 20 FIGURE 3.7: RESULTS OF THE CALIBRATION PROCEDURE (QMAX) ................................................................ 20 FIGURE 3.8: RESULTS OF THE CALIBRATION PROCEDURE (QAVG) ................................................................. 21 FIGURE 3.9: THE NEURAL NETWORK USED IN THE STUDY ............................................................................. 22 FIGURE 3.10: RESULT OF NEURAL NETWORK TESTING FOR URBAN TWO-LANE WITHOUT A LEFT TURN LANE
CATEGORY ............................................................................................................................................. 23 FIGURE 3.11: RESULT OF NEURAL NETWORK TESTING FOR URBAN TWO-LANE WITH A LEFT TURN LANE
CATEGORY. ............................................................................................................................................. 24 FIGURE 3.12: LEFT TURN INSTALLATION BENEFITS ....................................................................................... 25 FIGURE 4.1: TOTAL DELAY PLOTTED FOR URBAN TWO-LANE CATEGORY ..................................................... 26 FIGURE 4.2: TOTAL NUMBER OF STOPS PLOTTED FOR URBAN TWO-LANE CATEGORY .................................. 27 FIGURE 4.3: WARRANTS FOR URBAN TWO-LANE CATEGORY FOR OPERATING SPEED 30 MPH ......................... 28 FIGURE 4.4: WARRANTS FOR URBAN TWO-LANE CATEGORY FOR OPERATING SPEED 40 MPH ......................... 28 FIGURE 4.5: WARRANTS FOR URBAN TWO-LANE CATEGORY FOR OPERATING SPEED 50 MPH ......................... 29 FIGURE 4.6: COMPARISON OF THE NEW LEFT TURN LANE WARRANTS WITH DIFFERENT WARRANTS ............... 29 FIGURE 4.7: COMPARISON OF THE NEW LEFT TURN LANE WARRANTS WITH DIFFERENT WARRANTS ............... 30 FIGURE 4.8: WARRANTS FOR URBAN TWO-LANE CATEGORY FOR OPERATING SPEED 30 MPH ......................... 31 FIGURE 4.9: WARRANTS FOR URBAN TWO-LANE CATEGORY FOR OPERATING SPEED 40 MPH ......................... 31 FIGURE 4.10: WARRANTS FOR URBAN TWO-LANE CATEGORY FOR OPERATING SPEED 40 MPH ....................... 32 FIGURE 4.11: COMPARISON OF THE NEW LEFT TURN LANE WARRANTS WITH DIFFERENT WARRANTS ............. 32 FIGURE 4.12: COMPARISON OF THE NEW LEFT TURN LANE WARRANTS WITH DIFFERENT WARRANTS ............. 33 FIGURE 4.13: COMPARISON BETWEEN WARRANTS DEVELOPED USING DIFFERENT CRITERIA ....................... 33 FIGURE 4.14: COMPARISON OF THE WARRANTS DEVELOPED USING DIFFERENT WARRANTS CRITERIA ........ 34 FIGURE 4.15: COMPARISON OF THE WARRANTS DEVELOPED USING DIFFERENT WARRANTS CRITERIA ........ 34 FIGURE 4.16: WARRANTS FOR RURAL TWO-LANE CATEGORY FOR OPERATING SPEED OF 40 MPH ............... 35 FIGURE 4.17: WARRANTS FOR RURAL TWO-LANE CATEGORY FOR OPERATING SPEED OF 40 MPH ............... 36 FIGURE 4.18: COMPARISON OF THE WARRANTS DEVELOPED USING DIFFERENT WARRANTS CRITERIA ........ 36 FIGURE 4.19: WARRANTS FOR THE LEFT TURN LANE FOR THE URBAN FOUR-LANE CATEGORY ................... 37 FIGURE 4.20: WARRANTS FOR THE LEFT TURN LANE FOR THE URBAN FOUR-LANE CATEGORY .................... 38 FIGURE 4.21: COMPARISON OF WARRANTS FOR URBAN TWO-LANE AND RURAL TWO-LANE BASED ON TOTAL
DELAY .................................................................................................................................................... 39 FIGURE 5.1: MODELS FOR THE SIX INTERSECTION CATEGORIES .................................................................... 46 FIGURE 5.2: MODELS FOR FATALITIES AND INJURIES ..................................................................................... 47 FIGURE 6.1: SPF ESTIMATE AND OBSERVED CRASHES FOR R2T INTERSECTIONS WITHOUT LEFT TURN LANES
............................................................................................................................................................... 49 FIGURE 6.2: SPF ESTIMATE AND OBSERVED CRASHES FOR R2T INTERSECTIONS WITH LEFT TURN LANES... 49 FIGURE 6.3: SPF ESTIMATE AND OBSERVED CRASHES FOR R2X INTERSECTIONS WITHOUT LEFT TURN LANES
............................................................................................................................................................... 50 FIGURE 6.4: SPF ESTIMATE AND OBSERVED CRASHES FOR R2X INTERSECTIONS WITH LEFT TURN LANES .. 50 FIGURE 6.5: SPF ESTIMATE AND OBSERVED CRASHES FOR U2T INTERSECTIONS WITHOUT LEFT TURN LANES
............................................................................................................................................................... 51 FIGURE 6.6: SPF ESTIMATE AND OBSERVED CRASHES FOR U2T INTERSECTIONS WITH LEFT TURN LANES .. 51
ix
NETC 05-7 Warrants for Exclusive Left Turn Lanes at Unsignalized Intersections and Driveways
x
FIGURE 6.7: SPF ESTIMATE AND OBSERVED CRASHES FOR U2X INTERSECTIONS WITHOUT LEFT TURN LANES ............................................................................................................................................................... 52
FIGURE 6.8: SPF ESTIMATE AND OBSERVED CRASHES FOR U2X INTERSECTIONS WITH LEFT TURN LANES .. 52 FIGURE 6.9: SPF ESTIMATE AND OBSERVED CRASHES FOR U4T INTERSECTIONS WITHOUT LEFT TURN LANES
............................................................................................................................................................... 53 FIGURE 6.10: SPF ESTIMATE AND OBSERVED CRASHES FOR U4T INTERSECTIONS WITH LEFT TURN LANES 53 FIGURE 6.11: SPF ESTIMATE AND OBSERVED CRASHES FOR U4X INTERSECTIONS WITHOUT LEFT TURN
LANES .................................................................................................................................................... 54 FIGURE 6.12: SPF ESTIMATE AND OBSERVED CRASHES FOR U4X INTERSECTIONS WITH LEFT TURN LANES 54 FIGURE 6.13: SPF AND OBSERVED CRASHES FOR R2T INTERSECTIONS WITHOUT LTL (FATAL AND INJURY
CRASH) ................................................................................................................................................... 55 FIGURE 6.14: SPF AND OBSERVED CRASHES FOR R2T INTERSECTIONS WITH LTL (FATAL AND INJURY
CRASH) ................................................................................................................................................... 55 FIGURE 6.15: SPF AND OBSERVED CRASHES FOR R2X INTERSECTIONS WITHOUT LTL (FATAL AND INJURY
CRASH) ................................................................................................................................................... 56 FIGURE 6.16: SPF AND OBSERVED CRASHES FOR R2X INTERSECTIONS WITH LTL (FATAL AND INJURY
CRASH) ................................................................................................................................................... 56 FIGURE 6.17: SPF AND OBSERVED CRASHES FOR U2X INTERSECTIONS WITHOUT LTL (FATAL AND INJURY
CRASH) ................................................................................................................................................... 56 FIGURE 6.18: SPF AND OBSERVED CRASHES FOR U2X INTERSECTIONS WITH LTL (FATAL AND INJURY
CRASH) ................................................................................................................................................... 57 FIGURE 6.19: SPF AND OBSERVED CRASHES FOR U4T INTERSECTIONS WITHOUT LTL (FATAL AND INJURY
CRASH) ................................................................................................................................................... 57 FIGURE 6.20: SPF AND OBSERVED CRASHES FOR U4T INTERSECTIONS WITH LTL (FATAL AND INJURY
CRASH) ................................................................................................................................................... 57 FIGURE 6.21: SPF AND OBSERVED CRASHES FOR U4X INTERSECTIONS WITHOUT LTL (FATAL AND INJURY
CRASH) ................................................................................................................................................... 58 FIGURE 6.22: SPF AND OBSERVED CRASHES FOR U4X INTERSECTIONS WITH LTL (FATAL AND INJURY
CRASH) ................................................................................................................................................... 58
NETC 05-7 Warrants for Exclusive Left Turn Lanes at Unsignalized Intersections and Driveways
List of Tables TABLE 2.1: PROBABILITY VALUES FOR DIFFERENT OPERATING SPEEDS AS SUGGESTED BY HARMELINK
(1967) ...................................................................................................................................................... 4 TABLE 2.2: AASHTO GUIDELINES FOR LEFT TURN LANES ON TWO-LANE HIGHWAYS ................................... 5 TABLE 2.3: MODIFIED VOLUME WARRANTS BY KIKUCHI AND CHAKRABORTY (1991) BASED ON THE
PROBABILITY CRITERIA AS SUGGESTED BY HARMELINK (1967) .............................................................. 6 TABLE 3.1: DATA DESCRIBING SELECTED INTERSECTIONS ............................................................................ 16 TABLE 3.2: GAP ACCEPTANCE DISTRIBUTION AT WILLISTON ROAD AND COMMERCE STREET...................... 18 TABLE 3.3: REPRESENTATIVE INTERSECTIONS FOR EACH OF THE CATEGORY ................................................. 21 TABLE 4.1: THRESHOLDS SELECTED FOR THE URBAN TWO-LANE CATEGORY ............................................... 27 TABLE 4.2: THRESHOLDS SELECTED FOR THE URBAN TWO-LANE CATEGORY ................................................. 30 TABLE 4.3: THRESHOLDS SELECTED FOR THE URBAN FOUR-LANE CATEGORY .............................................. 37 TABLE 4.4: THRESHOLDS SELECTED FOR THE URBAN FOUR-LANE CATEGORY .............................................. 38 TABLE 5.1: DATA DESCRIBING CRASH STUDY INTERSECTIONS ..................................................................... 41 TABLE 5.2: CRASH TYPE IN CONNDOT’S CRASH DATABASE ........................................................................ 42 TABLE 5.3: NUMBER OF CRASHES BY CATEGORY FOR R2T INTERSECTIONS .................................................. 42 TABLE 5.4: NUMBER OF FATAL AND INJURY CRASHES FOR R2T INTERSECTIONS .......................................... 43 TABLE 6.1: SUMMARY FOR CRASH CATEGORY 1 ........................................................................................... 54 TABLE 6.2: SUMMARY FOR FATAL AND INJURY CRASHES ............................................................................... 59
xi
NETC 05-7 Warrants for Exclusive Left Turn Lanes at Unsignalized Intersections and Driveways
List of Symbols and Acronyms λ - Arrival rate μ - Service rate L - Percentage of left turning volume in the advancing volume VA - Advancing Volume (veh/hour) tw - Average time a left turning vehicle have to wait to find a suitable gap in the opposing stream te - Time required for a left-turning vehicle to clear itself from the advancing queue tA - The median headway of the advancing stream VO - Opposing Volume (veh/hour) tl - Time taken to complete a left-turn maneuver (sec) GC - Critical gap for a particular site (sec) tl - Time taken to complete a left-turn maneuver (sec)
μij - Expected mean of the crashes occurring at intersection i in year j Vij - AADT of the major road of the intersection i in year j AADT – Annual average daily traffic ACTHD - Average delay to through vehicles caught behind the left turning vehicles ALTD - Average delay to left turning vehicles ATD - Average delay to caught and not caught vehicles CCMPO - Chittenden County Metropolitan Planning Organization ConnDOT - Connecticut Department of Transportation DS - Total delay saving per hour as a result of the left turn lane DSS - Decision support system GLIM - Generalized linear modeling MOE’s - Measures of effectiveness NN’s - Neural Networks NTVC - Number of through vehicles caught behind the left turning vehicles R2T - Rural, two-lane, T-intersection R2X - Rural, two-lane, four-leg intersection SPF – Safety performance function TD - Total hourly delay TWLTL - Two-way-left-turn lanes U2T - Urban, two-lane, T- intersection U2X - Urban, two-lane, four-leg intersection U4T - Urban, four-lane, T- intersection U4X - Urban, four-lane, four-leg intersection
xii

NETC 05-7 Warrants for Exclusive Left Turn Lanes at Unsignalized Intersections and Driveways
1 INTRODUCTION
1.1 Background and Motivation Accommodating left turns from main roads is one of the most challenging problems in traffic
engineering. At unsignalized intersections and driveways, when there is no protected left turn signal phasing, vehicles turning left from a main road into a minor street or a driveway must yield to the oncoming traffic stream and wait for a suitable gap to complete the left turn maneuver safely. When an exclusive left turn lane is provided, only the vehicle waiting to make the left turn incurs the resulting delay. However, when such an exclusive left turn lane is not provided, left turning vehicles must wait in the same lane as the through traffic in the same direction, thus causing the through traffic to incur some of the delay (when there are at least two-lane in that direction), or all of the delay (when there is only one lane). Left turning vehicles, waiting for a suitable gap in the oncoming traffic are also exposed to the possibility of being struck by the through vehicles approaching from behind. In addition to that, the desire to avoid this risk may also induce left turning vehicles to choose insufficiently long gaps in the oncoming traffic which might further potentially increase the risk of a crash. Providing an exclusive left turn lane reduces this risk to some extent.
Many agencies which have jurisdiction over arterial roads are faced with the need to install exclusive left turn lanes at unsignalized intersections and driveways, to reduce unnecessary delays to through vehicles and also to reduce the crash risk. This need is most often generated as a consequence of increasing land development along major roads, which increases the number of driveways, and hence, the number of left turns and the resulting delays and crash risk.
At first, it might seem appropriate to install exclusive left turn lanes in all such situations. However, it is also important to remember that such a policy is not financially feasible, as each left turn lane installation requires either widening of the pavement or re-striping of lanes without widening. Widening the pavement obviously involves substantial planning, design, land acquisition and construction costs. Re-striping without widening also involves the costs of losing either a through lane or a portion or all of the shoulder or parking lane. This in turn results in narrower lanes, which again might adversely affect the operational efficiency and safety of the subject link. Moreover, it also can require relocation of storm water collecting devices, which also increases the cost. Thus, the decision about whether to install an exclusive left turn lane or not cannot be taken without detailed analysis of the situation. In traffic engineering, “warrants” are used to help with decisions like this, for example for deciding where to install traffic signals. In this context, the warrant justifies a given action when the specified conditions are met. That action could be the installation of an exclusive left or right turn lane or signalization.
1.2 Objectives and Scope There are two objectives to this research project. The first is to review the left turn lane warrants
currently used by various road authorities; build, calibrate and validate traffic simulation models; develop a decision support system to evaluate likely benefits of installation of left turn lane; and develop new left turn lane warrants based on traffic volume.
The second objective is to examine the safety effects of left turn lane installation. Negative binomial modeling is used to compare the crash experience at intersections with and without left turn lanes, especially noting the contributions of other conditions (e.g., volume level, area type, and roadway geometry). Together with the volume-based warrants, the results consider not only traffic volumes, but also observed safety experience and other pertinent characteristics of the intersection or driveway that affect the overall safety effect of installing the left turn lane.
1.3 Outline of Report In order to clearly explain the fundamental concepts as well as the developed methodologies and
analysis of results in this research project, the report has been assembled as follows: Chapter 1 describes the motivation and objectives and presents the problem statement and objectives. Chapter 2 describes a review of the relevant literature, including not only critically review of previous
attempts at the development of left-turn lane warrants at unsignalized intersections, but also warrants that are currently used by different transportation agencies to evaluate the theoretical background, strengths and limitations. Also included is a review of previous studies related to left turn safety at unsignalized intersections, especially the safety effects of left turn lane installation.
1

NETC 05-7 Warrants for Exclusive Left Turn Lanes at Unsignalized Intersections and Driveways
Chapter 3 describes the methodology for development of volume warrants for left turn lanes, starting with the general study approach followed by description of the different steps followed such as site selection, data collection and reduction, simulation model development and calibration, development of artificial neural networks, and finally, the development of the decision support system.
Chapter 4 describes the development of new left turn lane warrants, based on the models described in Chapter 3, for different road categories such as urban two-lane roads, rural two-lane roads and urban four-lane roads, based on different warrant criteria such as total delay and total number of stops per hour.
Chapter 5 describes the study design of the safety analysis. General study approaches are given. How the study sites are selected is explained as well as the steps of collecting and compilation of data. This chapter also provides the methodology, first with a review of Negative Binomial modeling that was used in modeling the crashes in intersections without left turn lanes. The prediction models are then applied to those intersections with left turn lanes. Safety performance functions are defined to compute the expected number of crashes in intersections with left turn lanes if no left turn lanes were there.
Chapter 6 describes the results of the safety analysis. The expected number of crashes in each intersection is compared with the actual number of crashes occurring there, so the “dangerous” intersections are detected. Pertinent characteristics of intersections with unusual safety experience are considered to identify explanations for the findings.
Chapter 7 summarizes the results and the conclusions of both parts of the study, including suggestions for application and future research.
2

NETC 05-7 Warrants for Exclusive Left Turn Lanes at Unsignalized Intersections and Driveways
2 LITERATURE REVIEW There are several studies carried out in the past which contribute towards the development of left turn
lane warrants. The first major study was carried out by Harmelink (1967), which was followed by another major study by Kikuchi and Chakroborty (1991) which is a major improvement over Harmelink’s study. Another remarkable study was carried out by Fitzpatrick, Brewer and Parham (2003). The most recent study was carried out by Lakkundi et al. (2004). This chapter focuses on these four seminal studies, but also addresses a few more relevant studies about left turn lane operation and safety.
2.1 Harmelink’s Study As mentioned above, the oldest left-turn lane warrants were published by Harmelink (1967). These
warrants are the basis for AASHTO (2001) guidelines for justifying a left-turn lane at an unsignalized intersection. The warrants developed by Harmelink are in the form of sets of different volume combinations, specifically, the advancing volume (VA), the percentage of left-turns in the advancing volume (PL), and the opposing volume (VO). The warrants were developed for the approach speeds of 40, 50 and 60 mph.
The warrants developed by Harmelink try to minimize the conflict between the left turning vehicles and through vehicles approaching from behind. To be specific, these warrants are based on the probability that one or more through vehicles are present in the queue formed by the left-turning vehicles that is waiting for a suitable gap. Harmelink determined values for the maximum allowable probabilities based upon the judgment of a panel of traffic engineers. He then computed the combination of the three volumes (i.e. advancing, left-turn and opposing) for each value of the probabilities suggested by the panel of traffic engineers. This was done analytically on the basis of queuing theory. Specifically, Harmelink’s queuing system assumes that the arriving units are the through vehicles arriving behind the left-turning vehicles, and that the service is the departure of the left-turning vehicles. Given this, Harmelink formulated the arrival rate (λ) and the service rate (μ) of the queuing system as follows:
For the arrival rate, λ:
(2.1)
⎟⎟⎟⎟
⎠
⎞
⎜⎜⎜⎜
⎝
⎛
⎟⎠⎞
⎜⎝⎛
+−=
A
ewa
t
ttVLL
32
))(1(λ
Where, L = Percentage of left turning volume in the advancing volume VA = Advancing Volume (veh/hour) tw = Average time a left turning vehicle have to wait to find a suitable gap in the opposing stream te = Time required for a left-turning vehicle to clear itself from the advancing queue tA = The median headway of the advancing stream
tw, the average time a left turning vehicle must wait to find a suitable gap in the opposing stream which is used in equation 2.1 can be calculated using equation 2.2.
(2.2)
⎟⎟⎠
⎞⎜⎜⎝
⎛−−=
⋅1
36003600 3600
COG
V
Ow G
Ve
Vt C
O
Where,
VO = Opposing Volume (veh/hour) tl = Time taken to complete a left-turn maneuver (sec). GC = Critical gap for a particular site (sec) For the service rate, μ:
lttimeunblockedTotal
=μ (2.3)
Where, tl = Time taken to complete a left-turn maneuver (sec)
3
NETC 05-7 Warrants for Exclusive Left Turn Lanes at Unsignalized Intersections and Driveways
With the arrival and service rates determined from equations 2.1 and 2.2 above, the probability that one or more units are in the system can be calculated.
Given λ and µ, the probability of k units in the system would be:
⎟⎟⎠
⎞⎜⎜⎝
⎛−⎟⎟
⎠
⎞⎜⎜⎝
⎛=
μλ
μλ 1)(
k
KP (2.4)
So, the probability of no vehicles behind the left turning vehicles would be,
(2.5) ⎟⎟⎠
⎞⎜⎜⎝
⎛−⎟⎟
⎠
⎞⎜⎜⎝
⎛=
μλ
μλ 1)0(
0
P
1 – P(0) represents the probability of one or more through vehicles behind a left turning vehicle in the system,
(2.6)
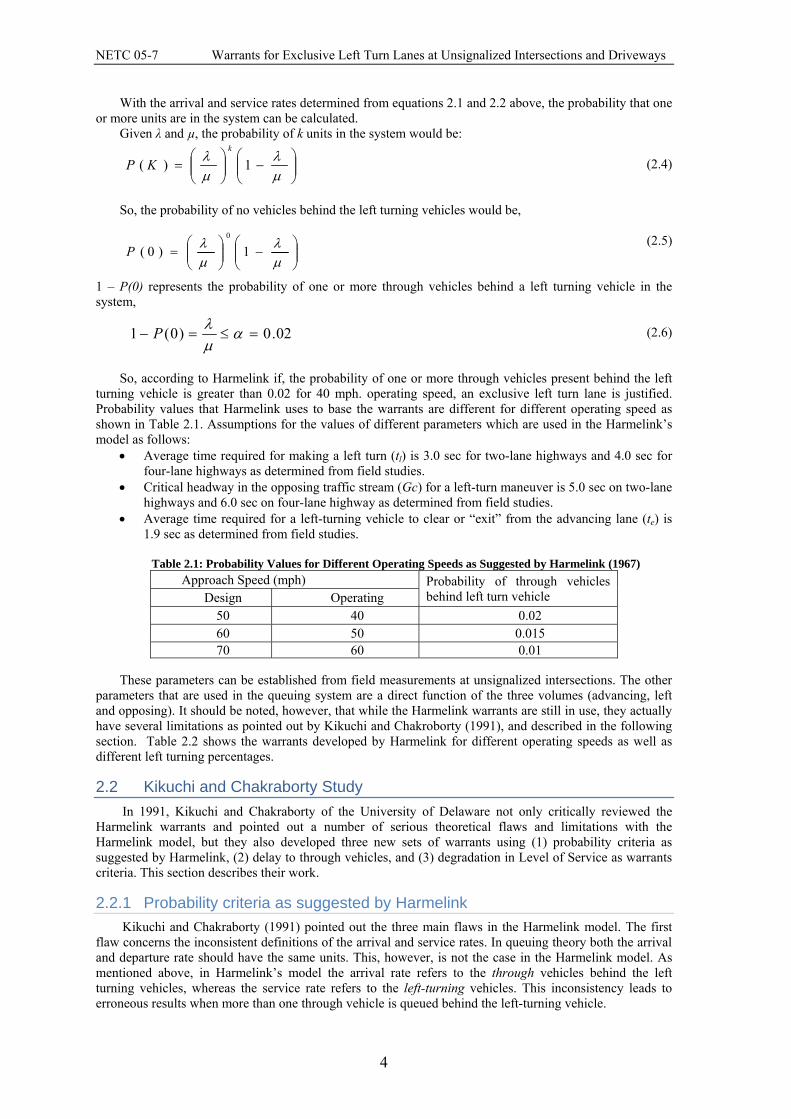
So, according to Harmelink if, the probability of one or more through vehicles present behind the left
turning vehicle is greater than 0.02 for 40 mph. operating speed, an exclusive left turn lane is justified. Probability values that Harmelink uses to base the warrants are different for different operating speed as shown in Table 2.1. Assumptions for the values of different parameters which are used in the Harmelink’s model as follows:
• Average time required for making a left turn (tl) is 3.0 sec for two-lane highways and 4.0 sec for four-lane highways as determined from field studies.
• Critical headway in the opposing traffic stream (Gc) for a left-turn maneuver is 5.0 sec on two-lane highways and 6.0 sec on four-lane highway as determined from field studies.
• Average time required for a left-turning vehicle to clear or “exit” from the advancing lane (te) is 1.9 sec as determined from field studies.
Table 2.1: Probability Values for Different Operating Speeds as Suggested by Harmelink (1967)
Approach Speed (mph) Probability of through vehicles behind left turn vehicle Design Operating
50 40 0.02 60 50 0.015 70 60 0.01
These parameters can be established from field measurements at unsignalized intersections. The other
parameters that are used in the queuing system are a direct function of the three volumes (advancing, left and opposing). It should be noted, however, that while the Harmelink warrants are still in use, they actually have several limitations as pointed out by Kikuchi and Chakroborty (1991), and described in the following section. Table 2.2 shows the warrants developed by Harmelink for different operating speeds as well as different left turning percentages.
2.2 Kikuchi and Chakraborty Study In 1991, Kikuchi and Chakraborty of the University of Delaware not only critically reviewed the Harmelink warrants and pointed out a number of serious theoretical flaws and limitations with the Harmelink model, but they also developed three new sets of warrants using (1) probability criteria as suggested by Harmelink, (2) delay to through vehicles, and (3) degradation in Level of Service as warrants criteria. This section describes their work.
2.2.1 Probability criteria as suggested by Harmelink Kikuchi and Chakraborty (1991) pointed out the three main flaws in the Harmelink model. The first flaw concerns the inconsistent definitions of the arrival and service rates. In queuing theory both the arrival and departure rate should have the same units. This, however, is not the case in the Harmelink model. As mentioned above, in Harmelink’s model the arrival rate refers to the through vehicles behind the left turning vehicles, whereas the service rate refers to the left-turning vehicles. This inconsistency leads to erroneous results when more than one through vehicle is queued behind the left-turning vehicle.
0.00(1 ≤=− 2) =αλPμ
4

NETC 05-7 Warrants for Exclusive Left Turn Lanes at Unsignalized Intersections and Driveways
Table 2.2: AASHTO Guidelines for Left Turn Lanes on Two-lane Highways
Opposing Volumes
Advancing Volumes 5 % Left
Turns 10 % Left Turns
20 % Left Turns
30 % Left Turns
40 - mph operating speed 800 330 240 180 160 600 410 305 225 200 400 510 380 275 245 200 640 470 350 305 100 720 575 390 340 50 - mph operating speed 800 280 210 165 135 600 350 260 195 170 400 430 320 240 210 200 550 400 300 270 100 615 445 335 295 60 - mph operating speed 800 230 170 125 115 600 290 210 160 140 400 365 270 200 175 200 450 330 250 215 100 505 370 275 240
Source: AASHTO (2001) The second flaw concerns the issue of residual gaps. In the Harmelink model, the service rate is
calculated by considering the sum of gaps that are greater than the critical gap and dividing that sum by the time required for completing a left-turn maneuver. The problem here, however, is that the residual gaps (i.e. the remainder of individual gap after subtracting the value of the critical gap) are added up and that sum is considered to be part of the time available for making left-turns. As pointed out by Kikuchi and Chakroborty, this tends to exaggerate the number of opportunities available for making left-turns. For example, suppose there are a total of four gaps of seven seconds each available in the opposing traffic and the time required for completing the left turn maneuver is four seconds. Then, according to Harmelink’s equation seven left turning vehicles would be served in that period of time but practically, only four vehicles should depart in that much time.
Third, the basis of the warrants (i.e., the probability that one or more through vehicles queue behind the left-turning vehicle) is somewhat questionable. First, the probabilities that Harmelink used are quite subjective. Second, as pointed out by Kikuchi and Chakroborty, if the probability-based warrants are used, the total delay savings vary more than 20 times for the same threshold probability. Third, judging by the speeds that Harmelink assumed in his model, the warrants appear to have been mainly intended for high-speed rural highways.
Finally, the different values of the parameters used by Harmelink (such as Critical Gap headway (Gc), average time a left turn vehicle has to wait before finding a suitable gap in the opposing traffic (tw) and time required to clear advancing lane (tl)) correspond to conditions of the roads and state of vehicles present four decades ago (i.e. in 1967) and which may not be applicable to the current state of roads as well as vehicles. In addition, the warrants were developed primarily for rural areas, and their application to the urban setting, therefore, may be inappropriate.
To address the above-mentioned problems, Kikuchi and Chakroborty first suggested a more refined analytical formulation that avoids the two theoretical flaws of the Harmelink model. The newly developed equations by Kikuchi and Chakraborty use arrival and departure rates which have consistent units and also make sure that the residual gaps are not added up leading to erroneous results.
The modified equations for the arrival, λ, and the service rate, μ, which Kikuchi and Chakraborty (1991) developed are given below in equations 2.7 and 2.8 respectively:
( ) ( )
⎥⎦
⎤⎢⎣
⎡−⋅=
+−−
ewA ttVL
A eVL 36001
1λ (2.7)
5

NETC 05-7 Warrants for Exclusive Left Turn Lanes at Unsignalized Intersections and Driveways
(2.8)
Using this newer formulation, they then revised the volume warrants based on the probability values suggested by Harmelink as shown in Table 2.3. The value of N is the maximum number of left turning opportunities per a single headway. The value of N is calculated by solving equation 2.9.
( )[ ]∑=
−+−⎟⎠⎞
⎜⎝⎛−
⎭⎬⎫
⎩⎨⎧
⋅⋅⎥⎥⎦
⎤
⎢⎢⎣
⎡−=
N
n
nGcVoVo
enVoe1
1336003600
31μ
{ 0.
(2.9) }+≥ SC GNGheadwayyprobabilit ≈
where Gs = Follow up gap size (sec)
Table 2.3: Modified Volume Warrants by Kikuchi and Chakraborty (1991) Based on the Probability Criteria as Suggested by Harmelink (1967)
Opposing Volumes
(vph)
Advancing Volumes (vph) 5 % Left
Turns 10 % Left Turns
20 % Left Turns
30 % Left Turns
40 - mph operating speed 800 434 300 219 189 600 542 375 272 134 400 682 472 343 293 200 863 600 435 375 100 946 679 493 424
50 - mph operating speed 800 366 257 185 162 600 460 320 234 202 400 577 403 294 255 200 735 513 373 324 100 830 576 424 365
60 - mph operating speed 800 294 207 154 146 600 365 259 187 165 400 461 324 238 206 200 586 414 303 263 100 663 468 344 297
So, according the newer formulation the arrival rate (λ) is the number of arriving units per unit time.
One arriving unit is a left turning vehicle followed by one or more through vehicles. The departure rate (µ) is the departure of the arriving units per unit time.
2.2.2 Delay to Through Vehicles as a Warrant Criteria In addition to correcting the analytical formulation of Harmelink, Kikuchi and Chakroborty developed
another set of volume warrants based on delay to through vehicles. To do this, Kikuchi and Chakroborty first developed their own simulation model, because, at that time the commercially-available models had several limitations with respect to modeling unsignalized intersections as well as computing the different delay values. The warrants were then developed from the model output. The model output as suggested by Kikuchi and Chakraborty was the following.
• Total hourly delay (TD) • Average delay to left turning vehicles (ALTD) • Average delay to through vehicles caught behind the left turning vehicles (ACTHD) • Average delay to caught and not caught vehicles (ATD) • Total delay saving per hour as a result of the left turn lane (DS) • Number of through vehicles caught behind the left turning vehicles (NTVC) The measures of effectiveness used for the calibration of the model were average delay to left turning
vehicles (ALTD) and number of vehicles caught behind the left turning vehicles (NTVC). For calibrating the simulation model which they developed, they compared NTVC from the simulation model with the λ from the equation 2.6. Similarly, the ALTD from the simulation model was compared with the tw from the equation 2.2. Then, the simulation model was run many times and regression analysis was used to develop general relationships of the different parameters such as TD, ACTHD, ATD, DS with the Opposing, Advancing, left turning volumes and operating speed. Then these regression equations were used to
6

NETC 05-7 Warrants for Exclusive Left Turn Lanes at Unsignalized Intersections and Driveways
developed warrants based on different criteria such as average delay to through vehicles, total delay and delay savings.
Figure 2.1 shows the warrants developed by Kikuchi and Chakraborty based on the average delay to through vehicles as warrant criteria and the thresholds they used to warrant the left turning vehicle for two-lane facilities. The justification behind the values of thresholds they used for developing warrants could not be found in the paper. So, as shown in figure, for a particular volume combination if the plotted point is above the curve, an exclusive left turn lane is warranted.
0
100
200
300
400
500
600
700
800
0 500 1000 1500 2000Opposing volume (vph)
Adv
anci
ng v
olum
e (v
ph)
14 s19 s24 s29 s
Figure 2.1: Warrants Developed by Kikuchi and Chakraborty Based on the Average Delay to Through
Vehicles as Warrant Criteria
Exclusive left turn lane warranted based on 14s threshold
2.2.3 Degradation of Level of Service from A to B as a Warrant Criteria Kikuchi and Chakraborty then developed warrants based on the degradation of Level of Service from A
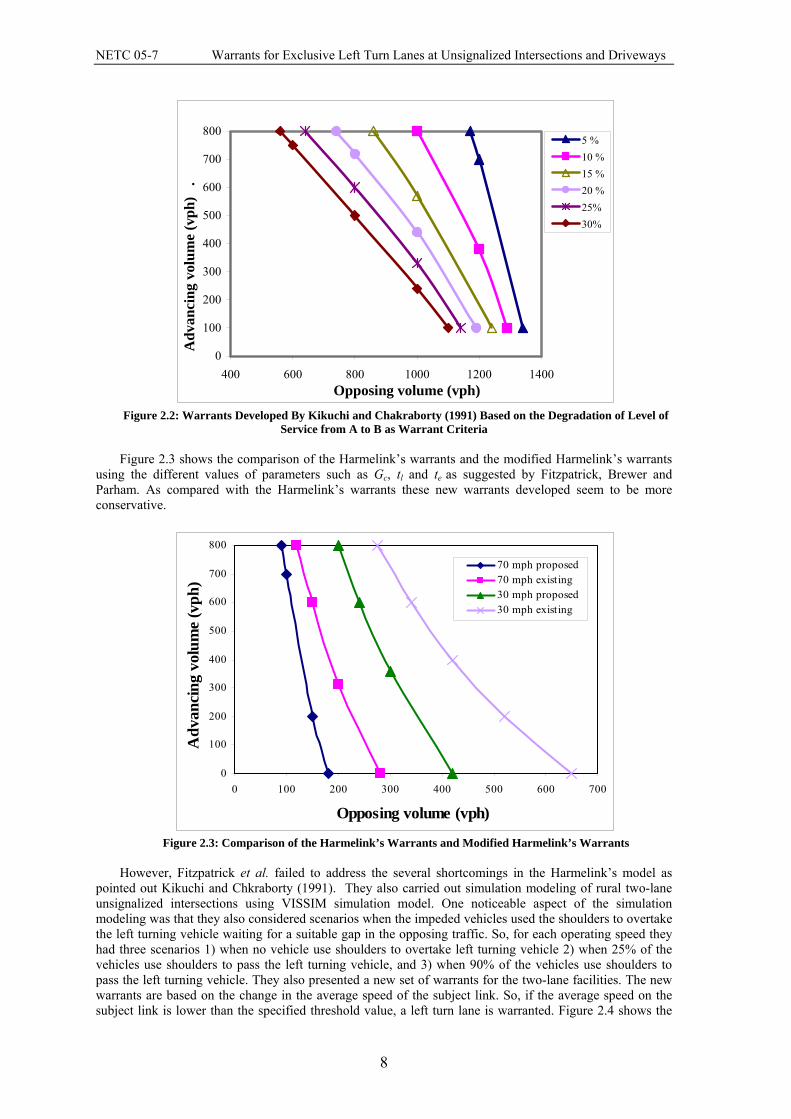
to B based on different volume combinations of VA, VO, and L. Figure 2.2 shows the volume warrants for installation of a left turn lane for different left turn percentages and operating speed of 40 mph based on degradation of level of service from A to B as warrant criteria, applied to the peak hour. This criterion may not seem to be reasonable for traffic engineers as in the field a level of service of C is considered acceptable.
The simulation model used by Kikuchi and Chakraborty was rather simplistic as compared to current microscopic simulation models. The model was also deterministic and suffered from the limitation that the critical gap was assumed to be fixed. Apart from the limitations of the simulation model developed by Kikuchi and Chakraborty, the new warrants represent a major improvement over the Harmelink warrants which incorporate other warrants criteria that are much easier for the general public to appreciate compared to probability values, in deciding whether or not a left-turn is warranted at unsignalized intersections.
2.3 Fitzpatrick, Brewer and Parham More recently, Fitzpatrick, et al. (2003) reviewed eight methods currently used to determine warrants
for left turn lanes. The researchers also reviewed several state guidelines on installing the left turn lane. In this project researchers found that most of the methods currently used to warrant left turn lanes, are based on the Harmelink’s model. They also found out that the assumptions made by Harmelink for the values of different parameters such as Gc, te and tl are on the lower side or overly cautious and should be modified. They also carried out a study and proposed modified values for the above mentioned parameters and using modified values, they developed new set of warrants using Harmelink’s model. The modified values as suggested by the Fitzpatrick, Brewer and Parham for the different parameters were as following.
• Critical headway (Gc) for a left-turn maneuver is 5.5 sec. • Time to complete the left turn and clear the opposing lane (tl) is 4.3 sec. • Time to clear the advancing lane (te) is 3.2 sec.
7
NETC 05-7 Warrants for Exclusive Left Turn Lanes at Unsignalized Intersections and Driveways
0
100
200
300
400
500
600
700
800
400 600 800 1000 1200 1400Opposing volume (vph)
Adv
anci
ng v
olum
e (v
ph)
.
5 %10 %15 %20 %25%30%
Figure 2.2: Warrants Developed By Kikuchi and Chakraborty (1991) Based on the Degradation of Level of
Service from A to B as Warrant Criteria Figure 2.3 shows the comparison of the Harmelink’s warrants and the modified Harmelink’s warrants
using the different values of parameters such as Gc, tl and te as suggested by Fitzpatrick, Brewer and Parham. As compared with the Harmelink’s warrants these new warrants developed seem to be more conservative.
0
100
200
300
400
500
600
700
800
0 100 200 300 400 500 600 700
Opposing volume (vph)
Adv
anci
ng v
olum
e (v
ph)
70 mph proposed70 mph existing30 mph proposed30 mph existing
Figure 2.3: Comparison of the Harmelink’s Warrants and Modified Harmelink’s Warrants
However, Fitzpatrick et al. failed to address the several shortcomings in the Harmelink’s model as
pointed out Kikuchi and Chkraborty (1991). They also carried out simulation modeling of rural two-lane unsignalized intersections using VISSIM simulation model. One noticeable aspect of the simulation modeling was that they also considered scenarios when the impeded vehicles used the shoulders to overtake the left turning vehicle waiting for a suitable gap in the opposing traffic. So, for each operating speed they had three scenarios 1) when no vehicle use shoulders to overtake left turning vehicle 2) when 25% of the vehicles use shoulders to pass the left turning vehicle, and 3) when 90% of the vehicles use shoulders to pass the left turning vehicle. They also presented a new set of warrants for the two-lane facilities. The new warrants are based on the change in the average speed of the subject link. So, if the average speed on the subject link is lower than the specified threshold value, a left turn lane is warranted. Figure 2.4 shows the
8

NETC 05-7 Warrants for Exclusive Left Turn Lanes at Unsignalized Intersections and Driveways
warrants based on the average speed on the subject link warrant criteria developed by Fitzpatrick, Brewer and Parham. The x-axis of Figure 2.4 represents the initial volumes which is a combination of opposing and advancing volumes (40% opposing and 60% advancing).
Figure 2.4: Warrants Developed by Fitzpatrick, Brewer and Parham
2.4 Virginia Transportation Research Council study Recently, a study was undertaken by the Virginia Transportation Research Council to develop new left-
turn guidelines for both unsignalized and signalized intersections (Lakkundi et al., 2004). These warrants were developed on the basis of well-validated, event-based simulation programs “LTGAP” which the authors developed themselves, and calibrated based upon field data collected at a number of intersections from the Commonwealth of Virginia. One advantage of the VTRC study over Harmelink’s (1967) and Kikuchi and Chakraborty (1991) was that they used more accurate modeling techniques which incorporated a stochastic gap acceptance module. The models were calibrated based on the number of left turning vehicles stopped on the subject link.
For the unsignalized intersections they developed left turn lane volume warrants based on the probability criteria as suggested by Harmelink. The authors of the VTRC study also developed warrants for signalized intersections. If it is decided to provide an exclusive left turn lane at a particular intersection, the length of the lane also needs to be determined. So, the authors of this study also recommended the length of the proposed left turn lane. Since, the purpose of installing a left turn lane is to prevent left-turn overflows; the probability of left-turn lane overflows for varying left-turn lane lengths was investigated, which, was later used to recommend the left-turn lane length for the candidate intersections. In addition to the general guidelines, the authors of the Virginia Transportation Research Council also developed a prioritization tool that can be used to prioritize candidate intersections which accounts for both operational and safety aspects.
Despite extensive improvements over the previous attempts at developing left turn lane warrants, the VTRC warrants are still based on the probability criterion suggested by Harmelink. As pointed out by Kikuchi and Chakroborty, this practice is quite subjective and somewhat questionable. Figure 2.5 shows the left turn lane warrants developed by the authors of VTRC for the different operating speeds and left turning percentage of 10 percent. If compared with the other warrants such as Harmelink’s and modified Harmelink’s warrants, these new warrants seem to be less conservative for lower opposing volumes but for higher opposing volumes there is not much difference between these new warrants and earlier warrants.
2.5 NCHRP Report 279 In 1985, the Transportation Research Board published NCHRP Report 279, Intersection Channelization
Design Guide (Neuman 1985). In this report, to decide the necessity of the left turn lane, Harmelink’s model was used. The guide provides the following advice for unsignalized intersections:
• Left-turn lanes should be considered at all median cross-overs on divided, high-speed highways. • Left-turn lanes should be provided at all unstopped (i.e., through) approaches of primary, high-
speed rural highway intersections with other arterials or collectors.
9

NETC 05-7 Warrants for Exclusive Left Turn Lanes at Unsignalized Intersections and Driveways
0
100
200
300
400
500
600
700
800
0 100 200 300 400 500 600 700 800
Opposing volume (vph)
Adv
anci
ng v
olum
e (v
ph)
40 mph
50 mph
60 mph
Figure 2.5: Left Turn Lane Warrants by VTRC
• Left-turn lanes are recommended at approaches to intersections for which the combination of
through left, and opposing volumes exceeds the warrants shown in Figure 2.6. • Left-turn lanes on stopped or secondary approaches should be provided based on analysis of the
capacity and operations of the unsignalized intersection. Considerations include minimizing delays to right turning or through vehicles and total approach capacity.
The last point suggests that for developing left turn lane warrants, performance measures such as delays and number of stops on the subject link could also be used instead of probability as warrant criteria.
The warrants developed in NCHRP Report 279, however, were once again developed using Harmelink’s method, which, firstly has two major shortcomings as pointed out Kikuchi and Chakroborty (1991) and secondly is based on the probability of through vehicles present behind the left turning vehicles which is quite subjective and somewhat questionable.
2.6 Other Studies Many others have examined the operational effects of various means of serving left turns on main
roads. For example, Oppenlander and Bianchi (1990) expanded Harmelink’s warrant for additional operating speed and left turn lane percentages. As shown in the Figure 2.7, they added warrants for operating speeds of 30 mph and 70 mph and left turn percentage ranging from 0.5 % to 50% to the previous Harmelnk’s warrants.
Basha (1992), Chakraborty et al. (1995) and Lertworawanich and Elefteriadou (2003) developed methods for estimating storage lengths needed for left turn bays at unsignalized intersections. Simpson and Matthias (2000) validated estimates of left turn delay computed using the 1997 Highway Capacity Manual (HCM) methodology against values observed in field studies, and found that the HCM method over-estimates delay when total approach volumes are high. Many studies have investigated alternative median treatments for multi-lane highways, including two-way-left-turn lanes (TWLTL), flush medians and raised medians, including McCoy et al. (1982), Ballard and McCoy (1983) and Venigalla et al. (1992). In all cases TWLTL reduced delay to through vehicles compared to undivided sections, but there was not always a difference in delay between sections with TWLTL and raised medians, except when traffic volumes or the number of driveways is very high.
2.7 Safety Implications The installation of a left turn lane has operational as well as the safety impacts on the traffic flow.
Studies discussed in the earlier section take into account only the operational impact of installing a left turn lane. Following are some of the studies which take in to account the safety impacts of installation of left turn lane. There are many studies which try to compare the safety benefits of each of the three median types (raised median, flush median and TWLTL), including McCoy and Malone (1989), Squires and Parsonson (1989), Fitzpatrick and Balke (1995), Margiotta and Chatterjee (1995), and Bonneson and McCoy (1997). These studies generally have found road sections with TWLTL and flush medians to have lower crash frequencies than undivided sections, and sections with raised medians to have fewer crashes than those with TWLTL or flush medians, as would be expected.
10
NETC 05-7 Warrants for Exclusive Left Turn Lanes at Unsignalized Intersections and Driveways
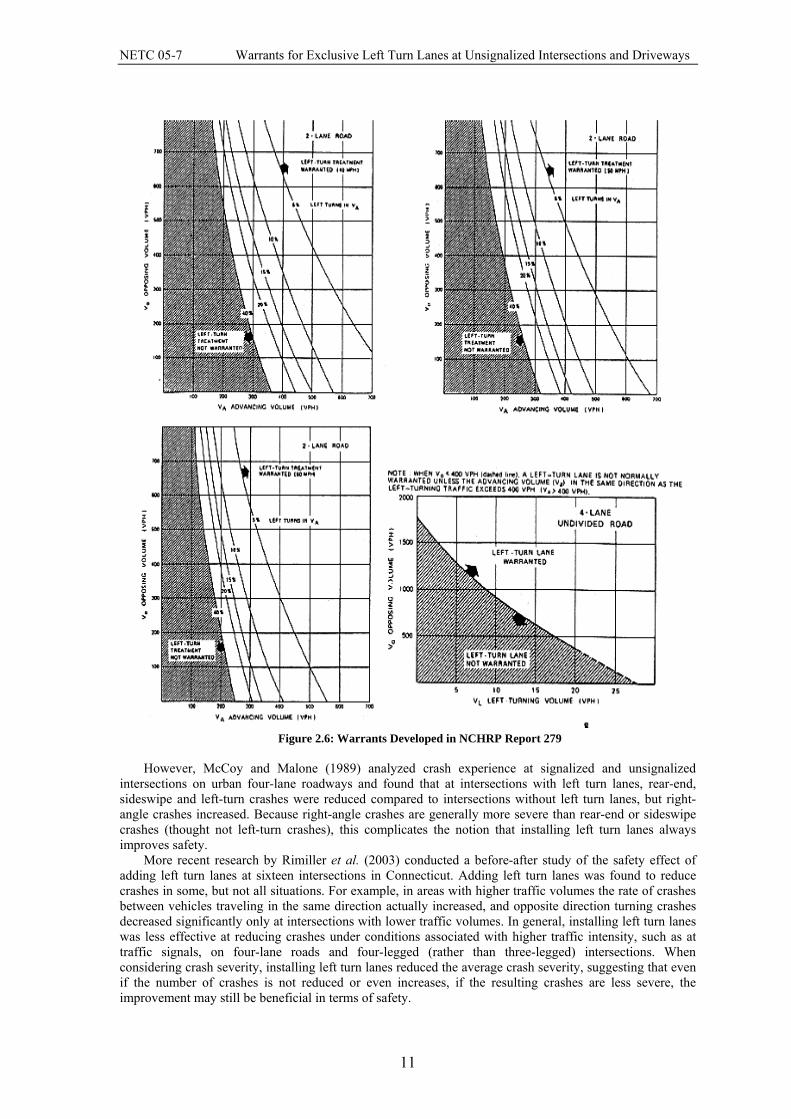
Figure 2.6: Warrants Developed in NCHRP Report 279
However, McCoy and Malone (1989) analyzed crash experience at signalized and unsignalized intersections on urban four-lane roadways and found that at intersections with left turn lanes, rear-end, sideswipe and left-turn crashes were reduced compared to intersections without left turn lanes, but right-angle crashes increased. Because right-angle crashes are generally more severe than rear-end or sideswipe crashes (thought not left-turn crashes), this complicates the notion that installing left turn lanes always improves safety.
More recent research by Rimiller et al. (2003) conducted a before-after study of the safety effect of adding left turn lanes at sixteen intersections in Connecticut. Adding left turn lanes was found to reduce crashes in some, but not all situations. For example, in areas with higher traffic volumes the rate of crashes between vehicles traveling in the same direction actually increased, and opposite direction turning crashes decreased significantly only at intersections with lower traffic volumes. In general, installing left turn lanes was less effective at reducing crashes under conditions associated with higher traffic intensity, such as at traffic signals, on four-lane roads and four-legged (rather than three-legged) intersections. When considering crash severity, installing left turn lanes reduced the average crash severity, suggesting that even if the number of crashes is not reduced or even increases, if the resulting crashes are less severe, the improvement may still be beneficial in terms of safety.
11
NETC 05-7 Warrants for Exclusive Left Turn Lanes at Unsignalized Intersections and Driveways
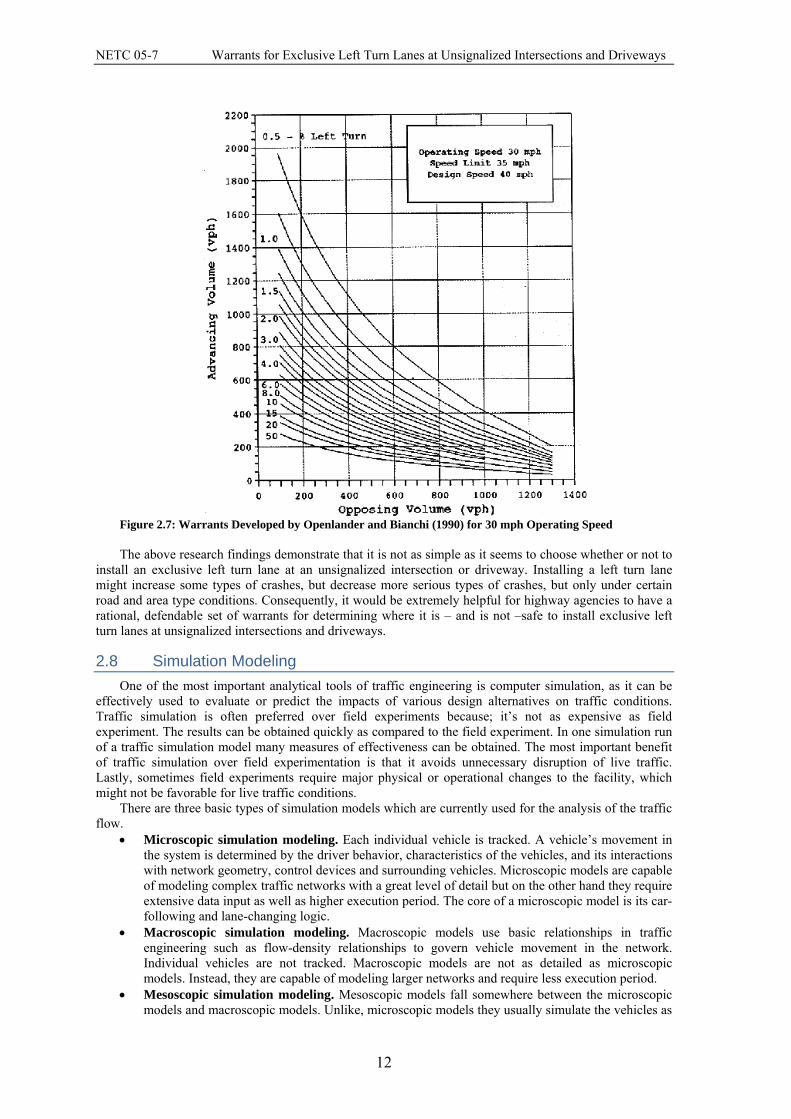
Figure 2.7: Warrants Developed by Openlander and Bianchi (1990) for 30 mph Operating Speed
The above research findings demonstrate that it is not as simple as it seems to choose whether or not to
install an exclusive left turn lane at an unsignalized intersection or driveway. Installing a left turn lane might increase some types of crashes, but decrease more serious types of crashes, but only under certain road and area type conditions. Consequently, it would be extremely helpful for highway agencies to have a rational, defendable set of warrants for determining where it is – and is not –safe to install exclusive left turn lanes at unsignalized intersections and driveways.
2.8 Simulation Modeling One of the most important analytical tools of traffic engineering is computer simulation, as it can be
effectively used to evaluate or predict the impacts of various design alternatives on traffic conditions. Traffic simulation is often preferred over field experiments because; it’s not as expensive as field experiment. The results can be obtained quickly as compared to the field experiment. In one simulation run of a traffic simulation model many measures of effectiveness can be obtained. The most important benefit of traffic simulation over field experimentation is that it avoids unnecessary disruption of live traffic. Lastly, sometimes field experiments require major physical or operational changes to the facility, which might not be favorable for live traffic conditions.
There are three basic types of simulation models which are currently used for the analysis of the traffic flow.
• Microscopic simulation modeling. Each individual vehicle is tracked. A vehicle’s movement in the system is determined by the driver behavior, characteristics of the vehicles, and its interactions with network geometry, control devices and surrounding vehicles. Microscopic models are capable of modeling complex traffic networks with a great level of detail but on the other hand they require extensive data input as well as higher execution period. The core of a microscopic model is its car-following and lane-changing logic.
• Macroscopic simulation modeling. Macroscopic models use basic relationships in traffic engineering such as flow-density relationships to govern vehicle movement in the network. Individual vehicles are not tracked. Macroscopic models are not as detailed as microscopic models. Instead, they are capable of modeling larger networks and require less execution period.
• Mesoscopic simulation modeling. Mesoscopic models fall somewhere between the microscopic models and macroscopic models. Unlike, microscopic models they usually simulate the vehicles as
12
NETC 05-7 Warrants for Exclusive Left Turn Lanes at Unsignalized Intersections and Driveways
group or platoon. Unlike macroscopic models they can simulate lane-changing, merging and diverging behavior.
2.8.1 CORSIM In selecting the microscopic simulation model to use, researchers considered the use of either the
Corridor Simulation (CORSIM) model, developed by the Federal Highway Administration (FHWA) or the PARAMICS model, developed by Quadstone, Limited. After some initial investigation, the research team elected to use CORSIM. The primary reason in selecting CORSIM over PARAMICS was that CORSIM allowed for greater flexibility and accuracy in modeling and calibrating gap acceptance behavior and discharge headways at each intersection. CORSIM allows the user to specify the decile gap acceptance distribution. This is not possible with PARAMICS, where calibration primarily depends upon adjusting the value of the “target headway”, one of the parameters of the car following model that PARAMICS uses. Obtaining values for the “target headway” from field observations, however, is much more challenging than specifying the gap acceptance distribution.
CORSIM is a combination of two different models: an urban arterial simulation model which is called NETSIM; and a freeway simulation model called FRESIM. CORSIM is a part of the several traffic simulation models developed by FHWA. Combining the NETSIM and FRESIM models allows users to carry out system-level analysis of networks including freeways as well as urban arterials. CORSIM is a microscopic simulation model which applies a time step simulation process. CORSIM therefore tracks the position and movement of each vehicle in the network once each second. Likewise, control devices are updated once each second. CORSIM is a stochastic model, which means that random numbers are assigned to each of the vehicles depending upon the characteristics of the vehicle and driver behavior. The movement of vehicles is based on car following theory, vehicle performance, driver behavior and its interaction with the control devices and surrounding vehicles. With respect to freeways, CORSIM is capable of modeling up to five mainline lanes, up to three auxiliary lanes, and one to three lane ramps. The model can also measure the impacts of restricted use lanes, HOV, incidents, and ramp metering and can replicate the presence of surveillance detectors. The latest version of CORSIM available in the market right now is CORSIM 5.1 which was used for modeling purpose in this research project. CORSIM 5.1 was released in 2003.
2.8.2 SCRIPT TOOL The TSIS (Traffic Software Integrated System’s) Script Tool comes with the standard TSIS package
(which includes NETSIM and FRESIM). TSIS script tool uses Microsoft's Script Control to provide an application that enables researchers to generate and execute scripts within the TSIS environment. The Script Tool also provides access to several interfaces that allow the scripts to interact with the TSIS user interface, TShell, and other tools within the TSIS environment.
Scripting enables researchers to automate frequently performed tasks by writing standard Visual Basic scripts. Although scripting is a very powerful tool, it does require some computer programming experience and knowledge of the VBScript language. For example in this research project the researchers developed customized scripts in Visual Basics environment which enabled them to automate recurrent simulation modeling followed by the extraction of the required output for the subject link only from the huge output file. Thus, researchers found the script tool quite useful, which used effectively, is capable of saving a lot of time.
13
NETC 05-7 Warrants for Exclusive Left Turn Lanes at Unsignalized Intersections and Driveways
3 VOLUME WARRANTS: METHODOLOGY
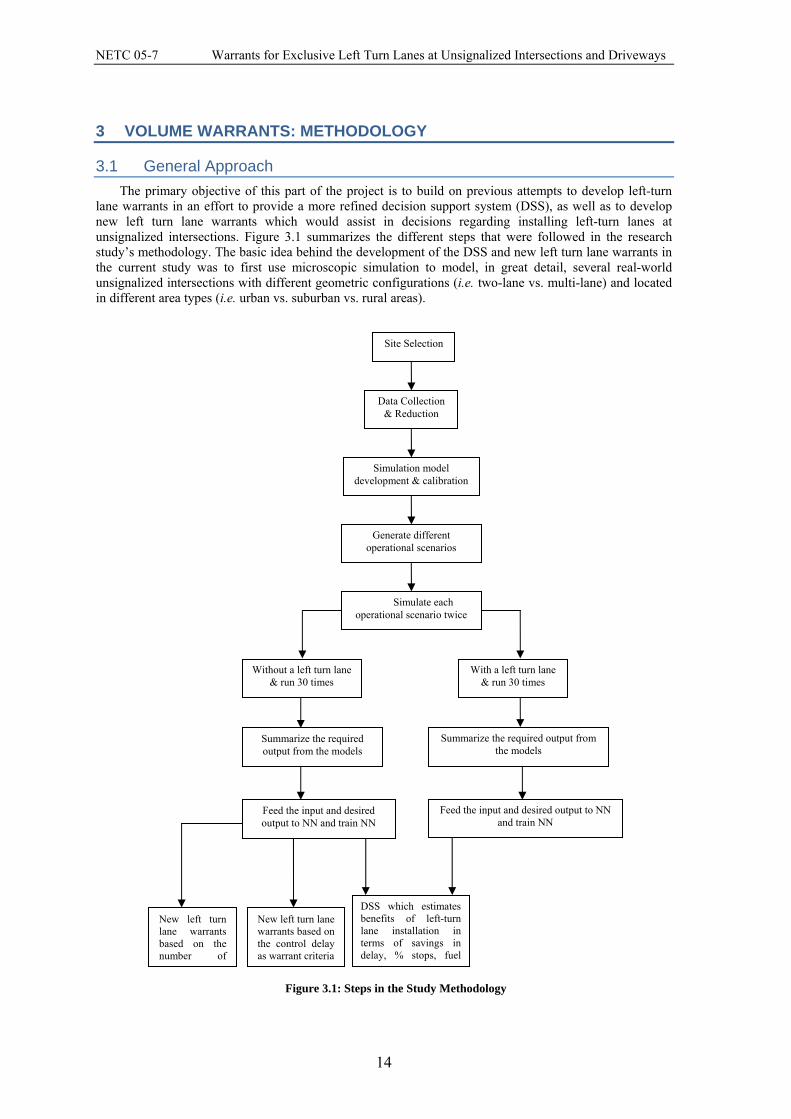
3.1 General Approach The primary objective of this part of the project is to build on previous attempts to develop left-turn
lane warrants in an effort to provide a more refined decision support system (DSS), as well as to develop new left turn lane warrants which would assist in decisions regarding installing left-turn lanes at unsignalized intersections. Figure 3.1 summarizes the different steps that were followed in the research study’s methodology. The basic idea behind the development of the DSS and new left turn lane warrants in the current study was to first use microscopic simulation to model, in great detail, several real-world unsignalized intersections with different geometric configurations (i.e. two-lane vs. multi-lane) and located in different area types (i.e. urban vs. suburban vs. rural areas).
Figure 3.1: Steps in the Study Methodology
Site Selection
Data Collection & Reduction
Simulation model development & calibration
Generate different operational scenarios
Simulate each operational scenario twice
DSS which estimates benefits of left-turn lane installation in terms of savings in delay, % stops, fuel
Without a left turn lane & run 30 times
With a left turn lane & run 30 times
New left turn lane warrants based on the control delay as warrant criteria
New left turn lane warrants based on the number of
Summarize the required output from the models
Summarize the required output from the models
Feed the input and desired output to NN and train NN
Feed the input and desired output to NN and train NN
14
NETC 05-7 Warrants for Exclusive Left Turn Lanes at Unsignalized Intersections and Driveways
After building the models in the CORSIM, the next step was to carefully calibrate those models by comparing several of their output parameters (e.g. stopped delay and queue lengths) to detailed field observations to make sure the models are replicating real-world conditions. The measures of effectiveness (MOE’s) used in the calibration were stopped delay, average queue length and maximum queue length on the subject link. The parameters adjusted to minimize the difference between the MOE’s obtained from model and those observed in the field, were gap acceptance distribution, vehicle entry distribution and queue discharge headway.
Following this, a large number of different operational scenarios were simulated. These scenarios covered a wide range of possible values for the advancing, opposing, and left-turn volumes at unsignalized intersections, as well as a range of operating speeds. For each scenario, two cases were modeled, one time without an exclusive left-turn lane and the second time with a left-turn installed, thereby providing an estimate of the benefits of installing a left turn lane which helped in the development of DSS. The output from the different simulation model runs was then used to train a Neural Network (NN) (while it was also possible to use different tools such as regression analysis to generalize the results, it was found that the NN did a good job in that regard). Once trained, the NN can serve as a DSS for predicting the likely benefits of installing a left-turn lane for a given intersection. In estimating these benefits, the study considered a wide range of performance measures including savings in delay, reduction in the number of stops, improvement in the fuel consumption efficiency, as well as reduction in emissions to provide a comprehensive picture for the likely benefits of installing a left-turn lane. Furthermore, the output from the scenarios without an exclusive left turn lane was used to develop the new left turn lane warrants. Likewise, in the process of the development of new left turn lane warrants, the total delay (veh-sec/hour) and total number of stops on the subject link were used to warrant the left turn lane.
3.2 Site Selection As Figure 3.1 shows, the first step in the methodology was to select a set of unsignalized intersections
for the purpose of developing and calibrating the simulation models. In selecting those sites, the research team made sure that the selected intersections:
• covered a wide range of traffic volumes (left turning, opposing and advancing); • included both multi-lane as well as two-lane roads; • were located in urban, suburban and rural locations; and • had a significant percentage of left-turn vehicles. To do this, the research team first compiled a list of candidate intersections in Chittenden County,
Vermont. Average annual daily traffic (AADT) and turning movement counts for those intersections were obtained from the Chittenden County Metropolitan Planning Organization (CCMPO) website and used to screen potential sites. The categorization of intersections into urban, suburban and rural was based on a general assessment of the area in which the intersections were located. Urban intersections included in the study were typically located in built-up areas, near the urban core of major cities in Chittenden County having a population of greater than 5,000. Rural intersections, on the other hand, were generally surrounded by farm land. Categorizing intersections as suburban, however, was more subjective. In general, intersections categorized as suburban were located in areas which were not as built up as their urban counterparts; at the same time, the surrounding development could not justify classifying the area as rural.
The research group then visited all of the potential sites to collect practical information regarding possible nearby parking and good locations to mount the video cameras which were used for data collection. Sites with a small shoulder width were preferred over sites with larger shoulder widths because, as was observed in the field, where a wide shoulder was available, several through vehicles tend to use that shoulder to overtake the left turning vehicles waiting for a suitable gap in opposing traffic. This obviously would cause problems in collecting queuing and stopped delay information from the field observations. Eventually, the study ended up with a final list of 8 intersections where data were collected. Table 3.1 gives some basic information about the selected intersections’ locations, geometric configuration, the timing of the peak hour and the volume combinations. Figure 3.2 shows the location of those intersections.
3.3 Data Collection and Reduction The eight intersections were videotaped using two SONY DV cameras with an accuracy of 1/10th of a
second. This allowed for measuring gaps and gap acceptance behavior to an accuracy of 1/10th of a second. All the video taping at different intersections was conducted for a period of one hour during the peak period. Once, the video taping was completed, the tapes were watched, and the following data were extracted:
15

NETC 05-7 Warrants for Exclusive Left Turn Lanes at Unsignalized Intersections and Driveways
Table 3.1: Data Describing Selected Intersections
No
Intersection Description Category
Speed Limit (mph)
Peak* hour
Peak hourly volume* Advancing
(vph) Opposing
(vph) Left turning
(vph)
1 Colchester Av and Votey Parking Driveway
4-lane Urban 30 8 to 9
AM 933 828 21
2 Cheese Factory and Hinesburg
2-lane Rural 45 8 to 9
AM 384 292 113
3 Spear street and Barstow Road
2-lane Suburban 35 4:30 to
5:30 PM 627 486 146
4 Williston Road and Commerce Street
2-lane Urban 40 8 to 9
AM 623 449 73
5 Williston Road and Talcott (eastern intersection)
2-lane Rural 40 4:30 to
5:30 PM 606 990 234
6 Williston Road and Old Stage
2-lane Urban 40 4:30 to
5:30 PM 240 247 21
7 Vt. 2A and Creamery Road
2-lane Suburban 40 4:30 to
5:30 PM 664 253 263
8 Williston Road and McDonald’s Driveway
4-lane Urban 35 4 to 5
PM 1942 1308 22
*Peak hourly volumes and peak hour were obtained from the Chittenden County Metropolitan Planning Organization (CCMPO) website
Figure 3.2: Location of Selected Intersections
16
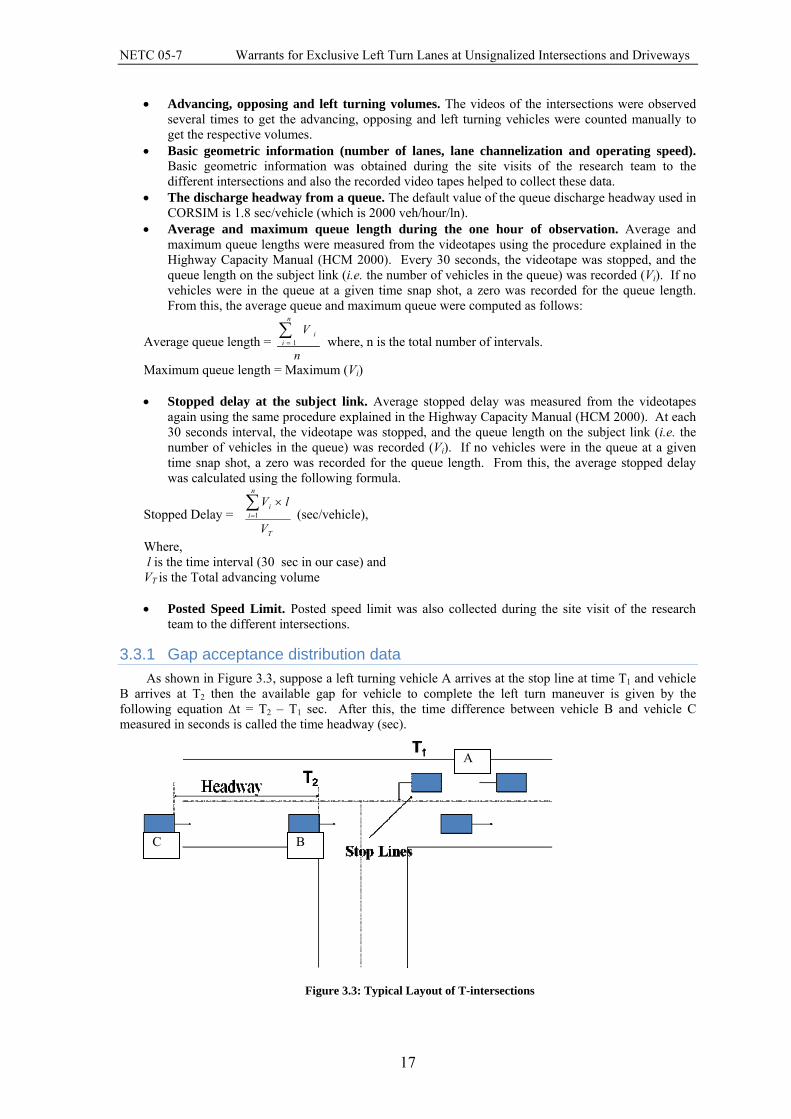
NETC 05-7 Warrants for Exclusive Left Turn Lanes at Unsignalized Intersections and Driveways
• Advancing, opposing and left turning volumes. The videos of the intersections were observed several times to get the advancing, opposing and left turning vehicles were counted manually to get the respective volumes.
• Basic geometric information (number of lanes, lane channelization and operating speed). Basic geometric information was obtained during the site visits of the research team to the different intersections and also the recorded video tapes helped to collect these data.
• The discharge headway from a queue. The default value of the queue discharge headway used in CORSIM is 1.8 sec/vehicle (which is 2000 veh/hour/ln).
• Average and maximum queue length during the one hour of observation. Average and maximum queue lengths were measured from the videotapes using the procedure explained in the Highway Capacity Manual (HCM 2000). Every 30 seconds, the videotape was stopped, and the queue length on the subject link (i.e. the number of vehicles in the queue) was recorded (Vi). If no vehicles were in the queue at a given time snap shot, a zero was recorded for the queue length. From this, the average queue and maximum queue were computed as follows:
Average queue length = n
Vn
ii∑
= 1 where, n is the total number of intervals.
Maximum queue length = Maximum (Vi) • Stopped delay at the subject link. Average stopped delay was measured from the videotapes
again using the same procedure explained in the Highway Capacity Manual (HCM 2000). At each 30 seconds interval, the videotape was stopped, and the queue length on the subject link (i.e. the number of vehicles in the queue) was recorded (Vi). If no vehicles were in the queue at a given time snap shot, a zero was recorded for the queue length. From this, the average stopped delay was calculated using the following formula.
Stopped Delay = T
n
ii
V
lV∑=
×1 (sec/vehicle),
Where, l is the time interval (30 sec in our case) and VT is the Total advancing volume • Posted Speed Limit. Posted speed limit was also collected during the site visit of the research
team to the different intersections.
3.3.1 Gap acceptance distribution data As shown in Figure 3.3, suppose a left turning vehicle A arrives at the stop line at time T1 and vehicle B arrives at T2 then the available gap for vehicle to complete the left turn maneuver is given by the following equation ∆t = T2 – T1 sec. After this, the time difference between vehicle B and vehicle C measured in seconds is called the time headway (sec).
A
C B
Figure 3.3: Typical Layout of T-intersections
17

NETC 05-7 Warrants for Exclusive Left Turn Lanes at Unsignalized Intersections and Driveways
CORSIM allows the user to specify a decile distribution for the accepted gaps in the oncoming traffic stream facing permissive left-turning vehicles (the decile distribution would specify the values of the minimum gap that will be accepted by 10% of the drivers’ population, 20%, 30%... and so on). This allows for greater accuracy in modeling local gap acceptance behavior at a given intersection or region. To calibrate CORSIM, therefore, it was necessary to obtain the gap acceptance distribution for each of the 8 selected intersections from the recorded videotapes. The following procedure was used:
• The lengths of all the time gaps were measured from the video, and were labeled as either an “accepted” or a “rejected” gap according to observed drivers’ behavior.
• Acceptable and rejected gaps were then arranged in descending order. • The largest or longest rejected gap was noted, and accepted gaps that were larger than the longest
rejected gap were excluded from further analysis. The reason behind this was the assumption that all the time gaps longer than the largest rejected gap will be accepted by all of the advancing vehicles.
• With the accepted gaps that are equal to or less than the largest rejected gap arranged in descending order, the values corresponding to the different 10ths percentiles were noted (i.e. values that were accepted by 10% of the population, by 20% and so on). Table 3.2 below shows an example of the gap acceptance distribution derived for intersection number 4 (Williston Road and Commerce Street). According to the observed distribution, only 10% of the drivers would be willing to accept gaps as short as 3.6 seconds, 20% would accept gaps as short as 3.9 seconds, while 100% of the drivers would be willing to accept gaps that are at least 6.8 seconds long.
Table 3.2: Gap Acceptance Distribution at Williston Road and Commerce Street
Gap (Seconds) 6.8 6.5 6 5.8 5.5 5.2 4.8 4.3 3.9 3.6 Percentile 100 90 80 70 60 50 40 30 20 10
Figure 3.4 compares the gap acceptance cumulative distributions for the 8 intersections observed in this
study. It is interesting to note here that each area type (i.e. urban, suburban or rural) appears to have a slightly different gap acceptance distribution. It shows that the gap acceptance distributions for the two rural locations are almost identical, and seem to have higher minimum gap acceptance values compared to suburban and urban distributions. Gap acceptance distributions for the suburban locations also appear to be very close to one another, with values lower than rural locations and slightly higher than urban locations. Finally, the four urban locations also appear to have distributions that are quite similar to one another. This basically shows that the gap acceptance distribution differs based on the area type and the earlier warrants are just for two-lane categories and they do not differentiate between urban and rural road categories.
Gap acceptance behavior
0
1
2
3
4
5
6
7
8
9
0 10 20 30 40 50 60 70 80 90 100 110 120
Percentile (%)
Gap
s (Se
cond
s)
Williston rd and Commerce st. (urban 2 lane)
Williston rd and Old Cremery(sub-urb 2 lane)
Williston rd and Old Stage (urban 2 lane)
Spear st. and Barstow rd (Sub-urb 2 lane)
Cheese factory and Hinesburg road (Rural 2 lane)
Williston rd and Talcott rd (rural 2 lane)
Williston rd and McDonald (Urban 4 lanes)
Votey Parking and Cochester Av (Urban 4 lanes)
Figure 3.4: Gap Acceptance Distributions for the Different Sites
18

NETC 05-7 Warrants for Exclusive Left Turn Lanes at Unsignalized Intersections and Driveways
3.4 Simulation Model Development and Calibration With the simulation model selected, the study then proceeded to develop and calibrate the simulation
models. Aerial photographs of the intersections were obtained and imported into CORSIM for each intersection. The different links and nodes were overlaid on the aerial photographs. Thirty different runs with different random seed numbers were performed using the CORSIM Script tool, and the results, only for the subject link, from these runs were averaged to get a more accurate picture of the CORSIM’s reported performance measures. Figure 3.5 shows a model of the intersection of Williston Road and Commerce Street built in the CORSIM.
Figure 3.5: A Simulation Model of the Intersection of Williston Road and Commerce Street
For calibration, the gap acceptance distribution, the discharge headway and the vehicle entry
distribution for each intersection were adjusted based on the values obtained from the videotapes. For each intersection, the model’s output (i.e. the average of 30 runs) was compared against several field measurements. Specifically, the study compared (1) average stopped delay; (2) average queue lengths; and (3) maximum queue as measured from the videotapes to the values estimated by CORSIM. Excellent calibration results were obtained as evidenced by Figure 3.6, 3.7 and 3.8 compare the average stopped delay and maximum queue length and average queue lengths on the subject link (as determined from the 30 CORSIM runs) to the values measured from the field for each of the eight intersections respectively. Also shown is the range of values obtained from the 30 CORSIM runs. As can be seen, the model and field results are almost identical for all eight sites.
For Figure 3.8, which shows the calibration of the different simulation models based on the average queue length, it should be noted that the field observed values are a little bit different from the modeled average queue values. This difference could be attributed to the default property of CORSIM 5.1 to round up or down the queue length to either 1.0 or 0 vehicles.
3.5 Development of Decision Support System
3.5.1 Generation of the Different Operational Scenarios Once all 8 models were calibrated, the next step was to choose a representative intersection for each
intersection category: 2-lane urban; 2-lane rural; and 4-lane urban. To keep the representative models as general as possible, intersections with grade, high queue discharge values, and sharp turns were ruled out. The representative intersections for each of the category are as shown in Table 3.3.
19

NETC 05-7 Warrants for Exclusive Left Turn Lanes at Unsignalized Intersections and Driveways
Calibration Results
0
1
2
3
4
5
6
7
8
9
10
ColchesterAvenue and
VoteyParking
CheeseFactory Rd
andHinesburg
Rd.
Spear Streetand Barstow
Rd
Williston Rd.and
CommerceStreet
Talcott andWilliston
Road
Old Stageroad andWilliston
Road
Old CremeryRoad andWilliston
Road
Williston Rdand
Macdonald's
Stop
ped
Del
ay (s
ec/v
eh)
Observed Stopped Delay (sec/veh)
Modeled Stopped Delay (sec/veh)
Figure 3.6: Results of the Calibration Procedure (Stopped Delay)
Calibration results
0
2
4
6
8
10
12
14
ColchesterAvenue and
VoteyParking
CheeseFactory Rd
andHinesburg
Rd.
Spear Streetand Barstow
Rd
Williston Rd.and
CommerceStreet
Talcott andWilliston
Road
Old Stageroad andWilliston
Road
Old CremeryRoad andWilliston
Road
Williston Rdand
Macdonald's
Qm
ax (V
ehic
les)
Observed Qmax (vehicle)Modeled Qmax (Vehicle)
Figure 3.7: Results of the Calibration Procedure (Qmax)
20

NETC 05-7 Warrants for Exclusive Left Turn Lanes at Unsignalized Intersections and Driveways
Calibration Results
0.0
0.5
1.0
1.5
2.0
2.5
3.0
3.5
4.0
4.5
5.0
ColchesterAvenue and
Votey Parking
Cheese FactoryRd and
Hinesburg Rd.
Spear Streetand Barstow
Rd
Williston Rd.and Commerce
Street
Talcott andWilliston Road
Old Stage roadand Williston
Road
Old CremeryRoad and
Williston Road
Williston Rdand
Macdonald's
Qm
ax(v
eh)
.
Observed Average Queue (veh)
Modeled Average Queue (veh)
Figure 3.8: Results of the Calibration Procedure (Qavg)
Table 3.3: Representative intersections for each of the category
1 Cheese Factory and Hinesburg Road 2-lane Rural 2 Williston Rd. and Commerce Street 2-lane Urban 3 Williston Rd and McDonald’s 4-lane Urban
To develop the Decision Support System as well as the new left turn lane warrants, it was necessary to
look at combinations of different opposing, advancing and left turning volumes as well as different operating speeds. The opposing and advancing volumes were varied between 100 and 800 vehicles per hour per lane in the increments of 100 per hour per lane. For left turning percentages, values of 5%, 10%, 20% and 30% and for operating speeds values of 30 mph, 40 mph and 50 mph were used. Therefore a total of 768 operation scenarios for each of the urban two-lane and rural two-lane category were used.
Similarly, for the case of urban four-lane roads, the opposing and advancing volumes were varied between 200 and 1600 vehicles per hour per lane in increments of 200 per hour per lane. For left turning percentages, values of 5%, 10%, 20%, and 30% and for operating speeds values of 30 mph, 40 mph and 50 mph were used.
As a result, there were in total 768 operational scenarios for each road category and 2304 operational scenarios for all of the three road categories. So, to quantify the benefits of installation of a left turn lane it was necessary to simulate 2304 operational scenarios twice, once without a left turn lane and then with a left turn lane. By considering the scope of the project, this task was computationally highly time consuming as each operational scenario needed to be run 30 times and the required output had to be summarized from the 30 runs and averaged to account for the stochasticity of the simulation. So, looking at the scope of the project, the research team started looking for a different option which could reduce computational work. After careful consideration, the research team decided to investigate the use of Neural Networks.
For each intersection category, to reduce the computational work load, it was decided to develop a set of 150 random operational scenarios for each category, each scenario representing a certain combination of advancing volume, opposing volume, left-turn percentage and speed. In generating these scenarios, advancing and opposing volumes were randomly varied between 100 and 800 vehicles/hr/lane, the left-turn percentage was varied between 3% and 30%, and speed was varied between 40 and 60 mph. For each scenario, two cases were simulated; once without a left-turn lane and another with a left-turn lane. As before, each case was run 30 times, each time with a different random seed number and the results were averaged over the 30 runs. The output from all these runs was a dataset for each operational scenario, which gave the estimated values for the following performance measures: control delay (sec/veh), percent stops, fuel consumption (mpg), Carbon monoxide (CO), Nitrogen oxide (NO) and Hydrocarbon (HC) emissions
21

NETC 05-7 Warrants for Exclusive Left Turn Lanes at Unsignalized Intersections and Driveways
(gram/mile) for two cases, without a left-turn lane and with a left-turn lane. The developed dataset was then used to train the NN, which constitutes the heart of the DSS, as explained below.
3.5.2 Neural Network Development, Training and Testing Neural Networks (NN’s) are biologically-inspired systems consisting of massively connected networks
of computational “neurons”, organized in layers. By adjusting the link weights in the network, NN’s can be “trained” to approximate virtually any nonlinear function to a required degree of accuracy. NNs typically learn by providing the network with a set of input and output exemplars (Principe, J.C., N.W. Euliano, and W.C. Lefebvre 2000). A learning algorithm (such as back propagation) is then used to adjust the weights of the network so that the network would give the desired output, in a type of learning commonly called supervised learning. The interested reader is referred to Transportation Research Circular E-C113, Artificial Intelligence in Transportation: Information for Application for more details. The Circular is available online at: http://onlinepubs.trb.org/onlinepubs/circulars/ec113.pdf. In this study, the research team decided to use a NN to generalize the results obtained from the simulation models and to serve as a DSS for predicting the likely benefits of installing left-turn lanes at unsignalized intersections. Over the years, several NN types and architectures have been developed. The most important of these for transportation is the Multi-layer Perceptron (MLP) Neural Network. The MLP typically consists of three layers: the input layer, the hidden layer(s), and the output layer. The type of connections in the MLP is of the feed forward type, where all possible connections between the different neurons are made. The MLP was NN architecture used in this study. Figure 16 shows the structure of NN’s used in this research study.
InputLayer
HiddenLayer
VA
VO
% left
Speed
OutputLayer
Delay, %stops,fuel, emissions
Wij
Figure 3.9: The Neural Network Used in the Study
As shown in Figure 3.9, the NN used has one hidden layer consisting of four neurons. As input, the NN will receive four input variables: (1) advancing volume (VA); opposing volume (VO); (3) percent left turns; and (4) speed. The output will be: (1) the stopped delay (sec/veh); (2) percent stops (%); (3) fuel consumption (miles/gallon); and (4) emissions for CO, NO and HC (gram/mile). A separate NN was developed for each intersection category (e.g. rural, suburban, urban multi- and two- lanes). In addition, one NN was developed for the “without left-turn lane” case, and one for the “with left-turn lane” case. Differences between the outputs of these two NN’s can therefore be used to evaluate the likely benefits of installing left turn lanes based on delay savings, reductions in percent stops, increases in fuel efficiency, and reductions in emissions levels. Using the dataset of 150 operational scenarios, the NN’s were trained using the back propagation algorithm. Ten percent of the data were kept aside for testing purposes (i.e. were not used in training the networks). The training continued for 2000 epochs (training cycles). The research team came up with this number after several trials and errors. Following the training, the testing set was presented to the NN’s, and the networks’ output was compared to the values in the test set. The results are shown in Figures 3.10 and 3.11, indicating that the NN was able to predict the different performance measures produced by the simulation models with great accuracy, as indicated by the high R2 values of the fitted lines.
22
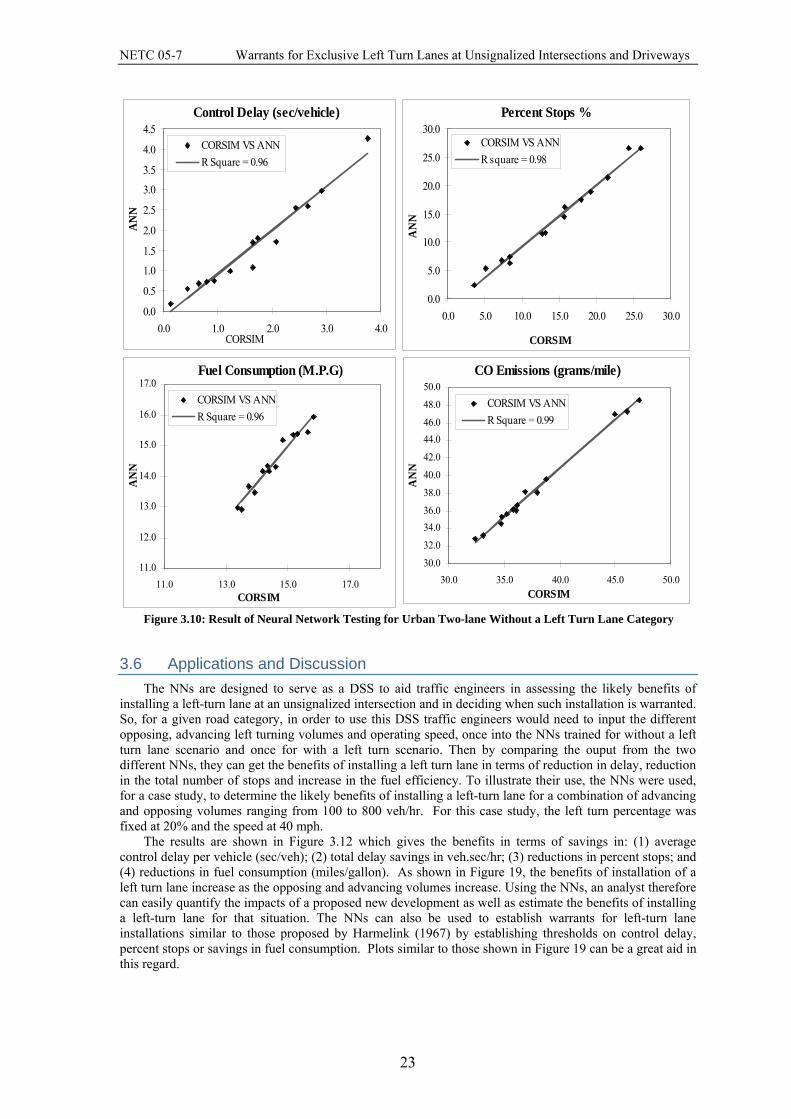
NETC 05-7 Warrants for Exclusive Left Turn Lanes at Unsignalized Intersections and Driveways
Control Delay (sec/vehicle)
0.0
0.5
1.0
1.5
2.0
2.5
3.0
3.5
4.0
4.5
0.0 1.0 2.0 3.0 4.0CORSIM
AN
NCORSIM VS ANNR Square = 0.96
Percent Stops %
0.0
5.0
10.0
15.0
20.0
25.0
30.0
0.0 5.0 10.0 15.0 20.0 25.0 30.0
CORSIM
AN
N
CORSIM VS ANNR square = 0.98
Fuel Consumption (M.P.G)
11.0
12.0
13.0
14.0
15.0
16.0
17.0
11.0 13.0 15.0 17.0CORSIM
AN
N
CORSIM VS ANNR Square = 0.96
CO Emissions (grams/mile)
30.0
32.0
34.036.0
38.0
40.0
42.0
44.046.0
48.0
50.0
30.0 35.0 40.0 45.0 50.0CORSIM
AN
NCORSIM VS ANNR Square = 0.99
Figure 3.10: Result of Neural Network Testing for Urban Two-lane Without a Left Turn Lane Category
3.6 Applications and Discussion The NNs are designed to serve as a DSS to aid traffic engineers in assessing the likely benefits of
installing a left-turn lane at an unsignalized intersection and in deciding when such installation is warranted. So, for a given road category, in order to use this DSS traffic engineers would need to input the different opposing, advancing left turning volumes and operating speed, once into the NNs trained for without a left turn lane scenario and once for with a left turn scenario. Then by comparing the ouput from the two different NNs, they can get the benefits of installing a left turn lane in terms of reduction in delay, reduction in the total number of stops and increase in the fuel efficiency. To illustrate their use, the NNs were used, for a case study, to determine the likely benefits of installing a left-turn lane for a combination of advancing and opposing volumes ranging from 100 to 800 veh/hr. For this case study, the left turn percentage was fixed at 20% and the speed at 40 mph.
The results are shown in Figure 3.12 which gives the benefits in terms of savings in: (1) average control delay per vehicle (sec/veh); (2) total delay savings in veh.sec/hr; (3) reductions in percent stops; and (4) reductions in fuel consumption (miles/gallon). As shown in Figure 19, the benefits of installation of a left turn lane increase as the opposing and advancing volumes increase. Using the NNs, an analyst therefore can easily quantify the impacts of a proposed new development as well as estimate the benefits of installing a left-turn lane for that situation. The NNs can also be used to establish warrants for left-turn lane installations similar to those proposed by Harmelink (1967) by establishing thresholds on control delay, percent stops or savings in fuel consumption. Plots similar to those shown in Figure 19 can be a great aid in this regard.
23

NETC 05-7 Warrants for Exclusive Left Turn Lanes at Unsignalized Intersections and Driveways
Figure 3.11: Result of Neural Network Testing for Urban two-lane with a left turn lane category. It should be noted that for emissions, the research team found out that there was not a significant
reduction in emissions levels resulting from the installation of left turn lanes. Gives that these results are based on the CORSIM simulation model, two explanations are possible. The first explanation is that the emission model in CORSIM is not that sensitive to changes in operational conditions (i.e. speed, stops, etc.). The alternative explanation is that it is not possible to justify the installation of left-turn lanes on the basis of reductions in emissions levels. This point deserves further investigation.
The benefits of installation of left turn lane at different road categories, for different operating speeds and for different left turning percentage are presented in the Appendix B (Figure B.1 to B.27).
Control Delay (sec/veh)
0.0
0.5
1.0
1.5
2.0
2.5
3.0
3.5
4.0
4.5
0.0 1.0 2.0 3.0 4.0 5.0
CORSIM
AN
N
CORSIM VS ANNRSquare = 0.96
Percent Stops (% )
0.0
5.0
10.0
15.0
20.0
25.0
30.0
0.0 5.0 10.0 15.0 20.0 25.0 30.0CORSIM
AN
N
CORSIM VS ANN
RSquare = 0.98
Fuel Consumption (M.P.G)
12.0
12.5
13.0
13.5
14.0
14.5
15.0
15.5
16.0
16.5
12.0 13.0 14.0 15.0 16.0 17.0
CORSIM
AN
N
CORSIM VS ANN
RSquare = 0.95
CO Emissions (grams/mile)
30.0
32.0
34.0
36.0
38.0
40.0
42.0
44.0
46.0
48.0
50.0
30.0 35.0 40.0 45.0 50.0
CORSIM
AN
N
CORSIM VS ANN
RSquare = 0.99
24

NETC 05-7 Warrants for Exclusive Left Turn Lanes at Unsignalized Intersections and Driveways
0500
1000
0
500
10000
5
10
15
VA (vph)
Control Delay savings(sec/veh)
VO (vph)
CD
(sec
/hou
r)
2
4
6
8
10
0500
1000
0
500
10000
5000
10000
VA(vph)
Total Delay savings(sec/hour)
VO(vph)
TD(s
ec/h
our)
2000
4000
6000
8000
0500
1000
0
500
1000-20
0
20
40
VA(vph)
% Stops reduction)
VO(vph)
% S
tops
0
5
10
15
20
25
30
0500
1000
0
500
1000-5
0
5
10
VA(vph)
Reduction in fuel consumption(M.P.G)
VO(vph)
FC(M
.P.G
)
0
1
2
3
4
5
6
Figure 3.12: Left Turn Installation Benefits
25
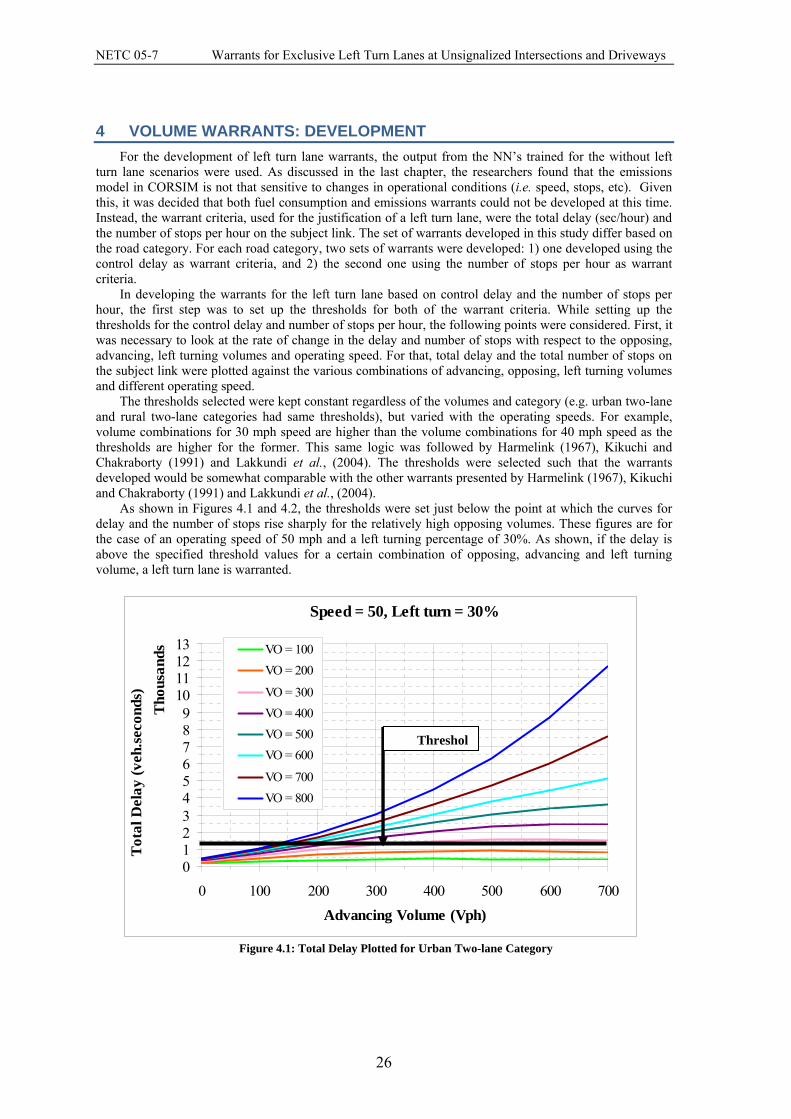
NETC 05-7 Warrants for Exclusive Left Turn Lanes at Unsignalized Intersections and Driveways
4 VOLUME WARRANTS: DEVELOPMENT For the development of left turn lane warrants, the output from the NN’s trained for the without left
turn lane scenarios were used. As discussed in the last chapter, the researchers found that the emissions model in CORSIM is not that sensitive to changes in operational conditions (i.e. speed, stops, etc). Given this, it was decided that both fuel consumption and emissions warrants could not be developed at this time. Instead, the warrant criteria, used for the justification of a left turn lane, were the total delay (sec/hour) and the number of stops per hour on the subject link. The set of warrants developed in this study differ based on the road category. For each road category, two sets of warrants were developed: 1) one developed using the control delay as warrant criteria, and 2) the second one using the number of stops per hour as warrant criteria.
In developing the warrants for the left turn lane based on control delay and the number of stops per hour, the first step was to set up the thresholds for both of the warrant criteria. While setting up the thresholds for the control delay and number of stops per hour, the following points were considered. First, it was necessary to look at the rate of change in the delay and number of stops with respect to the opposing, advancing, left turning volumes and operating speed. For that, total delay and the total number of stops on the subject link were plotted against the various combinations of advancing, opposing, left turning volumes and different operating speed.
The thresholds selected were kept constant regardless of the volumes and category (e.g. urban two-lane and rural two-lane categories had same thresholds), but varied with the operating speeds. For example, volume combinations for 30 mph speed are higher than the volume combinations for 40 mph speed as the thresholds are higher for the former. This same logic was followed by Harmelink (1967), Kikuchi and Chakraborty (1991) and Lakkundi et al., (2004). The thresholds were selected such that the warrants developed would be somewhat comparable with the other warrants presented by Harmelink (1967), Kikuchi and Chakraborty (1991) and Lakkundi et al., (2004).
As shown in Figures 4.1 and 4.2, the thresholds were set just below the point at which the curves for delay and the number of stops rise sharply for the relatively high opposing volumes. These figures are for the case of an operating speed of 50 mph and a left turning percentage of 30%. As shown, if the delay is above the specified threshold values for a certain combination of opposing, advancing and left turning volume, a left turn lane is warranted.
Speed = 50, Left turn = 30%
0123456789
10111213
0 100 200 300 400 500 600 700
Tho
usan
ds
Advancing Volume (Vph)
Tot
al D
elay
(veh
.sec
onds
)
VO = 100VO = 200
VO = 300VO = 400VO = 500VO = 600
VO = 700VO = 800
Figure 4.1: Total Delay Plotted for Urban Two-lane Category
Threshol
26
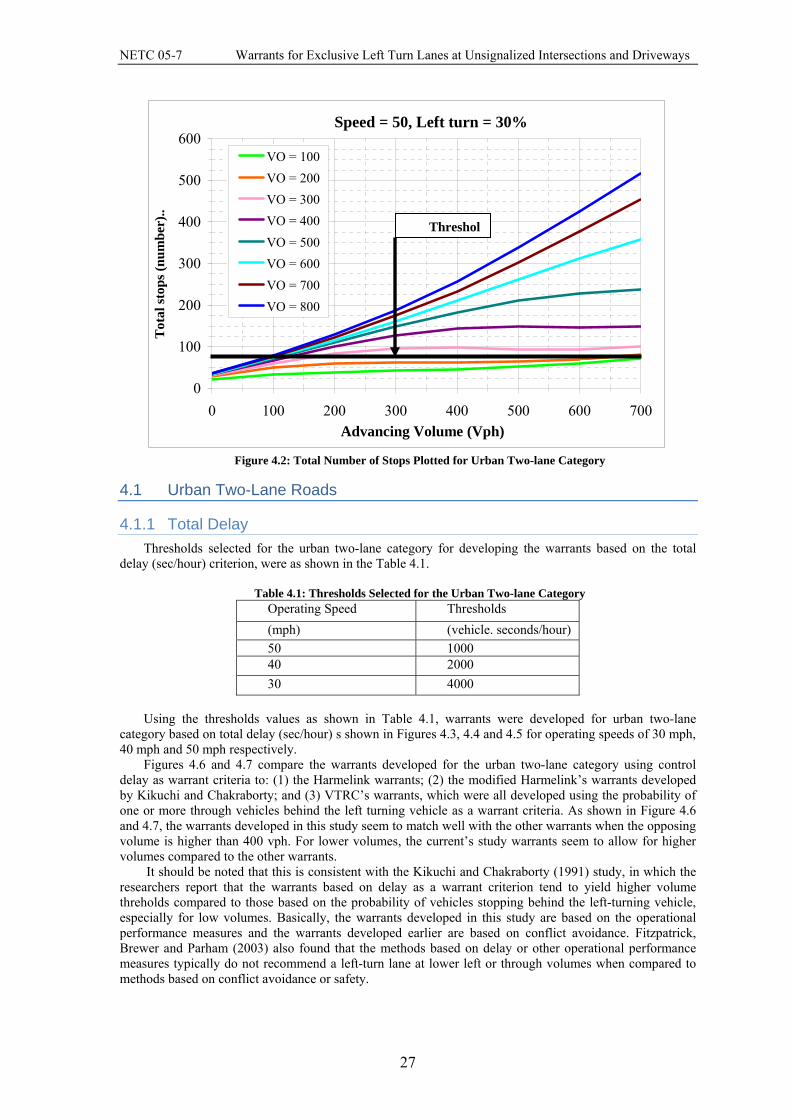
NETC 05-7 Warrants for Exclusive Left Turn Lanes at Unsignalized Intersections and Driveways
Speed = 50, Left turn = 30%
0
100
200
300
400
500
600
0 100 200 300 400 500 600 700Advancing Volume (Vph)
Tot
al st
ops (
num
ber)
..VO = 100VO = 200VO = 300VO = 400VO = 500VO = 600VO = 700VO = 800
Figure 4.2: Total Number of Stops Plotted for Urban Two-lane Category
Threshol
4.1 Urban Two-Lane Roads
4.1.1 Total Delay Thresholds selected for the urban two-lane category for developing the warrants based on the total
delay (sec/hour) criterion, were as shown in the Table 4.1.
Table 4.1: Thresholds Selected for the Urban Two-lane Category Operating Speed Thresholds (mph) (vehicle. seconds/hour) 50 1000 40 2000 30 4000
Using the thresholds values as shown in Table 4.1, warrants were developed for urban two-lane
category based on total delay (sec/hour) s shown in Figures 4.3, 4.4 and 4.5 for operating speeds of 30 mph, 40 mph and 50 mph respectively.
Figures 4.6 and 4.7 compare the warrants developed for the urban two-lane category using control delay as warrant criteria to: (1) the Harmelink warrants; (2) the modified Harmelink’s warrants developed by Kikuchi and Chakraborty; and (3) VTRC’s warrants, which were all developed using the probability of one or more through vehicles behind the left turning vehicle as a warrant criteria. As shown in Figure 4.6 and 4.7, the warrants developed in this study seem to match well with the other warrants when the opposing volume is higher than 400 vph. For lower volumes, the current’s study warrants seem to allow for higher volumes compared to the other warrants. It should be noted that this is consistent with the Kikuchi and Chakraborty (1991) study, in which the researchers report that the warrants based on delay as a warrant criterion tend to yield higher volume threholds compared to those based on the probability of vehicles stopping behind the left-turning vehicle, especially for low volumes. Basically, the warrants developed in this study are based on the operational performance measures and the warrants developed earlier are based on conflict avoidance. Fitzpatrick, Brewer and Parham (2003) also found that the methods based on delay or other operational performance measures typically do not recommend a left-turn lane at lower left or through volumes when compared to methods based on conflict avoidance or safety.
27

NETC 05-7 Warrants for Exclusive Left Turn Lanes at Unsignalized Intersections and Driveways
Warrants, Speed = 30 mph
0
100
200
300
400
500
600
700
800
0 100 200 300 400 500 600 700 800Opposing Volume (veh/hour)
Adv
anci
ng V
olum
e (V
eh/h
our)
.
10%20%30%
Figure 4.3: Warrants for urban two-lane category for operating speed 30 mph
Warrants, Speed =40 mph
100
200
300
400
500
600
700
800
100 200 300 400 500 600 700 800Opposing Volume (Veh/hour)
Adv
anci
ng V
olum
e (V
eh/h
our)
)
10%20%30%
Figure 4.4: Warrants for urban two-lane category for operating speed 40 mph
28

NETC 05-7 Warrants for Exclusive Left Turn Lanes at Unsignalized Intersections and Driveways
Warrants, Speed = 50 mph
0
100
200
300
400
500
600
700
800
0 100 200 300 400 500 600 700 800Opposing Volume (Veh/hour)
Adv
anci
ng V
olum
e (V
eh/h
our)
.
.
10%20%30%
Figure 4.5: Warrants for urban two-lane category for operating speed 50 mph
Warrants, Speed = 40 mph, Left turn = 30%
0
100
200
300
400
500
600
700
800
0 100 200 300 400 500 600 700 800Opposing Volumes (veh/hour)
Adv
anci
ng V
olum
e (v
eh/h
our)
.
Harmelink's Modified Harmelink's UVM'sVTRC's
Figure 4.6: Comparison of the new left turn lane warrants with different warrants
29
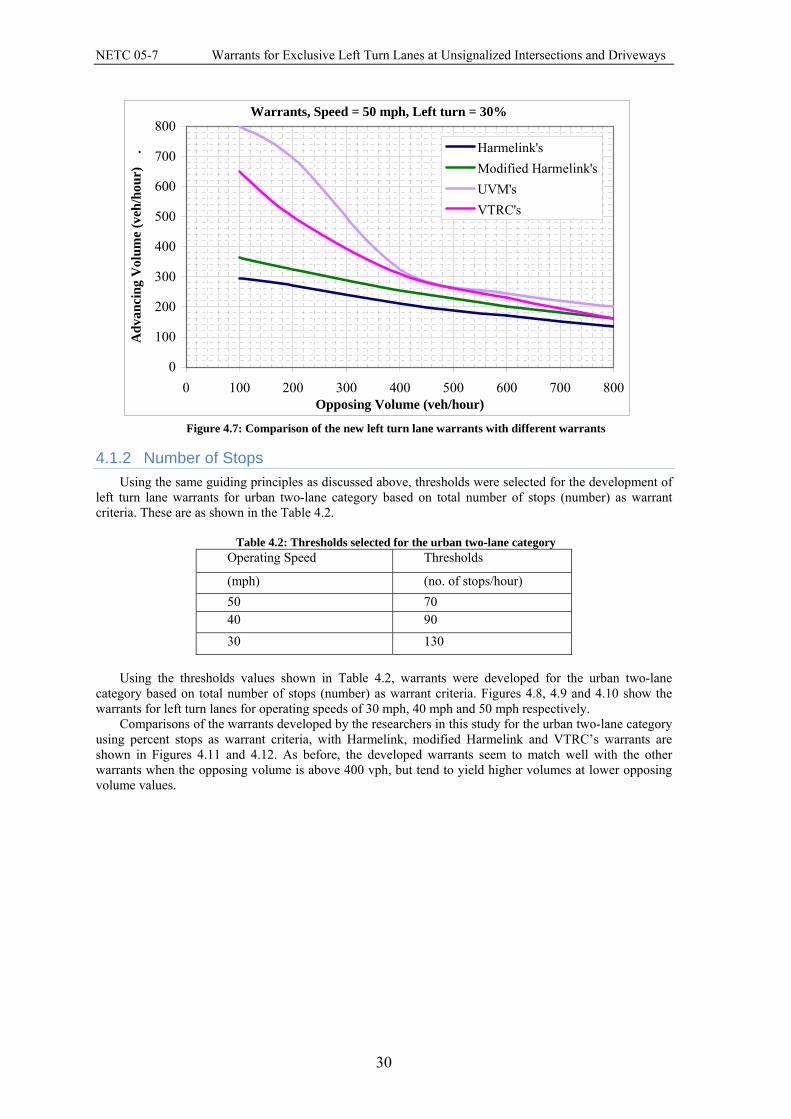
NETC 05-7 Warrants for Exclusive Left Turn Lanes at Unsignalized Intersections and Driveways
Warrants, Speed = 50 mph, Left turn = 30%
0
100
200
300
400
500
600
700
800
0 100 200 300 400 500 600 700 800Opposing Volume (veh/hour)
Adv
anci
ng V
olum
e (v
eh/h
our)
. Harmelink's
Modified Harmelink'sUVM'sVTRC's
Figure 4.7: Comparison of the new left turn lane warrants with different warrants
4.1.2 Number of Stops Using the same guiding principles as discussed above, thresholds were selected for the development of
left turn lane warrants for urban two-lane category based on total number of stops (number) as warrant criteria. These are as shown in the Table 4.2.
Table 4.2: Thresholds selected for the urban two-lane category
Operating Speed Thresholds
(mph) (no. of stops/hour) 50 70 40 90 30 130
Using the thresholds values shown in Table 4.2, warrants were developed for the urban two-lane
category based on total number of stops (number) as warrant criteria. Figures 4.8, 4.9 and 4.10 show the warrants for left turn lanes for operating speeds of 30 mph, 40 mph and 50 mph respectively.
Comparisons of the warrants developed by the researchers in this study for the urban two-lane category using percent stops as warrant criteria, with Harmelink, modified Harmelink and VTRC’s warrants are shown in Figures 4.11 and 4.12. As before, the developed warrants seem to match well with the other warrants when the opposing volume is above 400 vph, but tend to yield higher volumes at lower opposing volume values.
30

NETC 05-7 Warrants for Exclusive Left Turn Lanes at Unsignalized Intersections and Driveways
Warrants, Speed = 30 mph
0
100
200
300
400
500
600
700
800
0 100 200 300 400 500 600 700 800
Opposing Volume (veh/hour)
Adv
anci
ng V
olum
e (v
eh/h
our)
.
10%20%30%
Figure 4.8: Warrants for urban two-lane category for operating speed 30 mph
Warrants, Speed = 40 mph
0
100
200
300
400
500
600
700
800
0 100 200 300 400 500 600 700 800
Opposing Volume (veh/hour)
Adv
anci
ng V
olum
e (v
eh/h
our)
.
10%20%30%
Figure 4.9: Warrants for urban two-lane category for operating speed 40 mph
31

NETC 05-7 Warrants for Exclusive Left Turn Lanes at Unsignalized Intersections and Driveways
Warrants, Speed = 50 mph
0
100
200
300
400
500
600
700
800
0 100 200 300 400 500 600 700 800
Opposing Volume (veh/hour)
Adv
anci
ng V
olum
e (v
eh/h
our)
10%20%30%
Figure 4.10: Warrants for urban two-lane category for operating speed 40 mph
Warrants, Speed = 50 mph, Left turn = 30%
0
100
200
300
400
500
600
700
800
0 100 200 300 400 500 600 700 800Opposing Volume (veh/hour)
Adv
anci
ng V
olum
e (v
eh/h
our)
. Harmelink's
Modified Harmelink'sUVM'sVTRC's
Figure 4.11: Comparison of the new left turn lane warrants with different warrants
32

NETC 05-7 Warrants for Exclusive Left Turn Lanes at Unsignalized Intersections and Driveways
Warrants, Speed = 40 mph, Left turn = 30%
0
100
200
300
400
500
600
700
800
0 100 200 300 400 500 600 700 800
Opposing Volume (veh/hour)
Adv
anci
ng V
olum
e (v
eh/h
our)
. Harmelink's
Modified Harmelink'sUVM'sVTRC's
Figure 4.12: Comparison of the new left turn lane warrants with different warrants
4.1.3 Comparison between Criteria The warrants for the urban two-lane category developed using total delay as warrant criteria were
compared to the warrants developed using total number of stops. As can be observed from Figures 4.13, 4.14 and 4.15, the warrants developed using the different warrant criteria tend to produce results which are very close to each other, which is quite favorable because it increases the confidence level in the warrants developed in this study. Since, both sets of warrants developed in this study are based on performance operational measures; it is not surprising if they are very much close to each other.
Operating speed = 30 mph, left turn = 30%
0
100
200
300
400
500
600
700
800
900
0 100 200 300 400 500 600 700 800 900Opposing Volume (vph)
Adv
anci
ng V
olum
e (v
ph)
.
Warrants based on totaldelayWarrants based on numberof stops
Figure 4.13: Comparison between Warrants Developed Using Different Criteria
33
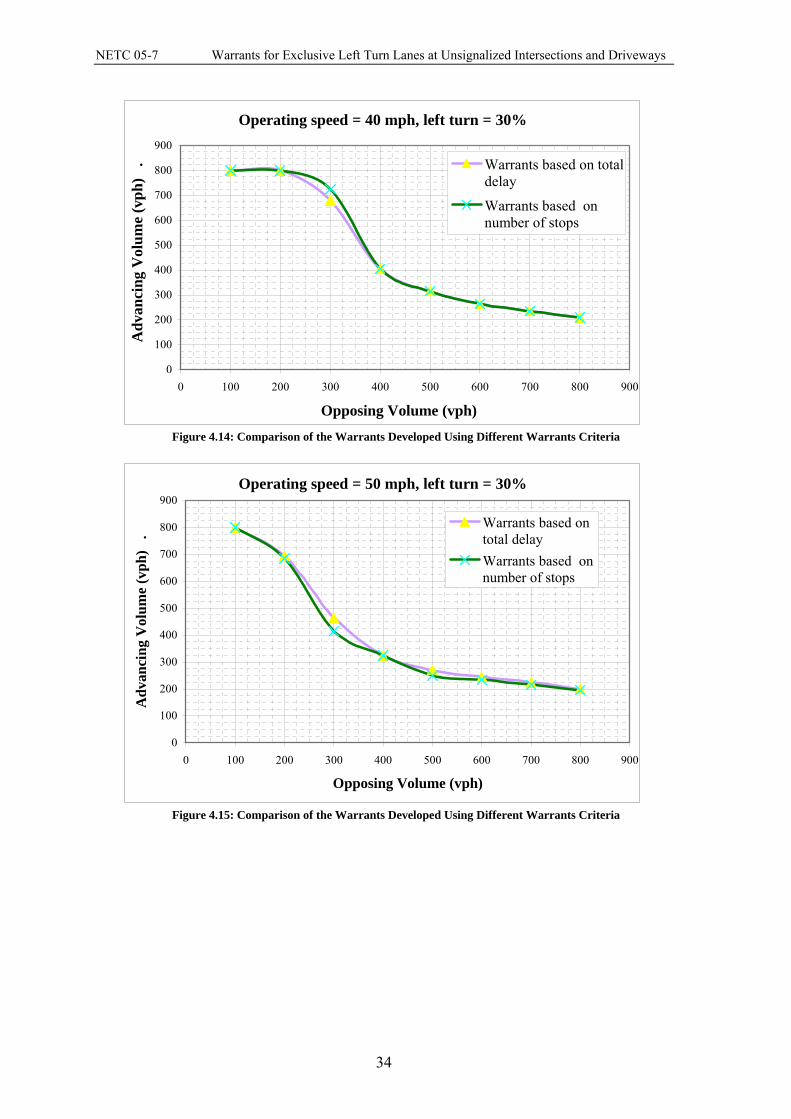
NETC 05-7 Warrants for Exclusive Left Turn Lanes at Unsignalized Intersections and Driveways
Operating speed = 40 mph, left turn = 30%
0
100
200
300
400
500
600
700
800
900
0 100 200 300 400 500 600 700 800 900
Opposing Volume (vph)
Adv
anci
ng V
olum
e (v
ph)
. Warrants based on totaldelay
Warrants based onnumber of stops
Figure 4.14: Comparison of the Warrants Developed Using Different Warrants Criteria
Operating speed = 50 mph, left turn = 30%
0
100
200
300
400
500
600
700
800
900
0 100 200 300 400 500 600 700 800 900
Opposing Volume (vph)
Adv
anci
ng V
olum
e (v
ph)
.
Warrants based ontotal delayWarrants based onnumber of stops
Figure 4.15: Comparison of the Warrants Developed Using Different Warrants Criteria
34

NETC 05-7 Warrants for Exclusive Left Turn Lanes at Unsignalized Intersections and Driveways
4.2 Rural Two-Lane Roads
4.2.1 Total Delay Thresholds selected for the rural two-lane category for developing the warrants based on total delay
(sec/hour) criteria, were similar to those for the urban two-lane category as shown in the Table 4.3. Figure 4.16 shows an example of the warrants developed for rural two-lane category based on the total delay as warrant criteria for operating speed of 40 mph and left turning percentages of 10%, 20% and 30%. The warrants for the other operating speeds such as 30 mph and 50 mph and the different left turning percentage are presented in Appendix A (Figure A.1 and Figure A.2).
Warrants, Speed = 40 mph
0
100
200
300
400
500
600
700
800
0 100 200 300 400 500 600 700 800Opposing Volume (veh/hour)
Adv
anci
ng V
olum
e (v
eh/h
ou 10%20%30%
Figure 4.16: Warrants for Rural Two-Lane Category for Operating Speed of 40 Mph
4.2.2 Number of Stops The total number of stops thresholds selected for the rural two-lane category was similar to those for
the urban two-lane category (to be shown in Table 4.4). Figure 4.17 shows a sample of the warrants developed for rural two-lane category based on the total number of stops for operating speed of 40 mph and left turning percentages of 10%, 20% and 30%. The warrants for the other operating speeds such as 30 mph and 50 mph and the different left turning percentage are presented in Appendix A (Figure A.3 and Figure A.4).
4.2.3 Comparison between Criteria Like the urban two-lane warrants, the warrants for rural two-lane category developed using different
warrant criteria such as total delay (veh.sec/hour) and total number of stops (number) on the subject link were compared to each other. As observed in the Figure 4.18, the warrants based on the different criteria again are very close to each other which is quite favorable for the reason explained earlier.
35

NETC 05-7 Warrants for Exclusive Left Turn Lanes at Unsignalized Intersections and Driveways
Warrants Rural 2 lane, Speed = 40 mph
0
100
200
300
400
500
600
700
800
0 100 200 300 400 500 600 700 800
Opposing Volume (veh/hour)
Adv
anci
ng V
olum
e (v
eh/h
our)
10%20%30%
Figure 4.17: Warrants for Rural Two-Lane Category for Operating Speed of 40 Mph
Operating speed = 30 mph, left turn = 30%
0
100
200
300
400
500
600
700
800
0 100 200 300 400 500 600 700 800 900
Opposing Volume (vph)
Adv
anci
ng V
olum
e (v
ph)
.
Warrants based on totaldelayWarrants based on totalstops
Figure 4.18: Comparison of the Warrants Developed Using Different Warrants Criteria
36

NETC 05-7 Warrants for Exclusive Left Turn Lanes at Unsignalized Intersections and Driveways
4.3 Urban Four-Lane Roads
4.3.1 Total Delay Warrants were also developed for the urban four-lane category based on the two different warrant
criteria. The thresholds selected for the development of left turn lane warrants based on total delay (veh.sec/hour) are shown in Table 4.3.
Table 4.3: Thresholds Selected for the Urban Four-lane Category
Operating Speed Thresholds
(mph) (vehicle. seconds/hour)
50 4000 40 10000 30 30000
Figure 4.19 shows the warrants developed using the thresholds shown in Table 4.3 for an operating
speed of 50 mph and left turning percentages of 10%, 20% and 30%. Warrants for other operating speeds such as 30 mph and 40 mph are presented in the Appendix A (Figure A.5 and Figure A.6).
Warrants, Speed = 50 mph
0
200
400
600
800
1000
1200
1400
1600
0 200 400 600 800 1000 1200 1400 1600Opposing Volume (veh/hour)
Adv
anci
ng V
olum
e (v
eh/h
our) 10%
20%30%
Figure 4.19: Warrants for the Left Turn Lane for the Urban Four-lane Category
37

NETC 05-7 Warrants for Exclusive Left Turn Lanes at Unsignalized Intersections and Driveways
4.3.2 Number of Stops The thresholds selected for the development of left turn lane warrants based on the total number of
stops on the subject link (number) for the urban four-lane category, are shown in the Table 4.4. Figure 4.20 shows the developed warrants for an operating speed of 50 mph and left turning percentages of 10%, 20% and 30%. Warrants for other operating speeds such as 30 mph and 40 mph are presented in the Appendix A (Figure A.7 and Figure A.8).
Table 4.4: Thresholds Selected for the Urban Four-lane Category
Operating Speed Thresholds (mph) (vehicle. seconds/hour)
50 80 40 100 30 130
Warrants, Speed = 50 mph
0
200
400
600
800
1000
1200
1400
1600
0 200 400 600 800 1000 1200 1400 1600
Opposing Volume (veh/hour)
Adv
anci
ng V
olum
e (v
eh/h
our)
.
10%20%30%
Figure 4.20: Warrants for the Left Turn Lane for the Urban Four-lane Category
4.4 Comparison among Road Categories Though, the thresholds used for developing the warrants were the same for both of the categories, the
warrants developed for rural two-lane category were different than the warrants developed for urban two-lane category. The main reason behind this was the fact that the gap acceptance distribution for rural two-lane category was found to be higher than that for the urban two-lane category as discussed earlier. Figure 4.21 shows the comparison between warrants for the different road categories for an operating speed of 50 mph and left turning percentage of 30%. As observed, while the warrants for the urban two-lane and rural two-lane appear to be quite similar to one another, the warrants for the four-lane urban category are quite different. This indicates the need to distinguish between two-lane and four-lane roads when assessing the need for a left-turn lane at an unsignalized intersection.
38

NETC 05-7 Warrants for Exclusive Left Turn Lanes at Unsignalized Intersections and Driveways
Operating Speed = 50 mph, left turn = 30%
0
100
200
300
400
500
600
700
800
0 200 400 600 800 1000
Opposing Volume (vph)
Adv
anci
ng V
olum
e (v
ph)
.Warrants for urbantwo lanes categoryWarrants for ruraltwo lanes categoryWarrants for urbanfour lane category
Figure 4.21: Comparison of warrants for urban two-lane and rural two-lane based on total delay
39

NETC 05-7 Warrants for Exclusive Left Turn Lanes at Unsignalized Intersections and Driveways
5 SAFETY ANALYSIS: METHODOLOGY
5.1 General Study Approach This part of the study is focused on learning whether or not the presence of a left turn lane at an
unsignalized intersection or driveway has a significant effect on the occurrence of crashes. This requires assembling a data set of crashes observed at unsignalized intersections both with and without left turn lanes, controlling for other features expected to influence the occurrence of crashes. We originally considered conducting this as a before-after analysis of the safety effect of installing left turn lanes, however, we found that the number of intersections at which left turn lanes were added was very small, and the number at which all of the needed information to conduct a proper analysis was available was even smaller so as to make this impractical.
Instead we chose a different approach. We collected crash and traffic volume data at a large number of unsignalized intersections without left turn lanes and estimated base line crash prediction models that could be used to predict the expected number of crashes at similar intersections with left turn lanes. Using generalized linear modeling, we estimated models for different types of intersections categorized by the area type (rural or urban), the number of lanes on the major road (2 or 4), and the number of approach legs (3 or 4). These characteristics are considered to be important because they affect the nature and character of the vehicle interactions in the intersection, and thus, potentially the number of crashes and their distribution with respect to crash type as well as its severity. In rural areas, the number of unsignalized intersections on four-lane roads is very limited, so such intersections are not included in this study. This leaves six categories of intersections, coded as R2T, R2X, U2T, U2X, U4T and U4X, with the symbols denoted as follows:
R = rural; U = urban 2 = two-lane; 4 = four-lane T = t-intersection, or three-leg; X = crossing intersection, or four-leg For the crash prediction models, a negative binomial distribution is assumed, in which the occurrence
of crashes at a given location is a Poisson process, with the mean crash rate at locations with identical characteristics following a Gamma distribution. Rather than using covariates to represent the intersection characteristics, a separate model was estimated for each of the six intersection categories. The only covariate used was the variable Annual Average Daily Traffic (AADT), which is important for representing the effect of exposure on the total crash risk. The estimation models take the form:
10 ββμ ijij Ve= (5.1) Where
ijμ = the expected mean of the crashes occurring at intersection i in year j ;
= the AADT of the major road of the intersection i in yearijV j . The models were estimated using generalized linear modeling (GLIM) in the statistical software SAS®.
We also identified intersections with left turn lanes in each of the six categories and collected crash and volume data at them as well. For each intersection with a left turn lane, the estimated models were then used to predict the number of crashes expected at that intersection if it did not have a left turn lane. The idea is that if the observed crash count at an intersection with a left turn lane is significantly lower than what would be expected if it did not have a left turn lane, then there is evidence that the left turn lane creates a safer condition. This information can then be used to derive safety-based warrants to work in conjunction with the volume-based warrants. Roadway geometry was also considered in explaining differences in crash experience among different locations.
5.2 Selection of Study Sites The study sites were selected using the Connecticut Department of Transportation (ConnDOT)
photolog program, in which the entire state-maintained highway system is photographed annually using roadway image and data collection technology. Fifty intersections without left turn lanes were chosen for each intersection category except for the U4X category, in which only forty intersections could be found. Due to the small number of unsignalized intersections found with left turn lanes in one or both directions of the major road, the number of the study intersections in each intersections category varies from a minimum of 3 to a maximum of 21. Intersections are defined by the route number of the major road and the route mileages at which they are located. All of the selected intersections are located on undivided roads, without signalization and with no stop signs on the major road approaches. For all intersections selected, it was also
40

NETC 05-7 Warrants for Exclusive Left Turn Lanes at Unsignalized Intersections and Driveways
required that important geometric characteristics (e.g., lane width, shoulders, curvature), the surrounding environment, and traffic control remained unchanged during the 10-year period from 1995 to 2004 for which crash counts were collected. For some of the study intersections (those with left turn lanes), the presence of a left turn lane could not be verified before 1999. In those cases, crash records were only considered for the years from 1999 on. The study sites selected are summarized in Table 5.1.
Table 5.1: Data Describing Crash Study Intersections
Intersection Category
Left Turn Lane
Number of Intersections
Average AADT
Min AADT
Max AADT
Number of Crashes
R2T YES 13 13801 5400 30200 157 NO 50 10918 2200 30200 623
R2X YES 3 13988 7700 18700 44 NO 50 7425 1400 16300 620
U2T YES 21 13126 6700 25800 407 NO 50 12016 3500 28900 1103
U2X YES 4 11695 8300 15400 52 NO 50 9599 1600 26000 943
U4T YES 8 18714 8400 26700 326 NO 50 18479 8500 30000 1763
U4X YES 8 17082 12600 34800 355 NO 40 16472 8400 29400 1398
Crash records were collected from the ConnDOT Office of Policy and Planning over a 10-year period
from 1995 to 2004 at each selected study location, both with and without left turn lanes. These crash records are categorized by crash type and severity to more appropriately identify their consequences, as the objective is not just to reduce crashes, but to minimize their consequences as well. Since intersection-related crashes do not necessarily occur within the boundary of an intersection, crashes were gathered from within a buffering distance of 250 ft (76.2 m) along both major road approaches in each intersection. For cases in which there was another intersection within this 250 ft (76.2 m) distance, only crashes in the space between the intersections were used. The information collected from the crash records includes the year, date, time, severity, collision type, weather, and road surface condition.
The AADT’s on the major roads for each intersection were obtained from the ConnDOT Traffic Log for the 10-year period. The Traffic Log gives AADT at certain locations on the road, generally for every segment delineated by significant road intersections. The AADT nearest to the intersection and not separated from the study intersection by any other major intersection was used. In this case, a major intersection would be an intersection with comparable or greater importance in the road hierarchy.
The major roads are all state roads for which AADT data are available. Unfortunately, most of the intersecting roads are local roads and therefore have no such traffic data. It is desirable to have traffic data for both the major roads and the intersecting roads because some types of collisions, especially those involving turning or crossing vehicles, are related to interactions between vehicles entering from both from the major and the intersecting roads. The percentage of turning vehicles at the intersection might also be important for representing exposure to collisions related to vehicles turning.
5.3 Compilation of Data The presence of a left turn lane is very likely to affect, whether increase or decrease, some types of
crashes but not all. Rather than considering the total crash counts, which would potentially neutralize or cancel out the effect of the left turn lanes, we analyze crashes by collision type to determine what effect a left turn lane may have on a specific crash type.
The ConnDOT crash database categorizes each crash into one of 17 collision types, as listed in Table 5.2. Records coded as collision type 6, “Miscellaneous Non-Collision”, are not considered in this study. For the remaining 16 collision types, however, it is impractical to study each of them separately. It is more applicable to aggregate together several collision types, for which the safety is expected to be affected similarly by adding left turn lanes. Based on previous findings (Zhang et al. 2007) these collision types are combined into three categories for analysis as follows:
• Category 1: same direction crashes, including Turning-Same Direction, Sideswipe-Same Direction, Rear-end.
• Category 2: intersecting direction crashes, including Turning-Opposite Direction, Turning-Intersecting Paths and Angle.
41
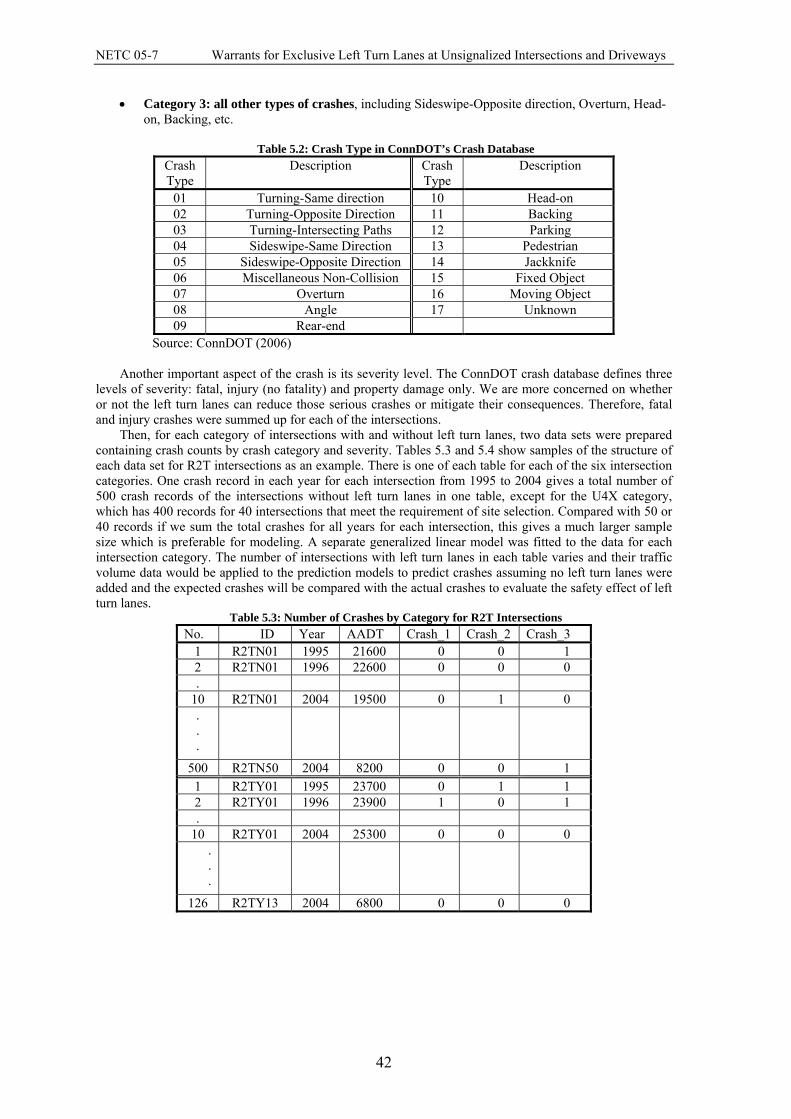
NETC 05-7 Warrants for Exclusive Left Turn Lanes at Unsignalized Intersections and Driveways
• Category 3: all other types of crashes, including Sideswipe-Opposite direction, Overturn, Head-on, Backing, etc.
Table 5.2: Crash Type in ConnDOT’s Crash Database
Crash Type
Description Crash Type
Description
01 Turning-Same direction 10 Head-on 02 Turning-Opposite Direction 11 Backing 03 Turning-Intersecting Paths 12 Parking 04 Sideswipe-Same Direction 13 Pedestrian 05 Sideswipe-Opposite Direction 14 Jackknife 06 Miscellaneous Non-Collision 15 Fixed Object 07 Overturn 16 Moving Object 08 Angle 17 Unknown 09 Rear-end
Source: ConnDOT (2006)
Another important aspect of the crash is its severity level. The ConnDOT crash database defines three levels of severity: fatal, injury (no fatality) and property damage only. We are more concerned on whether or not the left turn lanes can reduce those serious crashes or mitigate their consequences. Therefore, fatal and injury crashes were summed up for each of the intersections.
Then, for each category of intersections with and without left turn lanes, two data sets were prepared containing crash counts by crash category and severity. Tables 5.3 and 5.4 show samples of the structure of each data set for R2T intersections as an example. There is one of each table for each of the six intersection categories. One crash record in each year for each intersection from 1995 to 2004 gives a total number of 500 crash records of the intersections without left turn lanes in one table, except for the U4X category, which has 400 records for 40 intersections that meet the requirement of site selection. Compared with 50 or 40 records if we sum the total crashes for all years for each intersection, this gives a much larger sample size which is preferable for modeling. A separate generalized linear model was fitted to the data for each intersection category. The number of intersections with left turn lanes in each table varies and their traffic volume data would be applied to the prediction models to predict crashes assuming no left turn lanes were added and the expected crashes will be compared with the actual crashes to evaluate the safety effect of left turn lanes.
Table 5.3: Number of Crashes by Category for R2T Intersections No. ID Year AADT Crash_1 Crash_2 Crash_3
1 R2TN01 1995 21600 0 0 1 2 R2TN01 1996 22600 0 0 0 .
10 R2TN01 2004 19500 0 1 0 . . .
500 R2TN50 2004 8200 0 0 1 1 R2TY01 1995 23700 0 1 1 2 R2TY01 1996 23900 1 0 1 .
10 R2TY01 2004 25300 0 0 0 . . .
126 R2TY13 2004 6800 0 0 0
42

NETC 05-7 Warrants for Exclusive Left Turn Lanes at Unsignalized Intersections and Driveways
Table 5.4: Number of Fatal and Injury Crashes for R2T Intersections No. ID Year AADT Crash 1 R2TN01 1995 21600 0 2 R2TN01 1996 22600 0 .
10 R2TN01 2004 19500 2 . . .
500 R2TN50 2004 8200 1 1 R2TY01 1995 23700 0 2 R2TY01 1996 23900 0 .
10 R2TY01 2004 25300 0 . . .
126 R2TY13 2004 6800 0
5.4 Negative Binomial Modeling A traditional linear model restricts the response variable to a normal distribution. However, data are not
always normally distributed but they can be counts or proportions, etc. and their variances are not necessarily constant for all observations. The traditional linear model is not appropriate for modeling such data. In this case, the generalized linear model, as extensions of the traditional linear model, is applicable to more general distributions than the normal for the response. It allows the response probability distribution to be any member of an exponential family. A link function g is used to relate the linear component to the mean of the response variable, i.e.
βμ ')( ii xg = (5.2)here x is a column vector of covariates or explanatory variables, for observation ; β is the
coefl
W i
ficients to be estimated; and µi is the expected value of the response value for the i th obser ation. The link function g can be logit, log, or identical, etc. The variance of the response variab e yi depends on the mean µi by
iv
i
ii
VyVar
ωμφ )(
)( = (5.3)
Where ϕ is a dispersion parameter either known or estimated and ω is a known weight for each obse
irvation. A generalized linear model is fitted to the data by maximum likelihood estimation of the
parameter vectorβ . In SAS, GENMOD procedure provides modeling for the generalized linear model. Negative Binomial distribution, as a member of exponential distributions, is appropriately modeled by
a ge
(5.4) The distribution of
neralized linear model. In the traffic engineering area, Negative Binomial modeling is an accepted practice in crash modeling among the leading researchers today (Miaou 1994). It assumes that the number of crashes at a given location follows a Poisson distribution, while the mean of the crashes follows a Gamma distribution. The variance of the Negative Binomial distribution is
2)( κμμ +=yVar y ,
κ
κμκμκμ
κκ )( 1 +Γ − y 1)
11()
1(
!)()( 1 ++Γ= −
y
yyP (5.5)
approaches Poisson (µ) as κ becomes close to zero. The Negative Binomial distribution can accommodate
e discrete and correlated, Generalized Estimating Equations (GEEs) provides a prac
overdispersion. When a Poisson regression model does not fit the data and it appears that the variance of y is increasing faster than the Poisson model allows, a Negative Binomial model that is more dispersed can be an alternate choice. In SAS, the Negative Binomial modeling is requested by using dist = NB statement in the GENMOD procedure.
When the responses artical method to analyze such data. The GEEs was introduced by Liang and Zeger in 1986 to deal with
discrete correlated data. These data can be modeled as a generalized linear model except for the correlation among the responses. They are modeled using the same link function, but the covariance structure of the
43

NETC 05-7 Warrants for Exclusive Left Turn Lanes at Unsignalized Intersections and Driveways
correlated measurement must also be modeled. Let ijy , inj ,...,1= , Ki ,...,1= , represent the j th measure
on the i th subject, and let )(αiR be a inni × wo in on m he covariance matrix of iY can then be modeled as
rk g correlati atrix. T
21
21
)( ARAV αφ= iii (5.6)
where is a iA iin n× diagonal matrix with )(Var ijμ as the j th diagonal element and φ is the dispersion parameter. I S, the structure of the correlati n can be set as fixed, independent, exchangeable, unstructured and autoregressive. When the structure is autoregressive AR (1), the correlation between ijy and tjiy +, would be
tα for
n SA working o
tjiij yyCorr =+ ),( , jnt i −= ,...2,1,0 (5.7) The fitting algorithm not a likelih
basefor GEEs is ood-based method of estimation, so inference measures
d on likelihood are not applicable to GEE methods. First, it computes an initial estimate of β with an ordinary generalized linear model and then the working correlations R is computed base on the standardized residuals; covariance is estimated by
d21
21
)( ARAV αφ= ;iii β is then updated by
⎥⎦
⎤⎢⎣
⎡−
∂∂
⎥⎦
⎤⎢⎣
⎡∂∂
∂∂
+= ∑∑=
−
− KK '1'
=
−+
iiii
i
i
ii
irr YVV
1
1
1
11 )( μ
βμ
βμ
βμ
ββ (5.8)
and then iterated until convergence. The model-based covariance of s given by
(5.9) Where
β̂ i1)ˆ( −= ICov β 0
∑=
−
∂∂
∂∂
=K
i
ii
i VI1
1'
0 βμ
βμ (5.10)
It’s the GEE equivalent of the inversed of the Fisher information matrix that is often used in generalized linear model as an estimator of the covariance of the maximum likelihood estimator ofβ . The estimator
=M 101
10
−− III (5.11) Where
∑=
−−
∂∂
∂∂
=K
i
iiii
i VYCovVI1
11'
1 )(βμ
βμ (5.12)
is called the empirical, or robust estimator of the covariance matrix of . It is a constant estimator even if l
5.5 Safety Performance Functions
β̂the working correlation matrix is mis-specified. Statistics that are helpfu in assessing the goodness of fit of an ordinary generalized linear model, such as the scale deviance, is not applicable when GEE method has been used. Lin, Wei and Ying (2002) present graphical and numerical methods for model assessment based on cumulative sums of residuals over certain coordinates, which can be used in model-checking for GEE modeling. The distribution of the residuals under the assumed model can be approximated by certain zero-mean Gaussian process. The observed residuals can then be compared with a number of simulations from the null distribution, which enable objective assessment whether the observed residual pattern reflects anything beyond random fluctuation. In SAS, the GEE solution is requested by using the REPEATED statement in the GENMOD procedure.
Once the crash and traffic volume data were ready, generalized linear models assuming Negative Binomial distribution were fitted to the data for the intersections without left turn lanes. The GEE method was used in all of the model fitting process to account for the correlation among the crashes in 10 years at each intersection arising from this repeated measures study design. The Safety Performance Functions (SPF) are obtained, relating the traffic volume to the occurrence of crashes, in the form of 10 ββμ ijij Ve= ,
where ijμ is the expected mean of the crashes occurring at intersection i in year j ; V is the A
major d for the intersection i in yearij ADT on the
roa j . 0β and 1β are the parameters esti at from the Negative Binomial modeling. Separate mod ls were f te to eac of the 6 intersection types by crash category.
m ede it d h
44
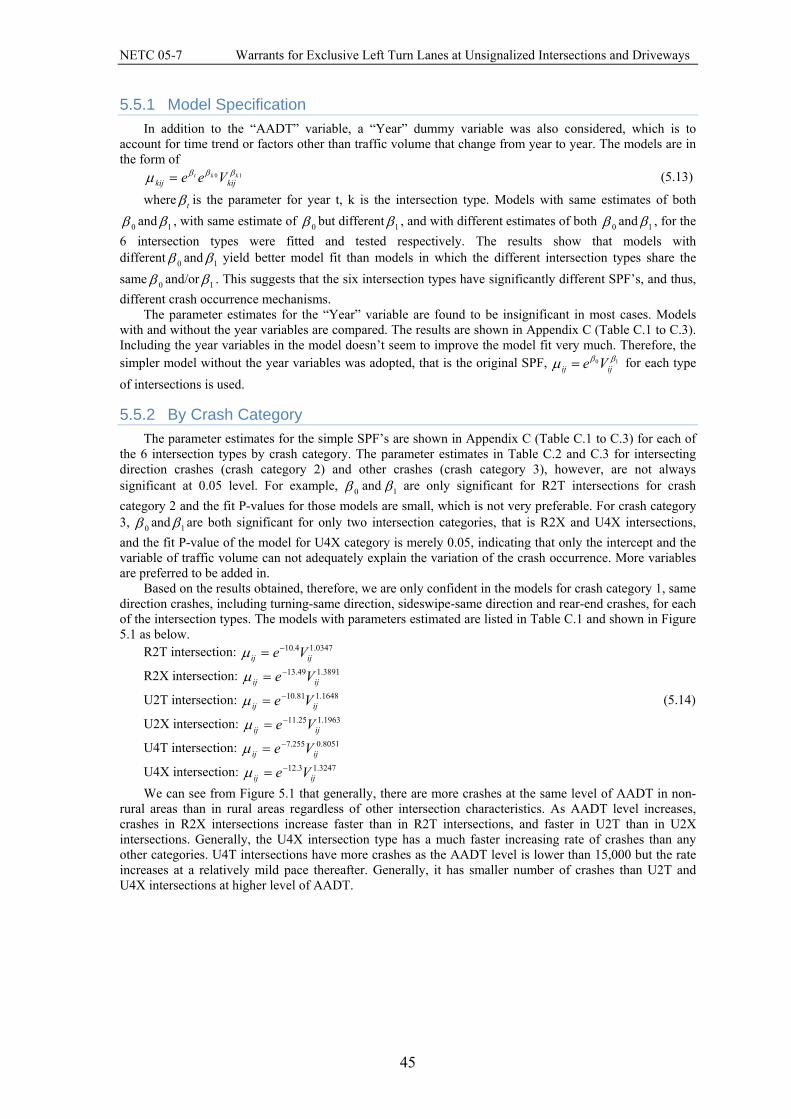
NETC 05-7 Warrants for Exclusive Left Turn Lanes at Unsignalized Intersections and Driveways
5.5.1 Model Specification In addition to the “AADT” variable, a “Year” dummy variable was also considered, which is to
account for time trend or factors other than traffic volume that change from year to year. The models are in the form of
10 kktkijkij Vee βββμ = (5.13)
where tβ is the parameter for year t, k is the intersection type. Models with same estimates of both
0β and 1β , with same estimate of 0β but different 1β , and with different estimates of both 0β and 1β , for the 6 intersection types were fitted and tested respectively. The results show that models with different 0β and 1β yield better model fit than models in which the different intersection types share the same 0β and/or 1β . This suggests that the six intersection types have significantly different SPF’s, and thus, different crash occurrence mechanisms.
The parameter estimates for the “Year” variable are found to be insignificant in most cases. Models with and without the year variables are compared. The results are shown in Appendix C (Table C.1 to C.3). Including the year variables in the model doesn’t seem to improve the model fit very much. Therefore, the simpler model without the year variables was adopted, that is the original SPF, for each type of intersections is used.
10 ββμ ijij Ve=
5.5.2 By Crash Category The parameter estimates for the simple SPF’s are shown in Appendix C (Table C.1 to C.3) for each of
the 6 intersection types by crash category. The parameter estimates in Table C.2 and C.3 for intersecting direction crashes (crash category 2) and other crashes (crash category 3), however, are not always significant at 0.05 level. For example, 0β and 1β are only significant for R2T intersections for crash category 2 and the fit P-values for those models are small, which is not very preferable. For crash category 3, 0β and 1β are both significant for only two intersection categories, that is R2X and U4X intersections, and the fit P-value of the model for U4X category is merely 0.05, indicating that only the intercept and the variable of traffic volume can not adequately explain the variation of the crash occurrence. More variables are preferred to be added in.
Based on the results obtained, therefore, we are only confident in the models for crash category 1, same direction crashes, including turning-same direction, sideswipe-same direction and rear-end crashes, for each of the intersection types. The models with parameters estimated are listed in Table C.1 and shown in Figure 5.1 as below.
R2T intersection: 0347.14.10ijij Ve−=μ
R2X intersection: 3891.149.13ijij Ve−=μ
U2T intersection: (5.14) 1648.181.10ijij Ve−=μ
U2X intersection: 1963.125.11ijij Ve−=μ
U4T intersection: 8051.0255.7ijij Ve−=μ
−U4X intersection: 3247.13.12ijij Ve=μ
We can see from Figure 5.1 that generally, there are more crashes at the same level of AADT in non-rural areas than in rural areas regardless of other intersection characteristics. As AADT level increases, crashes in R2X intersections increase faster than in R2T intersections, and faster in U2T than in U2X intersections. Generally, the U4X intersection type has a much faster increasing rate of crashes than any other categories. U4T intersections have more crashes as the AADT level is lower than 15,000 but the rate increases at a relatively mild pace thereafter. Generally, it has smaller number of crashes than U2T and U4X intersections at higher level of AADT.
45

NETC 05-7 Warrants for Exclusive Left Turn Lanes at Unsignalized Intersections and Driveways
Expected mean crashes vs. AADT for different intersection categories
0
1
2
3
4
0 5000 10000 15000 20000 25000 30000AADT
Expe
cted
mea
n cr
ashe
s R2T
R2X
U2T
U2X
U4T
U4X
Figure 5.1: Models for the Six Intersection Categories
Since the observed crashes in each year is a random variable with variation around the mean expected
value, in some years, the number of crashes might be higher than the mean and in other years, it might be lower than the mean. If we aggregate them all in several years, it would yield more consistent results. Therefore, we define a Safety Performance Function (SPF) for each intersection category, which is in the form of
∑∑==
===J
jij
J
jiji VeSPF
11
10 ββμμ (5.15)
er
wh e ijN , ijV , 0β and 1β are the same as stated before and is the sum of the expected mean
cras n
R2X intersection:
U2T intersection: (5.16)
U2X intersection:
U4T intersection:
U4X intersection:
The value computed from the SPF for an intersection can then be compared with the actual observed cras
5.5.3 By Crash Severity
iNto hes for i tersectio in years, which is 10 years from 1995 2004 in our case. This results in a
dataset with a much reduced umber of cases, but can be estimated using GLM rather than GEE methods. Thus we have the following SPF for crash category 1 for the 6 categories of intersections:
R2T intersection: ∑ −=J
0347.14.10
n ns J
=jijVeSPF
1
∑=
−=J
jijVeSPF
1
3891.149.13
∑=
−=J
jijVeSPF
1
1648.181.10
∑=
−=J
jijVeSPF
1
1963.125.11
∑=
−=J
jijVeSPF
1
8051.0255.7
∑=
−=J
jijVeSPF
1
3247.13.12
hes in one year for that intersection to evaluate the performance of the intersection.
The SPF’s as obtained above consider same direction crashes only, which seems not enough to completely assess the safety performance of an intersection. Therefore, models were estimated with total fatal and injury crashes as the dependent variable using the same methods as described above for estimating models of collision type. The parameter estimates are shown in Appendix C (Table C.4). For U2T intersections, neither of the estimates of 0β and 1β are significant. The fit P-values for U2X and U4T models are not high enough, indicating at a m del with only intercept and traffic volume is not sufficiently complete to explain the variation in crashes. Given that the intercept and traffic volume do have significant effect on crash occurrence, we will use these models to make complementary analysis to the study we have done previously on crash categories.
th o
46

NETC 05-7 Warrants for Exclusive Left Turn Lanes at Unsignalized Intersections and Driveways
The model estimation results are listed in Appendix C (Table C.4) and the models are graphed in Figure 5.2 and listed in Equation 5.17. Compared with the SPF’s for same direction crashes, the estimates of 1β are smaller for all intersection types with fatal and injury crashes, all of which are less than 1 except for U4T category.
R2T intersection: 4282.07492.4ijij Ve−=μ
R2X intersection: (5.17) 5331.04145.5ijij Ve−=μ
U2X intersection: 6057.09579.5ijij Ve−=μ
U4T intersection: 22531.1951.11ijij Ve−=μ
U4X intersection: 94697.07589.8ijij Ve−=μ
Expected mean crashes vs. AADT for different intersection categories
0
1
2
3
0 5000 10000 15000 20000 25000 30000AADT
Expe
cted
mea
n cr
ashe
s
R2T
R2X
U2X
U4T
U4X
Figure 5.2: Models for Fatalities and Injuries
Figure 5.2 shows that at the same level of AADT, there are more crashes in non-rural areas than in
rural areas. Intersections with 4 lanes in the major road have much higher crash rates than any other intersections. Intersections with 2 lane roads have much slower increase of crashes along the increase of AADT. In rural area, R2X intersections have more expected crashes than R2T intersections. In all, we may come to the conclusion that U4T and U4X categories of intersections are the most dangerous places not only because a large number of crashes are expected to occur there but also because these crashes tend to be more severe than those in other intersections.
Similarly, we established an overall SPF for fatal and injury crashes over all 10 years for each of the intersection category except for the U2T category. They are shown below.
R2T intersection: ∑=
−=J
jijVeSPF
1
4282.07492.4
R2X intersection: ∑=
−=J
jijVeSPF
1
5331.04145.5
U2X intersection: (5.18) ∑=
−=J
jijVeSPF
1
6057.09579.5
U4T intersection: ∑=
−=J
jijVeSPF
1
22531.1951.11
U4X intersection: ∑=
−=J
jijVeSPF
1
94697.07589.8
The value computed from the SPF can then be compared to the actual observed crashes with fatalities
or injuries to evaluate the safety performance of the intersection.
5.6 Prediction and Comparison As stated above, the expected number of crashes was predicted using the SPF for the intersections with
left turn lanes for each year. The prediction will then be compared with the actual observed crashes to see
47

NETC 05-7 Warrants for Exclusive Left Turn Lanes at Unsignalized Intersections and Driveways
whether having the left turn lane results in safer condition. However, we are not confident to say that the intersection has positive safety effect so long as the observed crashes are fewer than the expected or vice versa. It is reasonable that variation around the expected value exists since the number of crashes is a random variable. Therefore, it is necessary to work out an interval corresponding to each expected value so that the observed crashes can be compared to the interval rather than the expected mean value. Observed crashes that fall within the interval could be considered to have the same expected mean value obtained from the SPF. Conversely, those beyond the interval are to be considered to have significantly different mean values than values estimated from the SPF. Thus we can make a conclusion whether the safety at an intersection is significantly different from its peers based on its crash records. In order to predict a single crash count for each intersection it is necessary to aggregate the predictions for each of the 10 years of observed AADT, thus masking the true distribution of the predicted counts. However, the crash counts aggregated over 10 years are less likely to be overdispersed, so a Poisson distribution should be a reasonable assumption. We use the Probability Distribution Function of the Poisson distribution,
!)(
yeyP
y λλ −
= (5.19)
to compute and , where N is the total number of observed crashes within ten years at an intersection. Then, for any left turn lane intersection for which or
)( NyP ≥ )( NyP ≤)( NyP ≥ )( NyP ≤ is less than a set
value (for example, 0.05), we can say that its expected mean of crashes is different from that obtained from the SPF, that is, from the sample of similar intersections without left turn lanes. What this means is that an intersection can be considered significantly safer if )( NyP ≤ is less than the set value and significantly more dangerous if the is less than that set value. )N≥(yP
5.7 Consideration of Physical Characteristics Another concern of this study is to develop safety design guidelines for exclusive left turn lanes. After
we have found those that are significantly safer and more dangerous, we can further investigate their physical characteristics as well as the design feature of their left turn lanes to find some clues for the safety performance of the intersection. More reasonable judgment can then be made on whether it is the left turn lanes or the other features that make the intersections safer or more dangerous.
In those intersections where left turn lanes have a positive safety effect, the design of the left turn lanes will be good examples for us to set up our design guidelines, whereas in those intersections where left turn lanes have negative safety effects, careful investigation will be conducted to avoid failure in future design.
48

NETC 05-7 Warrants for Exclusive Left Turn Lanes at Unsignalized Intersections and Driveways
6 SAFETY ANALYSIS: RESULTS
6.1 Safety Performance Functions The SPF estimate for each intersection is computed for same direction crashes and crashes involving
fatality and injury respectively.
6.1.1 By Crash Category The results are listed in Appendix D (Table D.1 to D.6) and also shown in Figures 6.1 to 6.12. The
estimates from the SPF and the corresponding observed crashes in 10 years for each intersection in different categories as well as and )( NyP ≥ )( NyP ≤ are listed in the Tables (Table D.1 to D.6). The maximum, minimum and average AADT for that intersection within the 10-year period are also given.
The SPF estimated and observed crashes for each intersection are also shown in the following figures (Figure 6.1 to 6.12) by intersection category, with two figures showing intersections with and without left turn lanes, respectively, for each category. They can then be compared and some brief findings are described as below.
SPF estimate Vs observed crashes for intersections without LTL (R2T-Crash category1)
0
2
4
6
8
10
12
14
16
18
20
22
24
0 5000 10000 15000 20000 25000 30000
Average AADT
Num
ber
of c
rash
es
crash_obSPF_est
Figure 6.1: SPF Estimate and Observed Crashes for R2T Intersections without Left Turn Lanes
SPF estimate Vs observed crashes for intersections with LTL (R2T-Crash category1)
02468
1012141618202224
0 5000 10000 15000 20000 25000 30000
Average AADT
Num
ber
of c
rash
es
crash_obSPF_est
Figure 6.2: SPF Estimate and Observed Crashes for R2T Intersections with Left Turn Lanes
R2T Intersections: More crashes occur within the AADT range of 10,000 to 15,000 for both intersections with and without
left turn lanes. Due to the small sample size, there is a gap for the AADT range between 19,000 and 24,000 for intersections with left-turn lanes. Preliminary check has been made to those intersections which appear to be more dangerous than others. Most of them are on curves (e.g. R2TN18, 45; R2TY12).
49
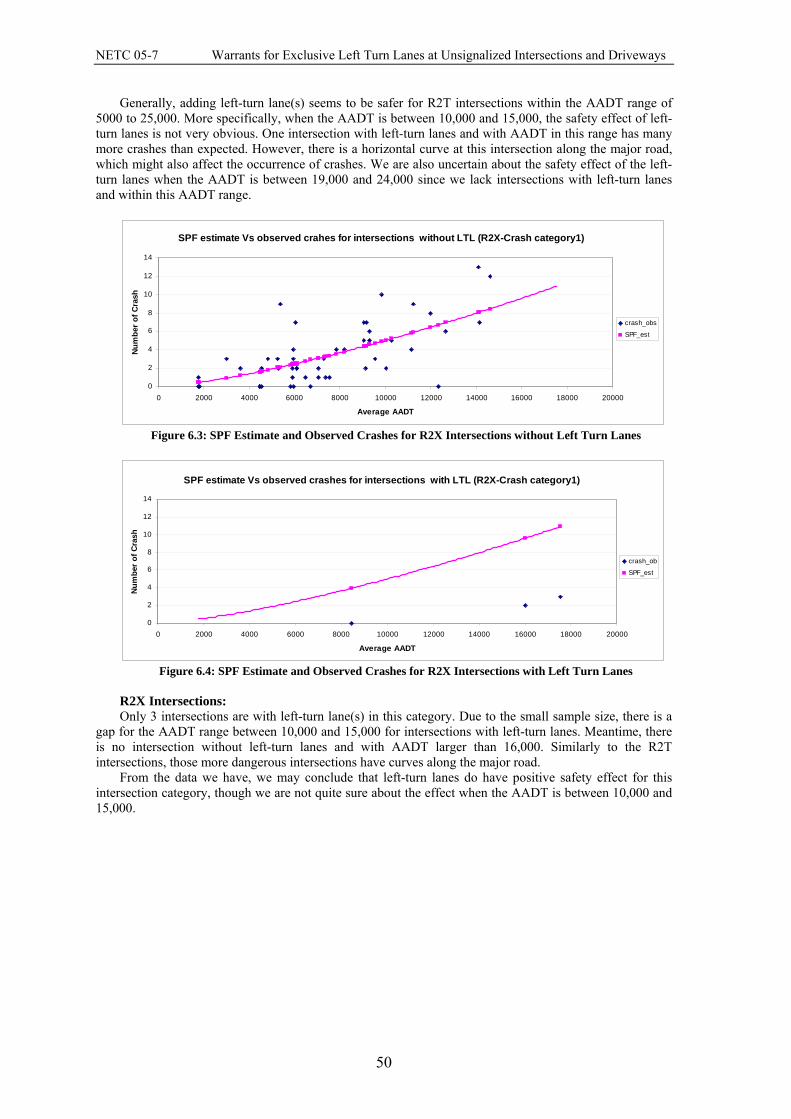
NETC 05-7 Warrants for Exclusive Left Turn Lanes at Unsignalized Intersections and Driveways
Generally, adding left-turn lane(s) seems to be safer for R2T intersections within the AADT range of 5000 to 25,000. More specifically, when the AADT is between 10,000 and 15,000, the safety effect of left-turn lanes is not very obvious. One intersection with left-turn lanes and with AADT in this range has many more crashes than expected. However, there is a horizontal curve at this intersection along the major road, which might also affect the occurrence of crashes. We are also uncertain about the safety effect of the left-turn lanes when the AADT is between 19,000 and 24,000 since we lack intersections with left-turn lanes and within this AADT range.
SPF estimate Vs observed crahes for intersections without LTL (R2X-Crash category1)
0
2
4
6
8
10
12
14
0 2000 4000 6000 8000 10000 12000 14000 16000 18000 20000
Average AADT
Num
ber o
f Cra
sh
crash_obs
SPF_est
Figure 6.3: SPF Estimate and Observed Crashes for R2X Intersections without Left Turn Lanes
SPF estimate Vs observed crashes for intersections with LTL (R2X-Crash category1)
0
2
4
6
8
10
12
14
0 2000 4000 6000 8000 10000 12000 14000 16000 18000 20000
Average AADT
Num
ber o
f Cra
sh
crash_ob
SPF_est
Figure 6.4: SPF Estimate and Observed Crashes for R2X Intersections with Left Turn Lanes
R2X Intersections: Only 3 intersections are with left-turn lane(s) in this category. Due to the small sample size, there is a
gap for the AADT range between 10,000 and 15,000 for intersections with left-turn lanes. Meantime, there is no intersection without left-turn lanes and with AADT larger than 16,000. Similarly to the R2T intersections, those more dangerous intersections have curves along the major road.
From the data we have, we may conclude that left-turn lanes do have positive safety effect for this intersection category, though we are not quite sure about the effect when the AADT is between 10,000 and 15,000.
50

NETC 05-7 Warrants for Exclusive Left Turn Lanes at Unsignalized Intersections and Driveways
SPF estimate Vs observed crashes for intersections without LTL (U2T-Crash category1)
0
10
20
30
40
50
60
0 5000 10000 15000 20000 25000 30000
Average AADT
Num
ber o
f cra
sh
crash_obsSPF_est
Figure 6.5: SPF Estimate and Observed Crashes for U2T Intersections without Left Turn Lanes
SPF estimate Vs observed crashes for intersections with LTL (U2T-Crash category1)
0
10
20
30
40
50
60
0 5000 10000 15000 20000 25000 30000
Average AADT
Num
ber
of c
rash
es
crash_obsSPF_est
Figure 6.6: SPF Estimate and Observed Crashes for U2T Intersections with Left Turn Lanes
U2T Intersections: 4 out of 21 intersections with left-turn lanes tend to be more dangerous
with . The AADT of these intersections are widely distributed from 8000 to 20,000. There are fewer crashes than expected for intersections with left-turn lanes when the AADT is around 10,000 as well as from 13,000 to 18,000.
05.0)_( <≥ obscrashyP
To further look at the 4 intersections with 05.0)_( <≥ obscrashyP in the Photolog, one intersection (U2TY02) is very close to another four-way intersection with a left-turn lane, which might be one reason that more crashes occur. Another intersection (U2TY17) has a curve along the major road as well as on the minor road, which also makes it more dangerous than other intersections. When the number of driveways increases near the target intersections, there seems to be more crashes (e.g. U2TN09, 10, 21, 29, 40; U2TY12 and 18).
Conservatively, we could not conclude that left-turn lane addition improves safety for U2T intersections. Within certain AADT ranges (1000, 13000-18000), they do have fewer crashes than expected, however, we are unsure about the above effect throughout the entire AADT range since the AADT for those more dangerous intersections is spread widely. Thus, the safety effect of left-turn lanes is inconclusive for this intersection category.
51

NETC 05-7 Warrants for Exclusive Left Turn Lanes at Unsignalized Intersections and Driveways
SPF estimate Vs observed crashes for intersections without LTL (U2X-Crash category1)
0
5
10
15
20
25
30
35
40
0 5000 10000 15000 20000 25000 30000
Average AADT
Num
ber o
f cra
sh
obs_crashSPF_est
Figure 6.7: SPF Estimate and Observed Crashes for U2X Intersections without Left Turn Lanes
SPF estimate Vs observed crashes for intersections with LTL (U2X-Crash category1)
0
5
10
15
20
25
30
35
40
0 5000 10000 15000 20000 25000 30000
Average AADT
Num
ber
of c
rash
obs_crashSPF_est
Figure 6.8: SPF Estimate and Observed Crashes for U2X Intersections with Left Turn Lanes
U2X intersections: Only 4 intersections with left-turn lanes are in this category. One intersection (U2XY04) has
and another one (U2XY01) has the number of the crashes a little bit larger than the SPF estimate. The AADT range for intersections with left-turn lanes is between 5000 and 14,000. One reason for few intersections with large AADT might be that they are mostly signalized, and signalized intersections were excluded from this study. When the AADT is around 13,000 and 14,000, there seems to be fewer crashes than the SPF estimate. Driveways near the target intersections influence one another and there seems to be more crashes in that case. (e.g. U2XN04, 09, 11, 12, 13, 14; U2XY04)
05.0)_( <≥ obscrashyP
Taking into account that there are only 4 intersections with left-turn lanes in this category and 2 of them are not significantly safer, we can not come to the conclusion that adding left-turn lanes has positive safety effect for this intersection category.
52
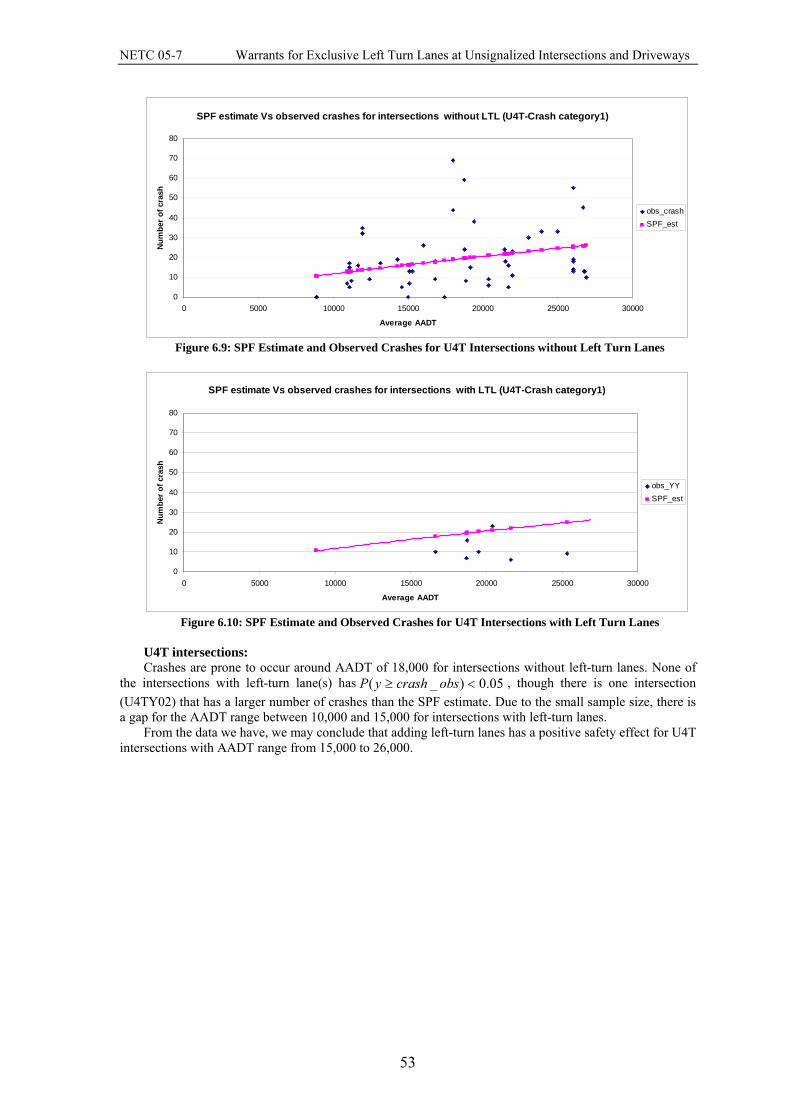
NETC 05-7 Warrants for Exclusive Left Turn Lanes at Unsignalized Intersections and Driveways
SPF estimate Vs observed crashes for intersections without LTL (U4T-Crash category1)
0
10
20
30
40
50
60
70
80
0 5000 10000 15000 20000 25000 30000
Average AADT
Num
ber
of c
rash
obs_crashSPF_est
Figure 6.9: SPF Estimate and Observed Crashes for U4T Intersections without Left Turn Lanes
SPF estimate Vs observed crashes for intersections with LTL (U4T-Crash category1)
0
10
20
30
40
50
60
70
80
0 5000 10000 15000 20000 25000 30000
Average AADT
Num
ber o
f cra
sh
obs_YYSPF_est
Figure 6.10: SPF Estimate and Observed Crashes for U4T Intersections with Left Turn Lanes
U4T intersections: Crashes are prone to occur around AADT of 18,000 for intersections without left-turn lanes. None of
the intersections with left-turn lane(s) has 05.0)_( <≥ obscrashyP , though there is one intersection (U4TY02) that has a larger number of crashes than the SPF estimate. Due to the small sample size, there is a gap for the AADT range between 10,000 and 15,000 for intersections with left-turn lanes.
From the data we have, we may conclude that adding left-turn lanes has a positive safety effect for U4T intersections with AADT range from 15,000 to 26,000.
53
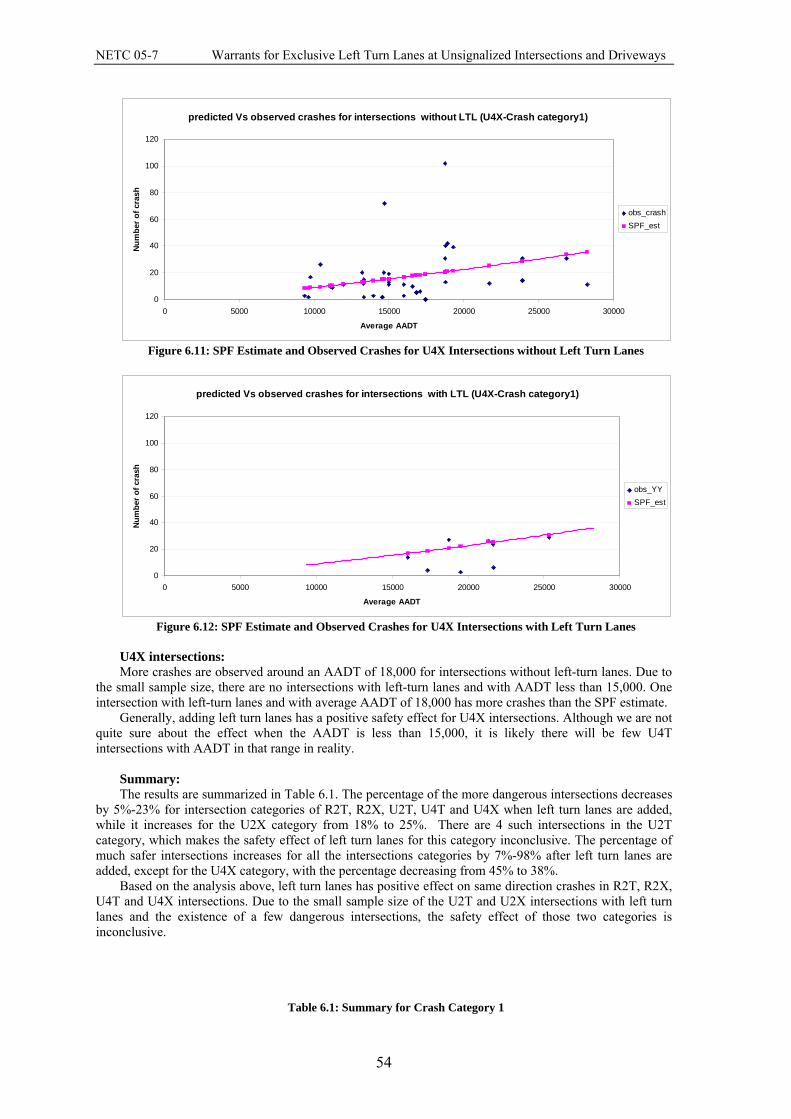
NETC 05-7 Warrants for Exclusive Left Turn Lanes at Unsignalized Intersections and Driveways
predicted Vs observed crashes for intersections without LTL (U4X-Crash category1)
0
20
40
60
80
100
120
0 5000 10000 15000 20000 25000 30000
Average AADT
Num
ber o
f cra
sh
obs_crashSPF_est
Figure 6.11: SPF Estimate and Observed Crashes for U4X Intersections without Left Turn Lanes
predicted Vs observed crashes for intersections with LTL (U4X-Crash category1)
0
20
40
60
80
100
120
0 5000 10000 15000 20000 25000 30000
Average AADT
Num
ber
of c
rash
obs_YYSPF_est
Figure 6.12: SPF Estimate and Observed Crashes for U4X Intersections with Left Turn Lanes
U4X intersections: More crashes are observed around an AADT of 18,000 for intersections without left-turn lanes. Due to
the small sample size, there are no intersections with left-turn lanes and with AADT less than 15,000. One intersection with left-turn lanes and with average AADT of 18,000 has more crashes than the SPF estimate.
Generally, adding left turn lanes has a positive safety effect for U4X intersections. Although we are not quite sure about the effect when the AADT is less than 15,000, it is likely there will be few U4T intersections with AADT in that range in reality.
Summary: The results are summarized in Table 6.1. The percentage of the more dangerous intersections decreases
by 5%-23% for intersection categories of R2T, R2X, U2T, U4T and U4X when left turn lanes are added, while it increases for the U2X category from 18% to 25%. There are 4 such intersections in the U2T category, which makes the safety effect of left turn lanes for this category inconclusive. The percentage of much safer intersections increases for all the intersections categories by 7%-98% after left turn lanes are added, except for the U4X category, with the percentage decreasing from 45% to 38%.
Based on the analysis above, left turn lanes has positive effect on same direction crashes in R2T, R2X, U4T and U4X intersections. Due to the small sample size of the U2T and U2X intersections with left turn lanes and the existence of a few dangerous intersections, the safety effect of those two categories is inconclusive.
Table 6.1: Summary for Crash Category 1
54
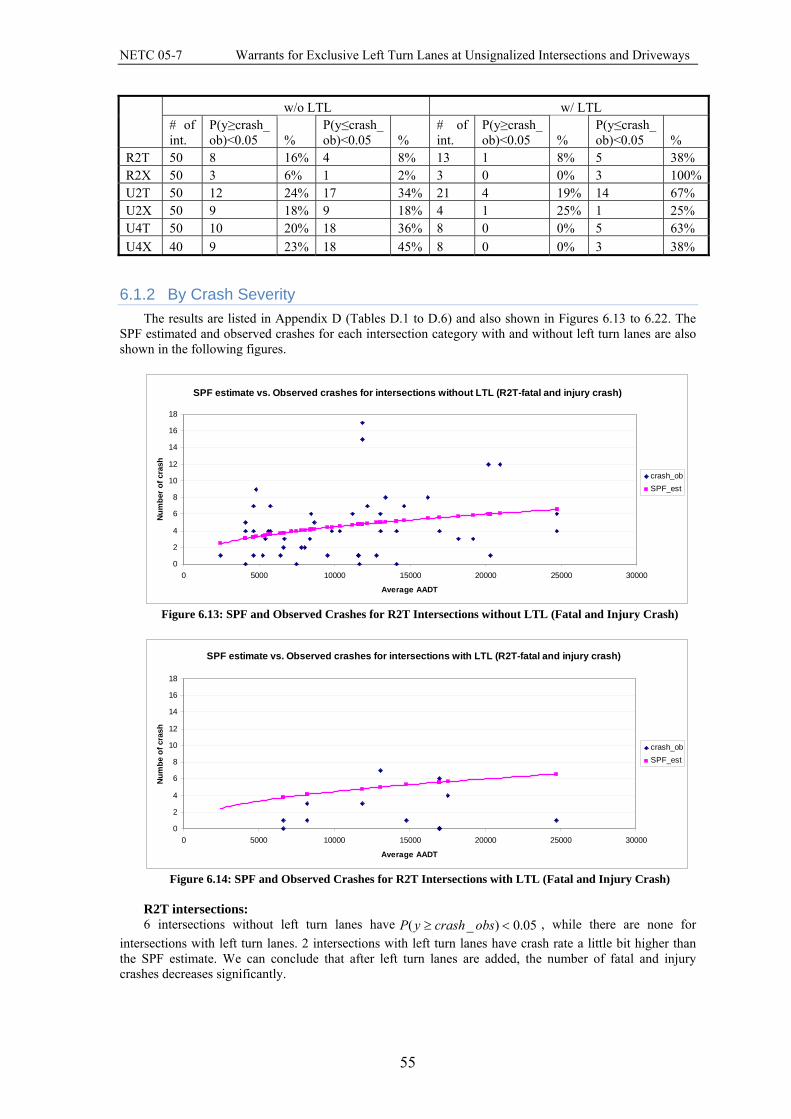
NETC 05-7 Warrants for Exclusive Left Turn Lanes at Unsignalized Intersections and Driveways
w/o LTL w/ LTL # of int.
P(y≥crash_ ob)<0.05 %
P(y≤crash_ ob)<0.05 %
# of int.
P(y≥crash_ ob)<0.05 %
P(y≤crash_ ob)<0.05 %
R2T 50 8 16% 4 8% 13 1 8% 5 38% R2X 50 3 6% 1 2% 3 0 0% 3 100%U2T 50 12 24% 17 34% 21 4 19% 14 67% U2X 50 9 18% 9 18% 4 1 25% 1 25% U4T 50 10 20% 18 36% 8 0 0% 5 63% U4X 40 9 23% 18 45% 8 0 0% 3 38%
6.1.2 By Crash Severity The results are listed in Appendix D (Tables D.1 to D.6) and also shown in Figures 6.13 to 6.22. The
SPF estimated and observed crashes for each intersection category with and without left turn lanes are also shown in the following figures.
SPF estimate vs. Observed crashes for intersections without LTL (R2T-fatal and injury crash)
0
2
4
6
8
10
12
14
16
18
0 5000 10000 15000 20000 25000 30000
Average AADT
Num
ber o
f cra
sh
crash_obSPF_est
Figure 6.13: SPF and Observed Crashes for R2T Intersections without LTL (Fatal and Injury Crash)
SPF estimate vs. Observed crashes for intersections with LTL (R2T-fatal and injury crash)
0
2
4
6
8
10
12
14
16
18
0 5000 10000 15000 20000 25000 30000
Average AADT
Num
be o
f cra
sh
crash_obSPF_est
Figure 6.14: SPF and Observed Crashes for R2T Intersections with LTL (Fatal and Injury Crash)
R2T intersections: 6 intersections without left turn lanes have 05.0)_( <≥ obscrashyP , while there are none for
intersections with left turn lanes. 2 intersections with left turn lanes have crash rate a little bit higher than the SPF estimate. We can conclude that after left turn lanes are added, the number of fatal and injury crashes decreases significantly.
55

NETC 05-7 Warrants for Exclusive Left Turn Lanes at Unsignalized Intersections and Driveways
SPF estimate vs. Observed crashes for intersections without LTL (R2X-fatal and injury crash)
0
5
10
15
20
25
30
0 2000 4000 6000 8000 10000 12000 14000 16000 18000 20000
Average AADT
Num
ber o
f cra
sh
crash_obSPF_est
Figure 6.15: SPF and Observed Crashes for R2X Intersections without LTL (Fatal and Injury Crash)
SPF estimate vs. Observed crashes for intersections with LTL (R2X-fatal and injury crash)
0
5
10
15
20
25
30
0 2000 4000 6000 8000 10000 12000 14000 16000 18000 20000
Average AADT
Num
ber
of c
rash
crash_obSPF_est
Figure 6.16: SPF and Observed Crashes for R2X Intersections with LTL (Fatal and Injury Crash)
R2X intersections: There is a gap for the AADT range for the intersections with left turn lanes due to the small sample
size. The crash rates for all of 3 intersections with left turn lanes are below the SPF estimates, whereas 5 intersections without left turn lanes have 05.0)_( <≥ obscrashyP . We may conclude that adding a left turn lane at least doesn’t have a negative effect for R2X intersections.
SPF estimate vs. Observed crashes for intersections without LTL (U2X-fatal and injury crash)
0
2
4
6
8
10
12
14
16
18
20
0 5000 10000 15000 20000 25000
Average AADT
Num
ber
of c
rash
crash_obSPF_est
Figure 6.17: SPF and Observed Crashes for U2X Intersections without LTL (Fatal and Injury Crash)
56
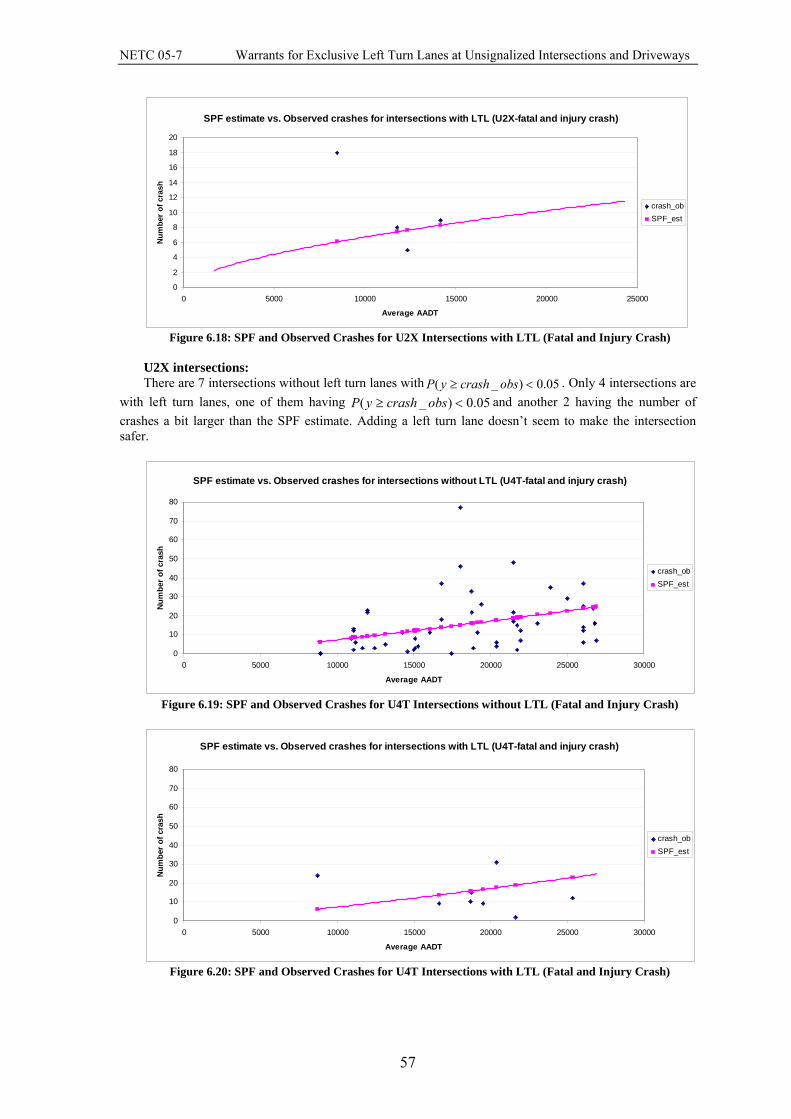
NETC 05-7 Warrants for Exclusive Left Turn Lanes at Unsignalized Intersections and Driveways
SPF estimate vs. Observed crashes for intersections with LTL (U2X-fatal and injury crash)
0
2
4
6
8
10
12
14
16
18
20
0 5000 10000 15000 20000 25000
Average AADT
Num
ber
of c
rash
crash_obSPF_est
Figure 6.18: SPF and Observed Crashes for U2X Intersections with LTL (Fatal and Injury Crash)
U2X intersections: There are 7 intersections without left turn lanes with 05.0)_( <≥ obscrashyP
05.0)_. Only 4 intersections are
with left turn lanes, one of them having ( <≥ crashyP obs and another 2 having the number of crashes a bit larger than the SPF estimate. Adding a left turn lane doesn’t seem to make the intersection safer.
SPF estimate vs. Observed crashes for intersections without LTL (U4T-fatal and injury crash)
0
10
20
30
40
50
60
70
80
0 5000 10000 15000 20000 25000 30000
Average AADT
Num
ber
of c
rash
crash_obSPF_est
Figure 6.19: SPF and Observed Crashes for U4T Intersections without LTL (Fatal and Injury Crash)
SPF estimate vs. Observed crashes for intersections with LTL (U4T-fatal and injury crash)
0
10
20
30
40
50
60
70
80
0 5000 10000 15000 20000 25000 30000
Average AADT
Num
ber
of c
rash
crash_obSPF_est
Figure 6.20: SPF and Observed Crashes for U4T Intersections with LTL (Fatal and Injury Crash)
57
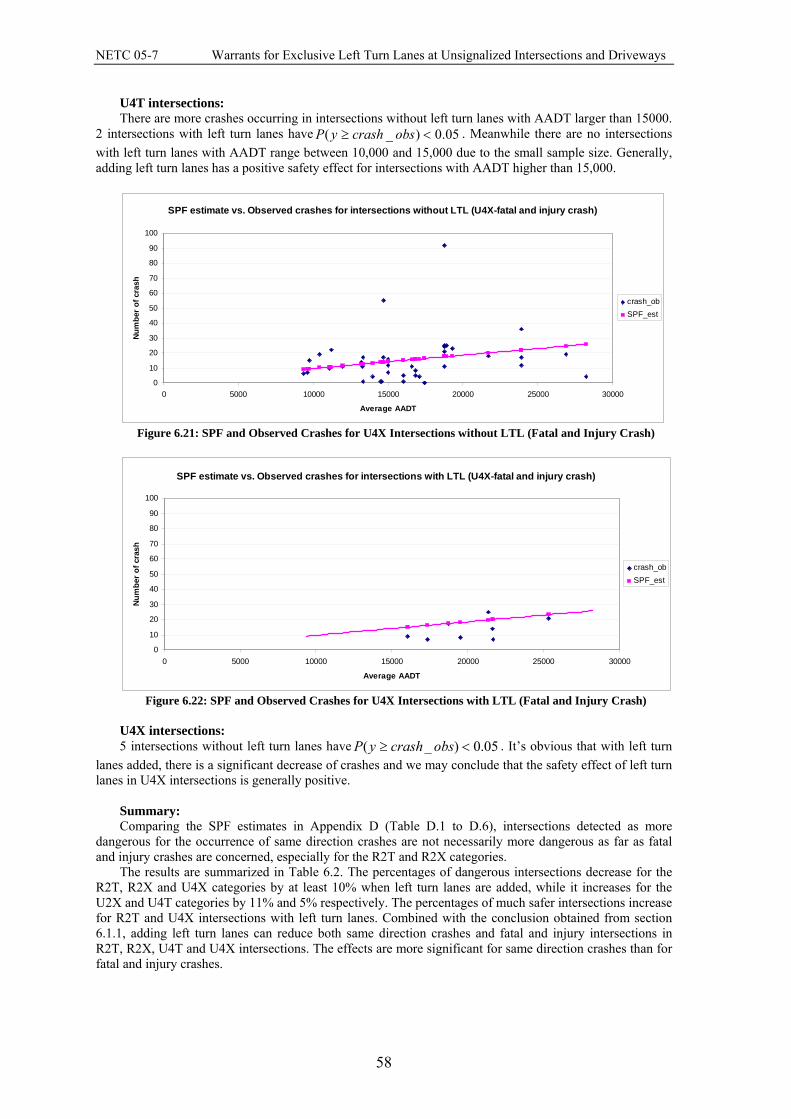
NETC 05-7 Warrants for Exclusive Left Turn Lanes at Unsignalized Intersections and Driveways
U4T intersections: There are more crashes occurring in intersections without left turn lanes with AADT larger than 15000.
2 intersections with left turn lanes have 05.0)_( <≥ obscrashyP . Meanwhile there are no intersections with left turn lanes with AADT range between 10,000 and 15,000 due to the small sample size. Generally, adding left turn lanes has a positive safety effect for intersections with AADT higher than 15,000.
SPF estimate vs. Observed crashes for intersections without LTL (U4X-fatal and injury crash)
0
10
20
30
40
50
60
70
80
90
100
0 5000 10000 15000 20000 25000 30000
Average AADT
Num
ber
of c
rash
crash_obSPF_est
Figure 6.21: SPF and Observed Crashes for U4X Intersections without LTL (Fatal and Injury Crash)
SPF estimate vs. Observed crashes for intersections with LTL (U4X-fatal and injury crash)
0
10
20
30
40
50
60
70
80
90
100
0 5000 10000 15000 20000 25000 30000
Average AADT
Num
ber
of c
rash
crash_obSPF_est
Figure 6.22: SPF and Observed Crashes for U4X Intersections with LTL (Fatal and Injury Crash)
U4X intersections: 5 intersections without left turn lanes have 05.0)_( <≥ obscrashyP . It’s obvious that with left turn
lanes added, there is a significant decrease of crashes and we may conclude that the safety effect of left turn lanes in U4X intersections is generally positive.
Summary: Comparing the SPF estimates in Appendix D (Table D.1 to D.6), intersections detected as more
dangerous for the occurrence of same direction crashes are not necessarily more dangerous as far as fatal and injury crashes are concerned, especially for the R2T and R2X categories.
The results are summarized in Table 6.2. The percentages of dangerous intersections decrease for the R2T, R2X and U4X categories by at least 10% when left turn lanes are added, while it increases for the U2X and U4T categories by 11% and 5% respectively. The percentages of much safer intersections increase for R2T and U4X intersections with left turn lanes. Combined with the conclusion obtained from section 6.1.1, adding left turn lanes can reduce both same direction crashes and fatal and injury intersections in R2T, R2X, U4T and U4X intersections. The effects are more significant for same direction crashes than for fatal and injury crashes.
58

NETC 05-7 Warrants for Exclusive Left Turn Lanes at Unsignalized Intersections and Driveways
Table 6.2: Summary for fatal and injury crashes
w/o LTL w/ LTL
# of int.
P(y≥crash_ ob)<0.05 %
P(y≤crash_ ob)<0.05 %
# of int.
P(y≥crash_ ob)<0.05 %
P(y≤crash_ ob)<0.05 %
R2T 50 6 12% 7
14% 13 0 0% 7
54%
R2X 50 5 10% 1 2% 3 0 0% 0 0%
U2X 50 7 14% 8
16% 4 1
25% 0 0%
U4T 50 10 20% 21
42% 8 2
25% 3
38%
U4X 40 5 13% 14
35% 8 0 0% 3
38%
6.2 Assessment of Physical Characteristics Intersections with left turn lanes yet have 05.0)_( <≥ obscrashyP for either same direction crashes or
fatal and injury crashes were further examined for their physical characteristics. The photolog images of these intersections, showing the geometric features as well as the surrounding environment, were displayed in Appendix E (Figures E.1 to E.9). We are aiming to find out whether it is the left turn lane installation, or the inherent geometric features of the intersection, or the combination of the two that causes the intersections to be more dangerous than others.
Six intersections have 05.0)_( <≥ obscrashyP for same direction crashes. R2TY12, the only intersection detected to be more dangerous in the rural area, is on a curve with limited sight distance. U2TY02, just close to anther 4-leg intersections with a left turn lane, has a very short taper length as well as the storage length for the left turn lane, which may cause problem when the left turn vehicles do not have enough deceleration distance. U2TY12 is also close to another intersection with a left turn lane. A relatively high percentage of left turn vehicles and vehicles frequently coming from the minor approach make this intersection more complex. U2TY17 is on a curve, with no taper yet very short length of the left turn lane. Besides, vehicles on the minor approach have limited sight distance for the vehicles heading north on major road. U2TY18 is close to a number of driveways within the study area of the intersections. Vehicles to and from the driveways interfere with the traffic on the major roads, increasing the probability of crash occurrence. Similar for U2XY04, along the major road within the study area of the intersection exist a number of driveways with considerable traffic volume. As explained previously, it is possible that the driveways rather than the left turn lanes make this area more crash-prone.
Three intersections have 05.0)_( <≥ obscrashyP for fatal and injury crashes. U2XY02 provides very short length of taper and storage for the left turn lane. U4TY02 is on a curve and also is very close to other intersections, resulting in more vehicle interactions on the study area. U4TY08 is an unusual site in this study for it has two way left turn lanes installed close to the study intersection. It is likely this special feature also has effects on the crash rate at the study area of this intersection.
Based on the above examination, of these more dangerous intersections, some have curves at the intersections causing insufficient sight distance, some are close to driveways with considerable traffic, especially in urban areas, and some have inappropriate design of the left turn lanes, such as insufficient length of the taper and storage lane, which often appears when two intersections are close to each other leaving short distance for the left turn lane.
In the former two cases, the analysis of the effect of left turn lanes on crashes becomes more complex since these features and factors may also contribute to the high crash rate. The effects are mixed and hard to separate, which leave these cases to be inconclusive as far as the safety effect of left turn lanes are concerned.
However, the above examination also suggests that if the left turn lanes were designed inappropriately, which is the third case, they definitely have negative impact on the safety of the intersection.
Due to the small number of intersections detected, nine in total, and lack of other geometric data in detail, we are unable to conduct a systematic analysis of these physical characteristics on safety of an intersection. However, the review on each intersection individually also provides some insight to complement our previous study.
59
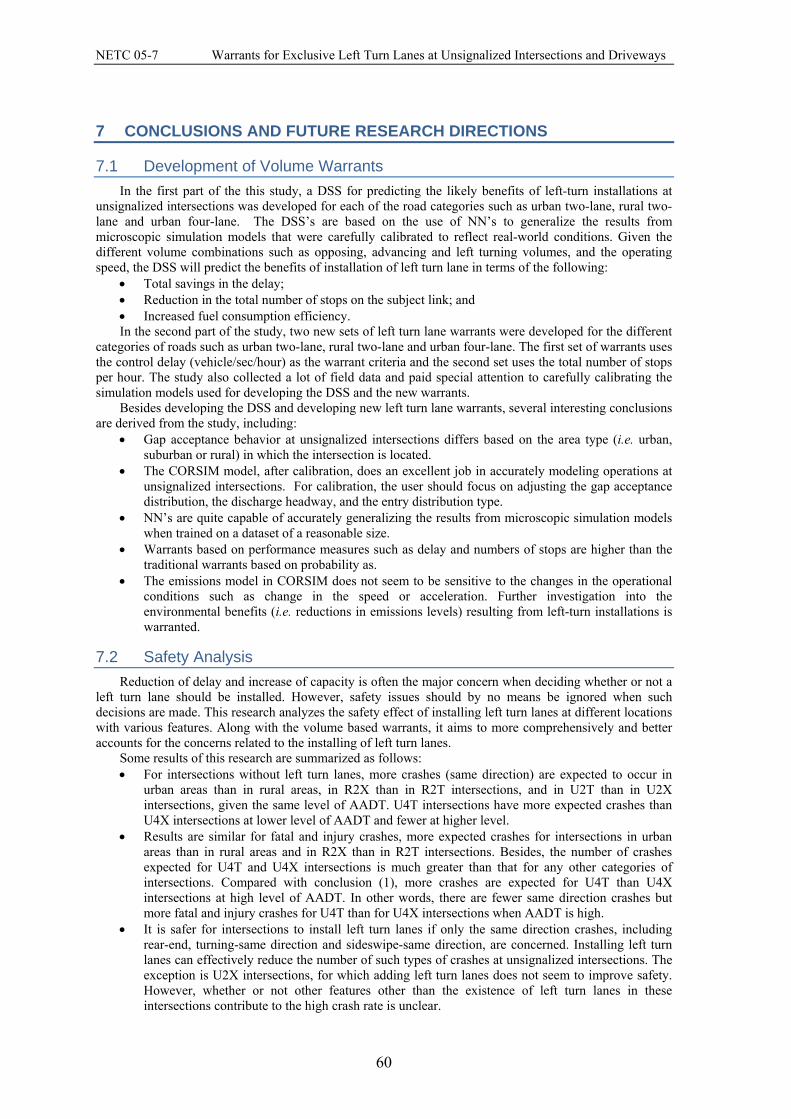
NETC 05-7 Warrants for Exclusive Left Turn Lanes at Unsignalized Intersections and Driveways
7 CONCLUSIONS AND FUTURE RESEARCH DIRECTIONS
7.1 Development of Volume Warrants In the first part of the this study, a DSS for predicting the likely benefits of left-turn installations at
unsignalized intersections was developed for each of the road categories such as urban two-lane, rural two-lane and urban four-lane. The DSS’s are based on the use of NN’s to generalize the results from microscopic simulation models that were carefully calibrated to reflect real-world conditions. Given the different volume combinations such as opposing, advancing and left turning volumes, and the operating speed, the DSS will predict the benefits of installation of left turn lane in terms of the following:
• Total savings in the delay; • Reduction in the total number of stops on the subject link; and • Increased fuel consumption efficiency. In the second part of the study, two new sets of left turn lane warrants were developed for the different
categories of roads such as urban two-lane, rural two-lane and urban four-lane. The first set of warrants uses the control delay (vehicle/sec/hour) as the warrant criteria and the second set uses the total number of stops per hour. The study also collected a lot of field data and paid special attention to carefully calibrating the simulation models used for developing the DSS and the new warrants.
Besides developing the DSS and developing new left turn lane warrants, several interesting conclusions are derived from the study, including:
• Gap acceptance behavior at unsignalized intersections differs based on the area type (i.e. urban, suburban or rural) in which the intersection is located.
• The CORSIM model, after calibration, does an excellent job in accurately modeling operations at unsignalized intersections. For calibration, the user should focus on adjusting the gap acceptance distribution, the discharge headway, and the entry distribution type.
• NN’s are quite capable of accurately generalizing the results from microscopic simulation models when trained on a dataset of a reasonable size.
• Warrants based on performance measures such as delay and numbers of stops are higher than the traditional warrants based on probability as.
• The emissions model in CORSIM does not seem to be sensitive to the changes in the operational conditions such as change in the speed or acceleration. Further investigation into the environmental benefits (i.e. reductions in emissions levels) resulting from left-turn installations is warranted.
7.2 Safety Analysis Reduction of delay and increase of capacity is often the major concern when deciding whether or not a
left turn lane should be installed. However, safety issues should by no means be ignored when such decisions are made. This research analyzes the safety effect of installing left turn lanes at different locations with various features. Along with the volume based warrants, it aims to more comprehensively and better accounts for the concerns related to the installing of left turn lanes.
Some results of this research are summarized as follows: • For intersections without left turn lanes, more crashes (same direction) are expected to occur in
urban areas than in rural areas, in R2X than in R2T intersections, and in U2T than in U2X intersections, given the same level of AADT. U4T intersections have more expected crashes than U4X intersections at lower level of AADT and fewer at higher level.
• Results are similar for fatal and injury crashes, more expected crashes for intersections in urban areas than in rural areas and in R2X than in R2T intersections. Besides, the number of crashes expected for U4T and U4X intersections is much greater than that for any other categories of intersections. Compared with conclusion (1), more crashes are expected for U4T than U4X intersections at high level of AADT. In other words, there are fewer same direction crashes but more fatal and injury crashes for U4T than for U4X intersections when AADT is high.
• It is safer for intersections to install left turn lanes if only the same direction crashes, including rear-end, turning-same direction and sideswipe-same direction, are concerned. Installing left turn lanes can effectively reduce the number of such types of crashes at unsignalized intersections. The exception is U2X intersections, for which adding left turn lanes does not seem to improve safety. However, whether or not other features other than the existence of left turn lanes in these intersections contribute to the high crash rate is unclear.
60

NETC 05-7 Warrants for Exclusive Left Turn Lanes at Unsignalized Intersections and Driveways
61
• Installing left turn lanes dramatically reduces fatal and injury crashes at intersections in rural areas. However, reduction of such crashes in urban areas is less significant except for U4X intersections, for which a positive effect of left turn lanes is very strong.
• Improper design of left turn lanes results in more dangerous intersections. In such cases, crashes are expected to be reduced when the design is improved. At intersections with such features as located on curves, close to a number of driveways, etc., the effect of left turn lanes cannot be easily separated from the impact of these features. Further study is required.
As far as future research is concerned, the following is suggested: • Before and after study can be conducted when data is available, by which all of the other features
other than the existence of left turn lanes can be controlled the same for each intersection in the before and after period. Thus the effect of left turn lanes can be separated from that of the other features, which may change from one another when comparison sites are used.
• When data permits, more variables, such as traffic volume of the intersecting minor roads, percentage of left turn traffic, average speed of vehicles traveling, number of driveways near the intersection, may be included in the model. This is particularly necessary for analyzing the crash categories 2 and 3 (intersecting direction and segment related crashes) as well as fatal and injury crashes.
• If more intersections with left turn lanes can be found and thus more may be detected to be dangerous, research can be then conducted on these dangerous intersections to decide which factors, left turn lane related as well as others, cause the intersection to be more prone to crash occurrence. Also, comparison can be made between these dangerous intersections and the safe intersections identified by the SPF functions.
• All of the geometric characteristics of the intersections, along with the precise application of traffic control devices used, including pavement markings and signage, as well as lane and pavement width can be carefully examined to provide guidelines for how to physically design and control exclusive left turn lanes to maximize safety for all road users.

NETC 05-7 Warrants for Exclusive Left Turn Lanes at Unsignalized Intersections and Driveways
REFERENCES AASHTO, 1984. A policy on geometric design of highway and streets, AASHTO, Washington, D.C.
AASHTO, 2001. A Policy on Geometric Design of Highways and Streets, Fourth Edition. American Association of State Highway and Transportation Officials, Washington, D.C. Agent, K., 1983. Warrants for left-turn lanes. Transportation Quarterly, 37(1):99-114. Ballard, J., McCoy, P., 1983. Operational effects of two-way left-turn lanes on two-way, four-lane streets. Transportation Research Record, 923:54-57. Basha, P., 1992. Left-turn queues at unsignalized intersections. ITE Journal, 62(6):45-47. Bonneson, J., McCoy, P., 1997. Effect of median treatment on urban arterial safety. Transportation Research Record, 1581:27-36. Chakroborty, P., Kikuchi, S., Luszcz, M., 1995. Lengths of left-turn lanes at unsignalized intersections. Transportation Research Record, 1500:193-201. ConnDOT, 2003. Highway Design Manual, 2003 Edition. Connecticut Department of Transportation, Newington, Connecticut. ConnDOT, 2006. Collision Analysis System Auxiliary Input File Documentation. Connecticut Department of Transportation, Newington, Connecticut. David J., DeBaie P.E., P.T.O.E, 2004. Turn Lane Warrants: Concepts, Standards, Application in Review, ITE District 1 Annual Meeting Burlington, Vermont. Enhancements and Changes in TSIS-CORIM. On-line documentation from McTrans website, University of Florida. (http://mctrans.ce.ufl.edu/featured/tsis/). FHWA, 2003. Manual on Uniform Traffic Control Devices for Streets and Highways, Washington D.C. Fitzpatrick, K., Balke, K., 1995. Evaluation of flush medians and two-way, left-turn lanes on four-lane rural highways. Transportation Research Record, 1500:146-152. Fitzpatrick, K., Brewer and Parham, 2003. Left turn lane and In-lane rubble strip treatments for rural intersections, Texas Transportation Institute Fitzpatrick, K., Wolff, T., 2003. T Left-Turn Lane Installation Guidelines. 2nd Urban Street Symposium: Uptown, Downtown, or Small Town: Designing Urban Streets That Work. Harmelink, M., 1967. Volume warrants for left-turn storage lanes at unsignalized grade intersections. Highway Research Record, 211:1-18. Hourdakis, J., Michalopoulos, P. G., Kottommannil, J., 2003. A practical procedure for calibrating traffic simulation model, Transportation Research Board, Washington, D.C. ITT Systems & Sciences Corporation, 1998. CORSIM User’s Manual. Colorado Springs, Colorado. Kikuchi, S., Chakroborty, P., 1991. Analysis of left-turn-lane warrants at unsignalized t-intersections on two-lane roadways. Transportation Research Record, 1327:80-88. Koepke, F., 1992. Access Management Guidelines for Activity Centers, NCHRP Report 348, Transportation Research Board, Washington, D.C.
62

NETC 05-7 Warrants for Exclusive Left Turn Lanes at Unsignalized Intersections and Driveways
63
Lakkundi, V.R., Park, B., Garber, N.J., Fontaine, M.D., 2004. Development of Left-turn Guidelines for Signalized and Unsignalized Intersections. Virginia Transportation Research Council, Report 04-R11, Charlottesville, Virginia. Margiota, R., Chatterjee, A., 1995. Accidents on suburban highways – Tennessee’s experience. Journal of Transportation Engineering, 121(3):255-261. McCoy, P., Ballard, J., Wijaya, Y., 1982. Operational effects of two-way left-turn lanes on two-way two-lane streets. Transportation Research Record, 869:49-54. McCoy, P., Malone, M., 1989. Safety effects of left-turn lanes on urban four-lane roadways. Transportation Research Record, 1239:17-22. Mehanti B. P., 2004. Aggregate Calibration of Microscopic Traffic Simulation Models Massachusetts Institute of Technology. Nesamani, K. S., Chu, L., McNally, M, G., Jayakrishnan, R., 2006. Estimation of Vehicular Emissions by Capturing Traffic Variations, Institute of Transportation Studies and Department of Civil and Environmental Engineering, University of California, 06-1629. Neumann, T.R., 1985. NCHRP Report 279: Intersection Channelization Design Guide, Transportation Research Board, National Research Council, D.C. Oppenlander, J. C., Bianchi, J. C. 1990. Guidelines for Left-Turn Lanes. ITE Compendium of Technical Papers, 60th Annual Meeting, Orlando, Florida. Pline, J.L., 1996. NCHRP Synthesis of Highway Practice 225, Left-Turn Treatments at Intersections, Transportation Research Board, National Research Council, Washington, D.C. Principe, J.C., Euliano, N.W., Lefebvre, W.C., 2000. Neural and Adaptive Systems: Fundamentals through Simulations. John Wiley and Sons, Inc. Quadstone, Ltd., 2004. Quadstone Paramics v5.0 Modeller User Guide. Scotland, UK. Rimiller, J., Ivan, J., Garrick, N., 2003. Estimating Benefits from Specific Highway Safety Improvements: Phase III: Safety Benefits From Left Turn Treatment, Connecticut Cooperative Highway Research Program, Project 97-1(3), Final Report, Report JHR 03-290, University of Connecticut, Storrs, CT. SAS Institute Inc., 2004. SAS/STAT 9.1 User’s Guide. Simpson, S., Matthias, J. 2000. Validation of left-turn delay at two-way stop-controlled intersections. Transportation Research Record, 1710:181-188. Skabardonis, A., 1999. Assessment of Traffic Simulation Models. University of California, Berkeley. Squires, C., Parsonson, P., 1989. Accident comparison of raised median and two-way left-turn lane median treatment. Transportation Research Record, 1239:30-40. TRB, 2000. Highway Capacity Manual. Transportation Research Board, National Research Council, Washington, D.C. TSIS On-line Help Documentation (www.fhwa-tsis.com), accessed June 2006. Venigalla, M., Margiotta, R., Chatterjee, A., Rathi, A., Clarke, D., 1992. Operational effects of nontraversable medians and two-way left-turn lanes. Transportation Research Record 1356: 37-46. Zhang, C., Ivan, J. N., Jonsson, T., 2007. Collision Type Categorization Based on Crash Causality and Severity Analysis. Transportation Research Board 86th Annual Meeting.

NETC 05-7 Warrants for Exclusive Left Turn Lanes at Unsignalized Intersections and Driveways
Appendix A: Left Turn Lane Warrants FIGURE A.1: RURAL TWO-LANE, OPERATING SPEED = 30, WARRANTS BASED ON TOTAL DELAY
(SEC.VEH/HOUR) ON THE SUBJECT LINK .................................................................................................. 65 FIGURE A.2: RURAL TWO-LANE, OPERATING SPEED = 50, WARRANTS BASED ON TOTAL DELAY
(SEC.VEH/HOUR) ON THE SUBJECT LINK .................................................................................................. 65 FIGURE A.3: RURAL TWO-LANE, OPERATING SPEED = 30, WARRANTS BASED ON TOTAL NUMBER OF STOPS
(NUMBER) ON THE SUBJECT LINK ............................................................................................................ 66 FIGURE A.4: RURAL TWO-LANE, OPERATING SPEED = 50, WARRANTS BASED ON TOTAL NUMBER OF STOPS
(NUMBER) ON THE SUBJECT LINK ............................................................................................................ 66 FIGURE A.5: URBAN FOUR-LANE, OPERATING SPEED = 30, WARRANTS BASED ON TOTAL DELAY
(VEH.SEC/HOUR) ON THE SUBJECT LINK .................................................................................................. 67 FIGURE A.6: URBAN FOUR-LANE, OPERATING SPEED = 40, WARRANTS BASED ON TOTAL DELAY
(VEH.SEC/HOUR) ON THE SUBJECT LINK .................................................................................................. 67 FIGURE A.7: URBAN FOUR-LANE, OPERATING SPEED = 30, WARRANTS BASED ON TOTAL NUMBER OF STOPS
(NUMBER) ON THE SUBJECT LINK ............................................................................................................ 68 FIGURE A.8: URBAN FOUR-LANE, OPERATING SPEED = 40, WARRANTS BASED ON TOTAL NUMBER OF STOPS
(NUMBER) ON THE SUBJECT LINK ............................................................................................................ 68
64

NETC 05-7 Warrants for Exclusive Left Turn Lanes at Unsignalized Intersections and Driveways
Warrants, Speed = 30 mph
0
100
200
300
400
500
600
700
800
0 100 200 300 400 500 600 700 800Opposing Volume (veh/hour)
Adv
anci
ng V
olum
e (v
eh/h
our)
.
10%20%30%
Figure A.1: Rural two-lane, Operating speed = 30, Warrants based on Total Delay (sec.veh/hour) on the
subject link
Warrants, Speed = 50 mph
0
100
200
300
400
500
600
700
800
0 100 200 300 400 500 600 700 800
Advancing Volume (veh/hour)
Adv
anci
ng v
olum
e (v
eh/h
our)
.
10%20%30%
Figure A.2: Rural two-lane, Operating speed = 50, Warrants based on Total Delay (sec.veh/hour) on the
subject link
65

NETC 05-7 Warrants for Exclusive Left Turn Lanes at Unsignalized Intersections and Driveways
Warrants, Speed = 30 mph
0
100
200
300
400
500
600
700
800
0 100 200 300 400 500 600 700 800
Opposing Volume (veh/hour)
Adv
anci
ng V
olum
e (v
eh/h
our)
.
10%20%30%
Figure A.3: Rural two-lane, Operating speed = 30, Warrants based on Total number of stops (number) on
the subject link
Warrants, Speed =50 mph
0
100
200
300
400
500
600
700
800
0 100 200 300 400 500 600 700 800Opposing Volume (veh/hour)
Adv
anci
ng V
olum
e (v
eh/h
our)
.
10%20%30%
Figure A.4: Rural two-lane, Operating speed = 50, Warrants based on Total number of stops (number) on
the subject link
66
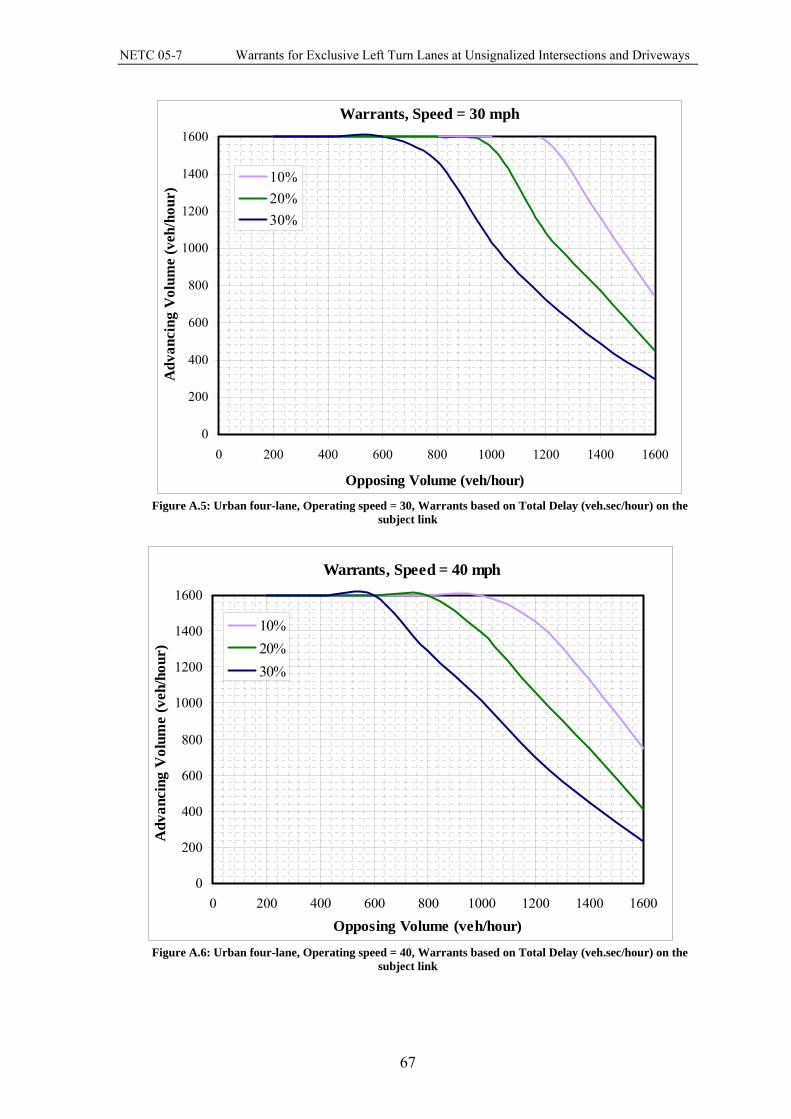
NETC 05-7 Warrants for Exclusive Left Turn Lanes at Unsignalized Intersections and Driveways
Warrants, Speed = 30 mph
0
200
400
600
800
1000
1200
1400
1600
0 200 400 600 800 1000 1200 1400 1600
Opposing Volume (veh/hour)
Adv
anci
ng V
olum
e (v
eh/h
our)
10%20%30%
Figure A.5: Urban four-lane, Operating speed = 30, Warrants based on Total Delay (veh.sec/hour) on the
subject link
Warrants, Speed = 40 mph
0
200
400
600
800
1000
1200
1400
1600
0 200 400 600 800 1000 1200 1400 1600
Opposing Volume (veh/hour)
Adv
anci
ng V
olum
e (v
eh/h
our)
10%20%30%
Figure A.6: Urban four-lane, Operating speed = 40, Warrants based on Total Delay (veh.sec/hour) on the
subject link
67
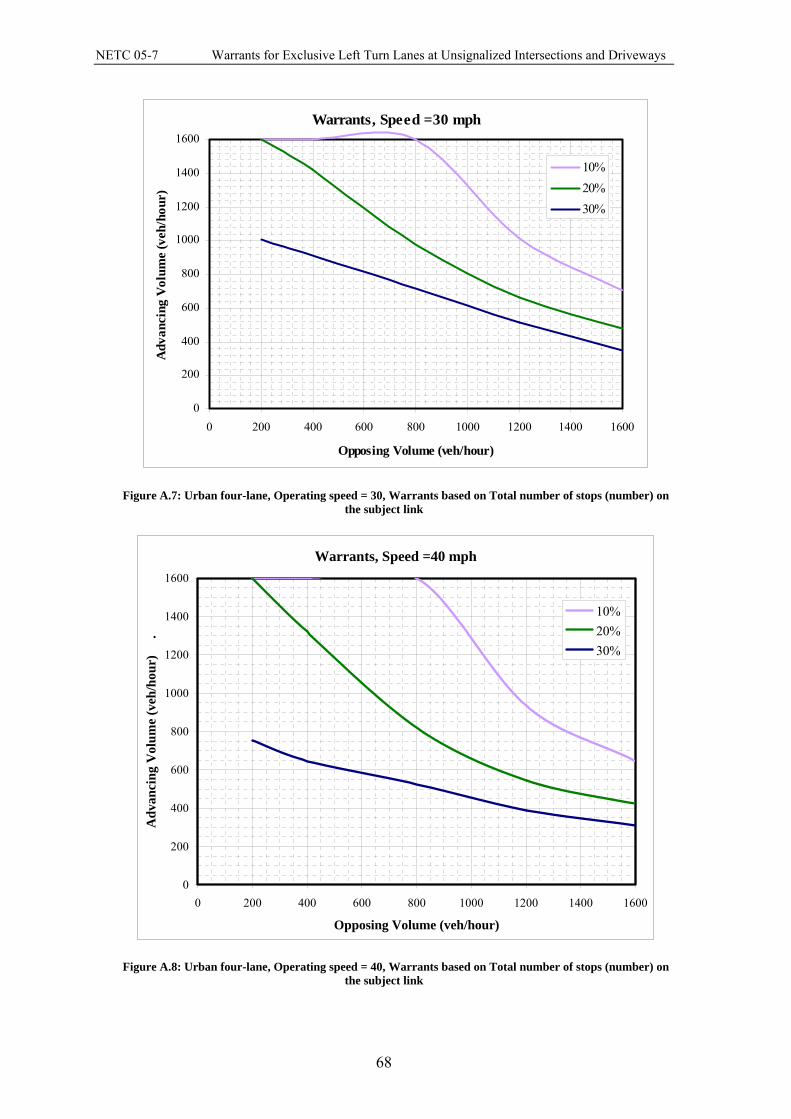
NETC 05-7 Warrants for Exclusive Left Turn Lanes at Unsignalized Intersections and Driveways
68
Warrants, Speed =30 mph
0
200
400
600
800
1000
1200
1400
1600
0 200 400 600 800 1000 1200 1400 1600
Opposing Volume (veh/hour)
Adv
anci
ng V
olum
e (v
eh/h
our)
10%20%30%
Figure A.7: Urban four-lane, Operating speed = 30, Warrants based on Total number of stops (number) on the subject link
Warrants, Speed =40 mph
0
200
400
600
800
1000
1200
1400
1600
0 200 400 600 800 1000 1200 1400 1600
Opposing Volume (veh/hour)
Adv
anci
ng V
olum
e (v
eh/h
our)
.
10%20%30%
Figure A.8: Urban four-lane, Operating speed = 40, Warrants based on Total number of stops (number) on the subject link

NETC 05-7 Warrants for Exclusive Left Turn Lanes at Unsignalized Intersections and Driveways
Appendix B: Benefits of Left Turn Lane Installation FIGURE B.1: URBAN TWO-LANE CATEGORY, OPERATING SPEED = 30MPH, LEFT TURN PERCENT = 10%........ 70 FIGURE B.2: URBAN TWO-LANE CATEGORY, OPERATING SPEED = 30MPH, LEFT TURN PERCENT = 20% ........ 71 FIGURE B.3: URBAN TWO-LANE CATEGORY, OPERATING SPEED = 30MPH, LEFT TURN PERCENT = 30% ........ 72 FIGURE B.4: URBAN TWO-LANE CATEGORY, OPERATING SPEED = 40MPH, LEFT TURN PERCENT = 10% ........ 73 FIGURE B.5: URBAN TWO-LANE CATEGORY, OPERATING SPEED = 40MPH, LEFT TURN PERCENT = 20% ........ 74 FIGURE B.6: URBAN TWO-LANE CATEGORY, OPERATING SPEED = 40MPH, LEFT TURN PERCENT = 30% ........ 75 FIGURE B.7: URBAN TWO-LANE CATEGORY, OPERATING SPEED = 50MPH, LEFT TURN PERCENT = 10% ........ 76 FIGURE B.8: URBAN TWO-LANE CATEGORY, OPERATING SPEED = 50MPH, LEFT TURN PERCENT = 20% ........ 77 FIGURE B.9: URBAN TWO-LANE CATEGORY, OPERATING SPEED = 50MPH, LEFT TURN PERCENT = 30% ........ 78 FIGURE B.10: RURAL TWO-LANE CATEGORY, OPERATING SPEED = 30MPH, LEFT TURN PERCENT = 10% ....... 79 FIGURE B. 11: RURAL TWO-LANE CATEGORY, OPERATING SPEED = 30MPH, LEFT TURN PERCENT = 20% ...... 80 FIGURE B.12: RURAL TWO-LANE CATEGORY, OPERATING SPEED = 30MPH, LEFT TURN PERCENT = 30% ....... 81 FIGURE B.13: RURAL TWO-LANE CATEGORY, OPERATING SPEED = 40MPH, LEFT TURN PERCENT = 10% ....... 82 FIGURE B.14: RURAL TWO-LANE CATEGORY, OPERATING SPEED = 40MPH, LEFT TURN PERCENT = 20% ....... 83 FIGURE B.15: RURAL TWO-LANE CATEGORY, OPERATING SPEED = 40MPH, LEFT TURN PERCENT = 30% ....... 84 FIGURE B.16: RURAL TWO-LANE CATEGORY, OPERATING SPEED = 50MPH, LEFT TURN PERCENT = 10% ....... 85 FIGURE B.17: RURAL TWO-LANE CATEGORY, OPERATING SPEED = 50MPH, LEFT TURN PERCENT = 20% ....... 86 FIGURE B.18: RURAL TWO-LANE CATEGORY, OPERATING SPEED = 50MPH, LEFT TURN PERCENT = 30% ....... 87 FIGURE B.19: URBAN FOUR-LANE CATEGORY, OPERATING SPEED = 50MPH, LEFT TURN PERCENT = 10% ..... 88 FIGURE B.20: URBAN FOUR-LANE CATEGORY, OPERATING SPEED = 50MPH, LEFT TURN PERCENT = 20% ..... 89 FIGURE B.21: URBAN FOUR-LANE CATEGORY, OPERATING SPEED = 50MPH, LEFT TURN PERCENT = 30% ..... 90 FIGURE B.22: URBAN FOUR-LANE CATEGORY, OPERATING SPEED = 40MPH, LEFT TURN PERCENT = 10% ..... 91 FIGURE B.23: URBAN FOUR-LANE CATEGORY, OPERATING SPEED = 40MPH, LEFT TURN PERCENT = 20% ..... 92 FIGURE B.24: URBAN FOUR-LANE CATEGORY, OPERATING SPEED = 40MPH, LEFT TURN PERCENT = 30% ..... 93 FIGURE B.25: URBAN FOUR-LANE CATEGORY, OPERATING SPEED = 30MPH, LEFT TURN PERCENT = 10% ..... 94 FIGURE B.26: URBAN FOUR-LANE CATEGORY, OPERATING SPEED = 40MPH, LEFT TURN PERCENT = 20% ..... 95 FIGURE B.27: URBAN FOUR-LANE CATEGORY, OPERATING SPEED = 40MPH, LEFT TURN PERCENT = 30% ..... 96
69

NETC 05-7 Warrants for Exclusive Left Turn Lanes at Unsignalized Intersections and Driveways
0500
1000
0
500
10000
5
10
15
VA (vph)
Control Delay savings(sec/veh)
VO (vph)
CD
(sec
/hou
r)
2
4
6
8
10
0500
1000
0
500
10000
5000
10000
VA(vph)
Total Delay savings(veh.sec/hour)
VO(vph)
TD(v
eh.s
ec/h
our)
2000
4000
6000
8000
0500
1000
0
500
10000
100
200
300
VA(vph)
Reduction in number of stops
VO(vph)
Num
ber o
f Sto
ps
50
100
150
200
250
0500
1000
0
500
10000
2
4
6
8
VA(vph)
Reduction in fuel consumption(M.P.G)
VO(vph)
FC(M
.P.G
)
1
2
3
4
5
6
7
Figure B.1: Urban two-lane category, operating speed = 30mph, Left turn Percent = 10%
70

NETC 05-7 Warrants for Exclusive Left Turn Lanes at Unsignalized Intersections and Driveways
0500
1000
0
500
10000
5
10
15
20
VA (vph)
Control Delay savings(sec/veh)
VO (vph)
CD
(sec
/hou
r)
5
10
15
0500
1000
0
500
10000
5000
10000
15000
VA(vph)
Total Delay savings(veh.sec/hour)
VO(vph)
TD(v
eh.s
ec/h
our)
2000
4000
6000
8000
10000
12000
14000
0500
1000
0
500
10000
100
200
300
400
VA(vph)
Reduction in number of stops
VO(vph)
Num
ber o
f Sto
ps
50
100
150
200
250
300
350
0500
1000
0
500
10000
5
10
VA(vph)
Reduction in fuel consumption(M.P.G)
VO(vph)
FC(M
.P.G
)
1
2
3
4
5
6
7
8
Figure B.2: Urban two-lane category, operating speed = 30mph, Left turn Percent = 20%
71
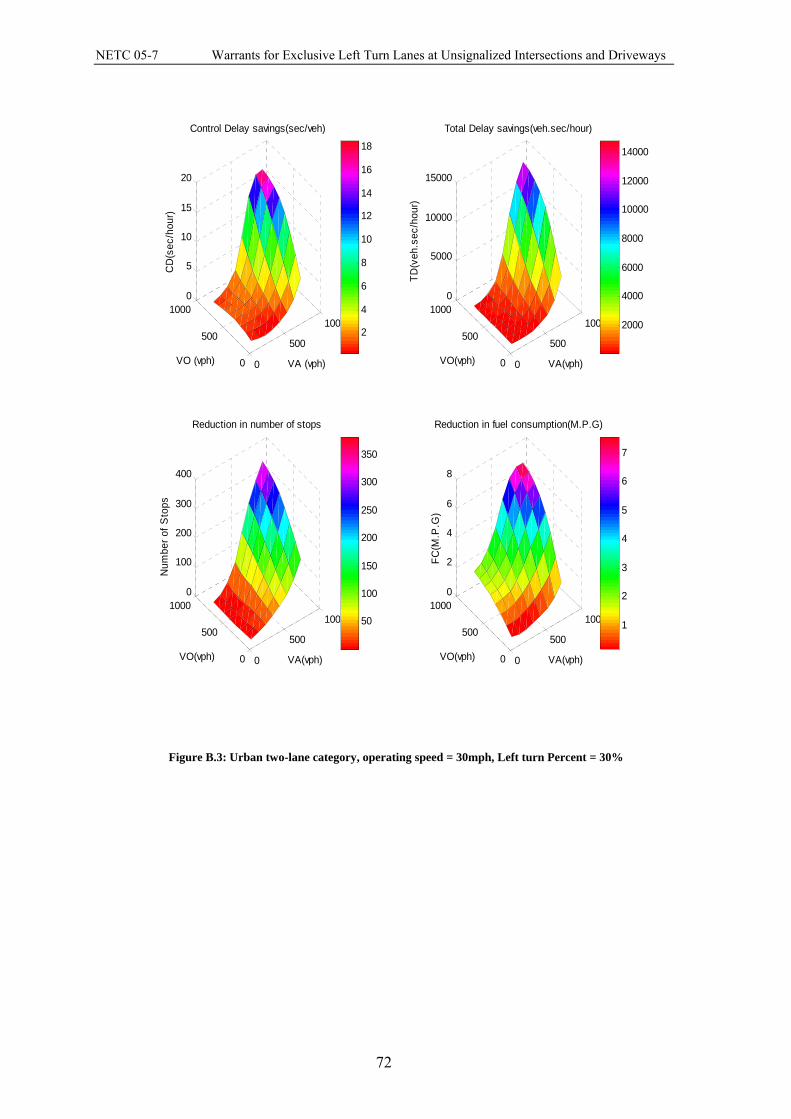
NETC 05-7 Warrants for Exclusive Left Turn Lanes at Unsignalized Intersections and Driveways
0
500
1000
0
500
10000
5
10
15
20
VA (vph)
Control Delay savings(sec/veh)
VO (vph)
CD
(sec
/hou
r)
2
4
6
8
10
12
14
16
18
0
500
1000
0
500
10000
5000
10000
15000
VA(vph)
Total Delay savings(veh.sec/hour)
VO(vph)
TD(v
eh.s
ec/h
our)
2000
4000
6000
8000
10000
12000
14000
0
500
1000
0
500
10000
100
200
300
400
VA(vph)
Reduction in number of stops
VO(vph)
Num
ber o
f Sto
ps
50
100
150
200
250
300
350
0
500
1000
0
500
10000
2
4
6
8
VA(vph)
Reduction in fuel consumption(M.P.G)
VO(vph)
FC(M
.P.G
)
1
2
3
4
5
6
7
Figure B.3: Urban two-lane category, operating speed = 30mph, Left turn Percent = 30%
72
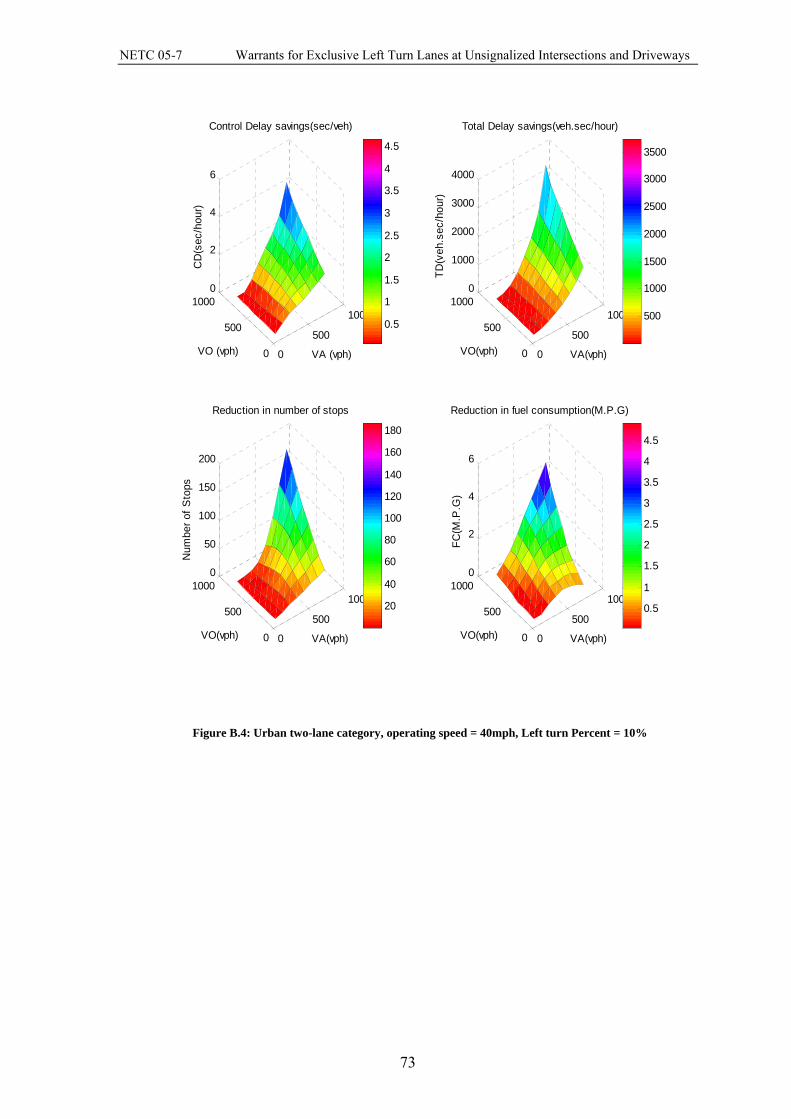
NETC 05-7 Warrants for Exclusive Left Turn Lanes at Unsignalized Intersections and Driveways
0
500
1000
0
500
10000
2
4
6
VA (vph)
Control Delay savings(sec/veh)
VO (vph)
CD
(sec
/hou
r)
0.5
1
1.5
2
2.5
3
3.5
4
4.5
0
500
1000
0
500
10000
1000
2000
3000
4000
VA(vph)
Total Delay savings(veh.sec/hour)
VO(vph)
TD(v
eh.s
ec/h
our)
500
1000
1500
2000
2500
3000
3500
0
500
1000
0
500
10000
50
100
150
200
VA(vph)
Reduction in number of stops
VO(vph)
Num
ber o
f Sto
ps
20
40
60
80
100
120
140
160
180
0
500
1000
0
500
10000
2
4
6
VA(vph)
Reduction in fuel consumption(M.P.G)
VO(vph)
FC(M
.P.G
)
0.5
1
1.5
2
2.5
3
3.5
4
4.5
Figure B.4: Urban two-lane category, operating speed = 40mph, Left turn Percent = 10%
73

NETC 05-7 Warrants for Exclusive Left Turn Lanes at Unsignalized Intersections and Driveways
0
500
1000
0
500
10000
5
10
15
VA (vph)
Control Delay savings(sec/veh)
VO (vph)
CD
(sec
/hou
r)
2
4
6
8
10
0
500
1000
0
500
10000
5000
10000
VA(vph)
Total Delay savings(veh.sec/hour)
VO(vph)
TD(v
eh.s
ec/h
our)
1000
2000
3000
4000
5000
6000
7000
8000
9000
0
500
1000
0
500
10000
100
200
300
400
VA(vph)
Reduction in number of stops
VO(vph)
Num
ber o
f Sto
ps
50
100
150
200
250
300
0
500
1000
0
500
1000-5
0
5
10
VA(vph)
Reduction in fuel consumption(M.P.G)
VO(vph)
FC(M
.P.G
)
0
1
2
3
4
5
6
Figure B.5: Urban two-lane category, operating speed = 40mph, Left turn Percent = 20%
74
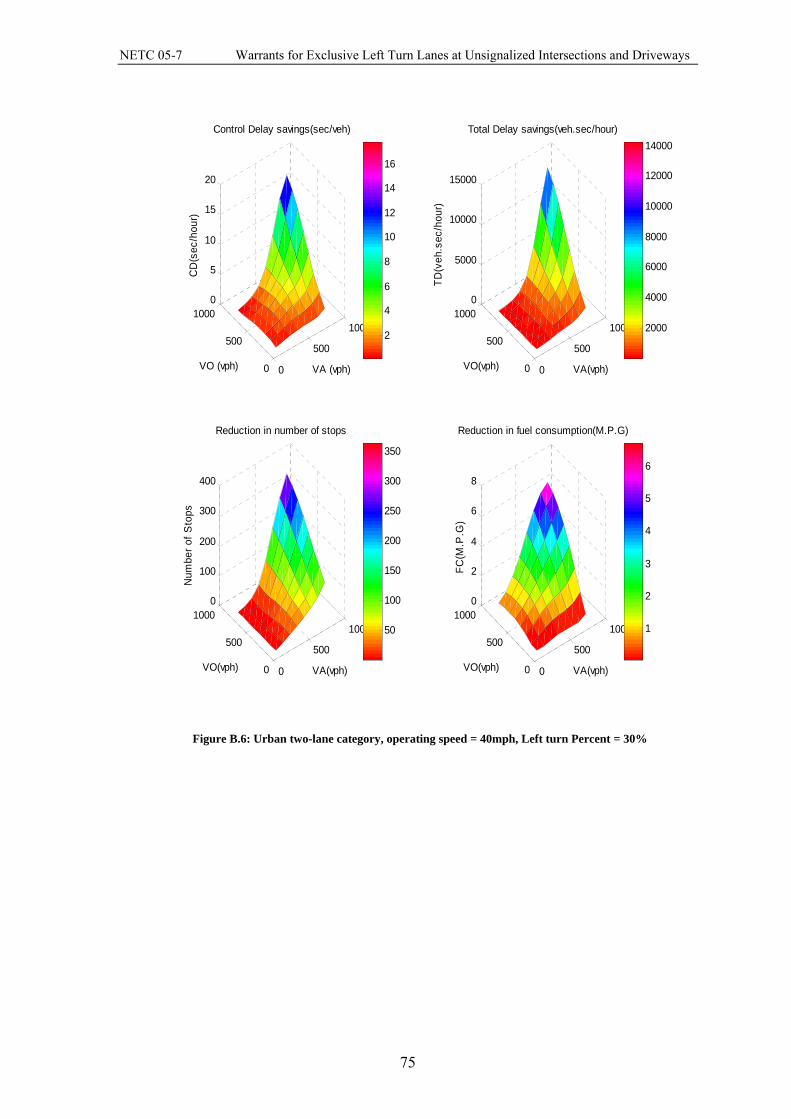
NETC 05-7 Warrants for Exclusive Left Turn Lanes at Unsignalized Intersections and Driveways
0
500
1000
0
500
10000
5
10
15
20
VA (vph)
Control Delay savings(sec/veh)
VO (vph)
CD
(sec
/hou
r)
2
4
6
8
10
12
14
16
0
500
1000
0
500
10000
5000
10000
15000
VA(vph)
Total Delay savings(veh.sec/hour)
VO(vph)
TD(v
eh.s
ec/h
our)
2000
4000
6000
8000
10000
12000
14000
0
500
1000
0
500
10000
100
200
300
400
VA(vph)
Reduction in number of stops
VO(vph)
Num
ber o
f Sto
ps
50
100
150
200
250
300
350
0
500
1000
0
500
10000
2
4
6
8
VA(vph)
Reduction in fuel consumption(M.P.G)
VO(vph)
FC(M
.P.G
)
1
2
3
4
5
6
Figure B.6: Urban two-lane category, operating speed = 40mph, Left turn Percent = 30%
75
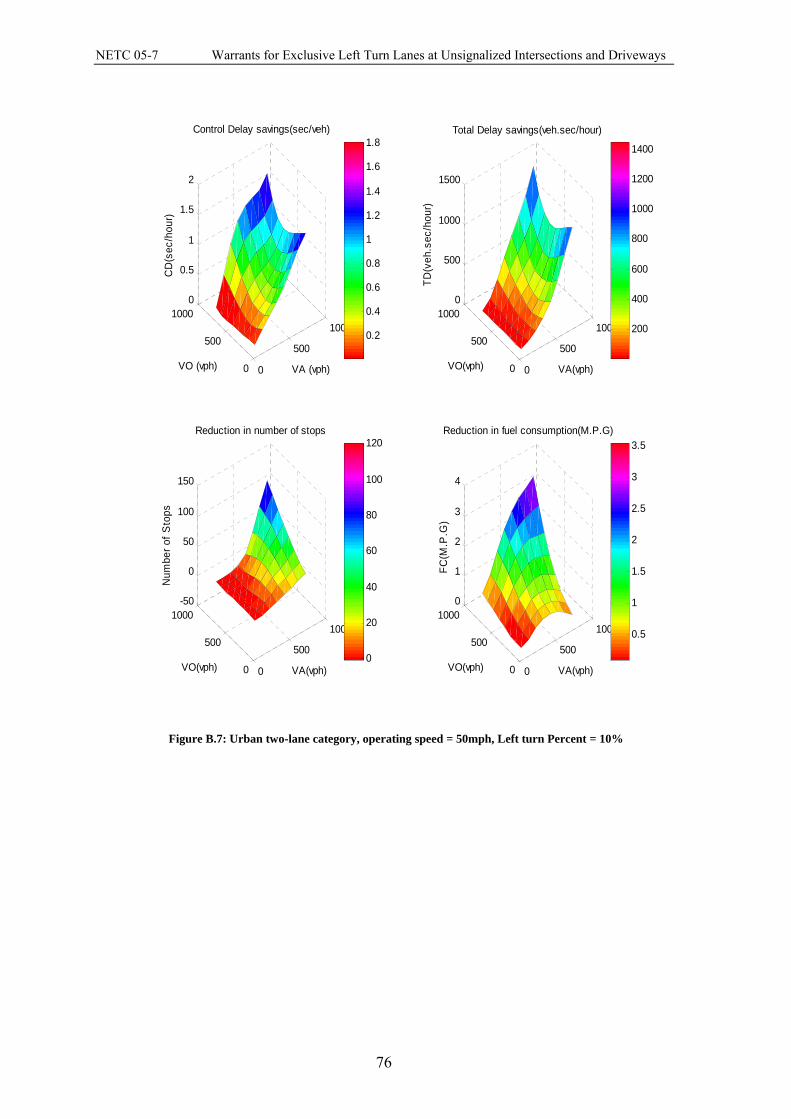
NETC 05-7 Warrants for Exclusive Left Turn Lanes at Unsignalized Intersections and Driveways
0
500
1000
0
500
10000
0.5
1
1.5
2
VA (vph)
Control Delay savings(sec/veh)
VO (vph)
CD
(sec
/hou
r)
0.2
0.4
0.6
0.8
1
1.2
1.4
1.6
1.8
0
500
1000
0
500
10000
500
1000
1500
VA(vph)
Total Delay savings(veh.sec/hour)
VO(vph)
TD(v
eh.s
ec/h
our)
200
400
600
800
1000
1200
1400
0
500
1000
0
500
1000-50
0
50
100
150
VA(vph)
Reduction in number of stops
VO(vph)
Num
ber o
f Sto
ps
0
20
40
60
80
100
120
0
500
1000
0
500
10000
1
2
3
4
VA(vph)
Reduction in fuel consumption(M.P.G)
VO(vph)
FC(M
.P.G
)
0.5
1
1.5
2
2.5
3
3.5
Figure B.7: Urban two-lane category, operating speed = 50mph, Left turn Percent = 10%
76

NETC 05-7 Warrants for Exclusive Left Turn Lanes at Unsignalized Intersections and Driveways
0
500
1000
0
500
10000
2
4
6
VA (vph)
Control Delay savings(sec/veh)
VO (vph)
CD
(sec
/hou
r)
0.5
1
1.5
2
2.5
3
3.5
4
0
500
1000
0
500
10000
1000
2000
3000
4000
VA(vph)
Total Delay savings(veh.sec/hour)
VO(vph)
TD(v
eh.s
ec/h
our)
500
1000
1500
2000
2500
3000
3500
0
500
1000
0
500
10000
100
200
300
VA(vph)
Reduction in number of stops
VO(vph)
Num
ber o
f Sto
ps
50
100
150
200
0
500
1000
0
500
1000-2
0
2
4
6
VA(vph)
Reduction in fuel consumption(M.P.G)
VO(vph)
FC(M
.P.G
)
0
1
2
3
4
Figure B.8: Urban two-lane category, operating speed = 50mph, Left turn Percent = 20%
77

NETC 05-7 Warrants for Exclusive Left Turn Lanes at Unsignalized Intersections and Driveways
0
500
1000
0
500
10000
5
10
15
VA (vph)
Control Delay savings(sec/veh)
VO (vph)
CD
(sec
/hou
r)
2
4
6
8
10
0
500
1000
0
500
10000
2000
4000
6000
8000
10000
VA(vph)
Total Delay savings(veh.sec/hour)
VO(vph)
TD(v
eh.s
ec/h
our)
1000
2000
3000
4000
5000
6000
7000
8000
9000
0
500
1000
0
500
10000
100
200
300
400
VA(vph)
Reduction in number of stops
VO(vph)
Num
ber o
f Sto
ps
50
100
150
200
250
300
0
500
1000
0
500
10000
2
4
6
VA(vph)
Reduction in fuel consumption(M.P.G)
VO(vph)
FC(M
.P.G
)
1
2
3
4
5
Figure B.9: Urban two-lane category, operating speed = 50mph, Left turn Percent = 30%
78
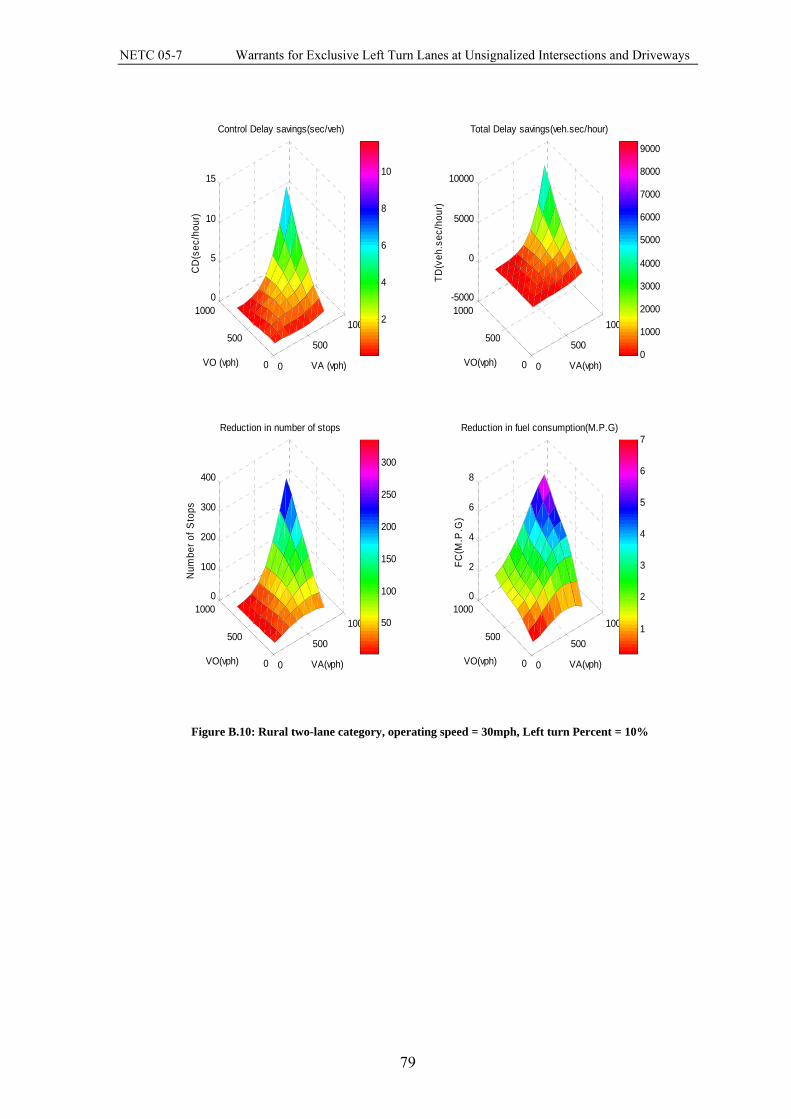
NETC 05-7 Warrants for Exclusive Left Turn Lanes at Unsignalized Intersections and Driveways
0
500
1000
0
500
10000
5
10
15
VA (vph)
Control Delay savings(sec/veh)
VO (vph)
CD
(sec
/hou
r)
2
4
6
8
10
0
500
1000
0
500
1000-5000
0
5000
10000
VA(vph)
Total Delay savings(veh.sec/hour)
VO(vph)
TD(v
eh.s
ec/h
our)
0
1000
2000
3000
4000
5000
6000
7000
8000
9000
0
500
1000
0
500
10000
100
200
300
400
VA(vph)
Reduction in number of stops
VO(vph)
Num
ber o
f Sto
ps
50
100
150
200
250
300
0
500
1000
0
500
10000
2
4
6
8
VA(vph)
Reduction in fuel consumption(M.P.G)
VO(vph)
FC(M
.P.G
)
1
2
3
4
5
6
7
Figure B.10: Rural two-lane category, operating speed = 30mph, Left turn Percent = 10%
79

NETC 05-7 Warrants for Exclusive Left Turn Lanes at Unsignalized Intersections and Driveways
0
500
1000
0
500
10000
5
10
15
20
VA (vph)
Control Delay savings(sec/veh)
VO (vph)
CD
(sec
/hou
r)
2
4
6
8
10
12
14
0
500
1000
0
500
10000
5000
10000
15000
VA(vph)
Total Delay savings(veh.sec/hour)
VO(vph)
TD(v
eh.s
ec/h
our)
2000
4000
6000
8000
10000
12000
0
500
1000
0
500
10000
100
200
300
400
VA(vph)
Reduction in number of stops
VO(vph)
Num
ber o
f Sto
ps
50
100
150
200
250
300
0
500
1000
0
500
10000
2
4
6
8
VA(vph)
Reduction in fuel consumption(M.P.G)
VO(vph)
FC(M
.P.G
)
1
2
3
4
5
6
Figure B. 11: Rural two-lane category, operating speed = 30mph, Left turn Percent = 20%
80
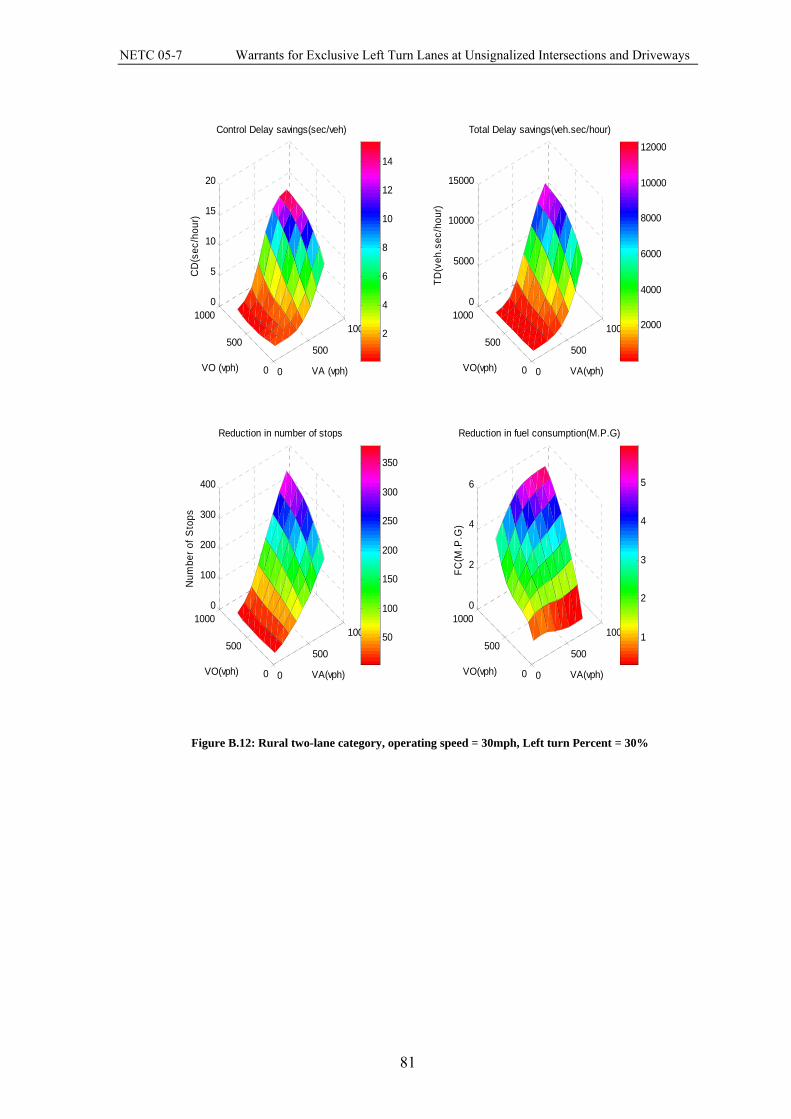
NETC 05-7 Warrants for Exclusive Left Turn Lanes at Unsignalized Intersections and Driveways
0
500
1000
0
500
10000
5
10
15
20
VA (vph)
Control Delay savings(sec/veh)
VO (vph)
CD
(sec
/hou
r)
2
4
6
8
10
12
14
0
500
1000
0
500
10000
5000
10000
15000
VA(vph)
Total Delay savings(veh.sec/hour)
VO(vph)
TD(v
eh.s
ec/h
our)
2000
4000
6000
8000
10000
12000
0
500
1000
0
500
10000
100
200
300
400
VA(vph)
Reduction in number of stops
VO(vph)
Num
ber o
f Sto
ps
50
100
150
200
250
300
350
0
500
1000
0
500
10000
2
4
6
VA(vph)
Reduction in fuel consumption(M.P.G)
VO(vph)
FC(M
.P.G
)
1
2
3
4
5
Figure B.12: Rural two-lane category, operating speed = 30mph, Left turn Percent = 30%
81

NETC 05-7 Warrants for Exclusive Left Turn Lanes at Unsignalized Intersections and Driveways
0
500
1000
0
500
10000
2
4
6
8
VA (vph)
Control Delay savings(sec/veh)
VO (vph)
CD
(sec
/hou
r)
1
2
3
4
5
6
0
500
1000
0
500
10000
2000
4000
6000
VA(vph)
Total Delay savings(veh.sec/hour)
VO(vph)
TD(v
eh.s
ec/h
our)
500
1000
1500
2000
2500
3000
3500
4000
4500
5000
0
500
1000
0
500
10000
50
100
150
200
VA(vph)
Reduction in number of stops
VO(vph)
Num
ber o
f Sto
ps
20
40
60
80
100
120
140
160
180
0
500
1000
0
500
10000
1
2
3
4
5
VA(vph)
Reduction in fuel consumption(M.P.G)
VO(vph)
FC(M
.P.G
)
0.5
1
1.5
2
2.5
3
3.5
4
Figure B.13: Rural two-lane category, operating speed = 40mph, Left turn Percent = 10%
82
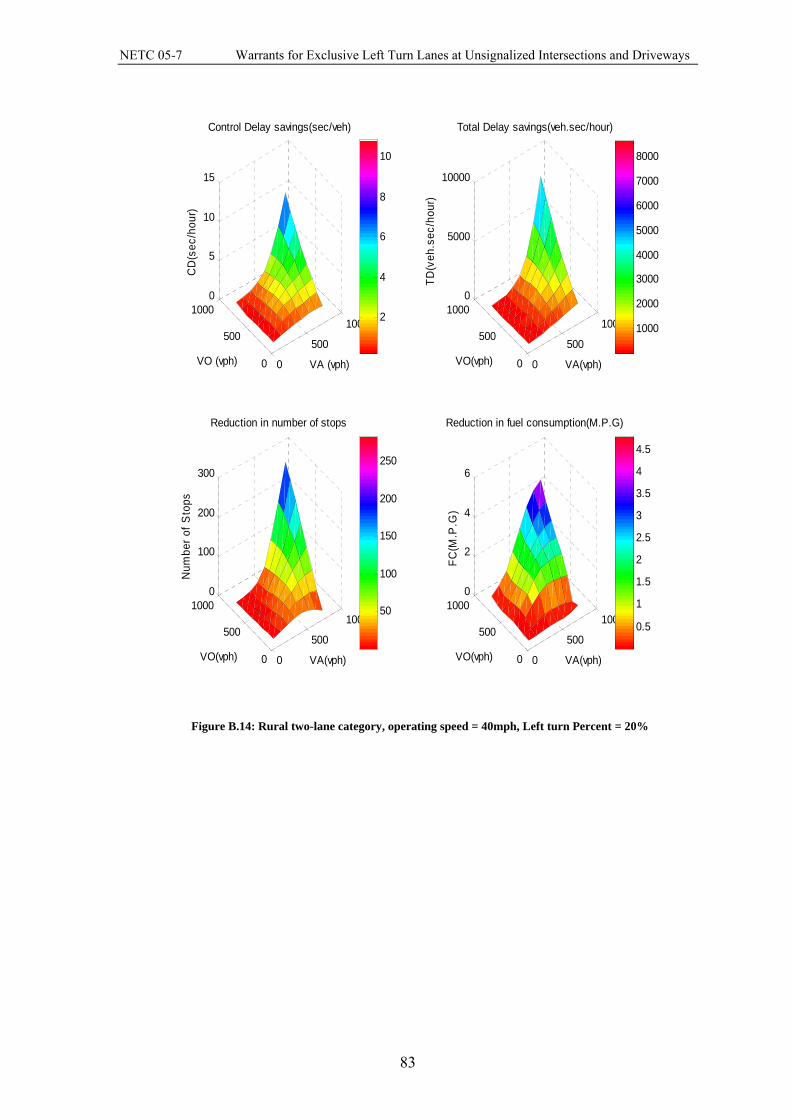
NETC 05-7 Warrants for Exclusive Left Turn Lanes at Unsignalized Intersections and Driveways
0
500
1000
0
500
10000
5
10
15
VA (vph)
Control Delay savings(sec/veh)
VO (vph)
CD
(sec
/hou
r)
2
4
6
8
10
0
500
1000
0
500
10000
5000
10000
VA(vph)
Total Delay savings(veh.sec/hour)
VO(vph)
TD(v
eh.s
ec/h
our)
1000
2000
3000
4000
5000
6000
7000
8000
0
500
1000
0
500
10000
100
200
300
VA(vph)
Reduction in number of stops
VO(vph)
Num
ber o
f Sto
ps
50
100
150
200
250
0
500
1000
0
500
10000
2
4
6
VA(vph)
Reduction in fuel consumption(M.P.G)
VO(vph)
FC(M
.P.G
)
0.5
1
1.5
2
2.5
3
3.5
4
4.5
Figure B.14: Rural two-lane category, operating speed = 40mph, Left turn Percent = 20%
83
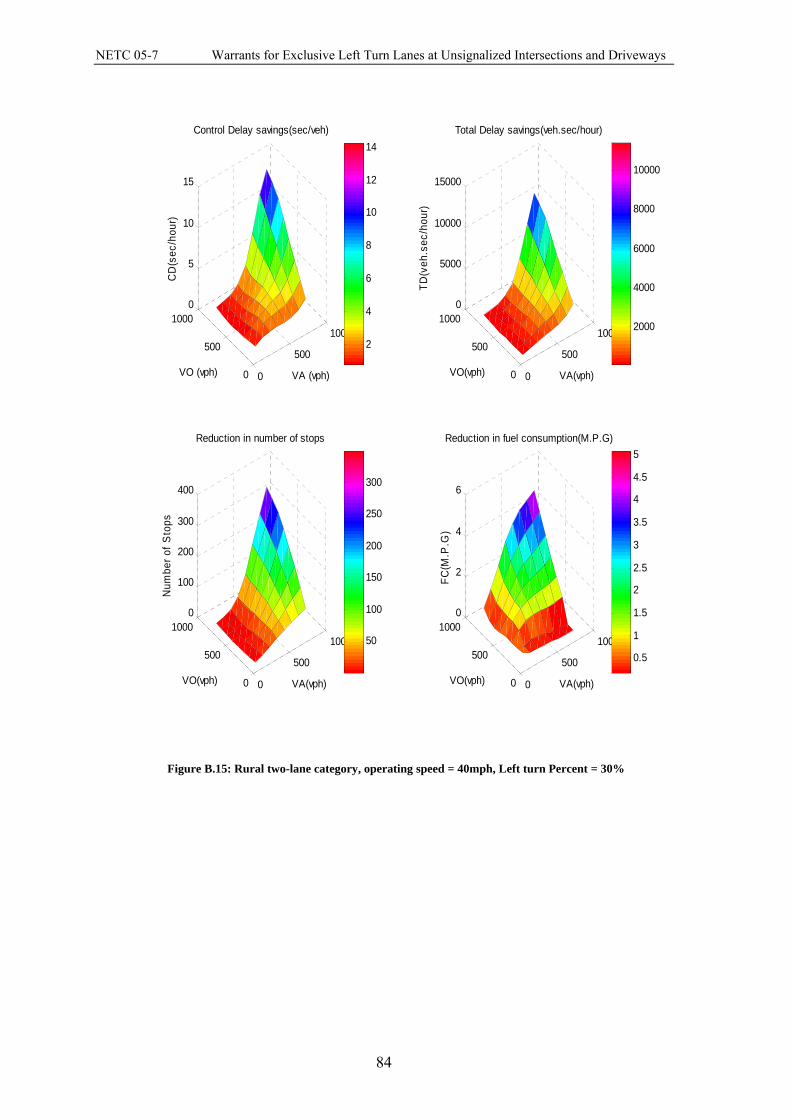
NETC 05-7 Warrants for Exclusive Left Turn Lanes at Unsignalized Intersections and Driveways
0
500
1000
0
500
10000
5
10
15
VA (vph)
Control Delay savings(sec/veh)
VO (vph)
CD
(sec
/hou
r)
2
4
6
8
10
12
14
0
500
1000
0
500
10000
5000
10000
15000
VA(vph)
Total Delay savings(veh.sec/hour)
VO(vph)
TD(v
eh.s
ec/h
our)
2000
4000
6000
8000
10000
0
500
1000
0
500
10000
100
200
300
400
VA(vph)
Reduction in number of stops
VO(vph)
Num
ber o
f Sto
ps
50
100
150
200
250
300
0
500
1000
0
500
10000
2
4
6
VA(vph)
Reduction in fuel consumption(M.P.G)
VO(vph)
FC(M
.P.G
)
0.5
1
1.5
2
2.5
3
3.5
4
4.5
5
Figure B.15: Rural two-lane category, operating speed = 40mph, Left turn Percent = 30%
84

NETC 05-7 Warrants for Exclusive Left Turn Lanes at Unsignalized Intersections and Driveways
0
500
1000
0
500
10000
0.5
1
1.5
2
VA (vph)
Control Delay savings(sec/veh)
VO (vph)
CD
(sec
/hou
r)
0.2
0.4
0.6
0.8
1
1.2
1.4
1.6
1.8
0
500
1000
0
500
10000
500
1000
1500
VA(vph)
Total Delay savings(veh.sec/hour)
VO(vph)
TD(v
eh.s
ec/h
our)
200
400
600
800
1000
1200
1400
0
500
1000
0
500
1000-50
0
50
100
150
VA(vph)
Reduction in number of stops
VO(vph)
Num
ber o
f Sto
ps
0
20
40
60
80
100
120
0
500
1000
0
500
10000
1
2
3
4
VA(vph)
Reduction in fuel consumption(M.P.G)
VO(vph)
FC(M
.P.G
)
0.5
1
1.5
2
2.5
3
3.5
Figure B.16: Rural two-lane category, operating speed = 50mph, Left turn Percent = 10%
85
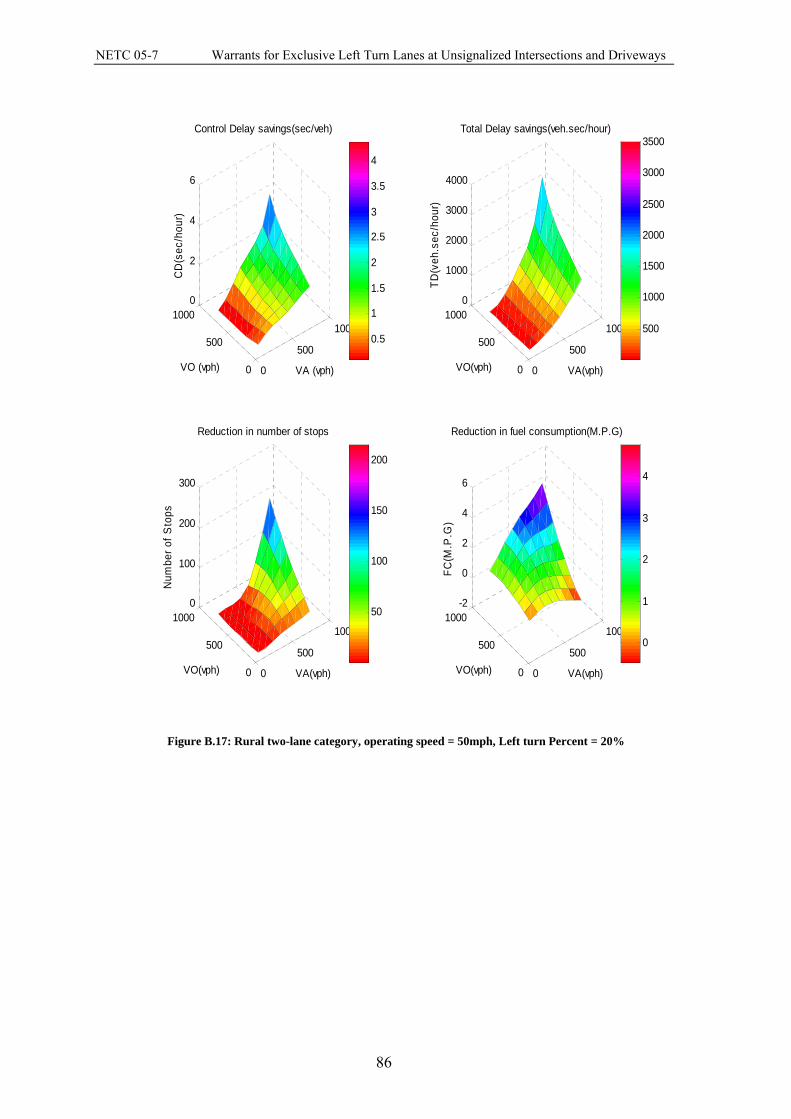
NETC 05-7 Warrants for Exclusive Left Turn Lanes at Unsignalized Intersections and Driveways
0
500
1000
0
500
10000
2
4
6
VA (vph)
Control Delay savings(sec/veh)
VO (vph)
CD
(sec
/hou
r)
0.5
1
1.5
2
2.5
3
3.5
4
0
500
1000
0
500
10000
1000
2000
3000
4000
VA(vph)
Total Delay savings(veh.sec/hour)
VO(vph)
TD(v
eh.s
ec/h
our)
500
1000
1500
2000
2500
3000
3500
0
500
1000
0
500
10000
100
200
300
VA(vph)
Reduction in number of stops
VO(vph)
Num
ber o
f Sto
ps
50
100
150
200
0
500
1000
0
500
1000-2
0
2
4
6
VA(vph)
Reduction in fuel consumption(M.P.G)
VO(vph)
FC(M
.P.G
)
0
1
2
3
4
Figure B.17: Rural two-lane category, operating speed = 50mph, Left turn Percent = 20%
86

NETC 05-7 Warrants for Exclusive Left Turn Lanes at Unsignalized Intersections and Driveways
0
500
1000
0
500
10000
5
10
15
VA (vph)
Control Delay savings(sec/veh)
VO (vph)
CD
(sec
/hou
r)
2
4
6
8
10
0
500
1000
0
500
10000
2000
4000
6000
8000
10000
VA(vph)
Total Delay savings(veh.sec/hour)
VO(vph)
TD(v
eh.s
ec/h
our)
1000
2000
3000
4000
5000
6000
7000
8000
9000
0
500
1000
0
500
10000
100
200
300
400
VA(vph)
Reduction in number of stops
VO(vph)
Num
ber o
f Sto
ps
50
100
150
200
250
300
0
500
1000
0
500
10000
2
4
6
VA(vph)
Reduction in fuel consumption(M.P.G)
VO(vph)
FC(M
.P.G
)
1
2
3
4
5
Figure B.18: Rural two-lane category, operating speed = 50mph, Left turn Percent = 30%
87

NETC 05-7 Warrants for Exclusive Left Turn Lanes at Unsignalized Intersections and Driveways
0500
1000
0
500
10000
2
4
6
VA (vph)
Control Delay savings(sec/veh)
VO (vph)
CD
(sec
/hou
r)
1
2
3
4
0
5001000
0
500
10000
2000
4000
6000
8000
VA(vph)
Total Delay savings(veh.sec/hour)
VO(vph)
TD(v
eh.s
ec/h
our)
1000
2000
3000
4000
5000
6000
7000
0500
1000
0
500
10000
200
400
600
VA(vph)
Reduction in number of stops
VO(vph)
Num
ber o
f Sto
ps
50
100
150
200
250
300
350
400
0
5001000
0
500
10000
1
2
3
4
VA(vph)
Reduction in fuel consumption(M.P.G)
VO(vph)
FC(M
.P.G
)
0.5
1
1.5
2
2.5
3
3.5
Figure B.19: Urban four-lane category, operating speed = 50mph, Left turn Percent = 10%
88
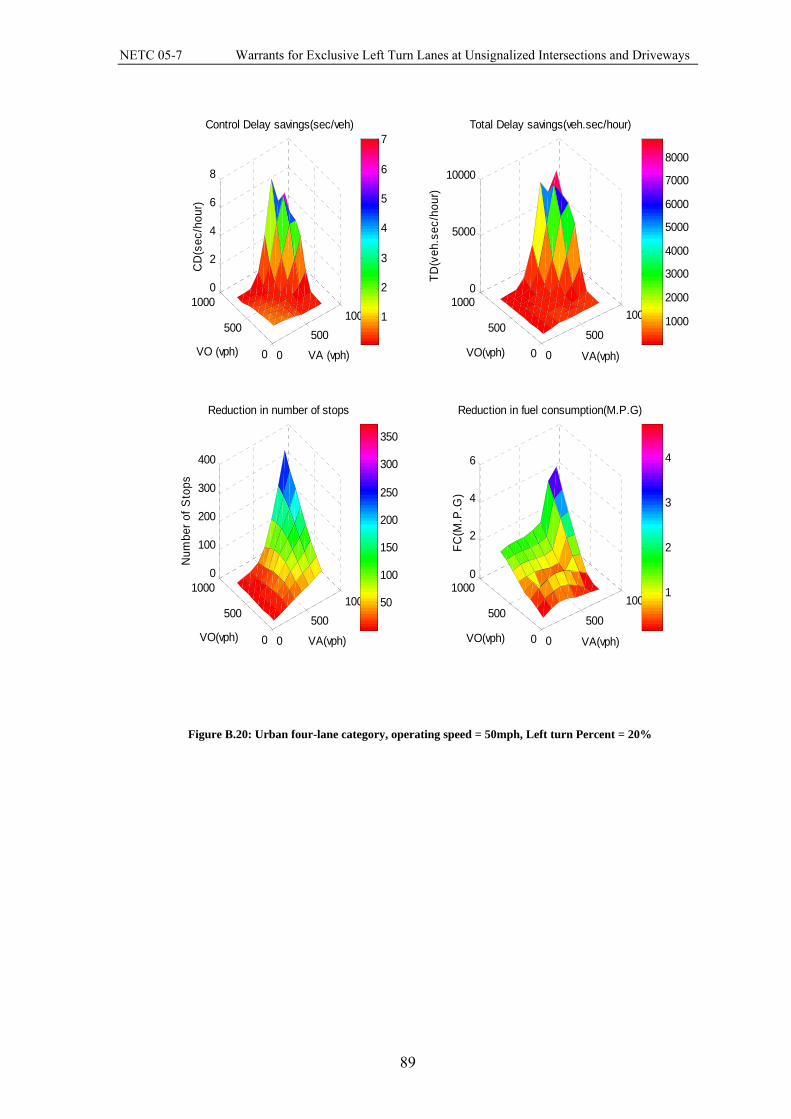
NETC 05-7 Warrants for Exclusive Left Turn Lanes at Unsignalized Intersections and Driveways
0
5001000
0
500
10000
2
4
6
8
VA (vph)
Control Delay savings(sec/veh)
VO (vph)
CD
(sec
/hou
r)
1
2
3
4
5
6
7
0
500
1000
0
500
10000
5000
10000
VA(vph)
Total Delay savings(veh.sec/hour)
VO(vph)
TD(v
eh.s
ec/h
our)
1000
2000
3000
4000
5000
6000
7000
8000
0
5001000
0
500
10000
100
200
300
400
VA(vph)
Reduction in number of stops
VO(vph)
Num
ber o
f Sto
ps
50
100
150
200
250
300
350
0
500
1000
0
500
10000
2
4
6
VA(vph)
Reduction in fuel consumption(M.P.G)
VO(vph)
FC(M
.P.G
)
1
2
3
4
Figure B.20: Urban four-lane category, operating speed = 50mph, Left turn Percent = 20%
89
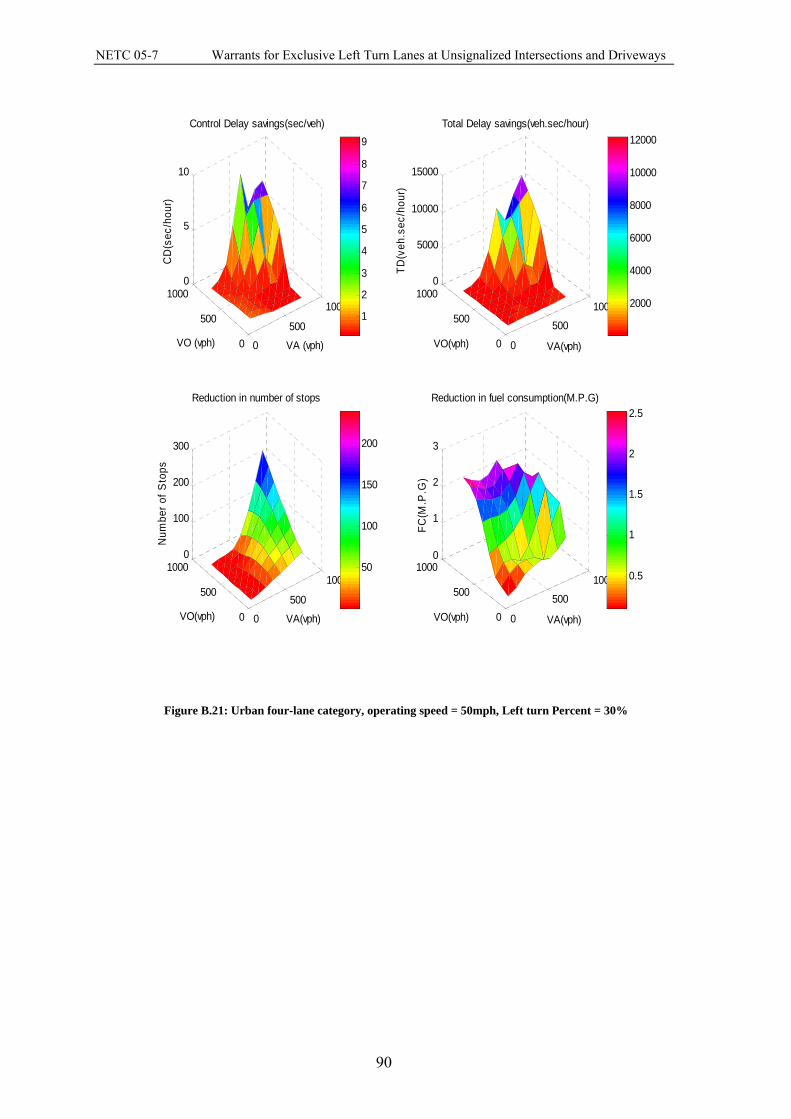
NETC 05-7 Warrants for Exclusive Left Turn Lanes at Unsignalized Intersections and Driveways
0
500
1000
0
500
10000
5
10
VA (vph)
Control Delay savings(sec/veh)
VO (vph)
CD
(sec
/hou
r)
1
2
3
4
5
6
7
8
9
0
500
1000
0
500
10000
5000
10000
15000
VA(vph)
Total Delay savings(veh.sec/hour)
VO(vph)
TD(v
eh.s
ec/h
our)
2000
4000
6000
8000
10000
12000
0
500
1000
0
500
10000
100
200
300
VA(vph)
Reduction in number of stops
VO(vph)
Num
ber o
f Sto
ps
50
100
150
200
0
500
1000
0
500
10000
1
2
3
VA(vph)
Reduction in fuel consumption(M.P.G)
VO(vph)
FC(M
.P.G
)
0.5
1
1.5
2
2.5
Figure B.21: Urban four-lane category, operating speed = 50mph, Left turn Percent = 30%
90
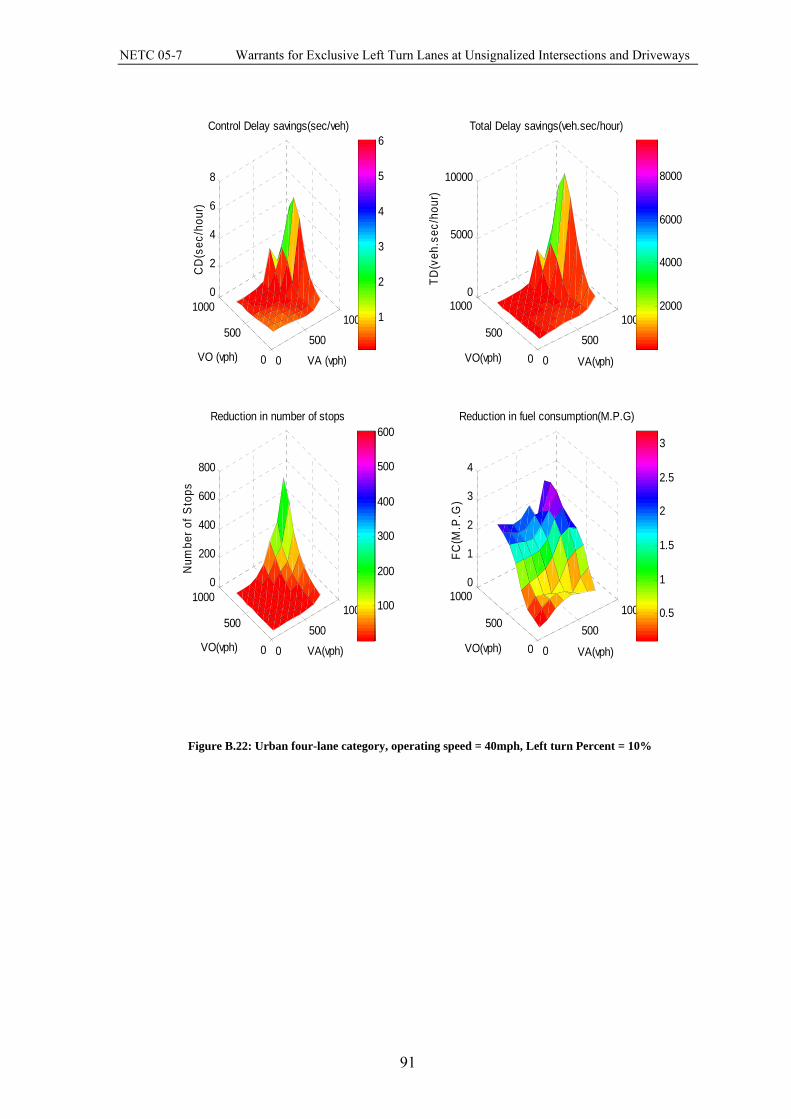
NETC 05-7 Warrants for Exclusive Left Turn Lanes at Unsignalized Intersections and Driveways
0
500
1000
0
500
10000
2
4
6
8
VA (vph)
Control Delay savings(sec/veh)
VO (vph)
CD
(sec
/hou
r)
1
2
3
4
5
6
0
500
1000
0
500
10000
5000
10000
VA(vph)
Total Delay savings(veh.sec/hour)
VO(vph)
TD(v
eh.s
ec/h
our)
2000
4000
6000
8000
0
500
1000
0
500
10000
200
400
600
800
VA(vph)
Reduction in number of stops
VO(vph)
Num
ber o
f Sto
ps
100
200
300
400
500
600
0
500
1000
0
500
10000
1
2
3
4
VA(vph)
Reduction in fuel consumption(M.P.G)
VO(vph)
FC(M
.P.G
)
0.5
1
1.5
2
2.5
3
Figure B.22: Urban four-lane category, operating speed = 40mph, Left turn Percent = 10%
91

NETC 05-7 Warrants for Exclusive Left Turn Lanes at Unsignalized Intersections and Driveways
0
500
1000
0
500
10000
5
10
15
20
VA (vph)
Control Delay savings(sec/veh)
VO (vph)
CD
(sec
/hou
r)
2
4
6
8
10
12
14
0
500
1000
0
500
10000
1
2
3
x 104
VA(vph)
Total Delay savings(veh.sec/hour)
VO(vph)
TD(v
eh.s
ec/h
our)
0.5
1
1.5
2
x 104
0
500
1000
0
500
10000
100
200
300
400
VA(vph)
Reduction in number of stops
VO(vph)
Num
ber o
f Sto
ps
50
100
150
200
250
300
0
500
1000
0
500
10000
1
2
3
VA(vph)
Reduction in fuel consumption(M.P.G)
VO(vph)
FC(M
.P.G
)
0.5
1
1.5
2
2.5
Figure B.23: Urban four-lane category, operating speed = 40mph, Left turn Percent = 20%
92

NETC 05-7 Warrants for Exclusive Left Turn Lanes at Unsignalized Intersections and Driveways
0
500
1000
0
500
10000
5
10
15
20
VA (vph)
Control Delay savings(sec/veh)
VO (vph)
CD
(sec
/hou
r)
2
4
6
8
10
12
14
16
18
0
500
1000
0
500
10000
1
2
3
x 104
VA(vph)
Total Delay savings(veh.sec/hour)
VO(vph)
TD(v
eh.s
ec/h
our)
0.5
1
1.5
2
2.5
x 104
0
500
1000
0
500
10000
50
100
VA(vph)
Reduction in number of stops
VO(vph)
Num
ber o
f Sto
ps
10
20
30
40
50
60
70
80
0
500
1000
0
500
10000
1
2
3
VA(vph)
Reduction in fuel consumption(M.P.G)
VO(vph)
FC(M
.P.G
)
0.5
1
1.5
2
Figure B.24: Urban four-lane category, operating speed = 40mph, Left turn Percent = 30%
93

NETC 05-7 Warrants for Exclusive Left Turn Lanes at Unsignalized Intersections and Driveways
0
500
1000
0
500
10000
10
20
30
VA (vph)
Control Delay savings(sec/veh)
VO (vph)
CD
(sec
/hou
r)
5
10
15
20
0
500
1000
0
500
10000
1
2
3
4
x 104
VA(vph)
Total Delay savings(veh.sec/hour)
VO(vph)
TD(v
eh.s
ec/h
our)
0.5
1
1.5
2
2.5
3
x 104
0
500
1000
0
500
10000
200
400
600
800
VA(vph)
Reduction in number of stops
VO(vph)
Num
ber o
f Sto
ps
100
200
300
400
500
600
0
500
1000
0
500
10000
1
2
3
4
VA(vph)
Reduction in fuel consumption(M.P.G)
VO(vph)
FC(M
.P.G
)
0.5
1
1.5
2
2.5
3
Figure B.25: Urban four-lane category, operating speed = 30mph, Left turn Percent = 10%
94
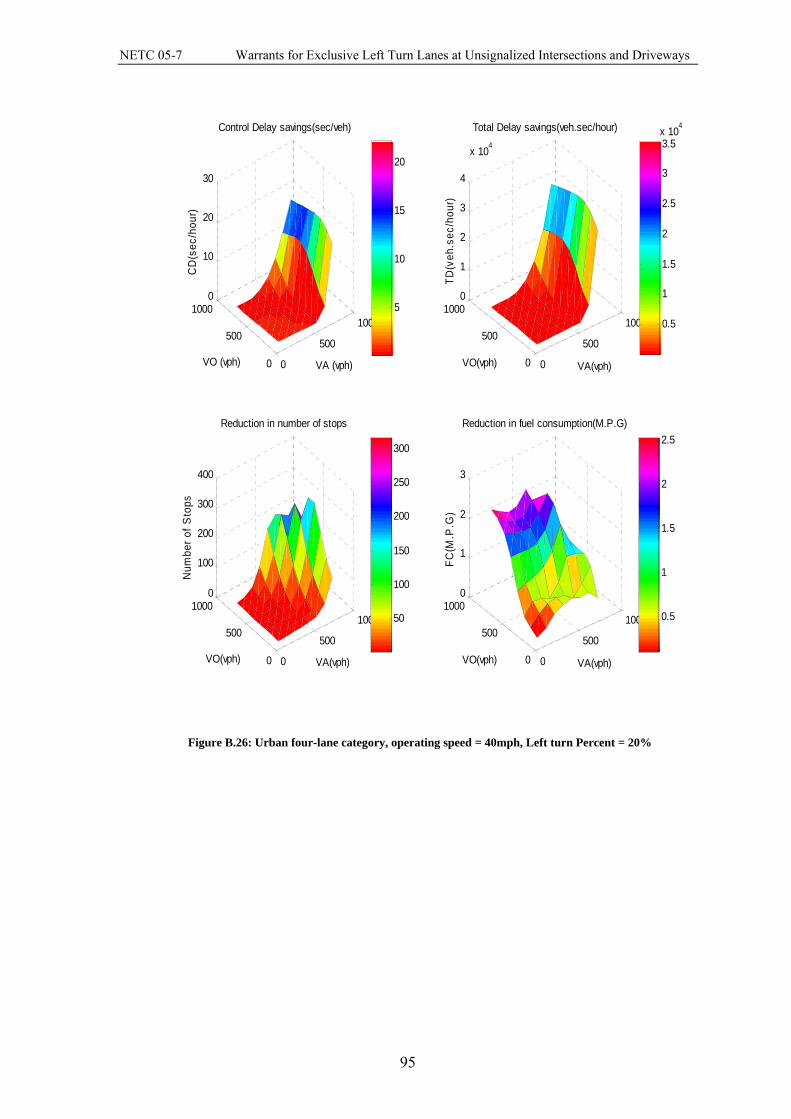
NETC 05-7 Warrants for Exclusive Left Turn Lanes at Unsignalized Intersections and Driveways
0
500
1000
0
500
10000
10
20
30
VA (vph)
Control Delay savings(sec/veh)
VO (vph)
CD
(sec
/hou
r)
5
10
15
20
0
500
1000
0
500
10000
1
2
3
4
x 104
VA(vph)
Total Delay savings(veh.sec/hour)
VO(vph)
TD(v
eh.s
ec/h
our)
0.5
1
1.5
2
2.5
3
3.5x 10⁴
0
500
1000
0
500
10000
100
200
300
400
VA(vph)
Reduction in number of stops
VO(vph)
Num
ber o
f Sto
ps
50
100
150
200
250
300
0
500
1000
0
500
10000
1
2
3
VA(vph)
Reduction in fuel consumption(M.P.G)
VO(vph)
FC(M
.P.G
)
0.5
1
1.5
2
2.5
Figure B.26: Urban four-lane category, operating speed = 40mph, Left turn Percent = 20%
95
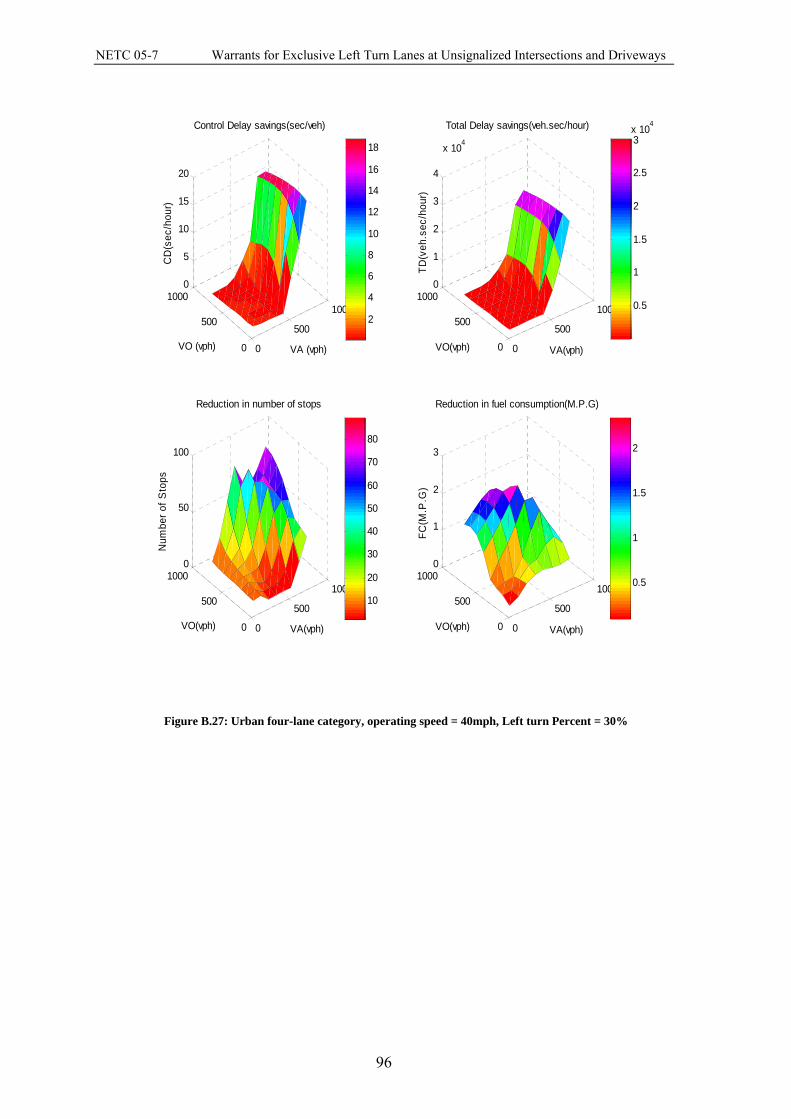
NETC 05-7 Warrants for Exclusive Left Turn Lanes at Unsignalized Intersections and Driveways
96
0
500
1000
0
500
10000
5
10
15
20
VA (vph)
Control Delay savings(sec/veh)
VO (vph)
CD
(sec
/hou
r)
2
4
6
8
10
12
14
16
18
0
500
1000
0
500
10000
1
2
3
4
x 104
VA(vph)
Total Delay savings(veh.sec/hour)
VO(vph)
TD(v
eh.s
ec/h
our)
0.5
1
1.5
2
2.5
3x 10⁴
0
500
1000
0
500
10000
50
100
VA(vph)
Reduction in number of stops
VO(vph)
Num
ber o
f Sto
ps
10
20
30
40
50
60
70
80
0
500
1000
0
500
10000
1
2
3
VA(vph)
Reduction in fuel consumption(M.P.G)
VO(vph)
FC(M
.P.G
)
0.5
1
1.5
2
Figure B.27: Urban four-lane category, operating speed = 40mph, Left turn Percent = 30%

NETC 05-7 Warrants for Exclusive Left Turn Lanes at Unsignalized Intersections and Driveways
Appendix C: Crash Prediction Model Fit Statistics TABLE C.1: MODEL FIT FOR CRASH CATEGORY 1 WITH AND WITHOUT THE “YEAR” VARIABLE .................... 98 TABLE C.2: MODEL FIT FOR CRASH CATEGORY 2 WITH AND WITHOUT THE “YEAR” VARIABLE .................... 99 TABLE C.3: MODEL FIT FOR CRASH CATEGORY 3 WITH AND WITHOUT THE “YEAR” VARIABLE .................. 100 TABLE C.4: MODEL FIT FOR FATAL AND INJURIES FOR THE 6 INTERSECTION TYPE ....................................... 101
97
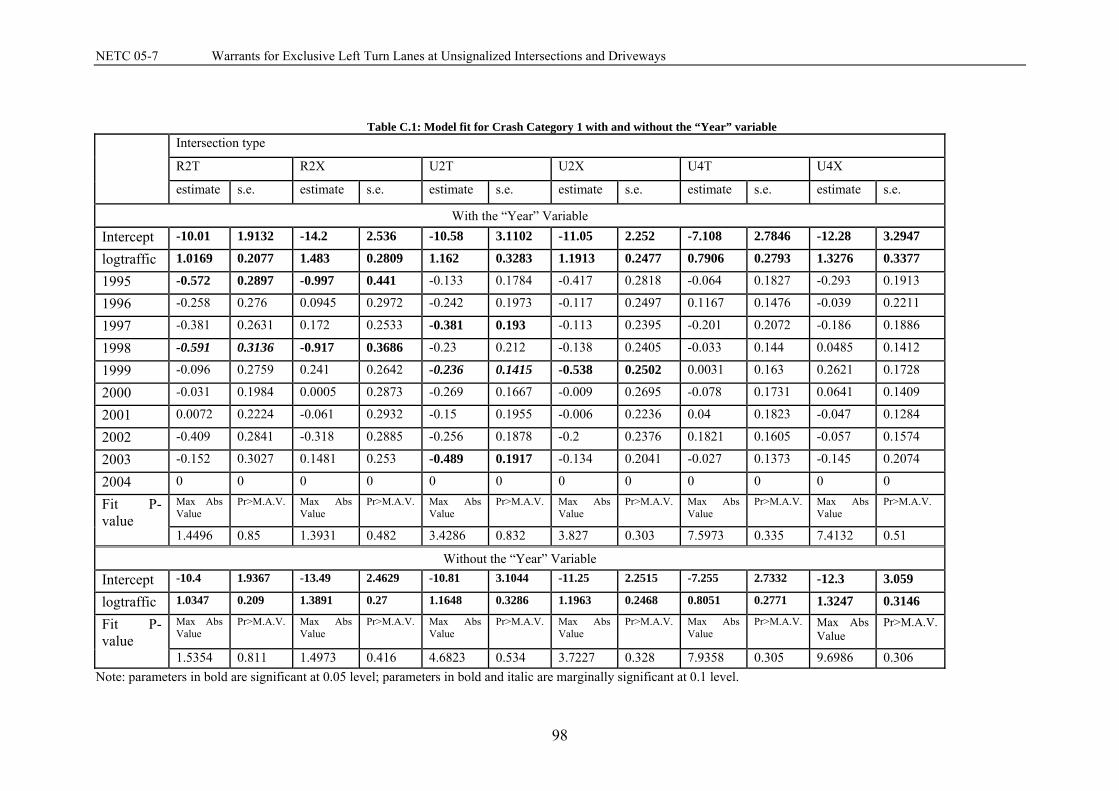
NETC 05-7 Warrants for Exclusive Left Turn Lanes at Unsignalized Intersections and Driveways
Table C.1: Model fit for Crash Category 1 with and without the “Year” variable Intersection type
R2T R2X U2T U2X U4T U4X
estimate s.e. estimate s.e. estimate s.e. estimate s.e. estimate s.e. estimate s.e.
With the “Year” Variable Intercept -10.01 1.9132 -14.2 2.536 -10.58 3.1102 -11.05 2.252 -7.108 2.7846 -12.28 3.2947
logtraffic 1.0169 0.2077 1.483 0.2809 1.162 0.3283 1.1913 0.2477 0.7906 0.2793 1.3276 0.3377
1995 -0.572 0.2897 -0.997 0.441 -0.133 0.1784 -0.417 0.2818 -0.064 0.1827 -0.293 0.1913
1996 -0.258 0.276 0.0945 0.2972 -0.242 0.1973 -0.117 0.2497 0.1167 0.1476 -0.039 0.2211
1997 -0.381 0.2631 0.172 0.2533 -0.381 0.193 -0.113 0.2395 -0.201 0.2072 -0.186 0.1886
1998 -0.591 0.3136 -0.917 0.3686 -0.23 0.212 -0.138 0.2405 -0.033 0.144 0.0485 0.1412
1999 -0.096 0.2759 0.241 0.2642 -0.236 0.1415 -0.538 0.2502 0.0031 0.163 0.2621 0.1728
2000 -0.031 0.1984 0.0005 0.2873 -0.269 0.1667 -0.009 0.2695 -0.078 0.1731 0.0641 0.1409
2001 0.0072 0.2224 -0.061 0.2932 -0.15 0.1955 -0.006 0.2236 0.04 0.1823 -0.047 0.1284
2002 -0.409 0.2841 -0.318 0.2885 -0.256 0.1878 -0.2 0.2376 0.1821 0.1605 -0.057 0.1574
2003 -0.152 0.3027 0.1481 0.253 -0.489 0.1917 -0.134 0.2041 -0.027 0.1373 -0.145 0.2074
2004 0 0 0 0 0 0 0 0 0 0 0 0
Fit P-value
Max Abs Value
Pr>M.A.V. Max Abs Value
Pr>M.A.V. Max Abs Value
Pr>M.A.V. Max Abs Value
Pr>M.A.V. Max Abs Value
Pr>M.A.V. Max Abs Value
Pr>M.A.V.
1.4496 0.85 1.3931 0.482 3.4286 0.832 3.827 0.303 7.5973 0.335 7.4132 0.51
Without the “Year” Variable Intercept -10.4 1.9367 -13.49 2.4629 -10.81 3.1044 -11.25 2.2515 -7.255 2.7332 -12.3 3.059
logtraffic 1.0347 0.209 1.3891 0.27 1.1648 0.3286 1.1963 0.2468 0.8051 0.2771 1.3247 0.3146
Fit P-value
Max Abs Value
Pr>M.A.V. Max Abs Value
Pr>M.A.V. Max Abs Value
Pr>M.A.V. Max Abs Value
Pr>M.A.V. Max Abs Value
Pr>M.A.V. Max Abs Value
Pr>M.A.V.
1.5354 0.811 1.4973 0.416 4.6823 0.534 3.7227 0.328 7.9358 0.305 9.6986 0.306 Note: parameters in bold are significant at 0.05 level; parameters in bold and italic are marginally significant at 0.1 level.
98
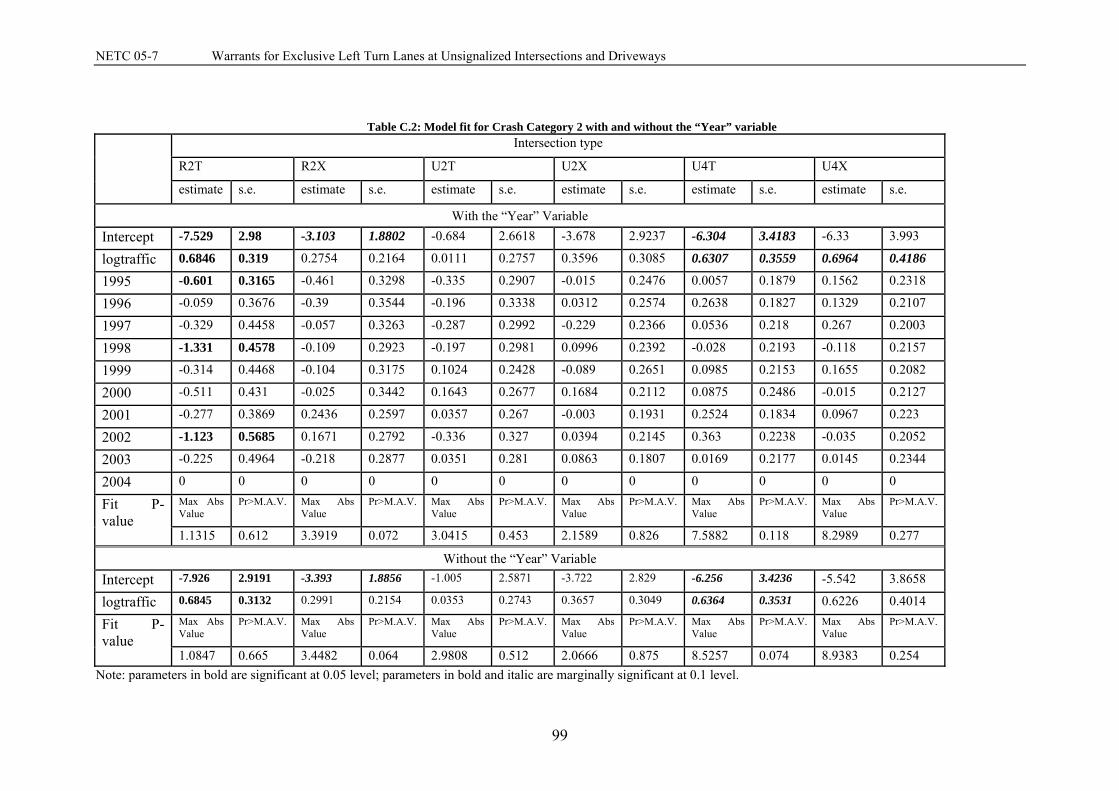
NETC 05-7 Warrants for Exclusive Left Turn Lanes at Unsignalized Intersections and Driveways
Table C.2: Model fit for Crash Category 2 with and without the “Year” variable Intersection type
R2T R2X U2T U2X U4T U4X
estimate s.e. estimate s.e. estimate s.e. estimate s.e. estimate s.e. estimate s.e.
With the “Year” Variable Intercept -7.529 2.98 -3.103 1.8802 -0.684 2.6618 -3.678 2.9237 -6.304 3.4183 -6.33 3.993
logtraffic 0.6846 0.319 0.2754 0.2164 0.0111 0.2757 0.3596 0.3085 0.6307 0.3559 0.6964 0.4186
1995 -0.601 0.3165 -0.461 0.3298 -0.335 0.2907 -0.015 0.2476 0.0057 0.1879 0.1562 0.2318
1996 -0.059 0.3676 -0.39 0.3544 -0.196 0.3338 0.0312 0.2574 0.2638 0.1827 0.1329 0.2107
1997 -0.329 0.4458 -0.057 0.3263 -0.287 0.2992 -0.229 0.2366 0.0536 0.218 0.267 0.2003
1998 -1.331 0.4578 -0.109 0.2923 -0.197 0.2981 0.0996 0.2392 -0.028 0.2193 -0.118 0.2157
1999 -0.314 0.4468 -0.104 0.3175 0.1024 0.2428 -0.089 0.2651 0.0985 0.2153 0.1655 0.2082
2000 -0.511 0.431 -0.025 0.3442 0.1643 0.2677 0.1684 0.2112 0.0875 0.2486 -0.015 0.2127
2001 -0.277 0.3869 0.2436 0.2597 0.0357 0.267 -0.003 0.1931 0.2524 0.1834 0.0967 0.223
2002 -1.123 0.5685 0.1671 0.2792 -0.336 0.327 0.0394 0.2145 0.363 0.2238 -0.035 0.2052
2003 -0.225 0.4964 -0.218 0.2877 0.0351 0.281 0.0863 0.1807 0.0169 0.2177 0.0145 0.2344
2004 0 0 0 0 0 0 0 0 0 0 0 0
Fit P-value
Max Abs Value
Pr>M.A.V. Max Abs Value
Pr>M.A.V. Max Abs Value
Pr>M.A.V. Max Abs Value
Pr>M.A.V. Max Abs Value
Pr>M.A.V. Max Abs Value
Pr>M.A.V.
1.1315 0.612 3.3919 0.072 3.0415 0.453 2.1589 0.826 7.5882 0.118 8.2989 0.277
Without the “Year” Variable Intercept -7.926 2.9191 -3.393 1.8856 -1.005 2.5871 -3.722 2.829 -6.256 3.4236 -5.542 3.8658
logtraffic 0.6845 0.3132 0.2991 0.2154 0.0353 0.2743 0.3657 0.3049 0.6364 0.3531 0.6226 0.4014
Fit P-value
Max Abs Value
Pr>M.A.V. Max Abs Value
Pr>M.A.V. Max Abs Value
Pr>M.A.V. Max Abs Value
Pr>M.A.V. Max Abs Value
Pr>M.A.V. Max Abs Value
Pr>M.A.V.
1.0847 0.665 3.4482 0.064 2.9808 0.512 2.0666 0.875 8.5257 0.074 8.9383 0.254 Note: parameters in bold are significant at 0.05 level; parameters in bold and italic are marginally significant at 0.1 level.
99

NETC 05-7 Warrants for Exclusive Left Turn Lanes at Unsignalized Intersections and Driveways
Table C.3: Model fit for Crash Category 3 with and without the “Year” variable Intersection type
R2T R2X U2T U2X U4T U4X
estimate s.e. estimate s.e. estimate s.e. estimate s.e. estimate s.e. estimate s.e.
With the “Year” Variable Intercept 2.1545 2.1962 -4.749 1.4511 1.392 2.7586 -3.034 2.0631 -6.374 3.1327 -9.331 3.8491
logtraffic -0.285 0.2274 0.4559 0.1605 -0.191 0.2926 0.2428 0.2202 0.5886 0.3174 0.9196 0.3925
1995 -0.263 0.3668 -0.003 0.2976 -0.546 0.2515 -0.073 0.2744 0.08 0.2684 0.0722 0.2347
1996 0.0317 0.3641 -0.412 0.3762 -0.245 0.2632 0.2229 0.2703 -0.234 0.2676 -0.053 0.2838
1997 -0.14 0.3403 -0.299 0.2827 -0.103 0.2762 -0.127 0.3214 0.0316 0.3052 -0.272 0.3983
1998 -0.241 0.3394 -0.897 0.346 -0.488 0.2208 -0.366 0.3349 0.391 0.2618 0.2347 0.2873
1999 -0.264 0.3303 0.0099 0.3101 0.0198 0.2416 -0.884 0.4073 -0.028 0.2977 0.2449 0.2129
2000 -0.294 0.1971 0 0.2761 -0.169 0.195 -0.039 0.3109 0.1931 0.2785 0.0764 0.2768
2001 0.0493 0.3408 -0.447 0.302 -0.236 0.3184 -0.042 0.3309 0.4195 0.3026 -0.118 0.3233
2002 0.0924 0.2344 -0.342 0.3403 -0.537 0.2646 0.0078 0.2712 0.0978 0.274 0.016 0.25
2003 -0.037 0.283 -0.52 0.3207 -0.229 0.2141 -0.044 0.2949 -0.058 0.2417 -0.557 0.2895
2004 0 0 0 0 0 0 0 0 0 0 0 0
Fit P-value
Max Abs Value
Pr>M.A.V. Max Abs Value
Pr>M.A.V. Max Abs Value
Pr>M.A.V. Max Abs Value
Pr>M.A.V. Max Abs Value
Pr>M.A.V. Max Abs Value
Pr>M.A.V.
2.405 0.502 1.1594 0.528 2.9058 0.14 1.9239 0.344 3.8102 0.245 4.6615 0.053
Without the “Year” Variable Intercept 1.992 2.1095 -5.027 1.4294 1.0232 2.7244 -3.15 2.033 -6.372 3.0906 -9.567 3.6535
logtraffic -0.278 0.2273 0.459 0.1601 -0.176 0.2911 0.2448 0.2201 0.5987 0.3124 0.9429 0.3797
Fit P-value
Max Abs Value
Pr>M.A.V. Max Abs Value
Pr>M.A.V. Max Abs Value
Pr>M.A.V. Max Abs Value
Pr>M.A.V. Max Abs Value
Pr>M.A.V. Max Abs Value
Pr>M.A.V.
2.3523 0.539 1.1529 0.567 2.8677 0.154 1.9752 0.316 3.9852 0.236 4.6736 0.051 Note: parameters in bold are significant at 0.05 level; parameters in bold and italic are marginally significant at 0.1 level.
100
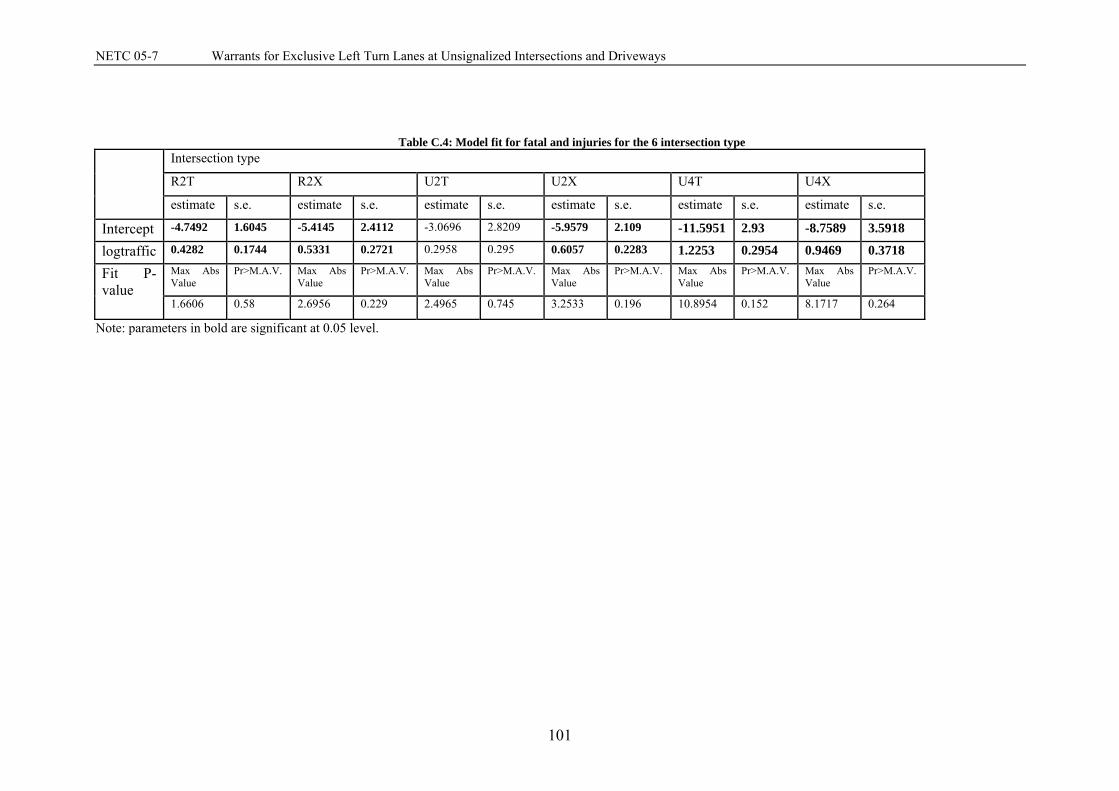
NETC 05-7 Warrants for Exclusive Left Turn Lanes at Unsignalized Intersections and Driveways
101
Table C.4: Model fit for fatal and injuries for the 6 intersection type
Intersection type
R2T R2X U2T U2X U4T U4X
estimate s.e. estimate s.e. estimate s.e. estimate s.e. estimate s.e. estimate s.e.
Intercept -4.7492 1.6045 -5.4145 2.4112 -3.0696 2.8209 -5.9579 2.109 -11.5951 2.93 -8.7589 3.5918
logtraffic 0.4282 0.1744 0.5331 0.2721 0.2958 0.295 0.6057 0.2283 1.2253 0.2954 0.9469 0.3718
Fit P-value
Max Abs Value
Pr>M.A.V. Max Abs Value
Pr>M.A.V. Max Abs Value
Pr>M.A.V. Max Abs Value
Pr>M.A.V. Max Abs Value
Pr>M.A.V. Max Abs Value
Pr>M.A.V.
1.6606 0.58 2.6956 0.229 2.4965 0.745 3.2533 0.196 10.8954 0.152 8.1717 0.264
Note: parameters in bold are significant at 0.05 level.

NETC 05-7 Warrants for Exclusive Left Turn Lanes at Unsignalized Intersections and Driveways
Appendix D: SPF Estimates TABLE D.1: SPF ESTIMATE FOR R2T INTERSECTIONS .................................................................................. 103 TABLE D.2: SPF ESTIMATE FOR R2X INTERSECTIONS .................................................................................. 106 TABLE D.3: SPF ESTIMATE FOR U2T INTERSECTIONS .................................................................................. 108 TABLE D.4: SPF ESTIMATE FOR U2X INTERSECTIONS .................................................................................. 111 TABLE D.5: SPF ESTIMATE FOR U4T INTERSECTIONS .................................................................................. 113 TABLE D.6: SPF ESTIMATE FOR U4X INTERSECTIONS .................................................................................. 116
102

NETC 05-7 Warrants for Exclusive Left Turn Lanes at Unsignalized Intersections and Driveways
Table D.1: SPF estimate for R2T intersections
Int_ ID Rt #
Cum_ Mileage
Ave_ AADT
Min_ AADT
Max_ AADT
Crash Category 1 Fatal and injury crashes
Crash_ ob
SPF_ estimate
P(y>= crash_ob)
P(y<= crash_ob)
Crash_ ob
SPF_ estimate
P(y>= crash_ob)
P(y<= crash_ob)
R2TN01 2 43.97 20310 16900 23600 1 8.735591 0.99983924 0.001565 1 6.024368 0.997581 0.016993 R2TN02 2 44.27 20310 16900 23600 5 8.735591 0.93543331 0.132716 6 6.024368 0.558226 0.602389 R2TN03 2 44.66 24740 23300 30200 6 10.71296 0.95551912 0.091206 6 6.554368 0.638813 0.51798 R2TN04 2 45.88 24740 23300 30200 7 10.71296 0.90879448 0.162714 4 6.554368 0.891837 0.217656 R2TN05 4 25.981 8475 8100 8900 9 3.535825 0.01049189 0.996443 6 4.164399 0.241063 0.871503 R2TN06 4 34.971 9555 9100 10100 1 4.003036 0.98173988 0.091356 1 4.381414 0.987492 0.067309 R2TN07 4 35.483 13035 12400 14000 0 5.520066 1 0.004006 6 4.997864 0.383664 0.762496 R2TN08 4 38.087 20965 19800 22000 13 9.025745 0.12610791 0.947281 12 6.112865 0.022756 0.989828 R2TN09 5 48.341 6625 5400 8400 0 2.741986 1 0.064442 2 3.738 0.887228 0.279058 R2TN10 5 51.352 13405 12500 14300 16 5.682291 0.00028528 0.999715 8 5.057337 0.139429 0.928099 R2TN11 5 51.733 14125 13300 15000 5 5.998428 0.71473306 0.445932 4 5.170339 0.758076 0.41113 R2TN12 6 24.83 12805 12200 13200 2 5.419247 0.97155964 0.093498 1 4.960755 0.992992 0.041771 R2TN13 6 29.63 4110 3800 4700 0 1.672387 1 0.187798 0 3.062603 1 0.046766 R2TN14 6 30.22 4110 3800 4700 2 1.672387 0.49813026 0.764494 4 3.062603 0.366791 0.804636 R2TN15 6 32.14 4835 4500 5100 1 1.978353 0.8617032 0.411897 9 3.28258 0.00669 0.997886 R2TN16 6 37.04 7175 6600 7600 2 2.976293 0.79728265 0.428522 4 3.880057 0.542753 0.652256 R2TN17 6 80.135 16955 16100 18000 4 7.245811 0.9301823 0.151725 4 5.587174 0.807985 0.344097 R2TN18 25 10.21 20205 18900 22600 22 8.687508 0.01657038 0.98343 12 6.017586 0.020491 0.990973 R2TN19 25 12.32 19195 17100 22900 6 8.239435 0.82972613 0.285013 3 5.884101 0.932656 0.16185 R2TN20 25 21.55 14145 12800 15300 0 6.007414 1 0.00246 0 5.172269 1 0.005672 R2TN21 25 21.95 11665 10600 12600 0 4.921188 1 0.00729 0 4.766323 1 0.008512 R2TN22 25 24.78 8060 6800 9100 2 3.357511 0.84826347 0.348008 2 4.071061 0.913491 0.227875 R2TN23 25 24.96 7490 6800 9100 1 3.112421 0.95550689 0.182974 0 3.944329 1 0.019364 R2TN24 30 14.627 6670 6500 7100 5 2.75978 0.14611467 0.938342 3 3.762266 0.724954 0.481235 R2TN25 44 4.357 7800 7400 8500 2 3.244979 0.83457581 0.370596 2 4.019481 0.909839 0.235263 R2TN26 44 5.177 4665 4400 4900 5 1.906429 0.0446054 0.986581 1 3.233137 0.960566 0.166928 R2TN27 44 7.016 4665 4400 4900 0 1.906429 1 0.14861 7 3.233137 0.046663 0.982231
103
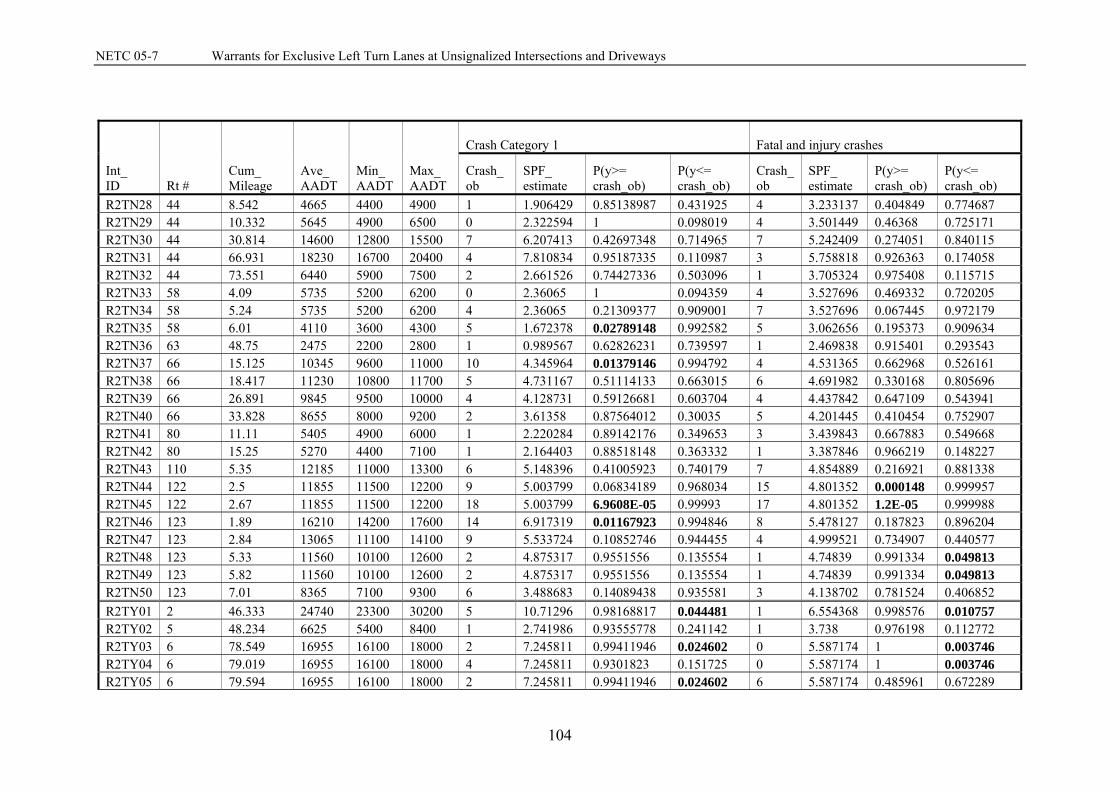
NETC 05-7 Warrants for Exclusive Left Turn Lanes at Unsignalized Intersections and Driveways
Int_ ID Rt #
Cum_ Mileage
Ave_ AADT
Min_ AADT
Max_ AADT
Crash Category 1 Fatal and injury crashes
Crash_ ob
SPF_ estimate
P(y>= crash_ob)
P(y<= crash_ob)
Crash_ ob
SPF_ estimate
P(y>= crash_ob)
P(y<= crash_ob)
R2TN28 44 8.542 4665 4400 4900 1 1.906429 0.85138987 0.431925 4 3.233137 0.404849 0.774687 R2TN29 44 10.332 5645 4900 6500 0 2.322594 1 0.098019 4 3.501449 0.46368 0.725171 R2TN30 44 30.814 14600 12800 15500 7 6.207413 0.42697348 0.714965 7 5.242409 0.274051 0.840115 R2TN31 44 66.931 18230 16700 20400 4 7.810834 0.95187335 0.110987 3 5.758818 0.926363 0.174058 R2TN32 44 73.551 6440 5900 7500 2 2.661526 0.74427336 0.503096 1 3.705324 0.975408 0.115715 R2TN33 58 4.09 5735 5200 6200 0 2.36065 1 0.094359 4 3.527696 0.469332 0.720205 R2TN34 58 5.24 5735 5200 6200 4 2.36065 0.21309377 0.909001 7 3.527696 0.067445 0.972179 R2TN35 58 6.01 4110 3600 4300 5 1.672378 0.02789148 0.992582 5 3.062656 0.195373 0.909634 R2TN36 63 48.75 2475 2200 2800 1 0.989567 0.62826231 0.739597 1 2.469838 0.915401 0.293543 R2TN37 66 15.125 10345 9600 11000 10 4.345964 0.01379146 0.994792 4 4.531365 0.662968 0.526161 R2TN38 66 18.417 11230 10800 11700 5 4.731167 0.51114133 0.663015 6 4.691982 0.330168 0.805696 R2TN39 66 26.891 9845 9500 10000 4 4.128731 0.59126681 0.603704 4 4.437842 0.647109 0.543941 R2TN40 66 33.828 8655 8000 9200 2 3.61358 0.87564012 0.30035 5 4.201445 0.410454 0.752907 R2TN41 80 11.11 5405 4900 6000 1 2.220284 0.89142176 0.349653 3 3.439843 0.667883 0.549668 R2TN42 80 15.25 5270 4400 7100 1 2.164403 0.88518148 0.363332 1 3.387846 0.966219 0.148227 R2TN43 110 5.35 12185 11000 13300 6 5.148396 0.41005923 0.740179 7 4.854889 0.216921 0.881338 R2TN44 122 2.5 11855 11500 12200 9 5.003799 0.06834189 0.968034 15 4.801352 0.000148 0.999957 R2TN45 122 2.67 11855 11500 12200 18 5.003799 6.9608E-05 0.99993 17 4.801352 1.2E-05 0.999988 R2TN46 123 1.89 16210 14200 17600 14 6.917319 0.01167923 0.994846 8 5.478127 0.187823 0.896204 R2TN47 123 2.84 13065 11100 14100 9 5.533724 0.10852746 0.944455 4 4.999521 0.734907 0.440577 R2TN48 123 5.33 11560 10100 12600 2 4.875317 0.9551556 0.135554 1 4.74839 0.991334 0.049813 R2TN49 123 5.82 11560 10100 12600 2 4.875317 0.9551556 0.135554 1 4.74839 0.991334 0.049813 R2TN50 123 7.01 8365 7100 9300 6 3.488683 0.14089438 0.935581 3 4.138702 0.781524 0.406852 R2TY01 2 46.333 24740 23300 30200 5 10.71296 0.98168817 0.044481 1 6.554368 0.998576 0.010757 R2TY02 5 48.234 6625 5400 8400 1 2.741986 0.93555778 0.241142 1 3.738 0.976198 0.112772 R2TY03 6 78.549 16955 16100 18000 2 7.245811 0.99411946 0.024602 0 5.587174 1 0.003746 R2TY04 6 79.019 16955 16100 18000 4 7.245811 0.9301823 0.151725 0 5.587174 1 0.003746 R2TY05 6 79.594 16955 16100 18000 2 7.245811 0.99411946 0.024602 6 5.587174 0.485961 0.672289
104
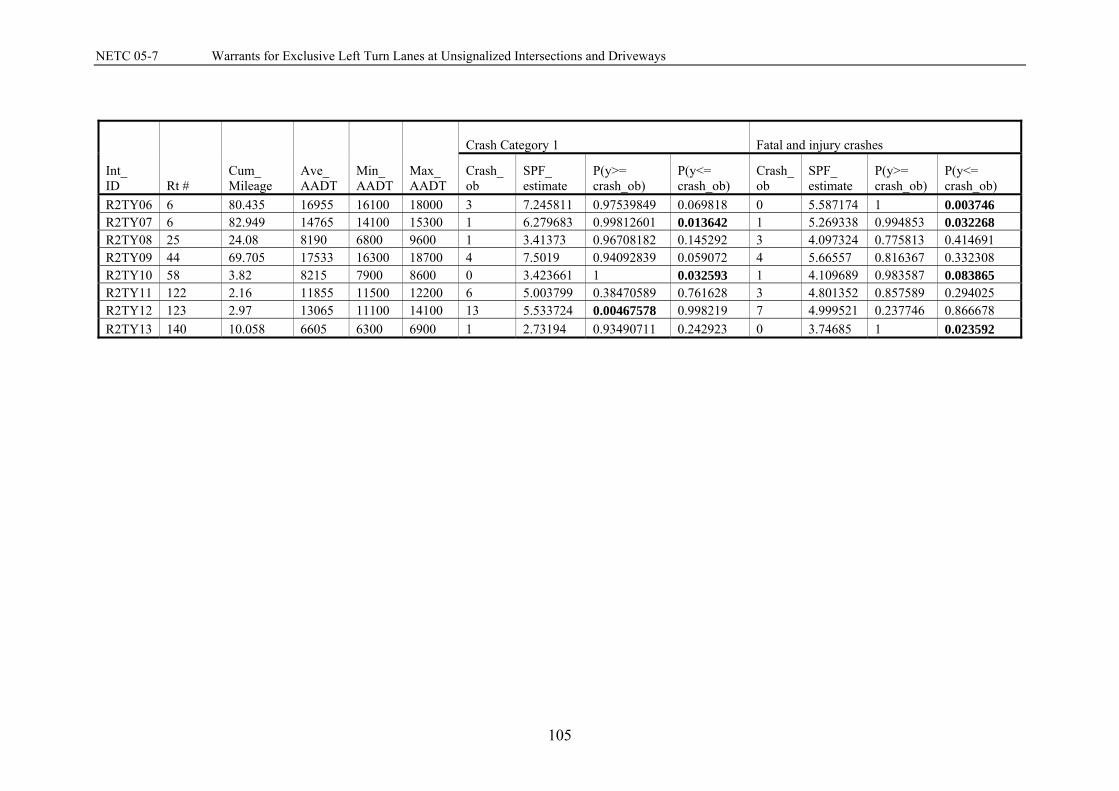
NETC 05-7 Warrants for Exclusive Left Turn Lanes at Unsignalized Intersections and Driveways
Int_ ID Rt #
Cum_ Mileage
Ave_ AADT
Min_ AADT
Max_ AADT
Crash Category 1 Fatal and injury crashes
Crash_ ob
SPF_ estimate
P(y>= crash_ob)
P(y<= crash_ob)
Crash_ ob
SPF_ estimate
P(y>= crash_ob)
P(y<= crash_ob)
R2TY06 6 80.435 16955 16100 18000 3 7.245811 0.97539849 0.069818 0 5.587174 1 0.003746 R2TY07 6 82.949 14765 14100 15300 1 6.279683 0.99812601 0.013642 1 5.269338 0.994853 0.032268 R2TY08 25 24.08 8190 6800 9600 1 3.41373 0.96708182 0.145292 3 4.097324 0.775813 0.414691 R2TY09 44 69.705 17533 16300 18700 4 7.5019 0.94092839 0.059072 4 5.66557 0.816367 0.332308 R2TY10 58 3.82 8215 7900 8600 0 3.423661 1 0.032593 1 4.109689 0.983587 0.083865 R2TY11 122 2.16 11855 11500 12200 6 5.003799 0.38470589 0.761628 3 4.801352 0.857589 0.294025 R2TY12 123 2.97 13065 11100 14100 13 5.533724 0.00467578 0.998219 7 4.999521 0.237746 0.866678 R2TY13 140 10.058 6605 6300 6900 1 2.73194 0.93490711 0.242923 0 3.74685 1 0.023592
105

NETC 05-7 Warrants for Exclusive Left Turn Lanes at Unsignalized Intersections and Driveways
Table D.2: SPF estimate for R2X intersections
Int_ ID
Rt #
Cum_ Mileage
Ave_ AADT
Min_ AADT
Max_ AADT
Crash Category 1 Fatal and injury crashes
Crash_ ob
SPF_ estimate
P(y>= crash_ob)
P(y<= crash_ob)
Crash_ ob
SPF_ estimate
P(y>= crash_ob)
P(y<= crash_ob)
R2XN01 4 20.75 4465 3700 5800 0 1.638753 1 0.194222 2 3.82977 0.895123 0.264122 R2XN02 6 31.49 4835 4500 5100 3 1.82246 0.2754 0.887656 11 4.014313 0.002916 0.999057 R2XN03 6 99.15 9135 8500 10200 2 4.414819 0.934498 0.183388 5 5.75503 0.680817 0.485784 R2XN04 6 101.97 7360 6800 8400 1 3.272315 0.962081 0.162 1 5.090179 0.993843 0.037497 R2XN05 31 7.869 9150 8900 9600 7 4.419977 0.158836 0.919858 7 5.763251 0.35573 0.775881 R2XN06 31 8.878 8180 7600 8800 4 3.784645 0.523369 0.670827 2 5.407356 0.971273 0.094275 R2XN07 44 19.503 4560 4200 4800 0 1.680712 1 0.186241 3 3.882581 0.744182 0.45674 R2XN08 44 29.93 14600 12800 15500 12 8.465497 0.14841 0.911153 6 7.508314 0.759472 0.377019 R2XN09 44 77.096 5365 5100 5500 9 2.105527 0.000344 0.999929 8 4.258329 0.068022 0.969911 R2XN10 44 80.749 10020 9500 10700 2 5.015227 0.960082 0.123375 4 6.067278 0.854699 0.276152 R2XN11 63 38.12 3005 2900 3300 3 0.941643 0.069886 0.984383 6 3.065217 0.090635 0.963096 R2XN12 66 13.687 10275 9200 11000 5 5.19489 0.593013 0.581806 4 6.153495 0.861977 0.265036 R2XN13 66 18.901 11230 10800 11700 9 5.875374 0.140165 0.924388 6 6.472532 0.626954 0.530854 R2XN14 66 21.348 9300 8800 10500 5 4.523586 0.472367 0.698896 3 5.815105 0.929255 0.168481 R2XN15 66 23.375 9300 8800 10500 6 4.523586 0.301104 0.828017 4 5.815105 0.831519 0.310567 R2XN16 66 25.585 14140 12800 16300 7 8.110406 0.699924 0.437659 8 7.368034 0.455952 0.680003 R2XN17 66 28.228 9845 9500 10000 10 4.89244 0.028093 0.988152 12 6.00783 0.020269 0.991084 R2XN18 66 32.068 11145 10200 11900 4 5.815583 0.831565 0.310499 6 6.443759 0.622731 0.535399 R2XN19 67 24.04 14090 12600 16200 13 8.0632 0.066887 0.96391 10 7.356204 0.20738 0.874282 R2XN20 67 30.51 5920 5400 6200 2 2.415343 0.694885 0.565705 7 4.5016 0.169154 0.913282 R2XN21 68 18.74 12320 11400 13100 0 6.685415 1 0.001249 5 6.819988 0.809944 0.324287 R2XN22 68 20.84 9055 8700 9600 7 4.356717 0.151042 0.924744 5 5.729044 0.677041 0.490121 R2XN23 68 21.92 9055 8700 9600 5 4.356717 0.440501 0.727193 11 5.729044 0.032416 0.985353 R2XN24 80 14.85 5270 4400 7100 3 2.077619 0.344322 0.842853 5 4.194143 0.409034 0.754099 R2XN25 80 20.31 3600 3200 3900 2 1.211301 0.341453 0.877027 5 3.394341 0.254767 0.871257 R2XN26 81 5.78 7820 6900 9000 4 3.560179 0.476295 0.714036 3 5.267807 0.896166 0.229425 R2XN27 81 10.29 5970 5300 7000 0 2.446867 1 0.086564 2 4.520489 0.939917 0.171287
106
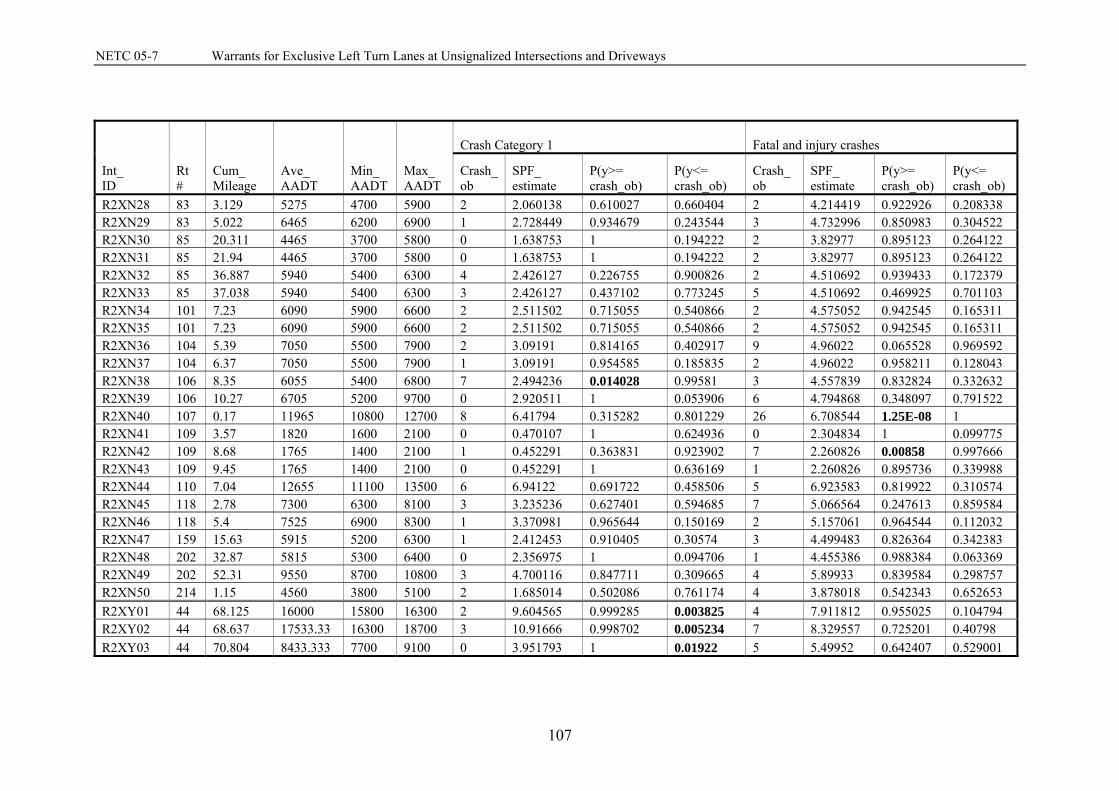
NETC 05-7 Warrants for Exclusive Left Turn Lanes at Unsignalized Intersections and Driveways
Int_ ID
Rt #
Cum_ Mileage
Ave_ AADT
Min_ AADT
Max_ AADT
Crash Category 1 Fatal and injury crashes
Crash_ ob
SPF_ estimate
P(y>= crash_ob)
P(y<= crash_ob)
Crash_ ob
SPF_ estimate
P(y>= crash_ob)
P(y<= crash_ob)
R2XN28 83 3.129 5275 4700 5900 2 2.060138 0.610027 0.660404 2 4.214419 0.922926 0.208338 R2XN29 83 5.022 6465 6200 6900 1 2.728449 0.934679 0.243544 3 4.732996 0.850983 0.304522 R2XN30 85 20.311 4465 3700 5800 0 1.638753 1 0.194222 2 3.82977 0.895123 0.264122 R2XN31 85 21.94 4465 3700 5800 0 1.638753 1 0.194222 2 3.82977 0.895123 0.264122 R2XN32 85 36.887 5940 5400 6300 4 2.426127 0.226755 0.900826 2 4.510692 0.939433 0.172379 R2XN33 85 37.038 5940 5400 6300 3 2.426127 0.437102 0.773245 5 4.510692 0.469925 0.701103 R2XN34 101 7.23 6090 5900 6600 2 2.511502 0.715055 0.540866 2 4.575052 0.942545 0.165311 R2XN35 101 7.23 6090 5900 6600 2 2.511502 0.715055 0.540866 2 4.575052 0.942545 0.165311 R2XN36 104 5.39 7050 5500 7900 2 3.09191 0.814165 0.402917 9 4.96022 0.065528 0.969592 R2XN37 104 6.37 7050 5500 7900 1 3.09191 0.954585 0.185835 2 4.96022 0.958211 0.128043 R2XN38 106 8.35 6055 5400 6800 7 2.494236 0.014028 0.99581 3 4.557839 0.832824 0.332632 R2XN39 106 10.27 6705 5200 9700 0 2.920511 1 0.053906 6 4.794868 0.348097 0.791522 R2XN40 107 0.17 11965 10800 12700 8 6.41794 0.315282 0.801229 26 6.708544 1.25E-08 1 R2XN41 109 3.57 1820 1600 2100 0 0.470107 1 0.624936 0 2.304834 1 0.099775 R2XN42 109 8.68 1765 1400 2100 1 0.452291 0.363831 0.923902 7 2.260826 0.00858 0.997666 R2XN43 109 9.45 1765 1400 2100 0 0.452291 1 0.636169 1 2.260826 0.895736 0.339988 R2XN44 110 7.04 12655 11100 13500 6 6.94122 0.691722 0.458506 5 6.923583 0.819922 0.310574 R2XN45 118 2.78 7300 6300 8100 3 3.235236 0.627401 0.594685 7 5.066564 0.247613 0.859584 R2XN46 118 5.4 7525 6900 8300 1 3.370981 0.965644 0.150169 2 5.157061 0.964544 0.112032 R2XN47 159 15.63 5915 5200 6300 1 2.412453 0.910405 0.30574 3 4.499483 0.826364 0.342383 R2XN48 202 32.87 5815 5300 6400 0 2.356975 1 0.094706 1 4.455386 0.988384 0.063369 R2XN49 202 52.31 9550 8700 10800 3 4.700116 0.847711 0.309665 4 5.89933 0.839584 0.298757 R2XN50 214 1.15 4560 3800 5100 2 1.685014 0.502086 0.761174 4 3.878018 0.542343 0.652653 R2XY01 44 68.125 16000 15800 16300 2 9.604565 0.999285 0.003825 4 7.911812 0.955025 0.104794 R2XY02 44 68.637 17533.33 16300 18700 3 10.91666 0.998702 0.005234 7 8.329557 0.725201 0.40798 R2XY03 44 70.804 8433.333 7700 9100 0 3.951793 1 0.01922 5 5.49952 0.642407 0.529001
107
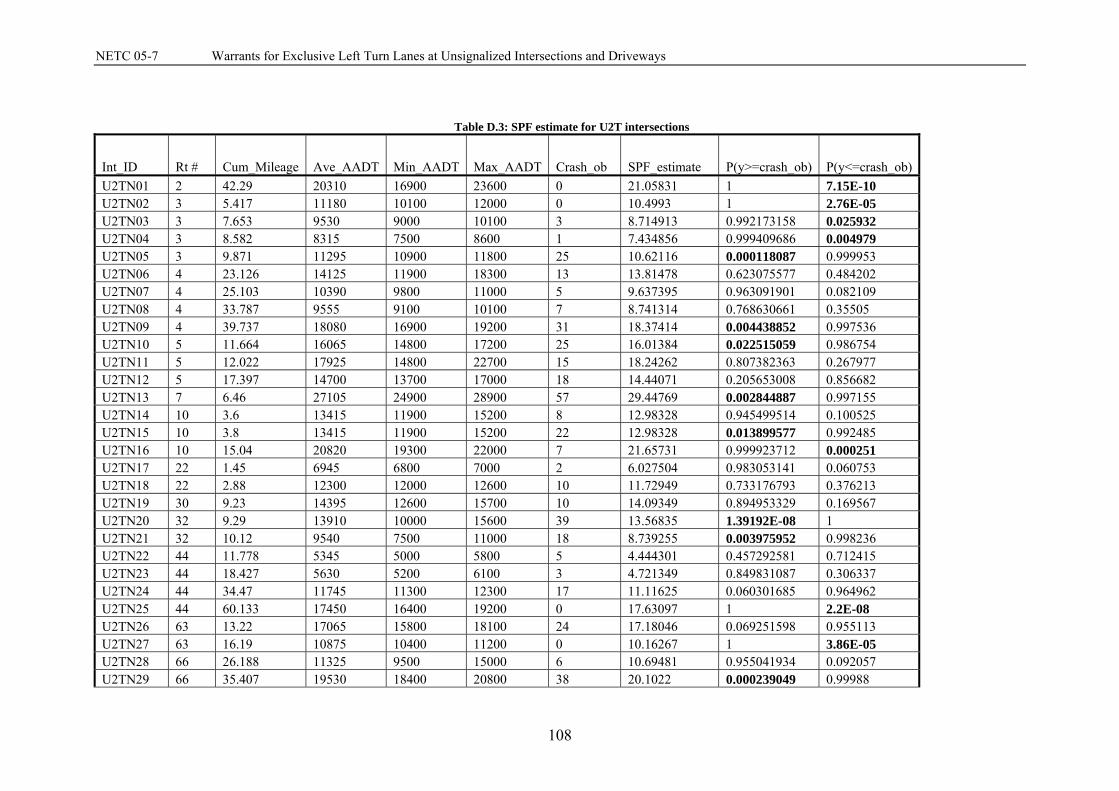
NETC 05-7 Warrants for Exclusive Left Turn Lanes at Unsignalized Intersections and Driveways
Table D.3: SPF estimate for U2T intersections
Int_ID Rt # Cum_Mileage Ave_AADT Min_AADT Max_AADT Crash_ob SPF_estimate P(y>=crash_ob) P(y<=crash_ob)U2TN01 2 42.29 20310 16900 23600 0 21.05831 1 7.15E-10 U2TN02 3 5.417 11180 10100 12000 0 10.4993 1 2.76E-05 U2TN03 3 7.653 9530 9000 10100 3 8.714913 0.992173158 0.025932 U2TN04 3 8.582 8315 7500 8600 1 7.434856 0.999409686 0.004979 U2TN05 3 9.871 11295 10900 11800 25 10.62116 0.000118087 0.999953 U2TN06 4 23.126 14125 11900 18300 13 13.81478 0.623075577 0.484202 U2TN07 4 25.103 10390 9800 11000 5 9.637395 0.963091901 0.082109 U2TN08 4 33.787 9555 9100 10100 7 8.741314 0.768630661 0.35505 U2TN09 4 39.737 18080 16900 19200 31 18.37414 0.004438852 0.997536 U2TN10 5 11.664 16065 14800 17200 25 16.01384 0.022515059 0.986754 U2TN11 5 12.022 17925 14800 22700 15 18.24262 0.807382363 0.267977 U2TN12 5 17.397 14700 13700 17000 18 14.44071 0.205653008 0.856682 U2TN13 7 6.46 27105 24900 28900 57 29.44769 0.002844887 0.997155 U2TN14 10 3.6 13415 11900 15200 8 12.98328 0.945499514 0.100525 U2TN15 10 3.8 13415 11900 15200 22 12.98328 0.013899577 0.992485 U2TN16 10 15.04 20820 19300 22000 7 21.65731 0.999923712 0.000251 U2TN17 22 1.45 6945 6800 7000 2 6.027504 0.983053141 0.060753 U2TN18 22 2.88 12300 12000 12600 10 11.72949 0.733176793 0.376213 U2TN19 30 9.23 14395 12600 15700 10 14.09349 0.894953329 0.169567 U2TN20 32 9.29 13910 10000 15600 39 13.56835 1.39192E-08 1 U2TN21 32 10.12 9540 7500 11000 18 8.739255 0.003975952 0.998236 U2TN22 44 11.778 5345 5000 5800 5 4.444301 0.457292581 0.712415 U2TN23 44 18.427 5630 5200 6100 3 4.721349 0.849831087 0.306337 U2TN24 44 34.47 11745 11300 12300 17 11.11625 0.060301685 0.964962 U2TN25 44 60.133 17450 16400 19200 0 17.63097 1 2.2E-08 U2TN26 63 13.22 17065 15800 18100 24 17.18046 0.069251598 0.955113 U2TN27 63 16.19 10875 10400 11200 0 10.16267 1 3.86E-05 U2TN28 66 26.188 11325 9500 15000 6 10.69481 0.955041934 0.092057 U2TN29 66 35.407 19530 18400 20800 38 20.1022 0.000239049 0.99988
108
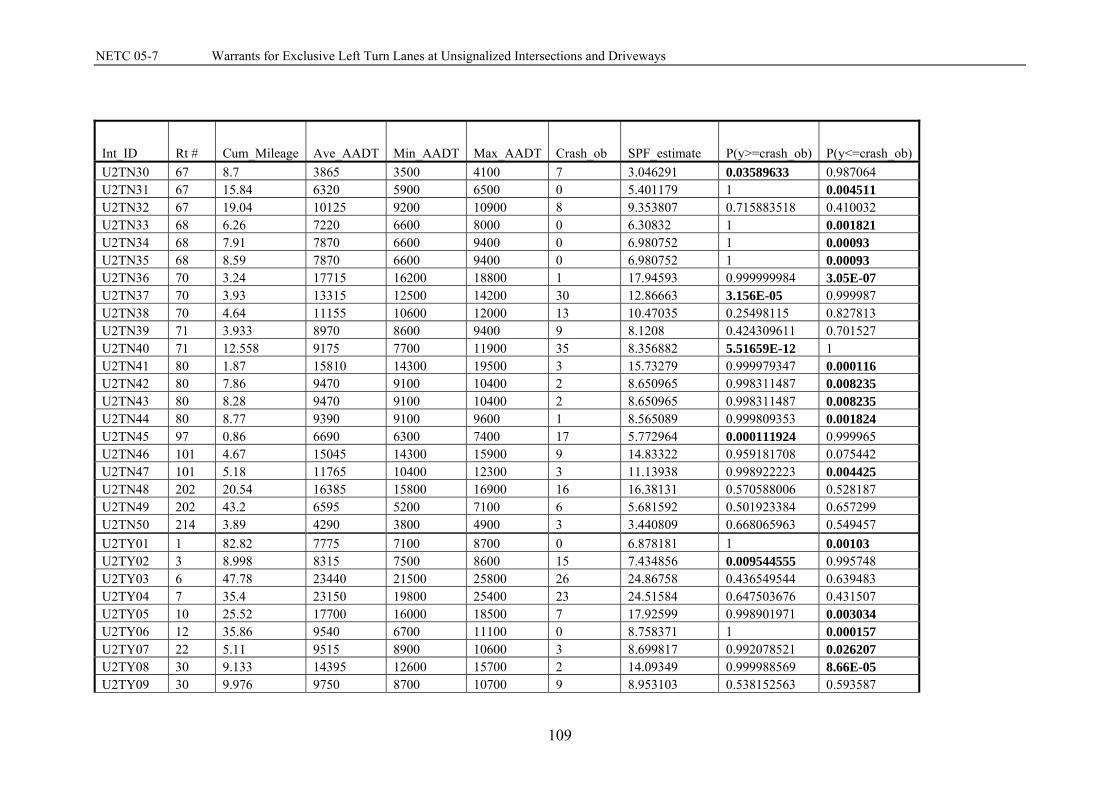
NETC 05-7 Warrants for Exclusive Left Turn Lanes at Unsignalized Intersections and Driveways
Int_ID Rt # Cum_Mileage Ave_AADT Min_AADT Max_AADT Crash_ob SPF_estimate P(y>=crash_ob) P(y<=crash_ob)U2TN30 67 8.7 3865 3500 4100 7 3.046291 0.03589633 0.987064 U2TN31 67 15.84 6320 5900 6500 0 5.401179 1 0.004511 U2TN32 67 19.04 10125 9200 10900 8 9.353807 0.715883518 0.410032 U2TN33 68 6.26 7220 6600 8000 0 6.30832 1 0.001821 U2TN34 68 7.91 7870 6600 9400 0 6.980752 1 0.00093 U2TN35 68 8.59 7870 6600 9400 0 6.980752 1 0.00093 U2TN36 70 3.24 17715 16200 18800 1 17.94593 0.999999984 3.05E-07 U2TN37 70 3.93 13315 12500 14200 30 12.86663 3.156E-05 0.999987 U2TN38 70 4.64 11155 10600 12000 13 10.47035 0.25498115 0.827813 U2TN39 71 3.933 8970 8600 9400 9 8.1208 0.424309611 0.701527 U2TN40 71 12.558 9175 7700 11900 35 8.356882 5.51659E-12 1 U2TN41 80 1.87 15810 14300 19500 3 15.73279 0.999979347 0.000116 U2TN42 80 7.86 9470 9100 10400 2 8.650965 0.998311487 0.008235 U2TN43 80 8.28 9470 9100 10400 2 8.650965 0.998311487 0.008235 U2TN44 80 8.77 9390 9100 9600 1 8.565089 0.999809353 0.001824 U2TN45 97 0.86 6690 6300 7400 17 5.772964 0.000111924 0.999965 U2TN46 101 4.67 15045 14300 15900 9 14.83322 0.959181708 0.075442 U2TN47 101 5.18 11765 10400 12300 3 11.13938 0.998922223 0.004425 U2TN48 202 20.54 16385 15800 16900 16 16.38131 0.570588006 0.528187 U2TN49 202 43.2 6595 5200 7100 6 5.681592 0.501923384 0.657299 U2TN50 214 3.89 4290 3800 4900 3 3.440809 0.668065963 0.549457 U2TY01 1 82.82 7775 7100 8700 0 6.878181 1 0.00103 U2TY02 3 8.998 8315 7500 8600 15 7.434856 0.009544555 0.995748 U2TY03 6 47.78 23440 21500 25800 26 24.86758 0.436549544 0.639483 U2TY04 7 35.4 23150 19800 25400 23 24.51584 0.647503676 0.431507 U2TY05 10 25.52 17700 16000 18500 7 17.92599 0.998901971 0.003034 U2TY06 12 35.86 9540 6700 11100 0 8.758371 1 0.000157 U2TY07 22 5.11 9515 8900 10600 3 8.699817 0.992078521 0.026207 U2TY08 30 9.133 14395 12600 15700 2 14.09349 0.999988569 8.66E-05 U2TY09 30 9.976 9750 8700 10700 9 8.953103 0.538152563 0.593587
109
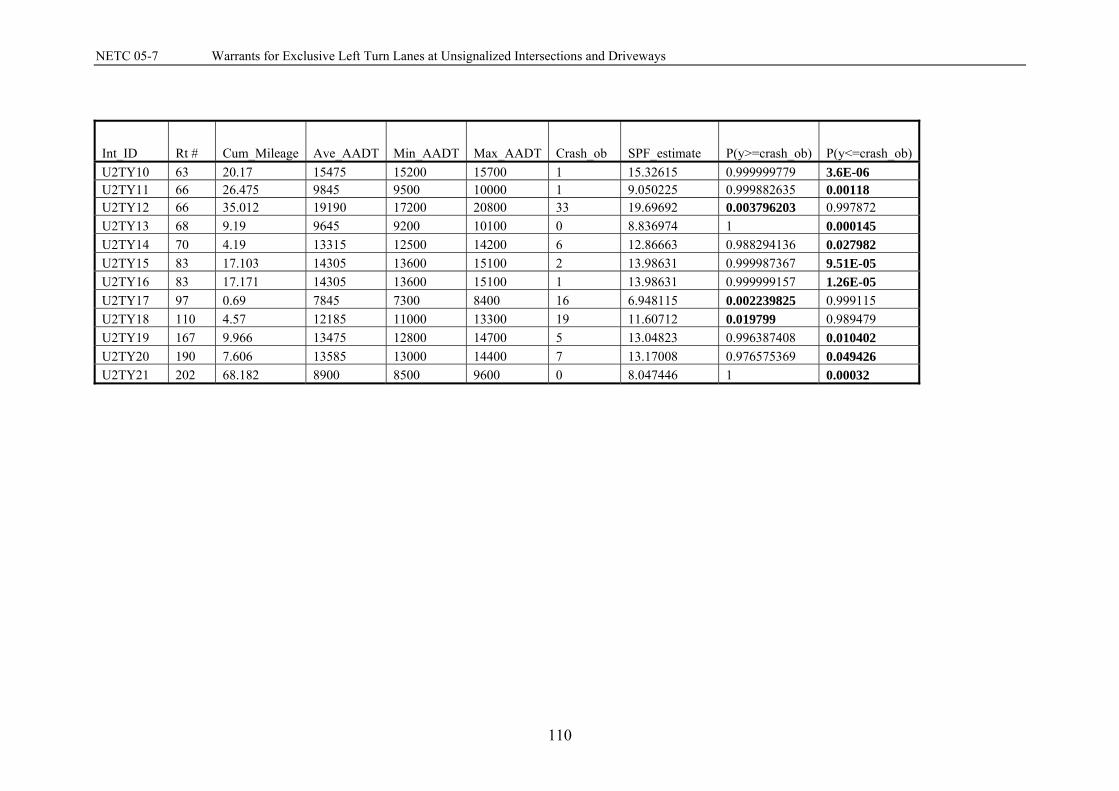
NETC 05-7 Warrants for Exclusive Left Turn Lanes at Unsignalized Intersections and Driveways
Int_ID Rt # Cum_Mileage Ave_AADT Min_AADT Max_AADT Crash_ob SPF_estimate P(y>=crash_ob) P(y<=crash_ob)U2TY10 63 20.17 15475 15200 15700 1 15.32615 0.999999779 3.6E-06 U2TY11 66 26.475 9845 9500 10000 1 9.050225 0.999882635 0.00118 U2TY12 66 35.012 19190 17200 20800 33 19.69692 0.003796203 0.997872 U2TY13 68 9.19 9645 9200 10100 0 8.836974 1 0.000145 U2TY14 70 4.19 13315 12500 14200 6 12.86663 0.988294136 0.027982 U2TY15 83 17.103 14305 13600 15100 2 13.98631 0.999987367 9.51E-05 U2TY16 83 17.171 14305 13600 15100 1 13.98631 0.999999157 1.26E-05 U2TY17 97 0.69 7845 7300 8400 16 6.948115 0.002239825 0.999115 U2TY18 110 4.57 12185 11000 13300 19 11.60712 0.019799 0.989479 U2TY19 167 9.966 13475 12800 14700 5 13.04823 0.996387408 0.010402 U2TY20 190 7.606 13585 13000 14400 7 13.17008 0.976575369 0.049426 U2TY21 202 68.182 8900 8500 9600 0 8.047446 1 0.00032
110
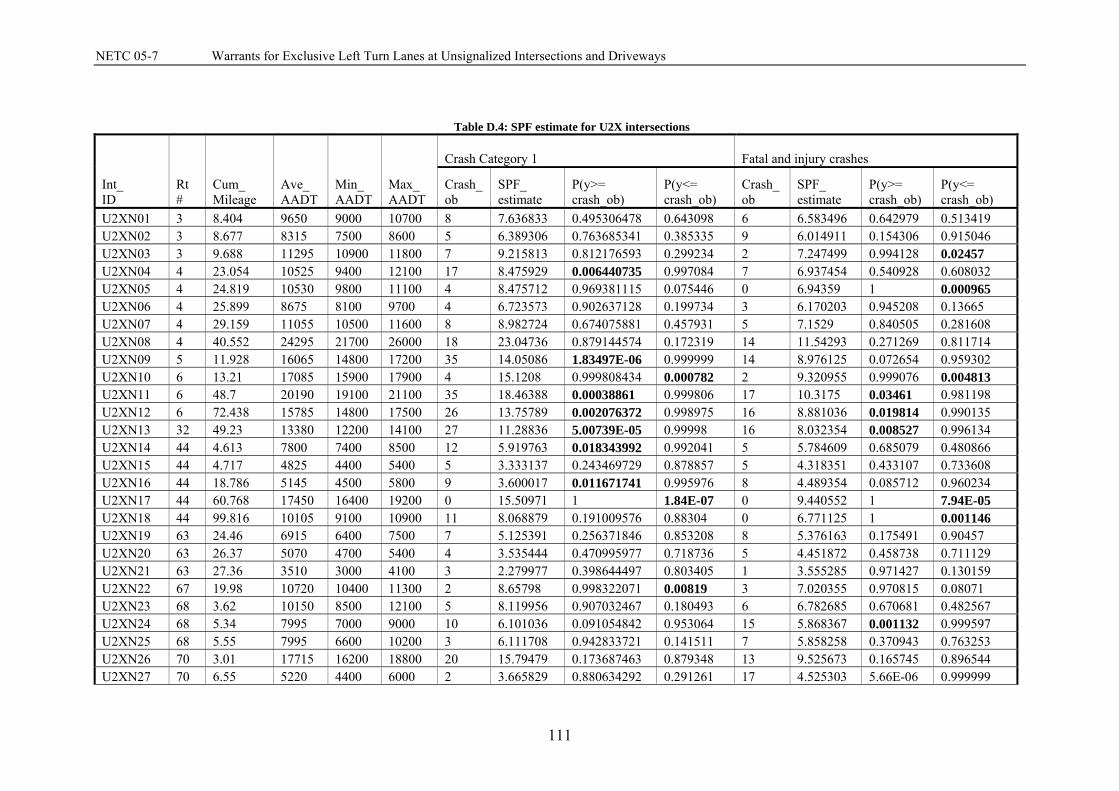
NETC 05-7 Warrants for Exclusive Left Turn Lanes at Unsignalized Intersections and Driveways
Table D.4: SPF estimate for U2X intersections
Int_ ID
Rt #
Cum_ Mileage
Ave_ AADT
Min_ AADT
Max_ AADT
Crash Category 1 Fatal and injury crashes
Crash_ ob
SPF_ estimate
P(y>= crash_ob)
P(y<= crash_ob)
Crash_ ob
SPF_ estimate
P(y>= crash_ob)
P(y<= crash_ob)
U2XN01 3 8.404 9650 9000 10700 8 7.636833 0.495306478 0.643098 6 6.583496 0.642979 0.513419 U2XN02 3 8.677 8315 7500 8600 5 6.389306 0.763685341 0.385335 9 6.014911 0.154306 0.915046 U2XN03 3 9.688 11295 10900 11800 7 9.215813 0.812176593 0.299234 2 7.247499 0.994128 0.02457 U2XN04 4 23.054 10525 9400 12100 17 8.475929 0.006440735 0.997084 7 6.937454 0.540928 0.608032 U2XN05 4 24.819 10530 9800 11100 4 8.475712 0.969381115 0.075446 0 6.94359 1 0.000965 U2XN06 4 25.899 8675 8100 9700 4 6.723573 0.902637128 0.199734 3 6.170203 0.945208 0.13665 U2XN07 4 29.159 11055 10500 11600 8 8.982724 0.674075881 0.457931 5 7.1529 0.840505 0.281608 U2XN08 4 40.552 24295 21700 26000 18 23.04736 0.879144574 0.172319 14 11.54293 0.271269 0.811714 U2XN09 5 11.928 16065 14800 17200 35 14.05086 1.83497E-06 0.999999 14 8.976125 0.072654 0.959302 U2XN10 6 13.21 17085 15900 17900 4 15.1208 0.999808434 0.000782 2 9.320955 0.999076 0.004813 U2XN11 6 48.7 20190 19100 21100 35 18.46388 0.00038861 0.999806 17 10.3175 0.03461 0.981198 U2XN12 6 72.438 15785 14800 17500 26 13.75789 0.002076372 0.998975 16 8.881036 0.019814 0.990135 U2XN13 32 49.23 13380 12200 14100 27 11.28836 5.00739E-05 0.99998 16 8.032354 0.008527 0.996134 U2XN14 44 4.613 7800 7400 8500 12 5.919763 0.018343992 0.992041 5 5.784609 0.685079 0.480866 U2XN15 44 4.717 4825 4400 5400 5 3.333137 0.243469729 0.878857 5 4.318351 0.433107 0.733608 U2XN16 44 18.786 5145 4500 5800 9 3.600017 0.011671741 0.995976 8 4.489354 0.085712 0.960234 U2XN17 44 60.768 17450 16400 19200 0 15.50971 1 1.84E-07 0 9.440552 1 7.94E-05 U2XN18 44 99.816 10105 9100 10900 11 8.068879 0.191009576 0.88304 0 6.771125 1 0.001146 U2XN19 63 24.46 6915 6400 7500 7 5.125391 0.256371846 0.853208 8 5.376163 0.175491 0.90457 U2XN20 63 26.37 5070 4700 5400 4 3.535444 0.470995977 0.718736 5 4.451872 0.458738 0.711129 U2XN21 63 27.36 3510 3000 4100 3 2.279977 0.398644497 0.803405 1 3.555285 0.971427 0.130159 U2XN22 67 19.98 10720 10400 11300 2 8.65798 0.998322071 0.00819 3 7.020355 0.970815 0.08071 U2XN23 68 3.62 10150 8500 12100 5 8.119956 0.907032467 0.180493 6 6.782685 0.670681 0.482567 U2XN24 68 5.34 7995 7000 9000 10 6.101036 0.091054842 0.953064 15 5.868367 0.001132 0.999597 U2XN25 68 5.55 7995 6600 10200 3 6.111708 0.942833721 0.141511 7 5.858258 0.370943 0.763253 U2XN26 70 3.01 17715 16200 18800 20 15.79479 0.173687463 0.879348 13 9.525673 0.165745 0.896544 U2XN27 70 6.55 5220 4400 6000 2 3.665829 0.880634292 0.291261 17 4.525303 5.66E-06 0.999999
111

NETC 05-7 Warrants for Exclusive Left Turn Lanes at Unsignalized Intersections and Driveways
Int_ ID
Rt #
Cum_ Mileage
Ave_ AADT
Min_ AADT
Max_ AADT
Crash Category 1 Fatal and injury crashes
Crash_ ob
SPF_ estimate
P(y>= crash_ob)
P(y<= crash_ob)
Crash_ ob
SPF_ estimate
P(y>= crash_ob)
P(y<= crash_ob)
U2XN28 70 9.94 8855 7800 10100 5 6.89421 0.817136974 0.314423 4 6.244594 0.869324 0.253649 U2XN29 71 4.092 8970 8600 9400 10 6.995368 0.169034677 0.901808 11 6.299344 0.056247 0.972285 U2XN30 71 11.548 9760 7300 12800 7 7.760893 0.656558808 0.486805 9 6.611576 0.221851 0.867605 U2XN31 71 15.111 8715 7600 9500 4 6.762968 0.90501034 0.195733 4 6.185268 0.864579 0.261023 U2XN32 71 16.161 11390 10900 11900 4 9.309701 0.982966907 0.045372 2 7.283649 0.994312 0.023903 U2XN33 74 1.37 5265 4600 6500 2 3.704438 0.884204698 0.284683 3 4.548178 0.831769 0.334233 U2XN34 74 5.151 7510 6400 7900 0 5.65783 1 0.00349 0 5.652378 1 0.003509 U2XN35 74 6.081 9860 9200 10300 12 7.833895 0.10030782 0.943867 8 6.672106 0.352557 0.770732 U2XN36 79 1.56 8835 8400 9300 1 6.869836 0.998961353 0.008174 2 6.241302 0.985899 0.052029 U2XN37 79 9.87 7575 6900 8300 2 5.716388 0.977892483 0.075887 3 5.682212 0.922254 0.181893 U2XN38 80 7.14 14835 13600 16000 13 12.77489 0.511945852 0.597777 17 8.550903 0.006989 0.996809 U2XN39 80 19.09 3600 3200 3900 4 2.34828 0.210538977 0.910505 12 3.613239 0.000382 0.999896 U2XN40 83 24.435 2990 2500 3200 5 1.880906 0.042547026 0.987361 5 3.226828 0.224181 0.891511 U2XN41 85 11.998 4380 3400 4900 0 2.970505 1 0.051277 0 4.069054 1 0.017094 U2XN42 94 1.629 16385 13700 24700 8 14.46582 0.975598809 0.049221 9 9.036232 0.549111 0.582635 U2XN43 94 4.389 6155 5700 6800 1 4.459208 0.988428473 0.063171 6 5.008433 0.385519 0.760949 U2XN44 99 2.01 8690 7500 10100 3 6.747276 0.964178838 0.095929 6 6.167535 0.580841 0.579413 U2XN45 113 2.83 1710 1600 1900 0 0.963481 1 0.381562 0 2.298345 1 0.100425 U2XN46 113 2.94 4610 4200 5100 0 3.156505 1 0.042574 1 4.199932 0.985003 0.077981 U2XN47 123 4.5 11560 10100 12600 3 9.478715 0.995763864 0.015089 2 7.347545 0.994623 0.022766 U2XN48 202 27.35 5015 4500 5400 11 3.490027 0.000996711 0.999718 4 4.421896 0.644355 0.54699 U2XN49 202 40.16 8990 8700 9700 3 7.014212 0.970679733 0.081028 5 6.307722 0.754026 0.3976 U2XN50 202 42.3 6835 6400 7100 4 5.053605 0.742418332 0.431138 3 5.339243 0.901164 0.22059 U2XY01 2 41.044 12365 10100 14800 5 10.29149 0.975803309 0.056831 5 7.641175 0.877898 0.226358 U2XY02 3 8.952 8467 8300 8600 7 6.527918 0.47786824 0.668671 18 6.08241 6.74E-05 0.999947 U2XY03 66 36.537 14183 12900 15400 5 12.10604 0.992943077 0.019031 9 8.320787 0.452136 0.67611 U2XY04 101 5.11 11765 10400 12300 16 9.678209 0.038447 0.979291 8 7.428024 0.464794 0.671827
112
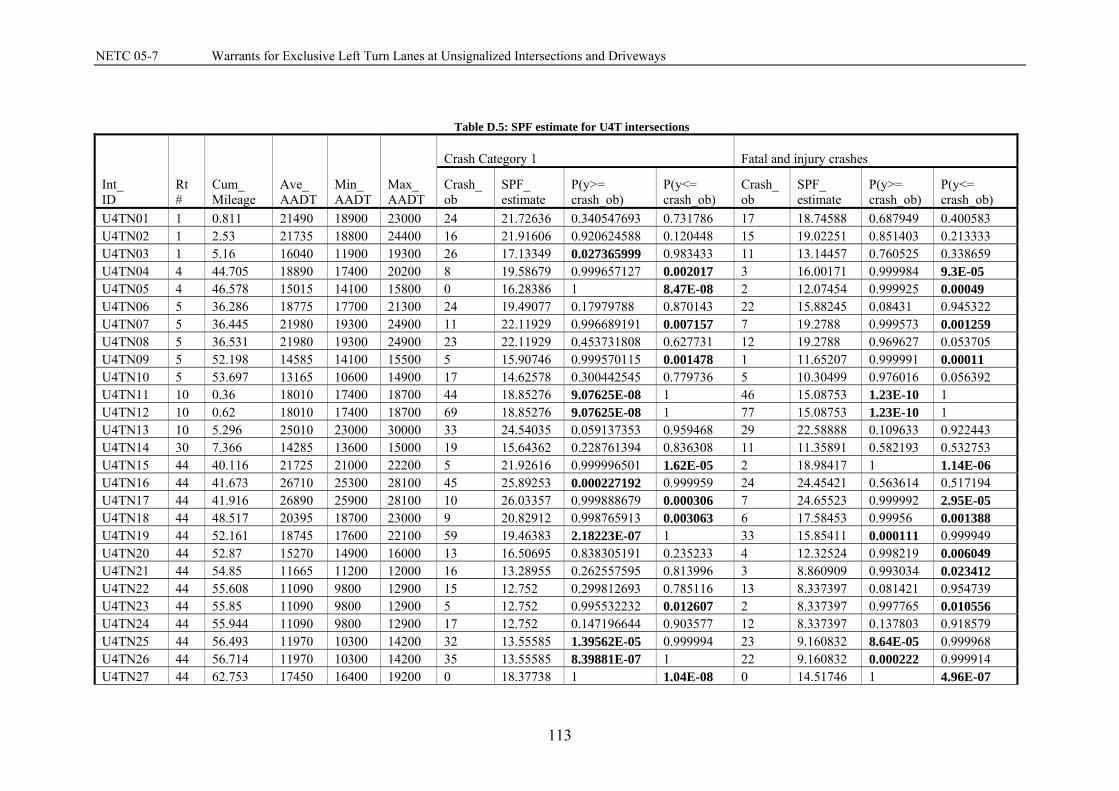
NETC 05-7 Warrants for Exclusive Left Turn Lanes at Unsignalized Intersections and Driveways
Table D.5: SPF estimate for U4T intersections
Int_ ID
Rt #
Cum_ Mileage
Ave_ AADT
Min_ AADT
Max_ AADT
Crash Category 1 Fatal and injury crashes
Crash_ ob
SPF_ estimate
P(y>= crash_ob)
P(y<= crash_ob)
Crash_ ob
SPF_ estimate
P(y>= crash_ob)
P(y<= crash_ob)
U4TN01 1 0.811 21490 18900 23000 24 21.72636 0.340547693 0.731786 17 18.74588 0.687949 0.400583 U4TN02 1 2.53 21735 18800 24400 16 21.91606 0.920624588 0.120448 15 19.02251 0.851403 0.213333 U4TN03 1 5.16 16040 11900 19300 26 17.13349 0.027365999 0.983433 11 13.14457 0.760525 0.338659 U4TN04 4 44.705 18890 17400 20200 8 19.58679 0.999657127 0.002017 3 16.00171 0.999984 9.3E-05 U4TN05 4 46.578 15015 14100 15800 0 16.28386 1 8.47E-08 2 12.07454 0.999925 0.00049 U4TN06 5 36.286 18775 17700 21300 24 19.49077 0.17979788 0.870143 22 15.88245 0.08431 0.945322 U4TN07 5 36.445 21980 19300 24900 11 22.11929 0.996689191 0.007157 7 19.2788 0.999573 0.001259 U4TN08 5 36.531 21980 19300 24900 23 22.11929 0.453731808 0.627731 12 19.2788 0.969627 0.053705 U4TN09 5 52.198 14585 14100 15500 5 15.90746 0.999570115 0.001478 1 11.65207 0.999991 0.00011 U4TN10 5 53.697 13165 10600 14900 17 14.62578 0.300442545 0.779736 5 10.30499 0.976016 0.056392 U4TN11 10 0.36 18010 17400 18700 44 18.85276 9.07625E-08 1 46 15.08753 1.23E-10 1 U4TN12 10 0.62 18010 17400 18700 69 18.85276 9.07625E-08 1 77 15.08753 1.23E-10 1 U4TN13 10 5.296 25010 23000 30000 33 24.54035 0.059137353 0.959468 29 22.58888 0.109633 0.922443 U4TN14 30 7.366 14285 13600 15000 19 15.64362 0.228761394 0.836308 11 11.35891 0.582193 0.532753 U4TN15 44 40.116 21725 21000 22200 5 21.92616 0.999996501 1.62E-05 2 18.98417 1 1.14E-06 U4TN16 44 41.673 26710 25300 28100 45 25.89253 0.000227192 0.999959 24 24.45421 0.563614 0.517194 U4TN17 44 41.916 26890 25900 28100 10 26.03357 0.999888679 0.000306 7 24.65523 0.999992 2.95E-05 U4TN18 44 48.517 20395 18700 23000 9 20.82912 0.998765913 0.003063 6 17.58453 0.99956 0.001388 U4TN19 44 52.161 18745 17600 22100 59 19.46383 2.18223E-07 1 33 15.85411 0.000111 0.999949 U4TN20 44 52.87 15270 14900 16000 13 16.50695 0.838305191 0.235233 4 12.32524 0.998219 0.006049 U4TN21 44 54.85 11665 11200 12000 16 13.28955 0.262557595 0.813996 3 8.860909 0.993034 0.023412 U4TN22 44 55.608 11090 9800 12900 15 12.752 0.299812693 0.785116 13 8.337397 0.081421 0.954739 U4TN23 44 55.85 11090 9800 12900 5 12.752 0.995532232 0.012607 2 8.337397 0.997765 0.010556 U4TN24 44 55.944 11090 9800 12900 17 12.752 0.147196644 0.903577 12 8.337397 0.137803 0.918579 U4TN25 44 56.493 11970 10300 14200 32 13.55585 1.39562E-05 0.999994 23 9.160832 8.64E-05 0.999968 U4TN26 44 56.714 11970 10300 14200 35 13.55585 8.39881E-07 1 22 9.160832 0.000222 0.999914 U4TN27 44 62.753 17450 16400 19200 0 18.37738 1 1.04E-08 0 14.51746 1 4.96E-07
113
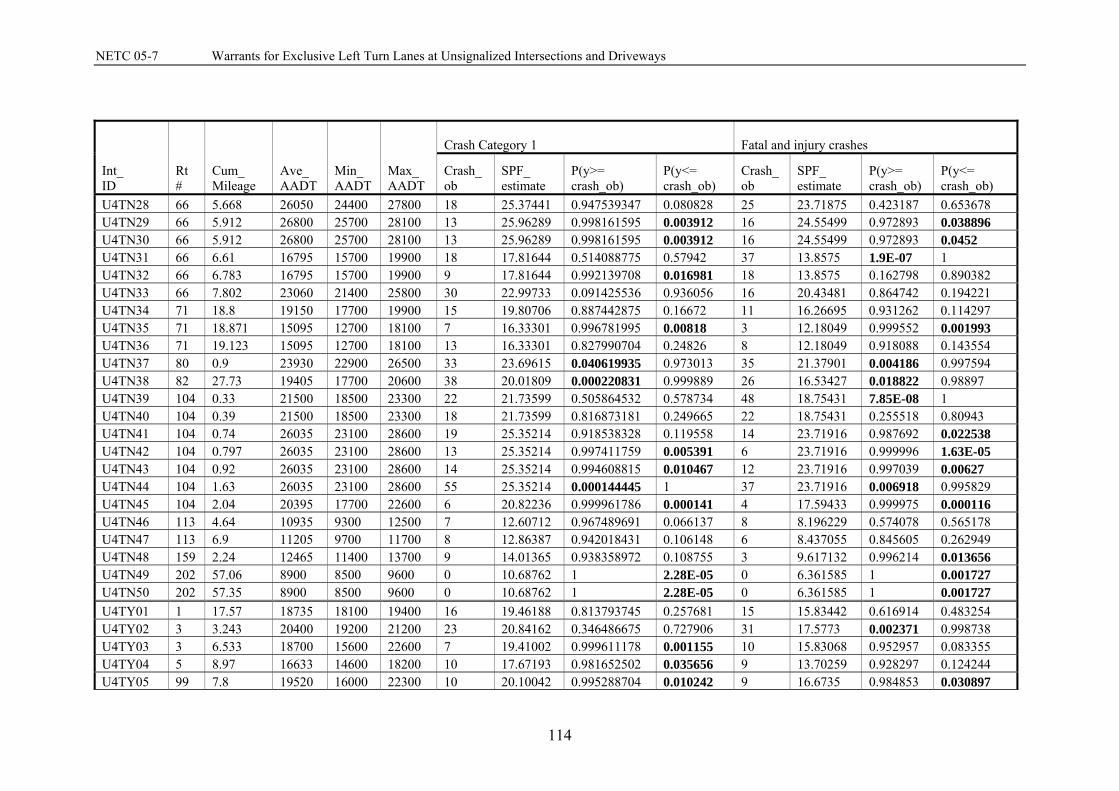
NETC 05-7 Warrants for Exclusive Left Turn Lanes at Unsignalized Intersections and Driveways
Int_ ID
Rt #
Cum_ Mileage
Ave_ AADT
Min_ AADT
Max_ AADT
Crash Category 1 Fatal and injury crashes
Crash_ ob
SPF_ estimate
P(y>= crash_ob)
P(y<= crash_ob)
Crash_ ob
SPF_ estimate
P(y>= crash_ob)
P(y<= crash_ob)
U4TN28 66 5.668 26050 24400 27800 18 25.37441 0.947539347 0.080828 25 23.71875 0.423187 0.653678 U4TN29 66 5.912 26800 25700 28100 13 25.96289 0.998161595 0.003912 16 24.55499 0.972893 0.038896 U4TN30 66 5.912 26800 25700 28100 13 25.96289 0.998161595 0.003912 16 24.55499 0.972893 0.0452 U4TN31 66 6.61 16795 15700 19900 18 17.81644 0.514088775 0.57942 37 13.8575 1.9E-07 1 U4TN32 66 6.783 16795 15700 19900 9 17.81644 0.992139708 0.016981 18 13.8575 0.162798 0.890382 U4TN33 66 7.802 23060 21400 25800 30 22.99733 0.091425536 0.936056 16 20.43481 0.864742 0.194221 U4TN34 71 18.8 19150 17700 19900 15 19.80706 0.887442875 0.16672 11 16.26695 0.931262 0.114297 U4TN35 71 18.871 15095 12700 18100 7 16.33301 0.996781995 0.00818 3 12.18049 0.999552 0.001993 U4TN36 71 19.123 15095 12700 18100 13 16.33301 0.827990704 0.24826 8 12.18049 0.918088 0.143554 U4TN37 80 0.9 23930 22900 26500 33 23.69615 0.040619935 0.973013 35 21.37901 0.004186 0.997594 U4TN38 82 27.73 19405 17700 20600 38 20.01809 0.000220831 0.999889 26 16.53427 0.018822 0.98897 U4TN39 104 0.33 21500 18500 23300 22 21.73599 0.505864532 0.578734 48 18.75431 7.85E-08 1 U4TN40 104 0.39 21500 18500 23300 18 21.73599 0.816873181 0.249665 22 18.75431 0.255518 0.80943 U4TN41 104 0.74 26035 23100 28600 19 25.35214 0.918538328 0.119558 14 23.71916 0.987692 0.022538 U4TN42 104 0.797 26035 23100 28600 13 25.35214 0.997411759 0.005391 6 23.71916 0.999996 1.63E-05 U4TN43 104 0.92 26035 23100 28600 14 25.35214 0.994608815 0.010467 12 23.71916 0.997039 0.00627 U4TN44 104 1.63 26035 23100 28600 55 25.35214 0.000144445 1 37 23.71916 0.006918 0.995829 U4TN45 104 2.04 20395 17700 22600 6 20.82236 0.999961786 0.000141 4 17.59433 0.999975 0.000116 U4TN46 113 4.64 10935 9300 12500 7 12.60712 0.967489691 0.066137 8 8.196229 0.574078 0.565178 U4TN47 113 6.9 11205 9700 11700 8 12.86387 0.942018431 0.106148 6 8.437055 0.845605 0.262949 U4TN48 159 2.24 12465 11400 13700 9 14.01365 0.938358972 0.108755 3 9.617132 0.996214 0.013656 U4TN49 202 57.06 8900 8500 9600 0 10.68762 1 2.28E-05 0 6.361585 1 0.001727 U4TN50 202 57.35 8900 8500 9600 0 10.68762 1 2.28E-05 0 6.361585 1 0.001727 U4TY01 1 17.57 18735 18100 19400 16 19.46188 0.813793745 0.257681 15 15.83442 0.616914 0.483254 U4TY02 3 3.243 20400 19200 21200 23 20.84162 0.346486675 0.727906 31 17.5773 0.002371 0.998738 U4TY03 3 6.533 18700 15600 22600 7 19.41002 0.999611178 0.001155 10 15.83068 0.952957 0.083355 U4TY04 5 8.97 16633 14600 18200 10 17.67193 0.981652502 0.035656 9 13.70259 0.928297 0.124244 U4TY05 99 7.8 19520 16000 22300 10 20.10042 0.995288704 0.010242 9 16.6735 0.984853 0.030897
114
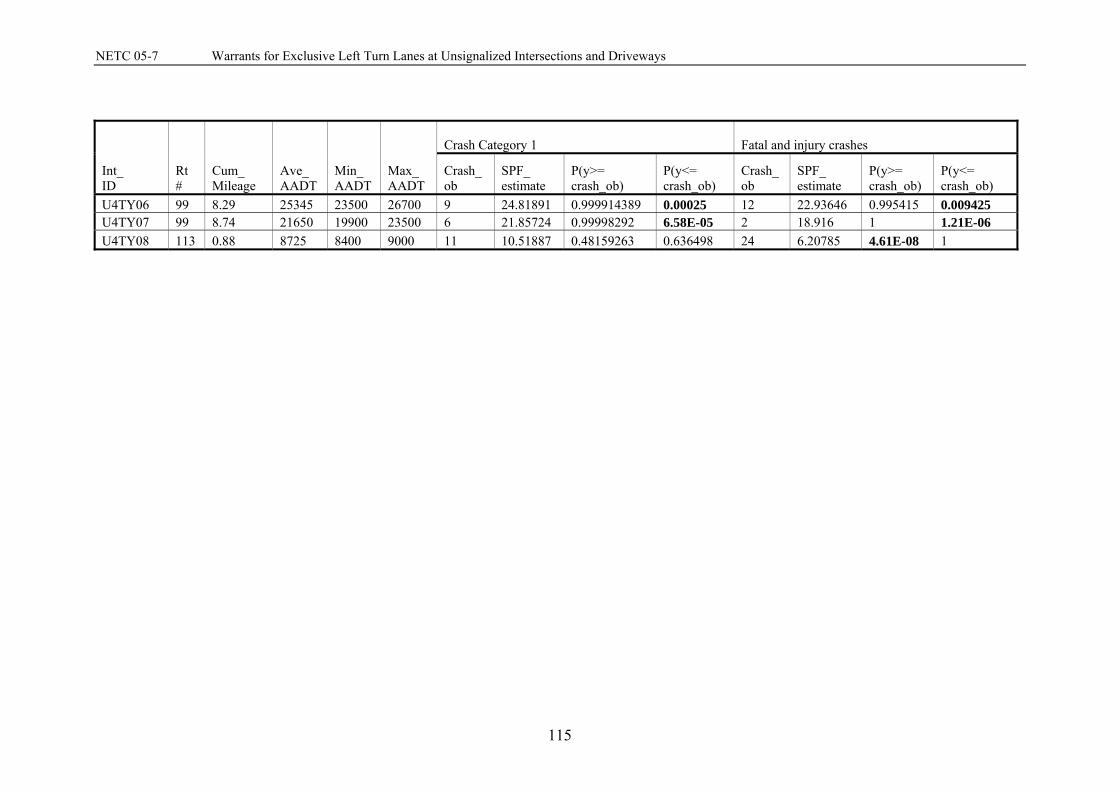
NETC 05-7 Warrants for Exclusive Left Turn Lanes at Unsignalized Intersections and Driveways
Int_ ID
Rt #
Cum_ Mileage
Ave_ AADT
Min_ AADT
Max_ AADT
Crash Category 1 Fatal and injury crashes
Crash_ ob
SPF_ estimate
P(y>= crash_ob)
P(y<= crash_ob)
Crash_ ob
SPF_ estimate
P(y>= crash_ob)
P(y<= crash_ob)
U4TY06 99 8.29 25345 23500 26700 9 24.81891 0.999914389 0.00025 12 22.93646 0.995415 0.009425 U4TY07 99 8.74 21650 19900 23500 6 21.85724 0.99998292 6.58E-05 2 18.916 1 1.21E-06 U4TY08 113 0.88 8725 8400 9000 11 10.51887 0.48159263 0.636498 24 6.20785 4.61E-08 1
115

NETC 05-7 Warrants for Exclusive Left Turn Lanes at Unsignalized Intersections and Driveways
Table D.6: SPF estimate for U4X intersections
Int_ ID
Rt #
Cum_ Mileage
Ave_ AADT
Min_ AADT
Max_ AADT
Crash Category 1 Fatal and injury crashes
Crash_ ob
SPF_ estimate
P(y>= crash_ob)
P(y<= crash_ob)
Crash_ ob
SPF_ estimate
P(y>= crash_ob)
P(y<= crash_ob)
U4XN01 4 46.665 15015 14100 15800 11 15.44394 0.901567352 0.157042 12 14.14773 0.752224 0.344075 U4XN02 5 17.285 14700 13700 17000 72 15.02357 2.44308E-08 1 55 13.86575 8.27E-12 1 U4XN03 5 36.114 18775 17700 21300 40 20.77412 0.000116013 1 25 17.48084 0.05265 0.966474 U4XN04 5 36.378 18775 17700 21300 13 20.77412 0.972689925 0.047795 11 17.48084 0.960896 0.068971 U4XN05 5 52.237 14525 13900 15500 2 14.78024 0.999993986 4.76E-05 1 13.71013 0.999999 1.63E-05 U4XN06 5 52.275 14585 14100 15500 2 14.8605 0.999994422 4.44E-05 1 13.76383 0.999999 1.55E-05 U4XN07 5 53.527 13285 10600 14900 12 13.18163 0.665005907 0.443283 11 12.59368 0.711801 0.395637 U4XN08 6 73.33 9740 9400 10300 17 8.704154 0.008225401 0.996181 15 9.390967 0.055544 0.969328 U4XN09 6 73.77 9360 8400 9800 3 8.260495 0.988785345 0.035502 6 9.043253 0.886911 0.202869 U4XN10 6 74.6 9610 8900 11100 2 8.561284 0.998170224 0.008843 7 9.270897 0.816793 0.293138 U4XN11 44 40.565 28250 26800 29400 11 35.6746 0.999999595 1.36E-06 4 25.73943 1 1.42E-07 U4XN12 44 41.852 26890 25900 28100 31 33.41382 0.685204961 0.380146 19 24.56491 0.893367 0.152604 U4XN13 44 49.757 17075 15300 18700 6 18.33583 0.999747502 0.000827 4 15.97673 0.999905 0.000408 U4XN14 44 49.831 16835 15300 18600 5 17.98848 0.999915053 0.000327 5 15.76471 0.999521 0.001635 U4XN15 44 49.977 16835 15300 18600 5 17.98848 0.999915053 0.000327 8 15.76471 0.988493 0.024979 U4XN16 44 50.034 16595 15300 18600 10 17.64878 0.981424472 0.036059 11 15.55192 0.90599 0.150811 U4XN17 44 51.77 18745 17600 22100 21 20.73579 0.505982851 0.580584 21 17.45385 0.22712 0.834718 U4XN18 44 51.82 18745 17600 22100 31 20.73579 0.020841678 0.987063 24 17.45385 0.078991 0.948084 U4XN19 44 52.238 18745 17600 22100 102 20.73579 5.53073E-05 1 92 17.45385 1.01E-08 1 U4XN20 44 55.994 11090 9800 12900 10 10.35291 0.585373513 0.538978 10 10.61722 0.616549 0.506292 U4XN21 44 56.031 11970 10300 14200 11 11.46607 0.594430498 0.523807 11 11.41203 0.588279 0.530204 U4XN22 44 58.166 13195 12900 14000 20 13.01232 0.043004249 0.97477 14 12.51872 0.374203 0.723211 U4XN23 44 63.071 17450 16400 19200 0 18.84911 1 6.52E-09 0 16.31102 1 8.25E-08 U4XN24 44 63.905 17450 16400 19200 0 18.84911 1 6.52E-09 0 16.31102 1 8.25E-08 U4XN25 66 6.289 21690 20200 22900 12 25.14324 0.998698198 0.002906 18 20.04136 0.706103 0.377939 U4XN26 80 0.857 23930 22900 26500 14 28.64495 0.999106949 0.001935 12 21.99546 0.992352 0.01515 U4XN27 80 0.91 23930 22900 26500 31 28.64495 0.354242654 0.710789 36 21.99546 0.003743 0.997845
116

NETC 05-7 Warrants for Exclusive Left Turn Lanes at Unsignalized Intersections and Driveways
117
Int_ ID
Rt #
Cum_ Mileage
Ave_ AADT
Min_ AADT
Max_ AADT
Crash Category 1 Fatal and injury crashes
Crash_ ob
SPF_ estimate
P(y>= crash_ob)
P(y<= crash_ob)
Crash_ ob
SPF_ estimate
P(y>= crash_ob)
P(y<= crash_ob)
U4XN28 80 1 23930 22900 26500 14 28.64495 0.999106949 0.001935 17 21.99546 0.882778 0.169232 U4XN29 100 0.15 11190 10400 12000 9 10.46689 0.717233248 0.401039 22 10.70903 0.001635 0.999262 U4XN30 104 0.58 14660 14300 14900 20 14.9584 0.122475047 0.918756 17 13.8312 0.229652 0.839013 U4XN31 187 1.777 13325 12100 16000 15 13.20867 0.34632993 0.744857 17 12.63257 0.139236 0.909521 U4XN32 187 1.816 13325 12100 16000 2 13.20867 0.999973932 0.000186 1 12.63257 0.999997 4.45E-05 U4XN33 187 1.872 18925 18400 19400 42 20.97962 7.07433E-05 1 25 17.61448 0.056397 0.963844 U4XN34 187 2.572 10435 9200 13200 26 9.558543 8.29604E-06 0.999997 19 10.02159 0.007341 0.996464 U4XN35 349 1.871 13960 12900 15200 3 14.02994 0.999908446 0.000463 4 13.20392 0.999106 0.003229 U4XN36 401 1.8 16005 14800 17000 11 16.81244 0.946391975 0.09156 5 15.02891 0.999162 0.002737 U4XN37 401 1.862 16005 14800 17000 3 16.81244 0.999992052 4.75E-05 1 15.02891 1 4.76E-06 U4XN38 502 4.59 15005 14300 17000 19 15.43445 0.2124975 0.84961 16 14.13837 0.344393 0.743825 U4XN39 502 4.869 15005 14300 17000 13 15.43445 0.766812051 0.322932 7 14.13837 0.986929 0.029295 U4XN40 529 1.166 19310 17700 20800 39 21.55867 0.000460024 0.999758 23 17.95244 0.197636 0.845585 U4XY01 1 8.37 21350 12600 34800 26 25.54106 0.4900227 0.587647 25 19.65847 0.138395 0.902393 U4XY02 5 6.953 18735 17300 20300 27 20.71313 0.105004316 0.927062 17 17.4458 0.574551 0.521182 U4XY03 5 7.562 17367 16300 18200 4 18.7293 0.999990525 4.71E-05 7 16.23732 0.996572 0.008669 U4XY04 6 93.603 16050 15400 16600 14 16.86767 0.79027679 0.291537 9 15.0697 0.963887 0.067626 U4XY05 99 7.702 21680 20800 22200 6 25.11956 0.999998732 5.57E-06 7 20.03339 0.999751 0.000761 U4XY06 99 7.754 19520 16000 22300 3 21.90455 0.999999919 6.18E-07 8 18.13388 0.997344 0.006519 U4XY07 99 8.38 25345 23500 26700 29 30.90639 0.658419446 0.411145 21 23.22537 0.705971 0.371693 U4XY08 99 9.1 21650 19900 23500 24 25.09782 0.61356253 0.465635 14 20.00487 0.934004 0.104676
NETC 05-7 Warrants for Exclusive Left Turn Lanes at Unsignalized Intersections and Driveways
Appendix E: Physical Characteristics of Intersections FIGURE E.1: PHYSICAL CHARACTERISTICS OF INTERSECTIONS – R2TY12 .................................................... 119 FIGURE E.2: PHYSICAL CHARACTERISTICS OF INTERSECTIONS – U2TY02 ................................................... 119 FIGURE E.3: PHYSICAL CHARACTERISTICS OF INTERSECTIONS – U2TY12 ................................................... 119 FIGURE E.4: PHYSICAL CHARACTERISTICS OF INTERSECTIONS – U2TY17 ................................................... 120 FIGURE E.5 PHYSICAL CHARACTERISTICS OF INTERSECTIONS – U2TY18 .................................................... 120 FIGURE E.6: PHYSICAL CHARACTERISTICS OF INTERSECTIONS – U2XY04 ................................................... 120 FIGURE E.7: PHYSICAL CHARACTERISTICS OF INTERSECTIONS – U2XY02 ................................................... 121 FIGURE E.8: PHYSICAL CHARACTERISTICS OF INTERSECTIONS – U4TY02 ................................................... 121 FIGURE E.9: PHYSICAL CHARACTERISTICS OF INTERSECTIONS – U4TY08 ................................................... 121
118
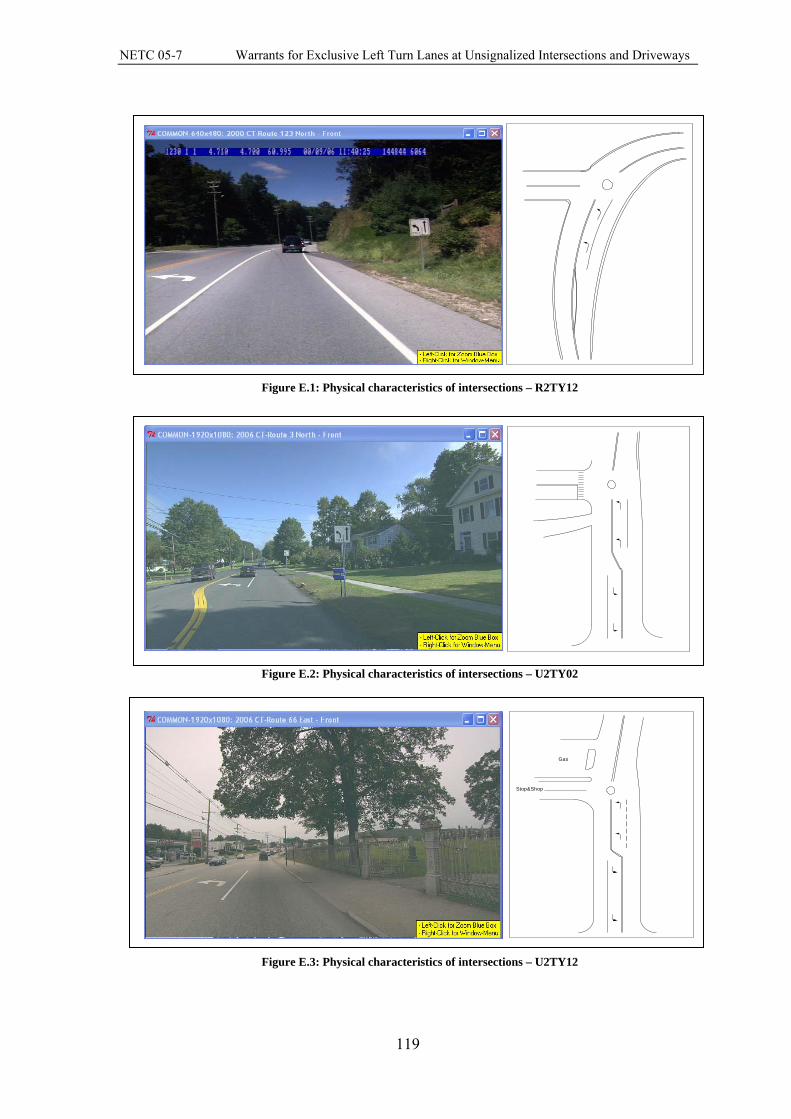
NETC 05-7 Warrants for Exclusive Left Turn Lanes at Unsignalized Intersections and Driveways
Figure E.1: Physical characteristics of intersections – R2TY12
Figure E.2: Physical characteristics of intersections – U2TY02
Stop&Shop
Gas
Figure E.3: Physical characteristics of intersections – U2TY12
119
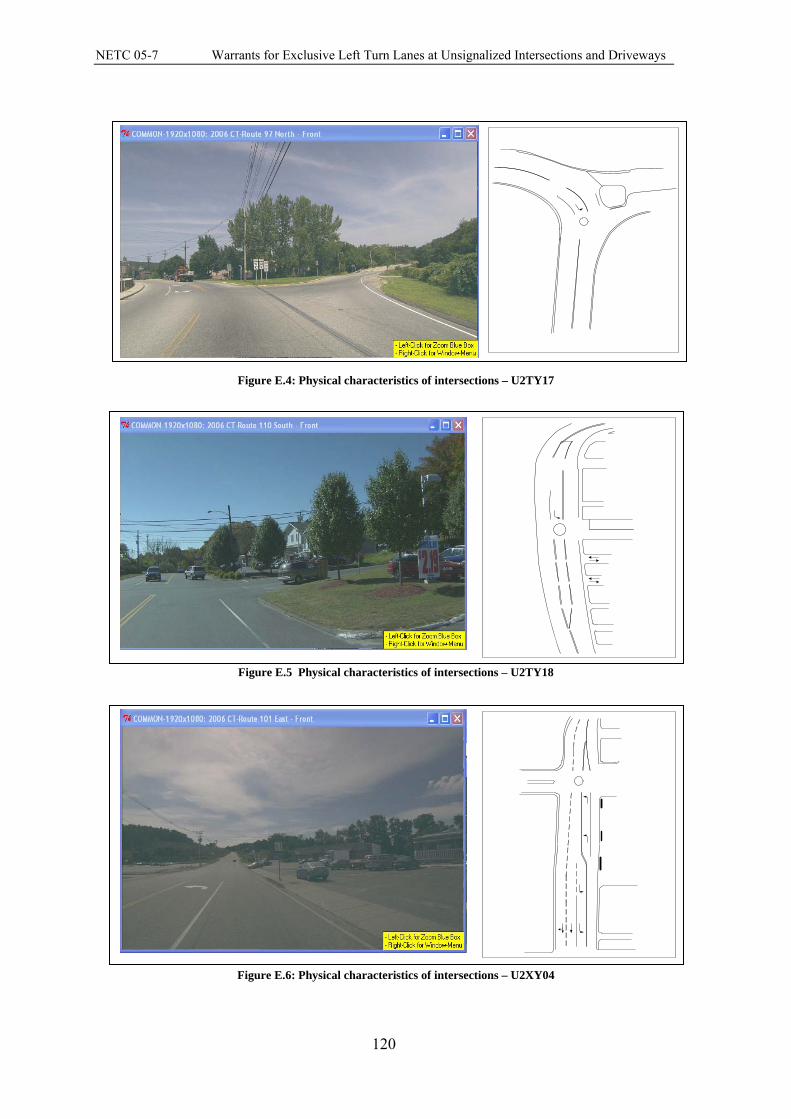
NETC 05-7 Warrants for Exclusive Left Turn Lanes at Unsignalized Intersections and Driveways
Figure E.4: Physical characteristics of intersections – U2TY17
Figure E.5 Physical characteristics of intersections – U2TY18
Figure E.6: Physical characteristics of intersections – U2XY04
120

NETC 05-7 Warrants for Exclusive Left Turn Lanes at Unsignalized Intersections and Driveways
121
Figure E.7: Physical characteristics of intersections – U2XY02
Figure E.8: Physical characteristics of intersections – U4TY02
Figure E.9: Physical characteristics of intersections – U4TY08