Embed Size (px)
Citation preview

Warming and drought differentially influence theproduction and resorption of elemental and metabolicnitrogen pools in Quercus rubraV IDYA SUSEELA 1 , N I SHANTH THARAY IL 1 , BAOSHAN X ING 2 and JEFFREY S. DUKES3 , 4
1School of Agricultural, Forest and Environmental Sciences, Clemson University, Clemson, SC 29634, USA, 2Stockbridge School
of Agriculture, University of Massachusetts Amherst, Amherst, MA, USA, 3Department of Forestry and Natural Resources,
Purdue University, West Lafayette, IN 47907, USA, 4Department of Biological Sciences, Purdue University, West Lafayette, IN
47907, USA
Abstract
The process of nutrient retranslocation from plant leaves during senescence subsequently affects both plant growth
and soil nutrient cycling; changes in either of these could potentially feed back to climate change. Although elemental
nutrient resorption has been shown to respond modestly to temperature and precipitation, we know remarkably little
about the influence of increasing intensities of drought and warming on the resorption of different classes of plant
metabolites. We studied the effect of warming and altered precipitation on the production and resorption of metabo-
lites in Quercus rubra. The combination of warming and drought produced a higher abundance of compounds that
can help to mitigate climatic stress by functioning as osmoregulators and antioxidants, including important interme-
diaries of the tricarboxylic acid (TCA) cycle, amino acids including proline and citrulline, and polyamines such as
putrescine. Resorption efficiencies (REs) of extractable metabolites surprisingly had opposite responses to drought
and warming; drought treatments generally increased RE of metabolites compared to ambient and wet treatments,
while warming decreased RE. However, RE of total N differed markedly from that of extractable metabolites such as
amino acids; for instance, droughted plants resorbed a smaller fraction of elemental N from their leaves than plants
exposed to the ambient control. In contrast, plants in drought treatment resorbed amino acids more efficiently (>90%)
than those in ambient (65–77%) or wet (42–58%) treatments. Across the climate treatments, the RE of elemental N cor-
related negatively with tissue tannin concentration, indicating that polyphenols produced in leaves under climatic
stress could interfere with N resorption. Thus, senesced leaves from drier conditions might have a lower nutritive
value to soil heterotrophs during the initial stages of litter decomposition despite a higher elemental N content of
these tissues. Our results suggest that N resorption may be controlled not only by plant demand, but also by climatic
influences on the production and resorption of plant metabolites. As climate–carbon models incorporate increasingly
sophisticated nutrient cycles, these results highlight the need to adequately understand plant physiological responses
to climatic variables.
Keywords: climate change, climatic stress, drought, metabolic pathways, metabolomics, nutrient resorption, tannins
Received 16 March 2015; revised version received 5 May 2015 and accepted 28 May 2015
Introduction
The functioning of terrestrial ecosystems can be broadly
summarized as the exchange of elements between the
atmosphere and different trophic levels of the bio-
sphere (Mulder et al., 2013). In an era of intense anthro-
pogenic environmental changes, alterations in the
cycling of elements such as carbon and nitrogen and
feedbacks from these cycles to climate change can affect
ecosystem functions (Penuelas et al., 2013). In the terres-
trial carbon cycle, the major pathway of carbon flow
from the atmosphere to soils occurs through carbon fix-
ation by plants, and the major return pathway results
from the subsequent mineralization of this assimilated
carbon by soil heterotrophs (Cotrufo et al., 2013; Pre-
scott, 2010). Thus, the chemical composition of senesced
plant tissues that partly drives the soil heterotrophic
metabolism forms one of the critical factors that regu-
late the storage of fixed carbon in soil. Climate regu-
lates the chemical makeup of plant litter not only
through its direct influence on the biosynthesis of
metabolites during growth (Tharayil et al., 2011), but
also through the subsequent resorption of metabolites
during tissue senescence (Fig. 1). Thus, an in-depth
understanding of how climatic conditions affect the
production–resorption dynamics of metabolites would
enable us to better predict how terrestrial biogeochemi-
cal cycles will respond to climate change.Correspondence: Vidya Suseela, tel. +1 (864) 656-4453, fax +1 (864)
656-0274, e-mail: [email protected]
1© 2015 John Wiley & Sons Ltd
Global Change Biology (2015), doi: 10.1111/gcb.13033

Nutrient resorption, an important resource conserva-
tion strategy in perennial plant species (Chapin &
Kedrowski, 1983; Franklin & Agren, 2002; Freschet
et al., 2010), not only contributes to plant fitness, but
also regulates terrestrial nutrient cycling. Globally,
resorption of nitrogen and phosphorus from senescing
plant tissues is estimated to be 62% and 65%, respec-
tively (Vergutz et al., 2012). This resorption pattern var-
ies with plant functional types (Aerts, 1996; Vergutz
et al., 2012) and soil nutrient status (Kobe et al., 2005;
Rejmankova, 2005; Yuan et al., 2005; Vergutz et al.,
2012) and is broadly regulated by climatic parameters
such as temperature and precipitation (Yuan & Chen,
2009; Han et al., 2011; Reed et al., 2012). Yet, surpris-
ingly, we know little about the interactive effects of
multiple climatic factors on the patterns of nutrient
resorption. Most studies to date have quantified nutri-
ent resorption in an elemental context (McGroddy et al.,
2004; Yuan & Chen, 2009), which provides accurate
measurement regarding the overall recycling of ele-
ments in ecosystems. However, due to the non-specifi-
city of the measured parameter, the elemental
approach is less robust in tracking the identity of com-
pounds that are being preferentially resorbed during
leaf senescence. Also this approach provides less infor-
mation about the composition of metabolites remaining
in the senesced tissues that subsequently fuel microbial
metabolism during initial stages of litter decomposi-
tion. Thus the knowledge about the metabolic regula-
tions underlying nutrient resorption patterns could
potentially improve our predictive understanding
about plant growth and terrestrial nutrient cycling
under future climates.
Climate warming and drought can affect plant phenol-
ogy, which could potentially alter nutrient resorption
through several mechanisms (Estiarte & Pe~nuelas, 2015).
For example, warming can advance the length of grow-
ing season (Penuelas & Filella, 2001; Norby & Luo, 2004),
subsequently disrupting N resorption by delaying the
disassembly of chloroplasts (Collier & Thibodeau, 1995;
Proietti, 1998). Delayed senescence of leaves increases the
risk that an early autumnal frost could damage leaves,
reducing nutrient recovery (Norby et al., 2003; Schreiber
et al., 2013). Thus, warming that delays leaf senescence
could potentially decrease nutrient resorption. Warming-
induced heat stress can also increase plant respiration
and alter conformation of proteins and membranes
(Crafts-Brandner & Law, 2000; Crafts-Brandner & Sal-
vucci, 2000; Kim & Portis, 2005), which could influence
both production and resorption of metabolites. Moisture
stress due to drought would lead to an early onset of
senescence (Rivero et al., 2007) that could potentially
increase resorption of nutrients (Lajtha, 1987), particu-
larly the extractable metabolites. However, under severe
moisture stress, the phloem loading of photosynthates is
impaired, which significantly reduces the resorption effi-
ciency (RE) of nutrients (Pugnaire & Chapin, 1992).
Although many studies have focused on plant
responses to individual stress factors, few have
explored the interactive effects of drought and heat
stress on the production and resorption of nutrients,
which could be different from those that are elicited by
either factor alone. For example, the transcriptome pro-
filing of Arabidopsis exposed to a combination of
drought and warming revealed a unique response of
>770 transcripts which were not altered by either
warming or drought alone (Rizhsky et al., 2004). Simi-
larly, drought and warming together altered the alloca-
tion of nutrients and metabolites to shoots and roots in
a way not predictable by the effects of either factor
alone (Gargallo-Garriga et al., 2015). Under combina-
tions of drought and heat stress, stomatal closure may
lead to lower transpiration, subsequent increase in leaf
temperature (Mittler, 2006; Vile et al., 2012), decrease
in photosynthesis and an increase in respiration rate
(Rizhsky et al., 2002). Warming and drought could also
accelerate the production of reactive oxygen species
that damage proteins, lipids, carbohydrates and DNA
(Gill & Tuteja, 2010). As leaf senescence is an active
process that involves the coordinated expression of
multiple genes (Buchananwollaston, 1997), the height-
ened oxidation stress under the combined influence of
warming and drought may disrupt senescence and
subsequent resorption of nutrients.
Fig. 1 Conceptual diagram illustrating the effect of climatic
stress on the production and resorption of plant metabolites
leading to altered litter quality and biogeochemical cycling that
can feed back to climate change. Along with the direct effect of
climate on production and resorption, some of the compounds
produced under climatic stress can interfere with the remobi-
lization of metabolites during senescence. This in turn could
affect the nutrient reserve of perennial plants. The altered
resorption could also change the soil carbon and nutrient
cycling by altering the quality of the plant litter.
© 2015 John Wiley & Sons Ltd, Global Change Biology, doi: 10.1111/gcb.13033
2 V. SUSEELA et al.

Plants reprogram their metabolic pathways to cir-
cumvent or adapt to climatic stresses leading to chan-
ges in the upstream production and/or downstream
utilization of metabolites (Cramer et al., 2011; Baeren-
faller et al., 2012). For example, recent extensive and
elegant metabolomic approaches have revealed that
plants exposed to climatic stresses invest in the produc-
tion of important metabolites such as amino acids,
organic acids, phenolic acids, polyamines and lipids
that partially mitigate stress by acting as osmoregula-
tors, antioxidants and defense compounds (Dauwe
et al., 2012; Rivas-Ubach et al., 2012, 2014; Penuelas et
al., 2013). Climatic stress due to warming and drought
could also alter the content and composition of leaf pro-
teins, leading to changes in the proportion of structural
and soluble proteins. The dynamic process of resorp-
tion of nitrogenous compounds is further structured by
the potential interference from polyphenolic com-
pounds (Fig. 1). For example, despite greater produc-
tion of soluble proteins under climatic stress (Pugnaire
& Chapin, 1992), the concomitant abundance of
polyphenols produced under this environment (Pizzi &
Cameron, 1986; Moore et al., 2000; Tharayil et al., 2011;
Ahmed et al., 2014) could complex and precipitate pro-
teins, resulting in lower RE of nitrogen.
Thus, nutrient conservation in plants and the chemi-
cal composition of plant litter are regulated both by the
initial production and the subsequent resorption of
metabolites, with climate differentially influencing both
these processes (Fig. 1). However, we still lack a predic-
tive understanding of the main and interactive effects
of warming and drought on the production and resorp-
tion of plant metabolites. The main objectives of this
study were to assess (i) the effect of climatic stress
(warming and drought) on the production and resorp-
tion of specific plant metabolites and (ii) whether the
resorption of easily extractable metabolites follows the
general pattern of resorption estimated in terms of ele-
mental content. We hypothesized that combinations of
drought and warming would elicit unique responses in
the production of plant metabolites that are different
from responses to either drought or warming alone. As
warming and drought induce moisture stress in plants,
we hypothesized that these climatic stresses would
decrease the RE of extractable metabolites. To test these
hypotheses, we exposed Quercus rubra (northern red
oak), a dominant deciduous tree species in North
American temperate forest ecosystems, to six different
combinations of warming and precipitation at the Bos-
ton-Area Climate Experiment. Although most of the
North American Quercus species are fairly tolerant to
drought, red oak is generally considered as a meso-
phytic species (Abrams, 2003). Thus, assessing the
metabolic response of Q. rubra to drought and heat
stress would provide valuable insights into the perfor-
mance and distribution of this dominant species under
future climates, which in turn may affect the structure
and function of ecosystems they occupy.
Materials and methods
Study site and species
The Boston-Area Climate Experiment (BACE), Waltham, MA
(42°23.1 N, 71°12.90 W), subjects square, 4 m2 plots to facto-
rial combinations of four levels of warming [ambient, +~0.8�C(low), +~2.4�C (medium) and +~4�C (high warming)] and
three levels of precipitation [ambient, drought (�50%) and
wet (+50% during the growing season)]. The site has a loamy
topsoil and gravelly sandy loam subsoil. Warming treatments
were administered using different wattage infrared heaters
(200 W for low, 600 W for medium and 1000 W for high
warming) installed at the four corners of each plot (Auyeung
et al., 2013; Suseela & Dukes, 2013). Precipitation treatments
were achieved using rain out shelters, sprinkler systems and
storage tanks. There were three experimental blocks with
three replicate plots per treatment. The treatments started in
July 2008. The study site has an annual average temperature
of 10.3 °C and mean annual precipitation (MAP) of 1063 mm
(for further site details see Suseela et al., 2012, 2014a). In 2013,
the study site received ~840 mm of rainfall (Jan-Dec; NOAA
National Climate Data center station ID 190535, Bedford, MA,
USA) which corresponds to the rainfall received in the ambi-
ent precipitation treatment. In 2013, the dry and wet precipi-
tation treatments received ~420 mm and ~1089 mm (+50%during the growing season), respectively. In the eastern US,
Q. rubra is distributed across a wide climatic envelope, with
MAP ranging from 512 to >2000 mm (Iverson et al., 1999,
Landscape change research group 2014). In 2013, we collected
mature, nonshaded green and senesced leaves of Q. rubra
exposed to six climatic treatments: unwarmed (0) and high
warming (H) plots within the ambient (A), wet (W) and
drought (D) precipitation treatments (referred to hereafter as
A0, AH, W0, WH, D0 and DH). Two green leaves of similar
size from 2 to 3 apical whorls were collected from each of the
three Q. rubra trees per plot during the first week of Septem-
ber. During the second week of October, we collected two
completely senesced (still attached to stem) leaves of similar
size from each apical whorl (three trees per plot). Each har-
vest resulted in at least 12 leaves per plot. Immediately after
harvest, the leaves for the metabolomic analysis were flash-
frozen in dry ice and kept at �80 °C. Leaves from three trees
within each replicate plot were pooled to obtain a composite
sample, and the three treatment replicates were maintained
for all analyses.
Extraction and analysis of metabolites
We removed the leaf petioles before finely grinding the sam-
ples in dry ice. We extracted the polar metabolites from both
green and senesced tissues of Q. rubra exposed to the six cli-
matic treatments. We followed the procedure described in
© 2015 John Wiley & Sons Ltd, Global Change Biology, doi: 10.1111/gcb.13033
METABOLOMICS OF NUTRIENT RESORPTION 3

Lisec et al. (2006) and Kind et al. (2009), with slight modifica-
tions. About 600 mg of each freshly ground sample was
extracted twice with 50 ml of 80% methanol. Four milliliters of
the supernatant was then transferred to prechilled 8-ml glass
tubes, and 1 ml of chilled chloroform was added and cooled
at 4 °C. The extracted metabolites were then fractioned into
polar and nonpolar phases with addition of 2 ml of chilled
water, wherein the polar metabolites fractionated into the top
aqueous-methanol phase. After centrifugation (2500 g for
10 min), we transferred 200 ll of the aqueous-methanol phase
to a vial with a glass insert (250 ll) and dried the sample com-
pletely under nitrogen. To this vial, we then added 5 ll of ribi-tol in methanol (500 lg ml�1) to serve as the internal standard
and 5 ll of d27-myristic acid in hexane (1 mg ml�1) as the
retention time lock compound for the subsequent chromato-
graphic analysis. The vials were again dried completely under
nitrogen. The samples were methoxylaminated via reaction
with 20 ll of methoxylamine hydrochloride (20 mg ml�1) in
pyridine at 40 °C for 90 min to protect carbonyl moieties from
enolization through the formation of corresponding oxime
derivatives. Further, the acidic protons in the compounds
were silylated via reaction with 90 lL of N-methyl-N-
(trimethylsilyl) trifluoroacetamide containing 1%
trimethylchlorosilane for 40 min at 40 °C. The derivatized
samples were analyzed using gas chromatography–mass spec-
trometry (GC-MS) within 10 h of derivatization (Suseela et al.,
2014b).
We analyzed the samples using an Agilent 7980A GC sys-
tem coupled with a 5975 C series quadrupole mass analyzer,
and separation of metabolites was attained on a DB-5 MS cap-
illary column (30 m length 9 0.25 mm internal diame-
ter 9 0.20 lm film thickness). We used split (1 : 10 and
1 : 100) injection (1 ll) with the temperature program: 60 °Cfor 1 min, followed by ramping at 10 °C per minute to 315 °C,with a 10-min hold at 315 °C prior to cool down. The carrier
gas (He) was maintained at a constant pressure of 10.7 psi; the
injection port and the MS interphase were set at 270 °C; theMS quad temperature was maintained at 150 °C; and the MS
source temperature at 240 °C. The electron multiplier was
operated at a constant gain of 2 (EMV = 1478 V). We set the
scanning range at 50–600 amu, achieving 2.66 scans s�1. We
used the Automatic Mass Spectral Deconvolution and Identifi-
cation System (AMDIS, v2.71; NIST, Gaithersburg, MD, USA)
to process the mass spectra with the following deconvolution
parameters: match factor – 75%; resolution – high; sensitivity –medium; shape requirements – medium. We used an in-house
retention index mass spectral library supplemented with
Fiehn Lib (G1676AA; Agilent Technologies, Wilmington, DE,
USA), and the Wiley 9th/NIST08 mass spectral library to posi-
tively identify the compounds based on derivatized molecular
ion, mass fragment pattern and retention time/index
(Table 1). We then confirmed all positive matches by manual
curation, and the integrated area with reference to the internal
standard and representative standards for the major metabo-
lite groups was used for statistical analysis. We broadly
grouped the extractable metabolites into amino acids, organic
acids, sugars, sugar alcohols, polar fatty acids, phenolic com-
pounds, polyamines, polyols, phosphorous compounds, other
nitrogen compounds, polar lipids and other compounds
(Table 1).
Protein analysis
We used a BCA protein assay kit to quantify the prote-
ins as per the manufacturer-recommended protocol (BCA pro-
tein assay kit; Pierce Chemical Co., Rockford, IL, USA). About
50 mg of the green leaves from each replicate was treated with
phosphate buffer (pH 5.6). The mixture was placed in an ice
bath, sonicated for 60 s and centrifuged at 12 000 rpm for
5 min. The supernatant was transferred to centrifuge tubes to
measure the extractable proteins. The pellet remaining after
centrifugation was treated with 1.5 ml of 1% sodium dodecyl
sulfate (SDS) to obtain the detergent-extractable proteins. This
mixture was put in an ice bath for 10 min and vortexed for
5 min, and the step was repeated four times. The mixture was
centrifuged, and the supernatant was used for measuring the
detergent-extractable proteins. The pellet remaining after cen-
trifugation was dried at 60 °C and used for measuring ele-
mental carbon and nitrogen content. The nitrogen remaining
in the pellet was considered to be the nonextractable nitrogen.
The working reagent in the BCA protein assay kit was pre-
pared using reagent A and reagent B in the ratio 1 : 50
(reagent A: sodium carbonate, sodium bicarbonate, bicin-
choninic acid and sodium tartrate in 0.1 M sodium hydroxide;
reagent B: 4% cupric sulfate) and added to supernatant
obtained after buffer and SDS extraction. The buffer-ex-
tractable and detergent-extractable proteins were quantified
by measuring absorbance using a UV/VIS spectrophotometer
at 562 nm. The amount of protein in each sample was quanti-
fied using bovine serum albumin (BSA) as standard.
Carbon and nitrogen analyses
Subsamples of the leaf tissues (green, senesced and tissues
remaining after protein extraction) were dried at 60 °C and
finely powdered using a genogrinder (Spex sample Prep,
Matuchen, NJ, USA). The samples were then used for percent
carbon and nitrogen analyses using an elemental analyzer
(Carlo Erba NA 1500 Elemental Analyzer; Thermo Scientific,
Lakewood, NJ, USA).
Resorption efficiency
Resorption efficiencies of individual metabolite groups and
elemental N were calculated as the proportion of each metabo-
lite group or elemental nitrogen (depicted as nutrient) that
was taken back by the plant during senescence (Van Heer-
waarden et al., 2003):
RE ¼½Nutrient�green � ½Nutrient�senesced
½Nutrient�green� 100
As the metabolomic analysis necessitated the instanta-
neous cessation of all enzymatic activities, the sampled
leaves were immediately flash-frozen with dry ice upon
harvest. This precluded the calculation of the specific leaf
© 2015 John Wiley & Sons Ltd, Global Change Biology, doi: 10.1111/gcb.13033
4 V. SUSEELA et al.

Table. 1 Extractable plant metabolites identified in the green tissues of Quercus rubra exposed to different climatic treatments clas-
sified into broad groups
Sl No Compound Abbreviation
q-value (FDR corrected
P value)‡ m/z* Retention time†
Amino acids
1 L-alanine Ala 5.89E-05 116, 190, 100 0.420
2 Aspartic acid Asp 5.89E-05 160, 130, 117 0.774
3 L-asparagine Asn 5.89E-05 116, 231, 132, 188 0.886
4 b-alanine Bala 7.07E-05 174, 248, 290 0.701
5 Citrulline Cit 9.06E-05 157, 256, 142 0.995
6 L-glutamic acid Glu 7.07E-05 156, 230, 258 0.775
7 L-glutamine Gln 5.89E-05 156, 245, 128 0.960
8 Glycine Gly 5.89E-05 174, 248, 86 0.599
9 DL-isoleucine Ile 5.89E-05 158, 218, 232 0.587
10 L-leucine Leu 0.000169 86, 188, 103 0.468
11 L-lysine Lys 0.000165 174, 317, 156, 230, 1.060
12 L-methionine Met 8.11E-05 176, 128, 219 0.773
13 Phenylalanine Phe 5.89E-05 120, 146, 130 0.797
14 L-proline Pro 6.94E-05 142, 216, 170 0.591
15 L-serine Ser 6.31E-05 204, 218, 100, 188 0.644
16 L-threonine Thr 6.31E-05 218, 117, 101 0.666
17 L-tryptophan Trp 6.31E-05 202, 291, 218 1.237
18 L-tyrosine Tyr 6.31E-05 218, 280, 100, 179 1.071
19 L-valine Val 5.99E-05 144, 218, 100 0.519
Phenolic compounds
20 Vanillic acid VanilA 5.89E-05 297, 267, 223 0.954
21 Vanillylmandelic acid VanilMA 5.89E-05 297, 371, 399 1.111
22 4-hydroxybenzoic acid 4HBA 7.07E-05 267, 223, 193 0.857
23 4-hydroxycinnamic acid 4HCA 7.07E-05 219, 293, 308 1.072
24 Benzoic acid BenA 0.000129 197, 135, 105 0.549
25 Caffeic acid CaffA 5.89E-05 219, 396, 191 1.191
26 Epicatechin Catec 0.00025 368, 355, 267 1.573
27 Gallic acid GallA 5.89E-05 281, 179, 133 1.081
28 Phloroglucinol Phloro 0.00019 342, 327, 133 0.868
29 Pyrogallol Pyrgall 7.07E-05 239, 342, 133 0.791
Sugars
30 D-allose Allose 7.07E-05 319, 205, 160 1.054
31 Cellobiose Cello 7.66E-05 204, 217, 103, 129 1.493
32 Fructose Fruc 7.07E-05 103, 217, 307 1.027
33 D-glucose Glucos 5.89E-05 319, 205, 160 1.044
34 Isomaltose Isomal 5.89E-05 813, 204, 217 1.600
35 Lactose Lacto 5.89E-05 204, 361, 217 1.500
36 Leucrose Leuc 0.006125 361, 204, 217 1.537
37 D-lyxose Lyso 0.000118 103, 307, 189 0.876
38 Maltose Maltos 9.57E-05 361, 204, 217, 103 1.507
39 D-mannose Mann 5.89E-05 205, 319, 160 1.039
40 Sucrose Sucro 5.89E-05 361, 217, 271, 169 1.457
41 Melibiose Melib 0.0020803 204, 217, 129, 103, 191 1.577
42 Raffinose Raffi 5.89E-05 361, 217, 204, 129 1.733
43 Ribose Ribos 5.89E-05 103, 217, 307, 189 0.892
44 Tagatose Taga 0.000642 103, 217, 307 1.032
45 Talose Talose 0.000728 319, 205, 103 1.056
Sugar alcohols
46 Allo-inositol Alloino 0.000979 318, 217, 305, 191 1.126
47 Galactinol Galcnol 6.94E-05 204, 217, 129 1.608
48 Glycerol Glycerol 5.89E-05 205, 117, 103, 218 0.570
© 2015 John Wiley & Sons Ltd, Global Change Biology, doi: 10.1111/gcb.13033
METABOLOMICS OF NUTRIENT RESORPTION 5

Table 1 (continued)
Sl No Compound Abbreviation
q-value (FDR corrected
P value)‡ m/z* Retention time†
49 Maltitol Maltit 0.002791 361, 204, 217, 117 1.564
50 Maltotriitol Maltotr 0.000149 204, 361, 217 1.464
51 D-sorbitol Sorbi 0.003518 205, 319, 217, 307 1.074
52 D-threitol Threit 5.89E-05 217, 103, 205, 189 0.765
53 Xylitol Xylit 5.89E-05 217, 103, 307, 319 0.924
Organic acids
54 3-dehydroshikimic acid DshikA 5.99E-05 296, 386, 208 0.970
55 DL-3-aminoisobutyric acid AminobutA 5.89E-05 102, 176, 218 0.726
56 L-ascorbic acid AscorA 0.000173 332, 205, 117 1.075
57 Chlorogenic acid ChlorA 5.89E-05 345, 307, 219 1.727
58 Citric acid CitA 5.99E-05 273, 347, 133 0.991
59 Dehydroascorbic acid DHAsA 0.000264 173, 157, 245, 316 1.010
60 Fumaric acid FumA 5.99E-05 245, 115, 217 0.635
61 Galacturonic acid GlacuroA 0.000745 333,160, 217 1.069
62 Gluconic acid GlucA 5.89E-05 205, 333, 292, 319 1.107
63 Glyceric acid GlyceA 5.89E-05 189, 292, 133, 103 0.618
64 Glycolic acid GlycoA 0.00612 177, 161, 117 0.397
65 Lactobionic acid LacBA 0.000221 204, 191, 217 1.503
66 Lactic acid LactA 0.00282 117, 191, 219 0.383
67 Maleic acid MaleiA 5.89E-05 245, 133, 115 0.595
68 D-malic acid MalicA 5.89E-05 133, 233, 245 0.748
69 Malonic acid MaloA 5.89E-05 66, 233, 131 0.508
70 Mucic acid MucicA 0.000173 333, 292, 305 0.994
71 O-acetylsalicylic acid Oasaly 5.89E-05 267, 135, 91 0.766
72 Oxalic acid OxA 5.89E-05 117, 133, 219 0.444
73 D-saccharic acid SaccharA 5.99E-05 333, 292, 189 1.137
74 Shikimic acid Shikim 5.89E-05 204, 133, 255 0.983
75 Succinic acid SuccA 5.89E-05 247, 129, 172 0.604
76 Tartaric acid TarA 7.07E-05 292, 219, 189 0.862
77 Uric acid UricA 5.89E-05 367, 172, 158 1.167
N compounds
78 Acetylserine AceSeri 9.06E-05 174, 116, 218 0.671
79 b-cyano-L-alanine BCAlan 5.89E-05 141, 202, 130 0.652
80 L-3,4-dihydroxyphenylalanine LDOPA 6.31E-05 218, 267, 179 1.167
81 N-acetyl-L-leucine Naceleu 5.99E-05 86, 128, 158 0.707
82 Porphine Proph 5.89E-05 184, 134, 285, 174 0.621
83 Purine riboside PuRibo 0.000133 217, 245, 230 1.320
84 L-pyroglutamic acid Pyroglu 0.001339 156, 230, 258 0.774
85 Urea Urea 0.00612 189, 171, 66 0.540
P compounds
86 D-glucose-6-phosphate DG6Phos 5.89E-05 299, 217, 160 1.293
87 Glycerol-1-phosphate Gly1P 0.000213 299, 211, 129 0.951
88 O-phosphocolamine Pcolo 7.07E-05 299, 315, 174 0.967
89 Phosphoric acid PhosA 0.00612 299, 314, 211 0.568
Fatty acid
90 4-guanidinobutyric acid 4GBA 5.89E-05 174, 304, 246 0.783
91 Palmitic acid PalA 9.06E-05 313, 117, 129, 145 1.138
92 Stearic acid SteaA 0.000107 117, 341, 132, 145 1.253
Polyamines
93 Putrescine Putre 8.11E-05 174, 214, 200 0.938
94 D-lyxosylamine Lysosa 5.99E-05 217, 307, 189 0.881
Polar lipids
95 DL-dihydrosphingosine DiHsping 0.000172 204, 414, 115 1.368
© 2015 John Wiley & Sons Ltd, Global Change Biology, doi: 10.1111/gcb.13033
6 V. SUSEELA et al.

area of leaves used for metabolomic analyses. Hence, the
RE in this study is reported on a mass basis. A subset of
green and senesced leaves collected during the respective
harvest times was used for the calculation of specific leaf
area. The specific leaf area was similar across all treatments
and between the green and senesced leaves within each
treatment (Figure S1), indicating that in this study the RE
on an leaf area basis would also follow a similar trend as
that observed on a leaf mass basis.
Data analysis
The metabolomic data were autoscaled to satisfy the assump-
tions of normality. To evaluate the main and interactive effects
of warming and precipitation treatments, we first analyzed the
metabolomic data with permutational multivariate analysis of
variance (PERMANOVA; Primer 7 PERMANOVA+, version 7.0.5; Pri-
mer-E Ltd, Plymouth, UK) using the Euclidean distance (Ri-
vas-Ubach et al., 2012). Occurrence of Type-1 error due to
multiple comparison across metabolites were controlled by
false discovery rate (FDR). The 100 metabolites that had a
FDR-adjusted P value (q value) of <0.05 (delta = 3.0) were uti-
lized in the subsequent multivariate analyses. The extractable
metabolite data were further analyzed with partial least
squares discriminant analyses (PLS-DA; MetaboAnalyst 3.0;
Gargallo-Garriga et al., 2015). The cross-validation of PLS-DA
model (k-fold cross-validation) had a model goodness of fit
(R2) and a cross-validation R2 (Q2; model predictive ability) of
>0.8. The robustness of the class discrimination was verified
through permutation testing of separation distance based on
the ratio of the between-group sum of the squares and the
within-group sum of squares and had P < 0.0005 over 2000
iterations. A principal component analysis (PCA) was also
conducted on the metabolome and separately on classes of
compounds (Table 1) using the sums of the individual com-
pounds in each class. Each of the metabolites in the important
compound classes such as amino acids, organic acids and sug-
ars that separated the climatic treatments in the PCA was ana-
lyzed individually using mixed-model restricted maximum
likelihood ANOVA (PROC MIXED; SAS version 9.2; SAS Institute,
Cary, NC, USA), with precipitation and warming treatments
as fixed factors and block as a random factor. A heatmap was
generated (MetaboAnalyst 3.0; Xia et al., 2012) to better visual-
ize the responses of 100 metabolites across different climatic
treatments (Angelcheva et al., 2014). Hierarchical clustering
analysis was performed based on both the treatments
and metabolites. Percentage of elemental N, protein fractions
and nonextractable N in green tissues, and RE of metabolite
groups and RE of elemental N was analyzed using PROC
MIXED. The differences among individual treatments were
assessed using Tukey’s HSD multicomparison test.
Results
Abundance of extractable metabolites in green tissues
The metabolomic approach adopted in this study is
focused toward identification of polar metabolites in
the leaf extracts. However, a subset of relatively polar
compounds such as flavonoid glycosides that are less
amenable to gas chromatographic analysis was charac-
terized using liquid chromatography–tandem mass
spectrometry and is not presented here. The total ion
chromatogram of GC-MS processed using AMDIS
parameters specified in the method section identified
625–650 component peaks with unique fragmentation
and retention time. Further based on the mass fragmen-
tation and retention time/index matches with the mass
spectral libraries, we established the molecular identity
of 100 components across all climate treatments that
had an FDR corrected P value (q) of <0.05 (Table 1). As
one of the objectives of the study was to elucidate the
climate-induced metabolic regulations in plants, only
those components with a confirmed molecular identity
were used for the analyses. The cumulative peak area
of the identified metabolites constituted more than 80%
of the total peak area of the total ion chromatogram in
all samples.
Table 1 (continued)
Sl No Compound Abbreviation
q-value (FDR corrected
P value)‡ m/z* Retention time†
96 D-sphingosine Dspingo 7.07E-05 204, 129, 103 1.362
Polyol
97 Quinic acid Quini 5.89E-05 345, 255, 204 1.018
Other compounds
98 2-ketogulonic acid 2KGluA 5.89E-05 204, 147, 437 1.078
99 Gluconic acid lactone GluALAc 7.07E-05 217, 205, 244 1.049
100 Methyl-b-D-galactopyranoside MBDP 7.07E-05 204, 217, 191 1.277
*All compounds produce ion fragments of m/z = 73 (base peak) that corresponds to [(CH3)3SiOH], and m/z = 147 that corresponds
to [(CH3)3 SiOSi(CH3)2] which are characteristics for MSTFA derivatization.
†Relative to retention time of myristic acid. For compounds that contribute to more than one chromatographic peak due to multiple
trimethylsilyl derivatives, the relative retention time of the most abundant derivative is represented in this table.
‡Expected proportion of false positives incurred when calling that feature significant.
© 2015 John Wiley & Sons Ltd, Global Change Biology, doi: 10.1111/gcb.13033
METABOLOMICS OF NUTRIENT RESORPTION 7

The PERMANOVA analysis of the responses of the entire
metabolome of Q. rubra to different climate treatments
identified an interaction between warming and precipi-
tation treatments (pseudo-F 15.17; P < 0.001). The
results of the PLS-DA of the metabolome were consis-
tent with the interaction effect identified by PERMANOVA:
the effect of warming on metabolite composition varied
by precipitation treatments (Fig. 2). Principal compo-
nent analysis of the relative intensities of all extractable
metabolites identified from the green tissues of Q. rubra
revealed that the climate treatments affected metabolite
compositions, with the effect of warming depending on
the precipitation treatment (Figure S2; warming 9 pre-
cipitation, P < 0.001). PC axes 1, 2 and 3 explained 68%
of the variation in the data, with PC axis 1 separating
DH from all other treatments in terms of metabolite
composition. A hierarchical clustering of the metabo-
lites clearly revealed the close grouping of climate treat-
(a)
(b)
Fig. 2 Partial least squares discriminant analysis (PLS-DA) of the relative intensities of 100 plant metabolites of Quercus rubra exposed
to six different climate treatments. (a) Sample categorized score (mean � SD; n = 3) plot between component 1 and component 2 (key:
A0, ambient precipitation + no warming; AH, ambient precipitation + high warming; W0, wet precipitation + no warming; WH, wet
precipitation + high warming; D0, dry precipitation + no warming; and DH, dry precipitation + high warming). (b) Loading plot
between component 1 and component 2 of the metabolite variables (see Table 1 for metabolites).
© 2015 John Wiley & Sons Ltd, Global Change Biology, doi: 10.1111/gcb.13033
8 V. SUSEELA et al.

Fig. 3 Heatmap and two-way hierarchical clustering of metabolomic data of green leaves of Quercus rubra exposed to different climate
treatments. Each column represents a sample from a climate treatment, and each row represents a positively identified metabolite
(Table 1) based on mass spectral fragmentation pattern and retention indices. Key as in Fig. 2.
© 2015 John Wiley & Sons Ltd, Global Change Biology, doi: 10.1111/gcb.13033
METABOLOMICS OF NUTRIENT RESORPTION 9

ments based on the abundance of various metabolites
(Fig. 3). The metabolite composition of the unwarmed
ambient precipitation treatment (A0) grouped with the
unwarmed drought (D0) treatment. Similarly, the
warmed treatments receiving ambient and wet precipi-
tation (AH, WH) grouped together. The DH and W0
treatments, the two extremes of the stressed and non-
stressed treatments, respectively, did not group with
any of the other climate treatments.
Climate treatments also appeared as separate groups
in a principal component analysis of the sum of relative
intensities of metabolite groups in green tissue (Fig. 4).
PC axes 1 and 2 explained 58% of the variation in the
data and showed that precipitation treatments affected
responses to warming (P < 0.001). PC axis 1 statistically
distinguished all treatments except A0 and AH. Leaves
from the combination of drought and warming (DH)
had higher relative abundances of amino acids, sugars,
and organic acids than leaves from other treatments.
Leaves from the wet precipitation (W0) had the greatest
abundances of polar fatty acids, polyols and sugar alco-
hols. As the abundance of major compound classes
such as amino acids, organic acids and sugars varied
between the stressed (DH) and the nonstressed (W0)
treatments, we analyzed the individual metabolites
within these compound classes separately.
Amino acids. A total of 19 amino acids were identified
in the green leaves of Q. rubra exposed to different
climate treatments, of which 11 had greater abundance
in plants exposed to warming, drought or their combi-
nation (Fig. 5). The concentration of amino acids in the
ambient (A0) treatment was 12.1 � 1.2% of total leaf N.
The effect of warming and precipitation treatments on
the abundance of amino acids interacted for all amino
acids except tyrosine (P < 0.05; Fig. 5). Tyrosine content
varied only with precipitation, such that drought and
ambient treatments had greater abundance of tyrosine
than the wet treatment (P = 0.002). Warming also
increased the abundance of tyrosine (P < 0.001). Abun-
dances of proline, b-alanine, aspartic acid, threonine,
methionine, serine and lysine were greater in the DH
treatment than in all other treatments (Fig. 5). Warming
increased the abundance of citrulline and b-alanineacross all precipitation treatments. Tryptophan and
valine had greater abundance in AH and DH treatment
compared to the A0 treatment. Among the 19 amino
acids identified, 10 had lower abundance in W0 and
WH treatments (P < 0.05).
Organic acids. Among the 24 organic acids identified in
green leaves of Q. rubra exposed to combinations of
warming and precipitation treatments (Table 1), the
organic acid intermediaries in the TCA cycle such as
citric acid and succinic acid had higher abundance in
the DH treatment than in the A0 treatment (P < 0.001;
Fig. 5). Fumaric acid, an organic acid intermediary in
the TCA cycle, exhibited higher abundance in the
Fig. 4 Principal component analysis of the relative intensities of the broad metabolite groups (amino acids, phenolic compounds,
organic acids, sugars, sugar alcohols, polyols, polyamines, polar fatty acids, polar lipids, N compounds, P compounds and other
compounds) of Quercus rubra exposed to different climate treatments. Key as in Fig. 2. Letters ‘A to E’ indicate Tukey’s difference
between treatments separated by PC axis 1 and ‘a to c’ between treatments separated by PC axis 2. Graphed values represent means
(n = 3) � SD.
© 2015 John Wiley & Sons Ltd, Global Change Biology, doi: 10.1111/gcb.13033
10 V. SUSEELA et al.

warming treatment than in the unwarmed treatment
(P < 0.001; Fig. 5). Fumaric acid also had higher abun-
dance in the ambient and drought precipitation treat-
ments than in the wet treatment (P < 0.001: Fig. 5). The
abundance of nine organic acids (citric acid, dehy-
droascorbic acid, fumaric acid, lactobionic acid, maleic
acid, malic acid, mucic acid, succinic acid, and tartaric
acid) was higher in Q. rubra exposed to DH compared
to the W0 treatment (P < 0.05). On the other hand,
shikimic acid (Fig. 5), O-acetylsalicylic acid and glyc-
eric acid were higher in W0 treatment than in the DH
treatment (P < 0.05).
Sugars. A total of 16 sugars were identified in green
leaves (Table 1) of which sucrose, glucose, tagatose and
fructose were the most abundant carbohydrates.
Sucrose was the most abundant sugar and its concen-
tration was higher in DH than in WH (P < 0.001;
Fig. 3). Lactose also exhibited a similar pattern of
response, with a higher concentration in DH than
in W0 (P < 0.001). Ribose, raffinose and lyxose
reached higher abundance in W0 than in DH (P < 0.01;
Fig. 3).
Polyamine. Putrescine, an important polyamine, was
more abundant in the DH treatment than in all other
treatments (P < 0.01; warming 9 precipitation interac-
tion; Fig. 5).
Resorption efficiency of extractable metabolites
Climate treatments differentially affected the RE of var-
ious metabolite groups such as amino acids, organic
acids, sugars and compounds containing phosphorus
(Fig. 6). The RE of amino acids decreased as precipita-
tion increased, and generally decreased with warming,
Shikimic acid
D0 DH AH W0 WH
–1
0
1
2
3
D0 DH AH W0 WH–1.0
–0.5
0.0
0.5
1.0
1.5
2.0
Asparagine
D0 DH AH W0 WH–1.5
–1.0
–0.5
0.0
0.5
D0 DH AH W0 WH–1
0
1
2
3
4
5
Tryptophan
D0 DH AH W0 WH–1.0
–0.5
0.0
0.5
1.0
1.5
Tyrosine
D0 DH AH W0 WH–2
–1
0
1
2
3 Phenylalanine
D0 DH AH W0 WH–1.0
–0.8
–0.6
–0.4
–0.2
0.0
Lysine
D0 DH AH W0 WH–1
0
1
2
3
Glutamic acid
D0 DH AH W0 WH–1.5
–1.0
–0.5
0.0
0.5
1.0 D0 DH AH W0 WH0.0
0.2
0.4
0.6
0.8
1.0
–alanine
D0 DH AH W0 WH
0
2
4
6
8
10
12
Proline
D0 DH AH W0 WH–1.0–0.50.00.51.01.52.0
DAHP
Phenylalanine
Leucine
Valine
Proline
Homoserine
Shikimic acid
Asparagine
Oxaloacetate
Malic acid
Fumaric acid
Succinic acid
α-ketoglutarate
Citric acid
Sucrose
Glucose
Glucose-6-phosphate
3-phosphoglyceric acid
Phosphoenol pyruvic acid
Pyruvate
Acetyl -CoA
Tryptophan
Alanine
AspartateLysine
ThreonineIsoleucine
β-alanine
SerineGlycine
Glutamate
Glutamine
Tyrosine
Shikimate pathway Tricarboxylic acid cycleGlycolysis
Methionine
Ornithine
CitrullineArginine
Urea
Urea cycle
Putrescine
Isoleucine
D0 DH AH W0 WH–1.0
–0.8
–0.6
–0.4
–0.2
0.0
Glutamine
D0 DH AH W0 WH–1.0
–0.5
0.0
0.5
1.0
Aspartic acid
D0 DH AH W0 WH–1.0
–0.5
0.0
0.5
1.0
1.5
2.0
Glycine
D0 DH AH W0 WH
0
2
4
6
8
10
Serine
D0 DH AH W0 WH–2
–1
0
1
2
Threonine
D0 DH AH W0 WH–2
–1
0
1
2
Valine
D0 DH AH W0 WH
–0.6–0.4–0.20.00.20.40.6
Methionine
D0 DH AH W0 WH0
1
2
3
4
D0 DH AH W0 WH08642024
D0 DH AH W0 WH
–1
0
1
2
D0 DH AH W0 WH–1.0
–0.5
0.0
0.5
1.0
Citrulline
D0 DH AH W0 WH
–1
0
1
2
Malic acidFumaric acidSuccinic acidCitric acid
Leucine
Alanine
Putrescine
D0 DH AH W0 WH
0.0
0.2
0.4
0.6
0.8
β
Fig. 5 Response of individual metabolites in representative metabolic pathways to climate treatments measured as the fold difference
between individual treatments and that in the unwarmed ambient precipitation (control) treatment. Bars in graphs represent means
(n = 3) � SE. Y axis of the bar graphs represents fold change of individual metabolites from the ambient unwarmed treatment. Key as
in Fig. 2.
© 2015 John Wiley & Sons Ltd, Global Change Biology, doi: 10.1111/gcb.13033
METABOLOMICS OF NUTRIENT RESORPTION 11
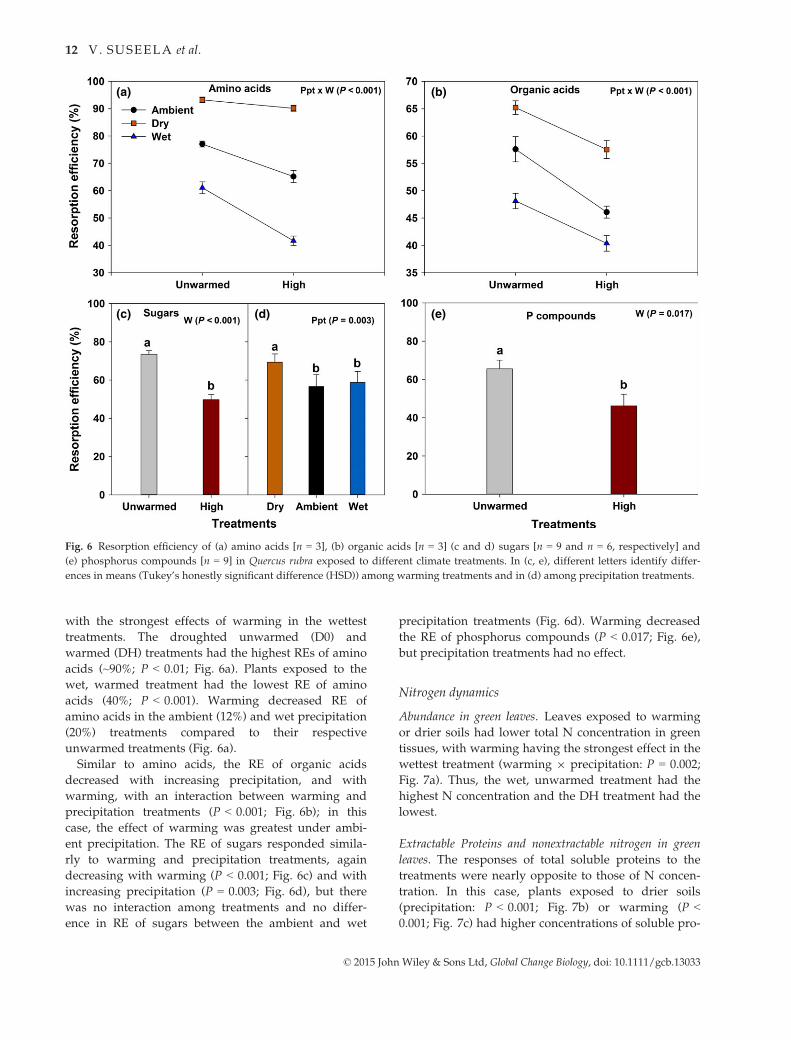
with the strongest effects of warming in the wettest
treatments. The droughted unwarmed (D0) and
warmed (DH) treatments had the highest REs of amino
acids (~90%; P < 0.01; Fig. 6a). Plants exposed to the
wet, warmed treatment had the lowest RE of amino
acids (40%; P < 0.001). Warming decreased RE of
amino acids in the ambient (12%) and wet precipitation
(20%) treatments compared to their respective
unwarmed treatments (Fig. 6a).
Similar to amino acids, the RE of organic acids
decreased with increasing precipitation, and with
warming, with an interaction between warming and
precipitation treatments (P < 0.001; Fig. 6b); in this
case, the effect of warming was greatest under ambi-
ent precipitation. The RE of sugars responded simila-
rly to warming and precipitation treatments, again
decreasing with warming (P < 0.001; Fig. 6c) and with
increasing precipitation (P = 0.003; Fig. 6d), but there
was no interaction among treatments and no differ-
ence in RE of sugars between the ambient and wet
precipitation treatments (Fig. 6d). Warming decreased
the RE of phosphorus compounds (P < 0.017; Fig. 6e),
but precipitation treatments had no effect.
Nitrogen dynamics
Abundance in green leaves. Leaves exposed to warming
or drier soils had lower total N concentration in green
tissues, with warming having the strongest effect in the
wettest treatment (warming 9 precipitation: P = 0.002;
Fig. 7a). Thus, the wet, unwarmed treatment had the
highest N concentration and the DH treatment had the
lowest.
Extractable Proteins and nonextractable nitrogen in green
leaves. The responses of total soluble proteins to the
treatments were nearly opposite to those of N concen-
tration. In this case, plants exposed to drier soils
(precipitation: P < 0.001; Fig. 7b) or warming (P <0.001; Fig. 7c) had higher concentrations of soluble pro-
(a)
(c) (d) (e)
(b)
Fig. 6 Resorption efficiency of (a) amino acids [n = 3], (b) organic acids [n = 3] (c and d) sugars [n = 9 and n = 6, respectively] and
(e) phosphorus compounds [n = 9] in Quercus rubra exposed to different climate treatments. In (c, e), different letters identify differ-
ences in means (Tukey’s honestly significant difference (HSD)) among warming treatments and in (d) among precipitation treatments.
© 2015 John Wiley & Sons Ltd, Global Change Biology, doi: 10.1111/gcb.13033
12 V. SUSEELA et al.

teins in green leaf tissue, with no interaction between
treatments. Ambient and drought treatments increased
total soluble proteins by 94% and 85%, respectively,
compared to the wet treatment. Similarly, warming
increased total soluble proteins by 75% (Fig. 7b and c).
Detergent-extractable proteins increased in the drought
treatment, but only when unwarmed (D0; Fig. 7d). The
N remaining in the leaf tissues after protein extraction
(non-extractable N) responded similarly to total N
concentration, and nearly opposite to the total soluble
proteins (Fig. 7e and f). Non-extractable N was greatest
in the wet treatment (P < 0.001; Fig. 7e) and decreased
with warming (P = 0.001; Fig. 7f).
Resorption efficiency of elemental nitrogen. Warming sup-
pressed RE of elemental N, although wet treatment par-
tially ameliorated the suppressive effect of the warming
(warming 9 precipitation: P < 0.001; Fig. 8). The rela-
tively high RE of elemental N in control (A0) treatment
(60%) decreased to 30% with warming (AH) and less
than 20% in the drought treatments (DH).
Discussion
Our results show that climatic factors strongly affect
both the production and resorption of plant metabolites,
which could potentially influence plant growth and soil
nutrient cycling. Drought and warming additively
increased the abundances of amino acids and organic
acids in green tissues. However, these climatic parame-
ters differentially influenced the RE of extractable
metabolites, where RE increased under drought, but
decreased under warming. Although extractable
metabolites that are routinely identified in metabolomic
studies represent only <10% of the initial tissue mass,
this metabolite pool could disproportionately influence
tissue decomposition because of the rapid bioavailabil-
ity to soil heterotrophs. Interestingly, the RE of elemen-
(a) (c)
(d) (e) (f)
(b)
Fig. 7 Response of (a) percent nitrogen [n = 3], (b and c) total soluble proteins [n = 6; n = 9, respectively], (d) SDS extractable proteins
[n = 3] and (e and f) percent nonextractable nitrogen (n = 6; n = 9, respectively) in green leaves of Quercus rubra exposed to different
climate treatments. In (b, e), different letters identify differences in means (Tukey’s honestly significant difference (HSD)) among preci-
pitation treatments. In (d) along the unwarmed treatments bars with the same upper case letter indicate no difference between the treat-
ments and along the warmed treatments bars with the same lower case letter indicate no difference between the treatments. Asterisk
indicate difference between the unwarmed and the high warming treatments within a precipitation treatment. Values represent
means � SE.
© 2015 John Wiley & Sons Ltd, Global Change Biology, doi: 10.1111/gcb.13033
METABOLOMICS OF NUTRIENT RESORPTION 13

tal N responded oppositely to that of the extractable N
metabolites – for instance, RE of elemental N was <20%under drought, while RE of amino acids was >90%under drought treatments. This decline in RE of ele-
mental N implies a reduced recapture of N by plants
under drought, which could hinder their growth in the
following year. Concomitantly, the lower abundance of
labile N pool (amino acid fraction) in the senesced
tissue formed under drought treatment could result in
a lower rate of decomposition of this litter, despite
their greater element N content. Thus, apart from the
direct effect of moisture stress, plant survival might be
challenged under drought conditions not only because
of a lower tissue reserve of N, but also due to slower
nutrient cycling in soils.
Warming and drought differentially influence productionand resorption of extractable metabolites
The pattern of metabolite abundance observed in our
study resembles that reported by Gargallo-Garriga et al.
(2015), where plants exposed to a combination of
drought and warming produced a different metabolic
profile than would have been expected from the
responses of plants to the individual factors (Figs 2 and
3). In our study, Q. rubra leaves had greater abun-
dances of amino acids and organic acid intermediaries
of the TCA cycle when exposed to the combination of
warming and drought (DH; Figs 4 and 5) than when
exposed to either drought or warming alone. Interme-
diaries of the TCA cycle such as succinic acid, citric
acid and malic acid provide carbon skeletons and
reduction equivalents to a majority of plant biochemical
pathways (Meyer et al., 2007). A similar increase of
many metabolites in the TCA cycle has been reported
in plants subjected to moisture stress (Urano et al.,
2009). As drought induces stomatal closure and con-
comitant warming leads to high leaf temperatures,
plants exposed to the combination of drought and
warming experience higher cellular respiration (Vile
et al., 2012). Thus, the abundance of TCA intermedi-
aries in the DH treatment (Fig. 5) suggests greater cel-
lular respiration during combined heat and drought
stress. Although previous studies have reported
increase in citric acid due to heat stress alone (Du et al.,
2011), we did not observe a similar increase in warmed
treatments (AH and WH; Fig. 5), plausibly due to the
greater availability of moisture in wet and ambient pre-
cipitation treatments, which could have partially allevi-
ated the heat stress. The above response parallels the
suppression of citric acid in plants exposed to heat
stress in combination with elevated CO2, compared to
those exposed to heat stress under ambient CO2 (Yu
et al., 2012), potentially due to the lower moisture stress
under elevated CO2. The increased mitochondrial activ-
ity under DH (Fig. 5) could provide carbon skeletons
required for the biosynthesis of amino acids (Vasquez-
Robinet et al., 2008). This observation was supported by
coordinated increases in the abundance of amino acids
such as proline, and citrulline, and polyamine such as
putrescine derived from a-ketoglutarate (Fig. 5), an
intermediate in the TCA cycle. These metabolites func-
tion as signaling compounds and osmoregulators,
maintain protein and enzyme integrity and scavenge
hydroxyl radicals, thus helping plants to tolerate abiotic
stress (Galston, 1991; Akashi et al., 2001; Matysik et al.,
2002; Kaplan et al., 2004; Alcazar et al., 2006; Groppa &
Benavides, 2008; Alcazar et al., 2010; Szabados &
Savoure, 2010; Wang et al., 2014). As proline protects
subcellular structures and maintains the structural
integrity of macromolecules including proteins under
dehydration, biosynthesis of proline is upregulated
and its catabolism is repressed under moisture stress
(Szabados & Savoure, 2010). Similar increases in proline
and several other secondary metabolites such as GABA,
choline and glycine betaine were reported in grasses
exposed to combined warming and drought stress,
whereas drought alone reduced levels of amino acids,
sugars and nucleosides associated with energy and
growth metabolism pathways (Gargallo-Garriga et al.,
2015). In our study, Q. rubra exposed to DH also had
greater concentrations of aspartate, lysine, methionine
and threonine derived from oxaloacetate (TCA cycle
intermediate; Fig. 5).
Fig. 8 Resorption efficiency of total elemental nitrogen in Quercus
rubra exposed to different climate treatments (mean � SE; n = 3).
Along the unwarmed treatments bars with the same upper case
letter indicate no difference (Tukey’s honestly significant differ-
ence (HSD)) between the treatments and along the warmed treat-
ments bars with the same lower case letter indicate no difference
between the treatments. Asterisk indicate difference between
unwarmed and high warming treatments within a precipitation
treatment.
© 2015 John Wiley & Sons Ltd, Global Change Biology, doi: 10.1111/gcb.13033
14 V. SUSEELA et al.

Cellular homeostasis is maintained not only by
biosynthesis, but also through utilization, catabolism
and inter-cellular/inter-organ transport of metabolites.
Thus, the observed abundance of amino acids could
also result from the degradation of proteins that could
act as energy sources specifically under reduced photo-
synthesis (Guy et al., 2008; Caldana et al., 2011) or could
be the result of a bottleneck in the effective utilization
of these amino acids in the downstream metabolic path-
way (Rizhsky et al., 2002). Conversely, plants exposed
to favorable climatic conditions that promote active
photosynthesis such as the wet treatment could effec-
tively utilize the amino acids for protein synthesis
(Morot-Gaudry et al., 2001). Thus, the lower abundance
of many amino acids in plants exposed to the wet
treatment (Fig. 5), particularly the important amide
amino acids such as glutamine, glutamate and aspar-
tate and metabolites in the TCA cycle could result from
a faster plant growth and accompanying greater
demand for these compounds in the downstream path-
way for the synthesis of cellular components (Meyer
et al., 2007).
Our study revealed that REs of metabolite groups
increased with drought treatments but decreased
with warming (Fig. 6). While we did not determine
the mechanisms behind these contrasting responses,
we speculate that they could be attributed to differ-
ential effects of high temperature and drought on
plant phenology, physiology and metabolism. Warm-
ing could delay leaf senescence (Bauerle et al., 2012)
resulting in lower RE, while drought could enhance
tissue senescence (Rivero et al., 2007) leading to
greater RE of extractable metabolites. Plants also pro-
duce a cascade of signaling responses upon percep-
tion of heat stress including changes in protein and
peptide structures, and enzyme conformation and
activities (Ruelland & Zachowski, 2010) that may
have affected the RE. It should be noted that the
metabolic perturbances in plants is a function of the
physiological stress they perceive in a given environ-
ment, rather than being a response to an absolute
temperature or drought regimen. Hence plants that
are less adapted to environmental stress would be
more metabolically stressed than those that are accli-
matized to aberrant climate conditions.
Drought and warming altered total nitrogen and theproportion of soluble proteins in green leaves
As nitrogen is the most limiting nutrient in many
ecosystems, understanding plant N dynamics under
changing climates is critical to predict both plant
growth and soil biogeochemical cycling, each of which
may feed back to climate change. In general, warming
decreased green leaf N in all precipitation treatments
(Fig. 7a). Similar decreases in green leaf N with warm-
ing have been recorded in other tree species (Tjoelker
et al., 1999; Weih & Karlsson, 2001), in shrubs (Sardans
et al., 2008b) and in grasses (An et al., 2005). Despite a
similar specific leaf area, the total elemental N in green
leaves was highest in Q. rubra exposed to the most
favorable climatic treatment (W0), while the DH treat-
ment resulted in the lowest N content in green tissues
(Fig. 7a). This pattern could be due to the influence of
climatic stresses on plant physiology and soil N miner-
alization. For example, the combination of drought and
warming would reduce photosynthesis and lower the
sink strength (Llorens et al., 2004; Sardans et al., 2008a,
b), while warming- and drought-induced limitation in
soil moisture decreases the mineralization and diffu-
sion of soil N (Emmett et al., 2004; Sardans et al., 2008a;
Auyeung et al., 2013) together decreasing N in green
leaves exposed to DH.
Probing deeper into the N dynamics of green tissues,
our study revealed that the allocation of N to different
protein fractions also varied with climate treatments
(Fig. 7b–f). The higher amount of total soluble proteins
with heat and moisture stress observed in this study
(Fig. 7b) is indicative of plants allocating more N to the
photosynthetic apparatus, as Rubisco typically com-
prises 50% of total soluble proteins (Feller et al., 2008).
Also, plants exposed to heat and drought stress may
increase the production of heat-shock proteins (Huang
& Xu, 2008; Gechev et al., 2013). Concurrently, the non-extractable N increased in green tissues produced
under nonstressed climatic conditions such as the wet
and unwarmed treatments (Fig. 7e–f). In mesic envi-
ronments, wetter conditions generally favor nitrogen
uptake, leading to faster plant growth and higher nutri-
ent concentrations in tissues (Mulder et al., 2013; Sar-
dans & Penuelas, 2013).
Climatic treatments differentially influence the resorptionof elemental and metabolic pools of nitrogen
Surprisingly, the pattern of RE of elemental N was
opposite to that of RE of extractable N metabolites such
as amino acids. In drought treatments (D0, DH) RE of
amino acids was ~90% (Fig. 6a). However, the RE of
elemental nitrogen in drought treatments was <20%(Fig. 8). Although the solvent-extracted physiological
amino acid pool contributes to a lower fraction of total
leaf N (12.1 � 1.2% of total leaf N in A0 treatment), this
labile pool of N could be important in facilitating tissue
decomposition and soil nutrient cycling (Top & Filley,
2014). An impairment of phloem-loading capacity in
moisture-stressed plants could contribute to the lower
resorption of total N in drought treatments (D0 and
© 2015 John Wiley & Sons Ltd, Global Change Biology, doi: 10.1111/gcb.13033
METABOLOMICS OF NUTRIENT RESORPTION 15

DH; Hill, 1980; Pugnaire & Chapin, 1992). In general,
environments that are limiting in nutrients but suffi-
cient in moisture favor greater RE from senescing
tissues (Arco et al., 1991; Pugnaire & Chapin, 1992). As
xylem water potential plays a critical role in the phloem
transport of photosynthates and in phloem loading
(Holtta et al., 2006), moisture stress tends to limit RE
irrespective of the nutrient availability in soils (Pug-
naire & Chapin, 1992). Thus, the pattern of RE of ele-
mental N observed in our study could be partly
attributed to the moisture stress in drought treatments,
which directly interferes with the physiology of nutri-
ent resorption in plants. A similar pattern of lower ele-
mental C : N ratios has been observed in senesced
leaves of other tree species exposed to drought treat-
ments at the BACE site (J.S. Dukes, unpublished
results). Protein catabolism predominantly yields
amino acids (Vierstra 1993), and hence the differential
catabolism of proteins between the wet and drought
treatments during leaf senescence could also influence
the observed RE of amino acids. Although plants
adapted to dry climates generally exhibit higher nutri-
ent resorption than plants adapted to tropical climates
(Vergutz et al., 2012), the decrease in RE of elemental N
under drought observed in this study indicates that
plants that are less acclimatized to moisture stress
might suffer under future drier and warmer climates
due to a greater loss of assimilated N during senes-
cence.
In addition to the moisture availability, the quanti-
tative and qualitative changes in certain polyphenolic
defense compounds in plant tissues can interact with
other cellular metabolites, leading to the changes in
the resorption potential (Chapin & Kedrowski, 1983).
Plants experiencing moisture stress can upregulate
the acetate and shikimate pathway, leading to the
enhanced production of tannins (Bussotti et al. 1998,
Tharayil et al., 2011; Zhang et al., 2012), which are
polyphenols that can complex with proteins. In our
study, shikimic acid, the precursor of the phenyl-
propanoid pathway, was lowest in plants exposed to
climatic stress (Fig. 5), potentially indicating a
greater utilization of shikimate for the production of
phenylpropanoid protective compounds such as fla-
vonoids, lignins and tannins (Xu & Huang, 2012; Yu
et al., 2012; V. Suseela, unpublished results). In gen-
eral, trees grown in drought treatments at the BACE
had higher concentrations of tannins than those
grown in wet precipitation treatments (Tharayil et al.,
2011). Tannins can not only complex with cellular
proteins, preventing their hydrolysis, but also can
deactivate proteases that facilitate proteolysis during
senescence, thus limiting the RE of N. This argument
is supported by a robust negative correlation of the
concentration of tannins in green leaves of Q. rubra
sampled for the present study (S.M. Top, unpub-
lished results) and the observed RE of total N
(Fig. 9). Thus, the concomitant abundance of tannins
and soluble proteins in climatically stressed trees
could enhance tannin–protein complexation, which
interferes with the resorption of N. In addition, tan-
nins can complex with, and inactivate soil microbial
enzymes that facilitate litter decomposition (Trieb-
wasser et al., 2012). Although solvent-extractable
metabolites represent a smaller pool compared to the
structural matrix in litter (Berg & McClaugherty,
2008; Suseela et al., 2014b), the extractable metabolite
pool would have a disproportionate influence on tis-
sue decomposition because of their rapid bioavail-
ability to soil heterotrophs (Chapin & Kedrowski,
1983; Norby et al., 2000; Suseela et al., 2013). Thus,
the disparity in senesced tissues of the DH treatment
between the substantially depleted pool of extracta-
ble amino acids and the relatively high abundance
of tissue elemental N may indicate that these tissues
might have a lower initial decomposition rate, in
spite of their lower elemental C/N ratio. This pat-
tern of an initial lower rate of decomposition of lit-
ter from drought treatment sampled for the present
study was confirmed through lab (S.M. Top, unpub-
lished results), and field (V. Suseela, unpublished)
experiments.
Production and resorption of plant metabolites underclimatic stress: implications for climate–carbon feedbacks
The retranslocation of N from senesced tissues is an
important parameter in the land components of some
Earth system models (e.g., the Community Land
Fig. 9 Relationship between the resorption efficiency of total
elemental nitrogen and the tannin concentration in green leaves
of Quercus rubra across the six different climate treatments. Each
point represents values from a single experimental plot.
© 2015 John Wiley & Sons Ltd, Global Change Biology, doi: 10.1111/gcb.13033
16 V. SUSEELA et al.

Model 4.5; CLM; Oleson et al., 2013). In CLM, the
pool of retranslocated N from senescing tissues can
support new growth and is assumed to be propor-
tional to plant N demand, implying that plants with
high N demand also have high N resorption effi-
ciency. Our results suggest that this pool of retranslo-
cated N is also modulated by the climatic stress
experienced by the plants. Although the metabolic
demand for N would be higher in the wet treatments
to meet the high growth demand, compared to the
ambient (A0) treatment, we generally observed a
lower RE of N in the wet treatments both with
regard to extractable N metabolites (amino acids)
and elemental N. Our results also indicate that the
RE of N would be tightly regulated by the climatic
stress-induced production of biopolymeric defense
compounds, with climatic stress resulting in lower
resorption. Our study thus indicates that the differen-
tial response of climatic stresses on both production
and resorption of plant metabolites would ultimately
affect plant growth and the quality of litter available
for microbial decomposition. This could further influ-
ence nutrient availability and soil fertility, which
could in turn feed back to climate change. Further in
our study, the combination of drought and warming
increased the abundance of many metabolites in the
green tissues in a manner that would not have been
predicted from responses to either factor alone. Our
study thus emphasizes that the interactive effects of
combined stresses such as warming and drought on
plant metabolomics cannot be extrapolated from
responses to individual stress factors. Adequate sim-
ulation of these changes in climate–carbon models
could help to better forecast responses of terrestrial
ecosystems to future climates and their feedback to
warming. As multiple climatic stresses are becoming
more common under natural settings, understanding
plant physiological and metabolic responses to com-
bined stress factors would enable us to better predict
ecosystem functions and processes in a warmer
world.
Acknowledgements
The authors are grateful to Dr. Jordi Sardans for valuable andthoughtful comments. We thank Carol Goranson for maintain-ing the BACE site. We also thank Georgianna Scott and AmithMaroli for help with protein extraction and Sara Top for tanninanalysis. This research was supported by the National ScienceFoundation grant (DEB-1145993) to N. T., B. X. and J. S. D. andthe NSF Postdoctoral Research Fellowship in Biology (DBI-1306607) to V. S. The BACE infrastructure was constructed withsupport from NSF (DEB-0546670), and the project has beenmaintained with support from the U.S. Department of Energy’sOffice of Science (BER), through the Northeastern RegionalCenter of the National Institute for Climatic Change Research,
and through the Terrestrial Ecosystem Sciences program. Thisresearch article is Technical Contribution No. 6371 of the Clem-son University Experiment Station and the Purdue ClimateChange Research Center (No: 1517).
References
Abrams MD (2003) Where has all the white oak gone? BioScience, 53, 927–939.
Aerts R (1996) Nutrient resorption from senescing leaves of perennials: are there gen-
eral patterns? Journal of Ecology, 84, 597–608.
Ahmed S, Stepp JR, Orians C, et al. (2014) Effects of extreme climate events on tea
(Camellia sinensis) functional quality validate indigenous farmer knowledge and
sensory preferences in Tropical China. Plos One, 9, e109126.
Akashi K, Miyake C, Yokota A (2001) Citrulline, a novel compatible solute in
drought-tolerant wild watermelon leaves, is an efficient hydroxyl radical scav-
enger. FEBS Letters, 508, 438–442.
Alcazar R, Marco F, Cuevas JC et al. (2006) Involvement of polyamines in plant
response to abiotic stress. Biotechnology Letters, 28, 1867–1876.
Alcazar R, Altabella T, Marco F et al. (2010) Polyamines: molecules with regulatory
functions in plant abiotic stress tolerance. Planta, 231, 1237–1249.
An YA, Wan SQ, Zhou XH, Subedar AA, Wallace LL, Luo YQ (2005) Plant nitrogen
concentration, use efficiency, and contents in a tallgrass prairie ecosystem under
experimental warming. Global Change Biology, 11, 1733–1744.
Angelcheva L, Mishra Y, Antti H, Kjellsen TD, Funk C, Strimbeck RG, Schroder WP
(2014) Metabolomic analysis of extreme freezing tolerance in Siberian spruce
(Picea obovata). New Phytologist, 204, 545–555.
Arco JMD, Wang ZL, Yu WJ, Liu YM, Huang BR (2011) Differential metabolic
responses of perennial grass Cynodon transvaalensis 9 Cynodon dactylon (C-4) and
Poa Pratensis (C-3) to heat stress. Physiologia Plantarum, 141, 251–264.
Auyeung DSN, Suseela V, Dukes JS (2013) Warming and drought reduce temperature
sensitivity of nitrogen transformations. Global Change Biology, 19, 662–676.
Baerenfaller K, Massonnet C, Walsh S et al. (2012) Systems-based analysis of Ara-
bidopsis leaf growth reveals adaptation to water deficit. Molecular Systems Biology,
8, 606.
Bauerle WL, Oren R, Way DA et al. (2012) Photoperiodic regulation of the seasonal
pattern of photosynthetic capacity and the implications for carbon cycling. Proceed-
ings of the National Academy of Sciences of the United States of America, 109, 8612–8617.
Berg B, McClaugherty C (2008) Plant Litter: Decomposition, Humus Formation, Carbon
Sequestration. Springer-Verlag, Berlin, Germany.
Buchananwollaston V (1997) The molecular biology of leaf senescence. Journal of
Experimental Botany, 48, 181–199.
Bussotti F, Gravano E, Grossoni P, Tani C (1998) Occurrence of tannins in leaves of
beech trees (Fagus sylvatica) along an ecological gradient, detected by histochem-
ical and ultrastructural analyses. New Phytologist, 138, 469–479.
Caldana C, Degenkolbe T, Cuadros-Inostroza A et al. (2011) High-density kinetic
analysis of the metabolomic and transcriptomic response of Arabidopsis to eight
environmental conditions. Plant Journal, 67, 869–884.
Chapin FS, Kedrowski RA (1983) Seasonal-changes in nitrogen and phosphorus frac-
tions and autumn retranslocation in evergreen and deciduous taiga trees. Ecology,
64, 376–391.
Collier DE, Thibodeau BA (1995) Changes in respiration and chemical content during
autumnal senescence of populus-tremuloides and quercus-rubra leaves. Tree Phys-
iology, 15, 759–764.
Cotrufo MF, Wallenstein MD, Boot CM, Denef K, Paul E (2013) The Microbial Effi-
ciency-Matrix Stabilization (MEMS) framework integrates plant litter decomposi-
tion with soil organic matter stabilization: do labile plant inputs form stable soil
organic matter? Global Change Biology, 19, 988–995.
Crafts-Brandner SJ, Law RD (2000) Effect of heat stress on the inhibition and recovery
of the ribulose-1,5-bisphosphate carboxylase/oxygenase activation state. Planta,
212, 67–74.
Crafts-Brandner SJ, Salvucci ME (2000) Rubisco activase constrains the photosyn-
thetic potential of leaves at high temperature and CO2. Proceedings of the National
Academy of Sciences of the United States of America, 97, 13430–13435.
Cramer GR, Urano K, Delrot S, Pezzotti M, Shinozaki K (2011) Effects of abiotic stress
on plants: a systems biology perspective. BMC Plant Biology, 11, 1–14.
Dauwe R, Holliday JA, Aitken SN, Mansfield SD (2012) Metabolic dynamics during
autumn cold acclimation within and among populations of Sitka spruce (Picea
sitchensis). New Phytologist, 194, 192–205.
Delarco JM, Escudero A, Garrido MV (1991) Effects of site characteristics on nitrogen
retranslocation from senescing leaves. Ecology, 72, 701–708.
© 2015 John Wiley & Sons Ltd, Global Change Biology, doi: 10.1111/gcb.13033
METABOLOMICS OF NUTRIENT RESORPTION 17

Emmett BA, Beier C, Estiarte M et al. (2004) The response of soil processes to climate
change: results from manipulation studies of shrublands across an environmental
gradient. Ecosystems, 7, 625–637.
Estiarte M, Pe~nuelas J (2015) Alteration of the phenology of leaf senescence and fall in
winter deciduous species by climate change: effects on nutrient proficiency. Global
Change Biology, 21, 1005–1017.
Feller U, Anders I, Mae T (2008) Rubiscolytics: fate of Rubisco after its enzymatic
function in a cell is terminated. Journal of Experimental Botany, 59, 1615–1624.
Franklin O, Agren GI (2002) Leaf senescence and resorption as mechanisms of maxi-
mizing photosynthetic production during canopy development at N limitation.
Functional Ecology, 16, 727–733.
Freschet GT, Cornelissen JHC, Van Logtestijn RSP, Aerts R (2010) Substantial nutrient
resorption from leaves, stems and roots in a subarctic flora: what is the link with
other resource economics traits? New Phytologist, 186, 879–889.
Galston AW (1991) On the trail of a new regulatory system in plants. New Biologist, 3,
450–453.
Gargallo-Garriga A, Sardans J, P�erez-Trujillo M et al. (2015) Warming differentially
influences the effects of drought on stoichiometry and metabolomics in shoots and
roots. New Phytologist. doi:10.1111/nph.13377.
Gechev TS, Benina M, Obata T et al. (2013) Molecular mechanisms of desiccation tol-
erance in the resurrection glacial relic Haberlea rhodopensis. Cellular and Molecular
Life Sciences, 70, 689–709.
Gill SS, Tuteja N (2010) Reactive oxygen species and antioxidant machinery in abiotic
stress tolerance in crop plants. Plant Physiology and Biochemistry, 48, 909–930.
Groppa MD, Benavides MP (2008) Polyamines and abiotic stress: recent advances.
Amino Acids, 34, 35–45.
Guy C, Kaplan F, Kopka J, Selbig J, Hincha DK (2008) Metabolomics of temperature
stress. Physiologia Plantarum, 132, 220–235.
Han WX, Fang JY, Reich PB, Woodward FI, Wang ZH (2011) Biogeography and vari-
ability of eleven mineral elements in plant leaves across gradients of climate, soil
and plant functional type in China. Ecology Letters, 14, 788–796.
Hill J (1980) The remobilization of nutrients from leaves. Journal of Plant Nutrition, 2,
407–444.
Holtta T, Vesala T, Sevanto S, Peramaki M, Nikinmaa E (2006) Modeling xylem and
phloem water flows in trees according to cohesion theory and Munch hypothesis.
Trees-Structure and Function, 20, 67–78.
Huang BR, Xu CP (2008) Identification and characterization of proteins associated
with plant tolerance to heat stress. Journal of Integrative Plant Biology, 50, 1230–1237.
Iverson LR, Prasad AM, Hale BJ, Sutherland EK (1999) Atlas of Current and Potential
Future Distributions of Common Trees of the Eastern United States. Gen. Tech. Rep.
NE-265. U.S. Department of Agriculture, Forest Service, Northeastern Research
Station, Radnor, PA.
Kaplan F, Kopka J, Haskell DW et al. (2004) Exploring the temperature-stress metabo-
lome of Arabidopsis. Plant Physiology, 136, 4159–4168.
Kim K, Portis AR (2005) Temperature dependence of photosynthesis in Arabidopsis
plants with modifications in Rubisco activase and membrane fluidity. Plant and
Cell Physiology, 46, 522–530.
Kind T, Wohlgemuth G, Lee DY, Lu Y, Palazoglu M, Shahbaz S, Fiehn O (2009) Fiehn-
Lib: mass spectral and retention index libraries for metabolomics based on quad-
rupole and time-of-flight gas chromatography/mass spectrometry. Analytical
Chemistry, 81, 10038–10048.
Kobe RK, Lepczyk CA, Iyer M (2005) Resorption efficiency decreases with increasing
green leaf nutrients in a global data set. Ecology, 86, 2780–2792.
Lajtha K (1987) Nutrient reabsorption efficiency and the response to phosphorus fer-
tilization in the desert shrub Larrea-Tridentata (Dc) Cov. Biogeochemistry, 4, 265–
276.
Lisec J, Schauer N, Kopka J, Willmitzer L, Fernie AR (2006) Gas chromatography mass
spectrometry-based metabolite profiling in plants. Nature Protocols, 1, 387–396.
Llorens L, Penuelas J, Beier C, Emmett B, Estiarte M, Tietema A (2004) Effects of an
experimental increase of temperature and drought on the photosynthetic perfor-
mance of two ericaceous shrub species along a north-south European gradient.
Ecosystems, 7, 613–624.
Matysik J, Alia Bhalu B, Mohanty P (2002) Molecular mechanisms of quenching of
reactive oxygen species by proline under stress in plants. Current Science, 82, 525–
532.
McGroddy ME, Daufresne T, Hedin LO (2004) Scaling of C:N:P stoichiometry in for-
ests worldwide: implications of terrestrial redfield-type ratios. Ecology, 85, 2390–
2401.
Meyer RC, Steinfath M, Lisec J et al. (2007) The metabolic signature related to high
plant growth rate in Arabidopsis thaliana. Proceedings of the National Academy of
Sciences of the United States of America, 104, 4759–4764.
Mittler R (2006) Abiotic stress, the field environment and stress combination. Trends
in Plant Science, 11, 15–19.
Moore JA, Mika PG, Shaw TM (2000) Root chemistry of mature Douglas-fir differs by
habitat type in the interior northwestern United States. Forest Science, 46, 531–536.
Morot-Gaudry JF, Job D, Lea PJ (2001) Amino acid metabolism. In: Plant Nitrogen (eds
Lea PJ, Morot-Gaudry JF), pp. 167–212. Springer-Verlag, Berlin.
Mulder C, Ahrestani FS, Bahn M et al. (2013) Connecting the green and brown
worlds: allometric and stoichiometric predictability of above- and below-ground
networks. Advances in Ecological Research: Ecological Networks in an Agricultural
World, 49, 69–175.
Norby RJ, Luo YQ (2004) Evaluating ecosystem responses to rising atmospheric CO2
and global warming in a multi-factor world. New Phytologist, 162, 281–293.
Norby RJ, Long TM, Hartz-Rubin JS, O’Neill EG (2000) Nitrogen resorption in senesc-
ing tree leaves in a warmer, CO2-enriched atmosephere. Plant and Soil, 224, 15–29.
Norby RJ, Hartz-Rubin JS, Verbrugge MJ (2003) Phenological responses in maple to
experimental atmospheric warming and CO2 enrichment. Global Change Biology, 9,
1792–1801.
Oleson K, Lawrence DM, Bonan GB et al. (2013) Technical Description of version 4.5 of
the Community Land Model (CLM). NCAR Technical Note NCAR/TN-503+STR,
Boulder, Colorado.
Penuelas J, Filella I (2001) Phenology – responses to a warming world. Science, 294,
793–795.
Penuelas J, Sardans J, Estiarte M et al. (2013) Evidence of current impact of climate
change on life: a walk from genes to the biosphere. Global Change Biology, 19, 2303–
2338.
Pizzi A, Cameron FA (1986) Flavonoid tannins - structural wood components for
drought-resistance mechanisms of plants. Wood Science and Technology, 20, 119–
124.
Prescott CE (2010) Litter decomposition: what controls it and how can we alter it to
sequester more carbon in forest soils? Biogeochemistry, 101, 133–149.
Proietti P (1998) Gas exchange in senescing leaves of Olea europaea L. Photosynthetica,
35, 579–587.
Pugnaire FI, Chapin FS (1992) Environmental and physiological factors governing
nutrient resorption efficiency in barley. Oecologia, 90, 120–126.
Reed SC, Townsend AR, Davidson EA, Cleveland CC (2012) Stoichiometric patterns
in foliar nutrient resorption across multiple scales. New Phytologist, 196, 173–180.
Rejmankova E (2005) Nutrient resorption in wetland macrophytes: comparison across
several regions of different nutrient status. New Phytologist, 167, 471–482.
Rivas-Ubach A, Sardans J, Perez-Trujillo M, Estiarte M, Penuelas J (2012) Strong rela-
tionship between elemental stoichiometry and metabolome in plants. Proceedings
of the National Academy of Sciences of the United States of America, 109, 4181–4186.
Rivas-Ubach A, Gargallo-Garriga A, Sardans J et al. (2014) Drought enhances folivory
by shifting foliar metabolomes in Quercus ilex trees. New Phytologist, 202, 874–885.
Rivero RM, Kojima M, Gepstein A, Sakakibara H, Mittler R, Gepstein S, Blumwald E
(2007) Delayed leaf senescence induces extreme drought tolerance in a flowering
plant. Proceedings of the National Academy of Sciences of the United States of America,
104, 19631–19636.
Rizhsky L, Liang HJ, Mittler R (2002) The combined effect of drought stress and heat
shock on gene expression in tobacco. Plant Physiology, 130, 1143–1151.
Rizhsky L, Liang HJ, Shuman J, Shulaev V, Davletova S, Mittler R (2004) When
defense pathways collide. The response of Arabidopsis to a combination of
drought and heat stress. Plant Physiology, 134, 1683–1696.
Ruelland E, Zachowski A (2010) How plants sense temperature. Environmental and
Experimental Botany, 69, 225–232.
Sardans J, Penuelas J (2013) Tree growth changes with climate and forest type are
associated with relative allocation of nutrients, especially phosphorus, to leaves
and wood. Global Ecology and Biogeography, 22, 494–507.
Sardans J, Penuelas J, Estiarte M, Prieto P (2008a) Warming and drought alter C and
N concentration, allocation and accumulation in a Mediterranean shrubland. Glo-
bal Change Biology, 14, 2304–2316.
Sardans J, Penuelas J, Prieto P, Estiarte M (2008b) Drought and warming induced
changes in P and K concentration and accumulation in plant biomass and soil in a
Mediterranean shrubland. Plant and Soil, 306, 261–271.
Schreiber SG, Ding C, Hamann A, Hacke UG, Thomas BR, Brouard JS (2013) Frost
hardiness vs. growth performance in trembling aspen: an experimental test of
assisted migration. Journal of Applied Ecology, 50, 939–949.
Suseela V, Dukes JS (2013) The responses of soil and rhizosphere respiration to simu-
lated climatic changes vary by season. Ecology, 94, 403–413.
Suseela V, Conant RT, Wallenstein MD, Dukes JS (2012) Effects of soil moisture on
the temperature sensitivity of heterotrophic respiration vary seasonally in an old-
field climate change experiment. Global Change Biology, 18, 336–348.
© 2015 John Wiley & Sons Ltd, Global Change Biology, doi: 10.1111/gcb.13033
18 V. SUSEELA et al.

Suseela V, Tharayil N, Xing BS, Dukes JS (2013) Labile compounds in plant litter
reduce the sensitivity of decomposition to warming and altered precipitation. New
Phytologist, 200, 122–133.
Suseela V, Tharayil N, Xing BS, Dukes JS (2014a) Warming alters potential
enzyme activity but precipitation regulates chemical transformations in grass
litter exposed to simulated climatic changes. Soil Biology & Biochemistry, 75,
102–112.
Suseela V, Triebwasser-Freese D, Linscheid N, Morgan JA, Tharayil N (2014b) Litters
of photosynthetically divergent grasses exhibit differential metabolic responses to
warming and elevated CO2. Ecosphere, 5, art106.
Szabados L, Savoure A (2010) Proline: a multifunctional amino acid. Trends in Plant
Science, 15, 89–97.
Tamura M, Tharayil N (2014) Plant litter chemistry and microbial priming regulate
the accrual, composition and stability of soil carbon in invaded ecosystems. New
Phytologist, 203, 110–124.
Tharayil N, Suseela V, Triebwasser DJ, Preston CM, Gerard PD, Dukes JS (2011)
Changes in the structural composition and reactivity of Acer rubrum leaf litter tan-
nins exposed to warming and altered precipitation: climatic stress-induced tannins
are more reactive. New Phytologist, 191, 132–145.
Tjoelker MG, Reich PB, Oleksyn J (1999) Changes in leaf nitrogen and carbohydrates
underlie temperature and CO2 acclimation of dark respiration in five boreal tree
species. Plant, Cell and Environment, 22, 767–778.
Top SM, Filley TR (2014) Effects of elevated CO2 on the extractable amino acids of leaf
litter and fine roots. New Phytologist, 202, 1257–1265.
Triebwasser DJ, Tharayil N, Preston CM, Gerard PD (2012) The susceptibility of
soil enzymes to inhibition by leaf litter tannins is dependent on the tannin
chemistry, enzyme class and vegetation history. New Phytologist, 196, 1122–
1132.
Urano K, Maruyama K, Ogata Y et al. (2009) Characterization of the ABA-regulated
global responses to dehydration in Arabidopsis by metabolomics. The Plant Jour-
nal, 57, 1065–1078.
Van Heerwaarden LM, Toet S, Aerts R (2003) Nitrogen and phosphorus resorption
efficiency and proficiency in six sub-arctic bog species after 4 years of nitrogen fer-
tilization. Journal of Ecology, 91, 1060–1070.
Vasquez-Robinet C, Mane SP, Ulanov AV et al. (2008) Physiological and molecular
adaptations to drought in Andean potato genotypes. Journal of Experimental Botany,
59, 2109–2123.
Vergutz L, Manzoni S, Porporato A, Novais RF, Jackson RB (2012) Global resorption
efficiencies and concentrations of carbon and nutrients in leaves of terrestrial
plants. Ecological Monographs, 82, 205–220.
Vierstra RD (1993) Protein-degradation in plants. Annual Review of Plant Physiology
and Plant Molecular Biology, 44, 385–410.
Vile D, Pervent M, Belluau M et al. (2012) Arabidopsis growth under prolonged high
temperature and water deficit: independent or interactive effects? Plant, Cell and
Environment, 35, 702–718.
Wang G, Zhang JS, Wang GF et al. (2014) Proline responding 1 plays a critical role in
regulating general protein synthesis and the cell cycle in maize. Plant Cell, 26,
2582–2600.
Weih M, Karlsson PS (2001) Growth response of Mountain birch to air and soil tem-
perature: is increasing leaf-nitrogen content an acclimation to lower air tempera-
ture? New Phytologist, 150, 147–155.
Xia JG, Mandal R, Sinelnikov IV, Broadhurst D, Wishart DS (2012) MetaboAnalyst
2.0-a comprehensive server for metabolomic data analysis. Nucleic Acids Research,
40, W127–W133.
Xu CP, Huang BR (2012) Proteins and metabolites regulated by Trinexapac-ethyl in
relation to drought tolerance in Kentucky bluegrass. Journal of Plant Growth Regula-
tion, 31, 25–37.
Yu JJ, Du HM, Xu M, Huang BR (2012) Metabolic responses to heat stress under ele-
vated atmospheric CO2 concentration in a cool-season grass species. Journal of the
American Society for Horticultural Science, 137, 221–228.
Yuan ZY, Chen HYH (2009) Global trends in senesced-leaf nitrogen and phosphorus.
Global Ecology and Biogeography, 18, 759.
Yuan ZY, Li LH, Han XG, Huang JH, Wan SQ (2005) Foliar nitrogen dynamics and
nitrogen resorption of a sandy shrub Salix gordejevii in northern China. Plant and
Soil, 278, 183–193.
Zhang LH, Shao HB, Ye GF, Lin YM (2012) Effects of fertilization and drought stress
on tannin biosynthesis of Casuarina equisetifolia seedlings branchlets. Acta Physiolo-
giae Plantarum, 34, 1639–1649.
Supporting Information
Additional Supporting Information may be found in the online version of this article:
Figure S1. Specific leaf area of green and senesced leaves of Quercus rubra exposed to six different climatic treatments. (A0, ambientprecipitation + no warming; AH, ambient precipitation + high warming; W0, wet precipitation + no warming; WH, wet precipita-tion + high warming; D0, dry precipitation + no warming; DH, dry precipitation + high warming).Figure S2. Principal component analysis of the relative intensities of 100 plant metabolites of Quercus rubra exposed to six differentclimatic treatments (A0, ambient precipitation + no warming; AH, ambient precipitation + high warming; W0, wet precipita-tion + no warming; WH, wet precipitation + high warming; D0, dry precipitation + no warming; DH, dry precipitation + highwarming).
© 2015 John Wiley & Sons Ltd, Global Change Biology, doi: 10.1111/gcb.13033
METABOLOMICS OF NUTRIENT RESORPTION 19
All in-text references underlined in blue are linked to publications on ResearchGate, letting you access and read them immediately.