Embed Size (px)
Citation preview

© Edgenuity, Inc. 1
Warm-Up Weather Forecasting
Lesson Question
?
WK2 Words to Know
Fill in this table as you work through the lesson. You may also use the glossary to help you.
automated describing a process by which , instead of humans, complete tasks
isobar a line connecting points of equal pressure on a weather map
isoline a line connecting points of or equal value on a map
isotherm a line connecting points of equal air on a weather map
meteorologist a scientist who studies and forecasts
meteorology the study of atmosphere
radara device used to determine the location and speed of
Lesson Goals
Describe basic elements of
.
Describe what information can be
gained from a map.

© Edgenuity, Inc. 2
Warm-Up Weather Forecasting
Weather Forecasts
Weather forecasts provide information about the weather several days in
.
Day Description Temperature Precipitation Wind Humidity
Friday Cloudy 67°/47° 50%NNE 10
mph85%
Saturday Mostly Sunny 72°/53° 0% N 6 mph 50%
Sunday Cloudy 78°/55° 80%WNW
13 mph
95%
• The higher the percentage of , the more likely it will rain.
• The letters represent the . So N means north, and E means East.
• The is the amount of water vapor that’s in the air. The higher
the , the more uncomfortable it feels outside.

© Edgenuity, Inc. 3
2Slide
Weather ForecastingInstruction
Meteorology
Meteorology is the study of Earth’s .
• Weather
• Weather
• A meteorologist is a scientist who studies and forecasts weather.
• Makes observations
• Uses data from instruments
Making Observations
One key way to observe the atmosphere is to watch changes in .
• Other important factors to observe include:
• speed and .
• temperature.
• air .
• humidity.

© Edgenuity, Inc. 4
Weather ForecastingInstruction
2Slide
4
Using Data from Instruments
Meteorologists collect data using a variety of instruments.
• Weather , satellites, and weather are
sources of data.
• Maps, charts, and are used to analyze weather data
to prepare forecasts.
• is used to locate and track storms and to follow the path
of storm systems.
• Information in weather reports often comes from the National Weather Service.
Weather Technology
WEATHER BALLOONS
Weather balloons are a source of data for weather .
• Help scientists study atmosphere to learn about weather all over the world
• Measure air pressure, , , and wind speed and direction
• Collect data that changes in the and
warn about severe weather

© Edgenuity, Inc. 5
Weather ForecastingInstruction
4Slide
Weather Technology
SATELLITES
Satellites help monitor and predict weather and events.
• valuable data on developing weather systems
• Collect data for weather, climate, and environmental monitoring
• Enable - to ten-day weather forecasts
Weather Technology
AUTOMATED WEATHER STATIONS
An automated weather station records atmospheric .
• Measurements are transmitted automatically to a central .
• Automated Surface Observing Systems (ASOS) is the nation’s primary
weather-observing .

© Edgenuity, Inc. 6
Weather ForecastingInstruction
4Slide
6
Weather Technology
COMPUTER FORECASTS
Computers combine data from multiple sources to help meteorologists create forecasts.
• The most common computer forecast model is called weather prediction (NWP).
• NWP compiles data from weather balloons, satellites, weather
, and observations.
• The NWP model uses equations to show what
will happen to the atmosphere if temperature, air pressure, or humidity change.
Weather Forecasts
Forecasts today are much more accurate than in the past.
• forecasting—five days or fewer—are fairly
accurate.
• predictions—more than 10 days—are somewhat
accurate.
• Greater in forecasts is due to improvements in
.

© Edgenuity, Inc. 7
Weather ForecastingInstruction
6Slide
9
Limitations of Long-Range Predictions
Accurate long-range predictions are still unlikely due to the “ effect.”
• Even changes in the atmosphere can cause
changes later.
Weather Maps
Weather maps display atmospheric conditions.
• Use symbols to show these conditions
• Help with research and weather
Many weather maps are produced by the National Weather Service.

© Edgenuity, Inc. 8
Weather ForecastingInstruction
9Slide
Isolines
An isoline is a line on a map that connects points of value.
An is a line connecting
points of equal air pressure on a weather map.
An is a line
connecting points of equal air temperature on a weather map.
Newspaper Weather Maps
Newspaper weather maps are versions of weather maps.
• These maps use standard for:
• fronts.
• high and low areas.
• types of .
• temperatures.
© Edgenuity, Inc. 9
Weather ForecastingInstruction
11Slide
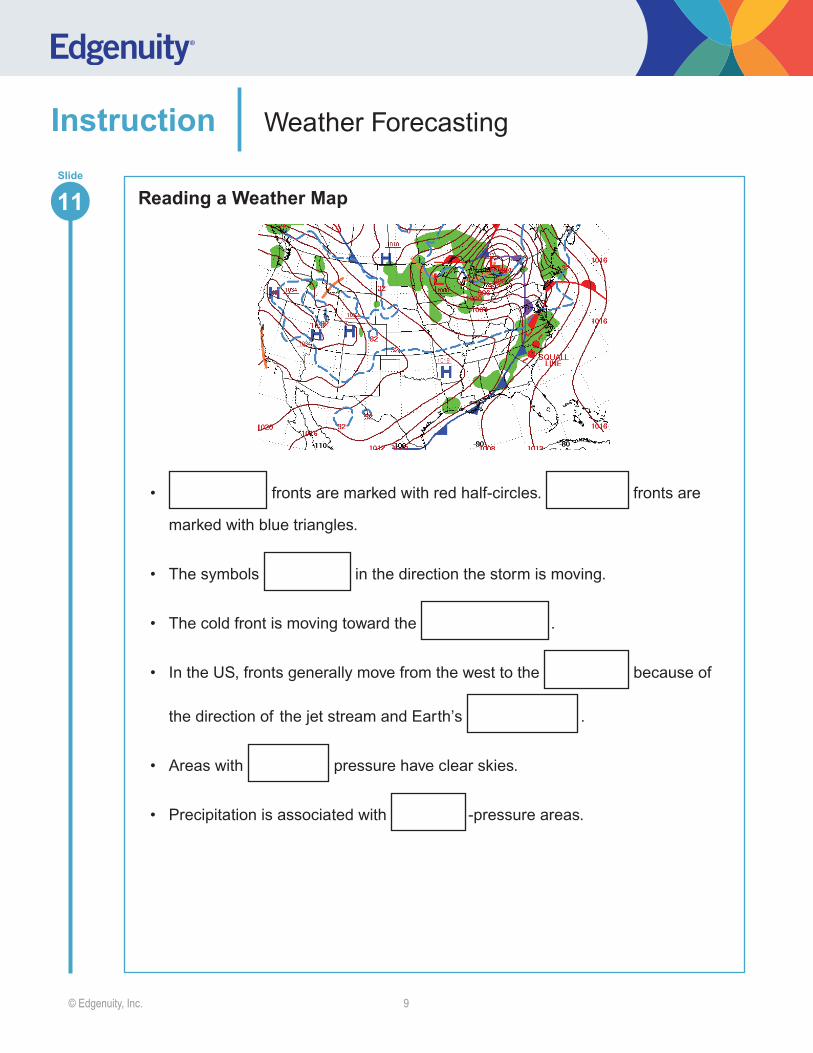
Reading a Weather Map
• fronts are marked with red half-circles. fronts are
marked with blue triangles.
• The symbols in the direction the storm is moving.
• The cold front is moving toward the .
• In the US, fronts generally move from the west to the because of
the direction of the jet stream and Earth’s .
• Areas with pressure have clear skies.
• Precipitation is associated with -pressure areas.

© Edgenuity, Inc. 10
Weather ForecastingInstruction
11Slide
Reading a Weather Map
Draw a circle around the warm front in the image.
Draw a square around the cold front in the image.
Reading a Weather Map
Some weather maps provide more detailed data, including:
• wind and
.
• pressure.
• temperature.
• weather .

© Edgenuity, Inc. 11
Summary Weather Forecasting
?
Answer
Review: Key Concepts
Maps
• Meteorologists use instruments to collect data from direct observations.
• The instruments include weather balloons, satellites, weather stations, computer forecasts, and radar.
• The accuracy of short-range and long-range weather forecasts varies.
• Weather service maps use global data including isotherms, isobars, and other isolines.
• Newspaper maps are simplified versions of weather service maps.
Lesson Question How do scientists forecast the weather?
2Slide

© Edgenuity, Inc. 12
Summary Weather Forecasting
Use this space to write any questions or thoughts about this lesson.