Embed Size (px)
Citation preview

Warm Up
Read the Starbucks article and answer the questionsHave the ticket out from
last class.We’ll go over the answers
Current Events
• http://www.bbc.co.uk/news/business-24515290
• http://www.bbc.co.uk/news/world-middle-east-24517595

What is supply?Supply is the different quantities of a good that sellers are willing and able to sell (produce) at different prices.
What is the Law of Supply?• As price increases, the quantity producers make
increases• As price falls, the quantity producers make falls.
THIS IS THE OPPOSITE OF DEMAND
Why? Because, at higher prices profit seeking firms have an incentive to produce more.
3

GRAPHING SUPPLY EXAMPLE
Qo
$5
4
3
2
1
Price of Cereal
Quantity of Cereal
Supply Schedule
10 20 30 40 50 60 70 80
4
PriceQuantitySupplied
$5 50
$4 40
$3 30
$2 20
$1 10

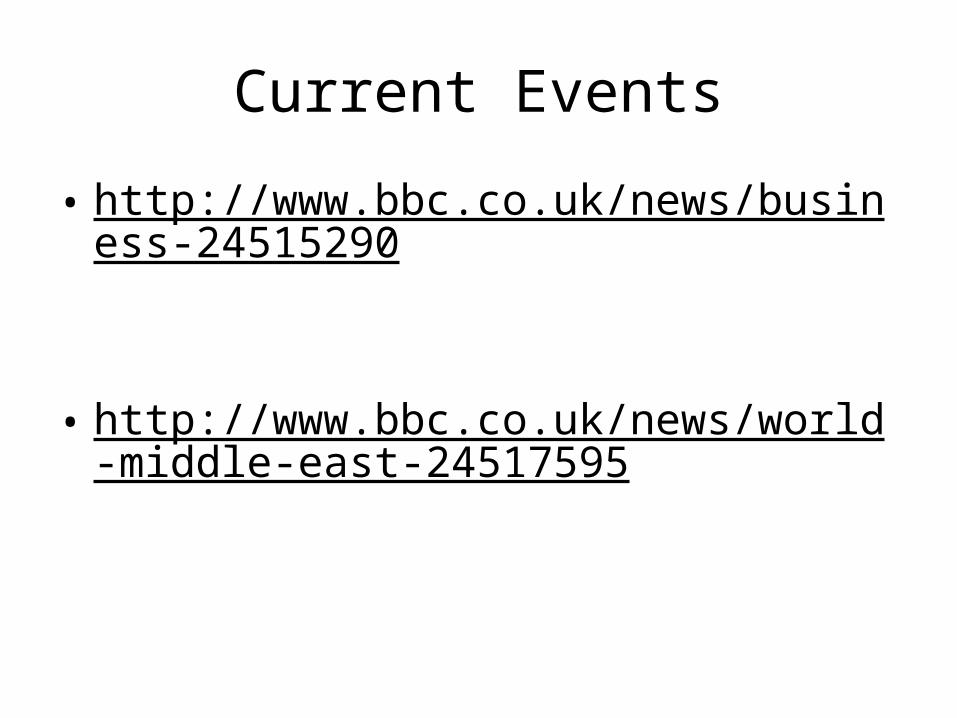
GRAPHING SUPPLY
Qo
$5
4
3
2
1
Price of Cereal
Quantity of Cereal
Supply Schedule
10 20 30 40 50 60 70 80
5
PriceQuantitySupplied
$5 50
$4 40
$3 30
$2 20
$1 10
Supply

• As with demand, market supply is arrived at by horizontally adding up the individual supplies of all of the firms in the market.

• It is important to distinguish between a change in supply (meaning a SHIFT) of the supply curve and MOVEMENT along the supply curve.
• SHIFT is caused by one of five factors or determinants other than price.
• MOVEMENT is caused merely by the change in price.

There are 5 Determinants (SHIFTERS) of Supply
1. Change in Expectations of Future Profits
2. Change in number of Sellers (Producers)
3. Change in Technology
4. Change in price of Related Goods or Services
5. Prices/Availability of Inputs (resources)
REFER TO THESE AS T.I.R.E.S.6. Subsidies and Taxes
8
GRAPHING SUPPLY
Qo
$5
4
3
2
1
Price of Cereal
Quantity of Cereal
Supply Schedule
10 20 30 40 50 60 70 80
9
PriceQuantitySupplied
$5 50
$4 40
$3 30
$2 20
$1 10
Supply
For Example: What if new companies start making
Cereal Because they see the Profit Potential?(new producer)

Change in Supply
Qo
$5
4
3
2
1
Price of Cereal
Quantity of Cereal
Supply Schedule
10 20 30 40 50 60 70 80
10
SupplyS2
PriceQuantitySupplied
$5 50 70
$4 40 60
$3 30 50
$2 20 40
$1 10 30
Increase in SupplyPrices didn’t change but there is
MORE cereal produced

Change in Supply
Qo
$5
4
3
2
1
Price of Cereal
Quantity of Cereal
Supply Schedule
10 20 30 40 50 60 70 80
11
PriceQuantitySupplied
$5 50
$4 40
$3 30
$2 20
$1 10
Supply
Or, What if a Drought Comes and Destroys the Corn and Wheat
Crops used to make cereal?(increased cost of inputs)

Change in Supply
Qo
$5
4
3
2
1
Price of Cereal
Quantity of Cereal
Supply Schedule
10 20 30 40 50 60 70 80
12
SupplyS2
PriceQuantitySupplied
$5 50 30
$4 40 20
$3 30 10
$2 20 1
$1 10 0
Decrease in SupplyPrices didn’t change but there is
LESS cereal produced
Shifters handout!! (this looks familiar…)

Supply PracticeFirst, identify the determinant (shifter) then
decide if supply will increase or decrease
ShifterIncrease or Decrease Left or Right
1
2
3
4
5
6

Lets Try Some Examples
Sale of Hamburger Meat by Producer Company
1. Mad cow disease kills 20% of cows 2. Price of burgers increase 30%3. Restaurants sell both burgers and tacos.
Demand increases for tacos 500%4. New technology cuts production time in half5. Minimum wage increases to $106. Government increases tax on hamburgers Try this now with a partner!
1. Which determinant (SHIFTER)?2. Increase or decrease of Supply?3. Which direction will curve shift?
15

Supply PracticeFirst, identify the determinant (shifter) then
decide if supply will increase or decrease
16
ShifterIncrease or Decrease Left or Right
1 Input Decrease Left
2 None
3 Related Good Increase Right
4 Technology Increase Right
5 Input Increase Right
6 Tax Decrease Left

http://www.ted.com/talks/andras_forgacs_leather_and_meat_without_killing_animals.html
Think about which TIRES this is and WHY!

Need a visual?

Poster Creation
Using the phrases/terms, create posters for the room to help us remember AP Macroeconomics
Example: Are you on your PPC today?Include a nonlinguistic representation

Warm Up

Putting Supply and Demand Together
Krugman’s Module 7
Demand / Supply

Market Equilibrium
• A market will determine the price at which the quantity of a product demanded is equal to the quantity supplied.
• At this price, the market will be in equilibrium, meaning that the amount consumers wish to purchase at this price is matched exactly by the amount producers wish to sell.

TO DETERMINE EQUILIBRIUM NEED TO GRAPH SUPPLY AND DEMAND TOGETHER
• Equilibrium occurs when quantity supplied exactly equals quantity demanded.
D
SPrice
Quantity
Qo
$5
4
3
2
1
PDemand Schedule
10 20 30 40 50 60 70 80
P Qd
$5 10
$4 20
$3 30
$2 50
$1 80
D
SSupply
Schedule
P Qs
$5 50
$4 40
$3 30
$2 20
$1 10
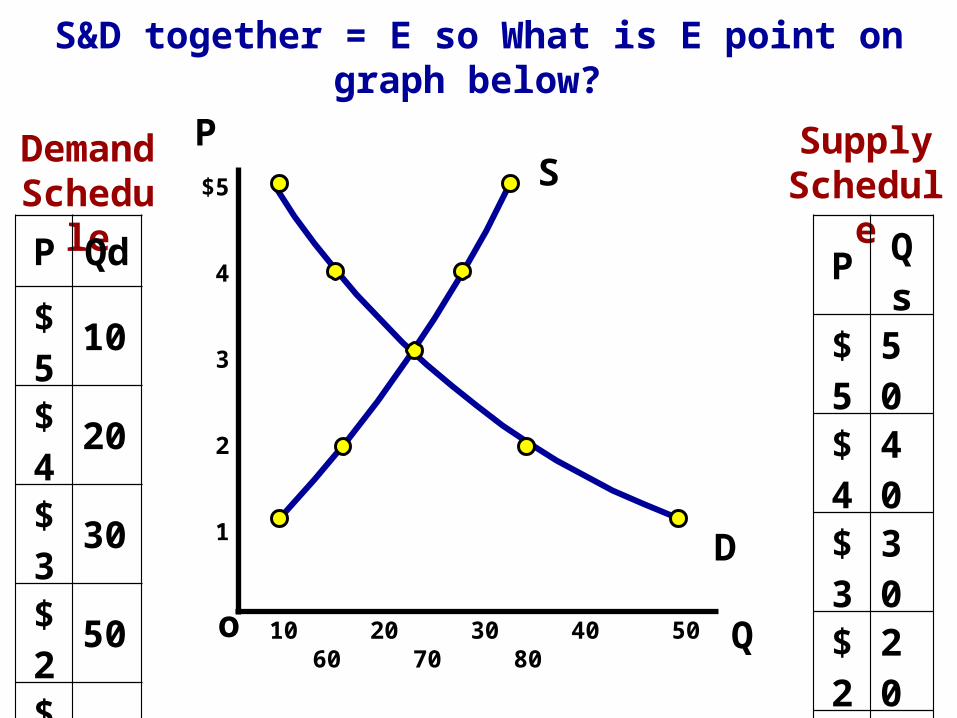
S&D together = E so What is E point on graph below?

Qo
$5
4
3
2
1
PDemand Schedule
10 20 30 40 50 60 70 80
P Qd
$5 10
$4 20
$3 30
$2 50
$1 80
Supply Schedule
P Qs
$5 50
$4 40
$3 30
$2 20
$1 10
Equilibrium Price = $3 (Qd=Qs)
Equilibrium Quantity is 30
D
S

Qo
$5
4
3
2
1
PDemand Schedule
10 20 30 40 50 60 70 80
26
P Qd
$5 10
$4 20
$3 30
$2 50
$1 80
Supply Schedule
P Qs
$5 50
$4 40
$3 30
$2 20
$1 10
D
S
What if the price increases to $4?

Qo
$5
4
3
2
1
PDemand Schedule
10 20 30 40 50 60 70 80
27
P Qd
$5 10
$4 20
$3 30
$2 50
$1 80
Supply Schedule
P Qs
$5 50
$4 40
$3 30
$2 20
$1 10
D
S
At $4, there is disequilibrium. The quantity demanded is less than quantity supplied.
Surplus (Qd<Qs)
How much is the surplus at $4?
Answer: 20

Qo
$5
4
3
2
1
PDemand Schedule
10 20 30 40 50 60 70 80
28
P Qd
$5 10
$4 20
$3 30
$2 50
$1 80
Supply Schedule
P Qs
$5 50
$4 40
$3 30
$2 20
$1 10
D
S
Answer: 40What if the price decreases to $2?

Qo
$5
4
3
2
1
PDemand Schedule
10 20 30 40 50 60 70 80
29
P Qd
$5 10
$4 20
$3 30
$2 50
$1 80
Supply Schedule
P Qs
$5 50
$4 40
$3 30
$2 20
$1 10
D
S
At $2, there is disequilibrium. The quantity demanded is greater than quantity supplied.
Shortage(Qd>Qs)
How much is the shortage at $2?
Answer: 30

Qo
$5
4
3
2
1
PDemand Schedule
10 20 30 40 50 60 70 80
30
P Qd
$5 10
$4 20
$3 30
$2 50
$1 80
Supply Schedule
P Qs
$5 50
$4 40
$3 30
$2 20
$1 10
D
SWhen there is a
surplus, producers lower prices
The FREE MARKET system automatically pushes the price toward equilibrium.
When there is a shortage, producers
raise prices

Always Assume shifts in supply or demand change equilibrium P and Q instantaneously
31

Learning to Diagram the Change is Easy as 1, 2, 31. Before the change:
• Draw supply and demand • Label original equilibrium price and quantity
2. The change: • Did it affect supply or demand first?• Which determinant caused the shift? • Draw increase or decrease
3. After change: • Label new equilibrium?• What happens to Price? (increase or decrease)• What happens to Quantity? (increase or decrease)

Analyze Sale of Hamburgers Again (getting hungry yet?)WHAT IS THE RESULT FROM CHANGES BELOW
1. Price of sushi (a substitute) increases2. New technology cuts production time 1/23. Price of burgers falls from $3 to $1. 4. Price for ground beef triples5. Fingers found in multiple burger restaurants.
1. Before Change (Draw equilibrium) 2. The Change (S or D, Identify Shifter)3. After Change (Price and Quantity After)

1. Price of sushi (a substitute) increases D increases
2. New technology cuts production time ½ S increases
3. Price of burgers falls from $3 to $1. no shift
4. Price for ground beef triples s decreases
5. Fingers found in multiple burger restaurants. D decreases

ANOTHER EXAMPLE USING COFFEE TO GO WITH YOUR BURGER

A price above equilibrium creates a surplus

A price below equilibrium creates a shortage

• Increase in demand =‘s higher equilibrium price and a higher equilibrium quantity.
• Decrease in demand =‘s lower equilibrium price and a lower equilibrium quantity.
• Increase in supply =‘s lower equilibrium price and a higher equilibrium quantity.
• Decrease in supply =‘s higher equilibrium price and a lower equilibrium quantity.
For Example
• An increase in the supply of grapes and a decrease in the demand for wine led to lower wine prices in 2001.
• An increase in the price of jumbo tires used on mining equipment led to higher prices for copper, coal, and zinc in 2006.

The equilibrium price aka the market-clearing price.
• When supply and demand change, equilibrium price and output change.
• When only one curve shifts, the resulting changes in equilibrium price and quantity can be predicted.
• But when both curves shift, we can only predict the change in equilibrium price in some cases, and the change in equilibrium quantity in others, but never both.

Use a S&D graph to explain this double shift

Answer the following Question
• The price of cameras decreases and people buy more cameras, this can be explained by:
A) an increase in demand for cameras.B) an increase in the supply of cameras.C) a decrease in demand for cameras.D) A decrease in the supply of cameras.

• The price of cameras decreases and people buy more cameras, this can be explained by:
A) an increase in demand for cameras.B) an increase in the supply of cameras. Correct!C) a decrease in demand for cameras.D) A decrease in the supply of cameras.

Consumer Surplus is the difference between what you are willing to pay and what you actually pay.
CS = Buyer’s Maximum – Price
Producer’s Surplus is the difference between the price the seller received and how much they were willing to sell it for.
PS = Price – Seller’s Minimum
Voluntary Exchange Terms
44

Government Involvement
Module 8 & 9#1-Price Controls: Floors and Ceilings#2-Import Quotas#3-Subsidies#4-Excise Taxes#5-Quantity Controls
45

So Far We Have Been Discussing Voluntary Exchanges But What if the Government Got Involved to Remove
The Voluntary Component?
46

So Why are there Price Ceilings (aka Maximum Legal Prices)
• Political Pressure• Persistent Shortage of a Good or Service• Continuing Black Market (illegal) Activity------------------------------------------------------------Examples of Price Ceilings include
1. WWII Wage Controls2. Oil Shortages in the 1970s3. NYC Rent Controlled Apartments

So Why are there Price Controls (aka Minimum or Floor Prices)
• Political Pressure• Lack of Economic Understanding• Benefit Some------------------------------------------------------------Examples of Price Controls include
1. Agriculture (Farm Products)2. Minimum Wage3. Air Travel (until the 1980s)

KEY TO PRICE CONTROLS AND CEILINGS
• IF the assumption is that markets are operating efficiently before any government intervention then such interventions will cause problems
• IF markets were operating inefficiently then such interventions might not cause problems and could move the market closer to efficiency.

Practice Questions1. Which of the following will occur if a legal price floor is
placed on a good below its free market equilibrium?A. Surpluses will developB. Shortages will developC. Underground markets will developD. The equilibrium price will remain the sameE. The quantity sold will increase
A. A price ceiling causes a shortage if the ceiling price is above the equilibrium priceB. A price floor causes a surplus if the price floor is below the equilibrium priceC. Price ceilings and price floors result in a misallocation of resources D. Price floors above equilibrium cause a shortage
2. Which of the following statements about price control is true?
50

1. Which of the following will occur if a legal price floor is placed on a good below its free market equilibrium?
A. Surpluses will developB. Shortages will developC. Underground markets will developD. The equilibrium price will remain the same {Correct}E. The quantity sold will increase
A. A price ceiling causes a shortage if the ceiling price is above the equilibrium priceB. A price floor causes a surplus if the price floor is below the equilibrium priceC. Price ceilings and price floors result in a misallocation of resources {Correct}D. Price floors above equilibrium cause a shortage
2. Which of the following statements about price control is true?
51

#2 Import Quotas
A quota is a limit on the number of imports. The government sets the maximum amount that
can come in the country.Purpose:•To protect domestic producers from a cheaper world price.•To prevent domestic unemployment

International Trade and QuotasIdentify the following:1. CS with no trade2. PS with no trade3. CS if we trade at world
price (PW)4. PS if we trade at world
price (PW)5. Amount we import at
world price (PW)6. If the government sets
a quota on imports of Q4 - Q2, what happens to CS and PS?
This graphs show the domestic supply and demand for grain. The letters represent areas or
countries
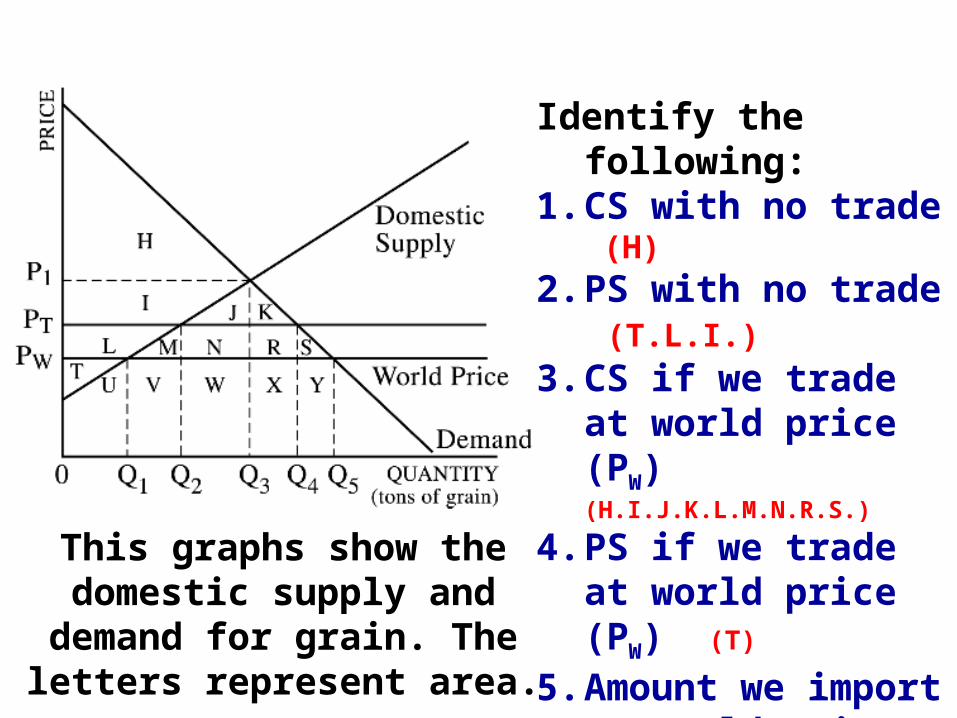
Identify the following:1. CS with no trade (H)2. PS with no trade (T.L.I.)3. CS if we trade at world
price (PW) (H.I.J.K.L.M.N.R.S.)
4. PS if we trade at world price (PW) (T)
5. Amount we import at world price (PW) (Q5-Q1)
6. If the government sets a quota on imports of Q4 - Q2, what happens to CS and PS? (CS smaller and PS bigger)
This graphs show the domestic supply and demand for grain.
The letters represent area.

#3 Subsidies
The government just gives producers money.The goal is for them to make more of the goods that the government “thinks” are important or “politically are necessary for re-election.”
Ex:•Agriculture (to prevent famine)•Pharmaceutical Companies•Environmentally Safe Vehicles•FAFSA (for you guys going to
college)
55

Result of Subsidies to Corn Producers
Qo
Price of Corn
Quantity of Corn 56
SS Subsidy
Price DownQuantity Up
Everyone Wins, Right?
NO
Pe
P1
Qe Q1
D


#4 Excise Taxes
Excise Tax = A per unit tax on producersThis is similar to a Sales Tax that is Put on Consumers
For every unit made, the producer must pay $The goal is for them to make less of the goods that the government deems dangerous or unwanted.
Ex:•Cigarettes “sin tax”•Alcohol “sin tax”•Tariffs on imported goods•Environmentally Unsafe Products
58

Before Excise Tax There is Equilibrium
Qo
$5
4
3
2
1
P
59
Supply Schedule
P Qs
$5 140
$4 120
$3 100
$2 80
$1 60 D
S
40 60 80 100 120 140
But Then Government sets a $2 per unit tax on Cigarettes

Result of Excise Tax
Qo
$5
4
3
2
1
P
60
Supply Schedule
P Qs
$5 $7 140
$4 $6 120
$3 $5 100
$2 $4 80
$1 $3 60 D
S
40 60 80 100 120 140
Tax is the vertical distance between
supply curves
STax

Quantity Controls or Quotas Regulate Amount that can be bought or sold of a Good but this causes a WEDGE between demand price and supply price.

• There are many side effects to Quantity Controls or Quotas on Prices:
1. Missed Opportunities (inefficiencies)
2. Lost Gains from the Missed Opportunities(aka Dead Weight Loss)
3. Encourage Evasion (aka law breaking)
As example: Lets consider NYC Taxicabs

MARKET FOR TAXI RIDES WITHOUT GOVERNMENT CONTROLS

Effect of a Quota on the Market for Taxi Rides