Embed Size (px)
Citation preview

Warm Up1. Graph the inequality y < 2x + 1.
Solve using any method.2. x2 – 16x + 63 = 0
3. 3x2 + 8x = 3
7, 9
Solve quadratic inequalities by using tables and graphs.
Solve quadratic inequalities by using algebra.
Objectives
quadratic inequality in two variables
Vocabulary
Many business profits can be modeled by quadratic functions. To ensure that the profit is above a certain level, financial planners may need to graph and solve quadratic inequalities.
A quadratic inequality in two variables can be written in one of the following forms, where a, b, and c are real numbers and a ≠ 0. Its solution set is a set of ordered pairs (x, y).
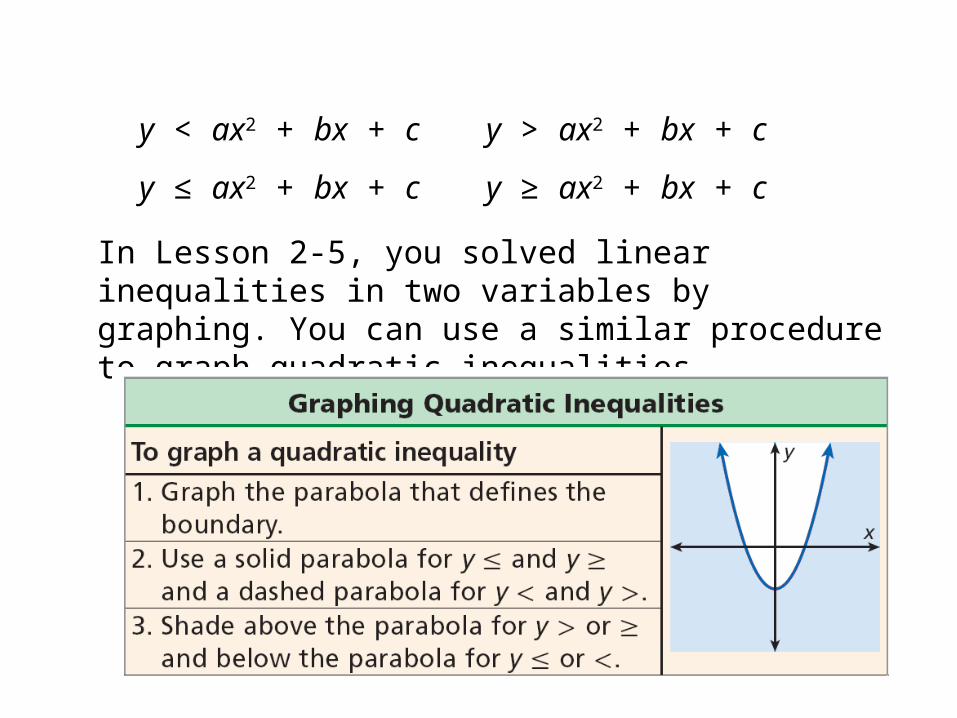
In Lesson 2-5, you solved linear inequalities in two variables by graphing. You can use a similar procedure to graph quadratic inequalities.
y < ax2 + bx + c y > ax2 + bx + c
y ≤ ax2 + bx + c y ≥ ax2 + bx + c
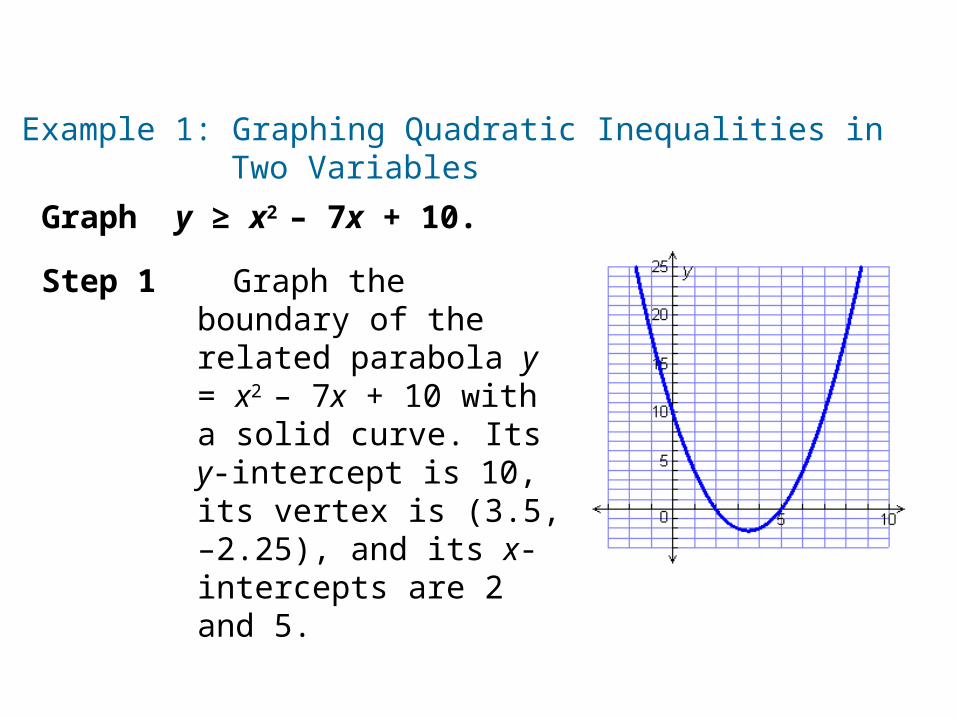
Graph y ≥ x2 – 7x + 10.
Example 1: Graphing Quadratic Inequalities in Two Variables
Step 1 Graph the boundary of the related parabola y = x2 – 7x + 10 with a solid curve. Its y-intercept is 10, its vertex is (3.5, –2.25), and its x-intercepts are 2 and 5.
Example 1 Continued
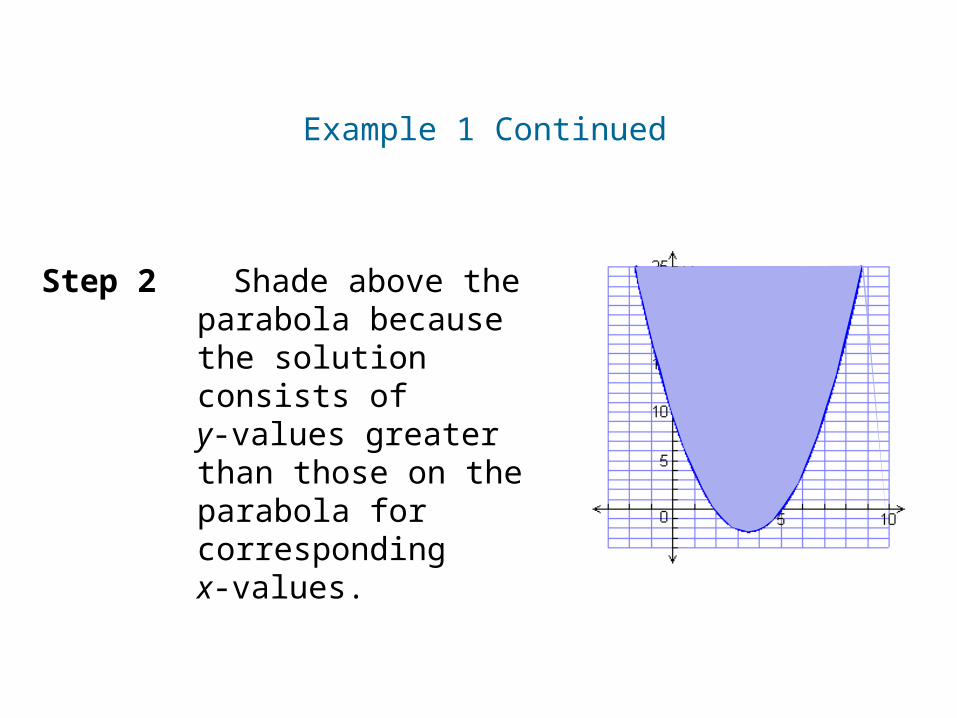
Step 2 Shade above the parabola because the solution consists of y-values greater than those on the parabola for corresponding x-values.
Example 1 Continued
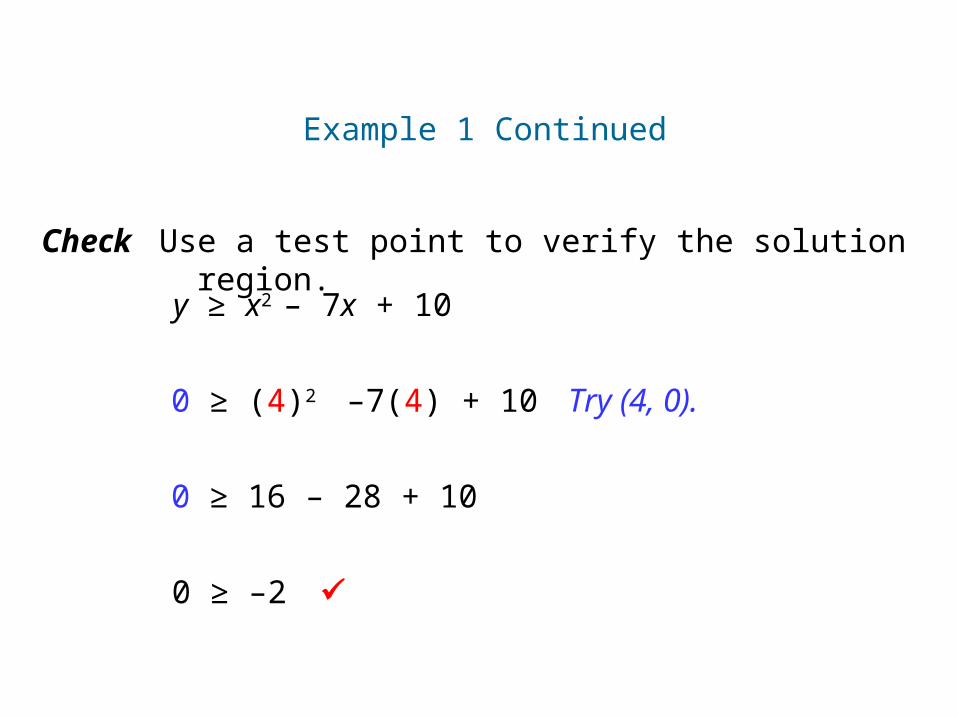
Check Use a test point to verify the solution region.
y ≥ x2 – 7x + 10
0 ≥ (4)2 –7(4) + 10
0 ≥ 16 – 28 + 10
0 ≥ –2
Try (4, 0).

Graph the inequality.
Step 1 Graph the boundary of the related parabola
y = 2x2 – 5x – 2 with a solid curve. Its y-intercept is –2, its vertex is (1.3, –5.1), and its x-intercepts are –0.4 and 2.9.
Check It Out! Example 1a
y ≥ 2x2 – 5x – 2
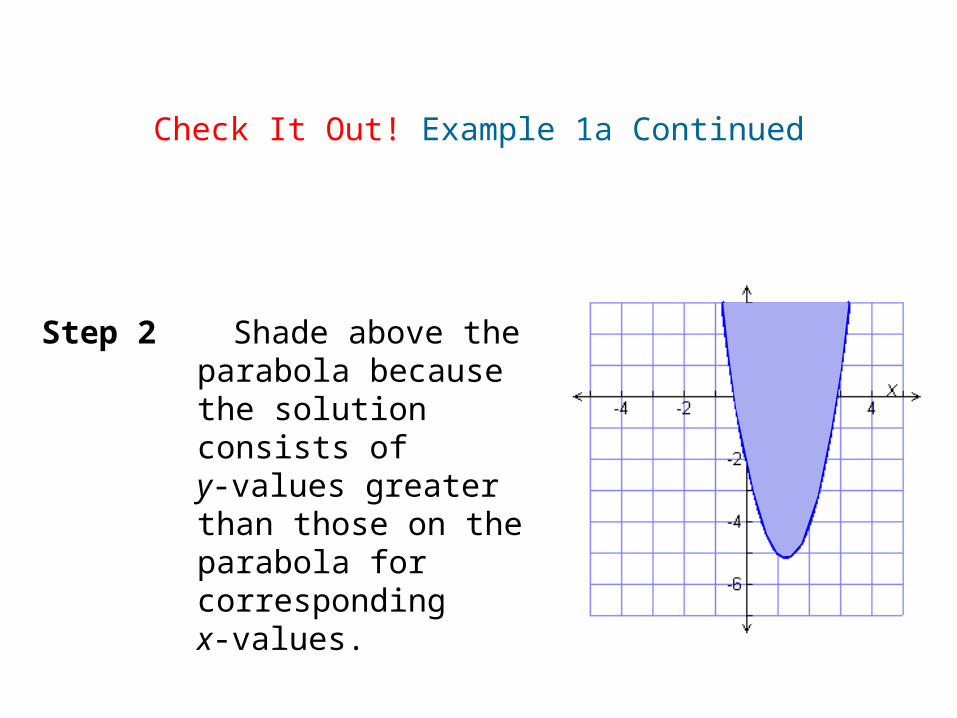
Step 2 Shade above the parabola because the solution consists of y-values greater than those on the parabola for corresponding x-values.
Check It Out! Example 1a Continued
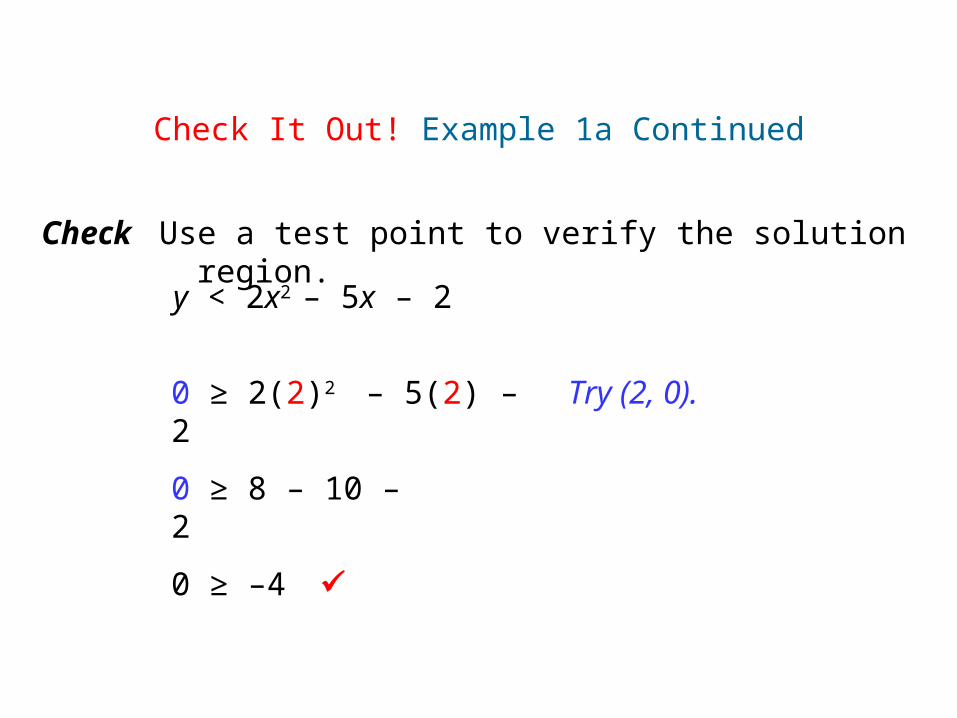
Check Use a test point to verify the solution region.
y < 2x2 – 5x – 2
0 ≥ 2(2)2 – 5(2) – 2
0 ≥ 8 – 10 – 2
0 ≥ –4
Try (2, 0).
Check It Out! Example 1a Continued
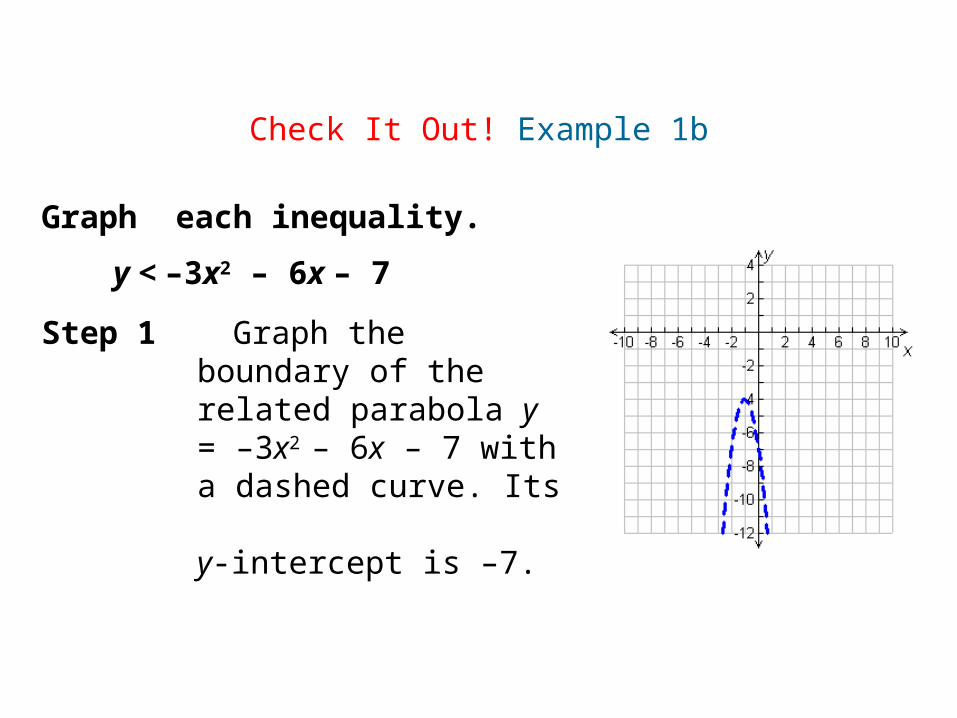
Graph each inequality.
Step 1 Graph the boundary of the related parabola y = –3x2 – 6x – 7 with a dashed curve. Its y-intercept is –7.
Check It Out! Example 1b
y < –3x2 – 6x – 7

Step 2 Shade below the parabola because the solution consists of y-values less than those on the parabola for corresponding x-values.
Check It Out! Example 1b Continued
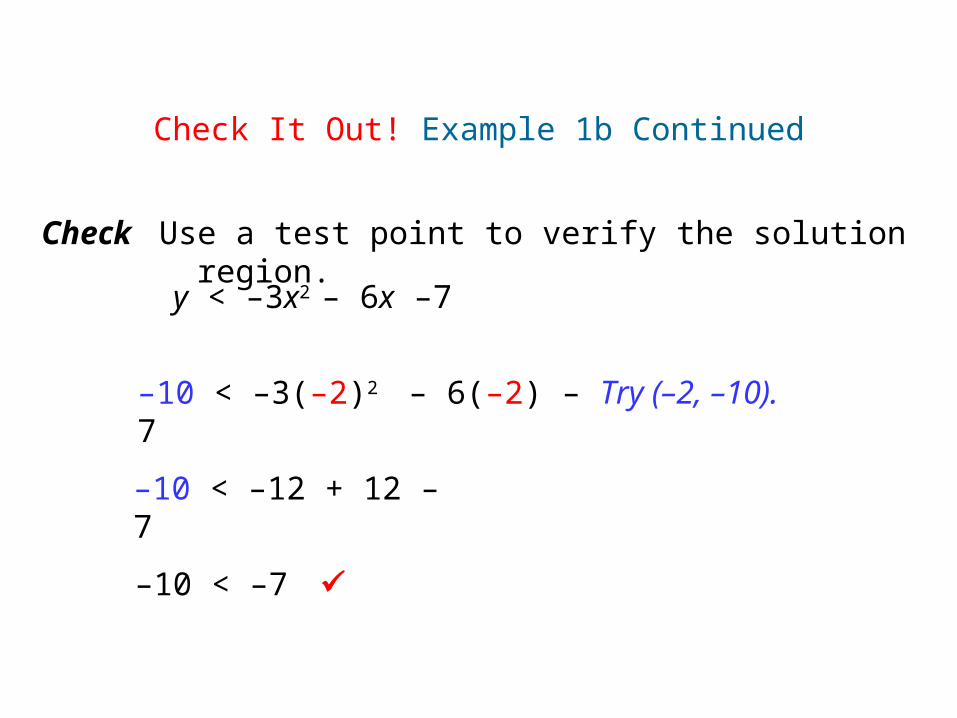
Check Use a test point to verify the solution region.
y < –3x2 – 6x –7
–10 < –3(–2)2 – 6(–2) – 7
–10 < –12 + 12 – 7
–10 < –7
Try (–2, –10).
Check It Out! Example 1b Continued
Quadratic inequalities in one variable, such as ax2 + bx + c > 0 (a ≠ 0), have solutions in one variable that are graphed on a number line.
For and statements, both of the conditions must be true. For or statements, at least one of the conditions must be true.
Reading Math
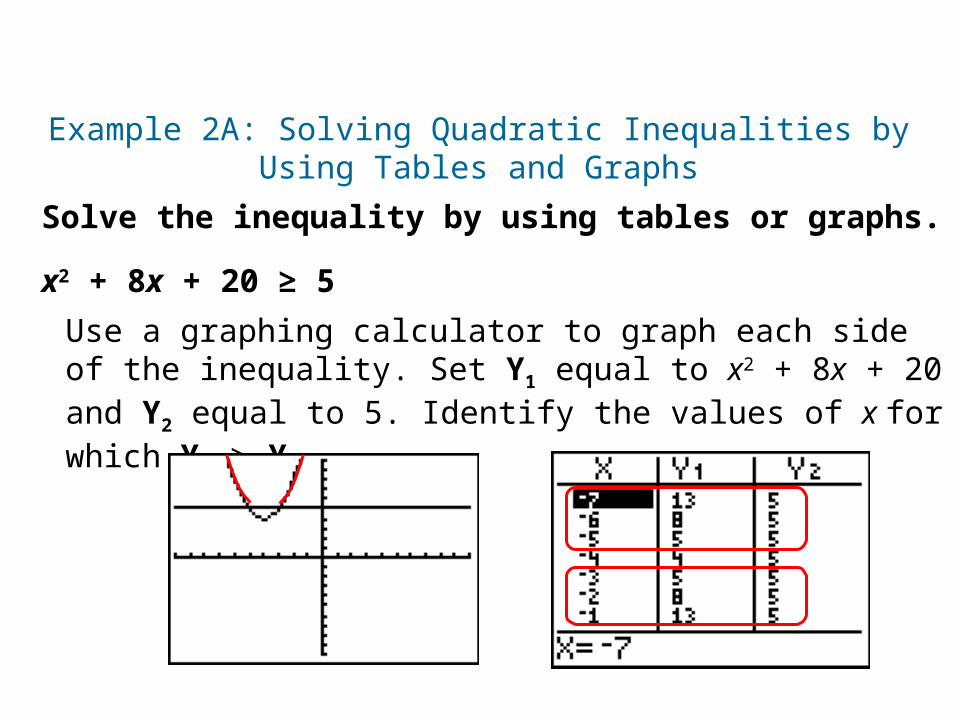
Solve the inequality by using tables or graphs.
Example 2A: Solving Quadratic Inequalities by Using Tables and Graphs
x2 + 8x + 20 ≥ 5
Use a graphing calculator to graph each side of the inequality. Set Y1 equal to x2 + 8x + 20 and Y2 equal to 5. Identify the values of x for which Y1 ≥ Y2.
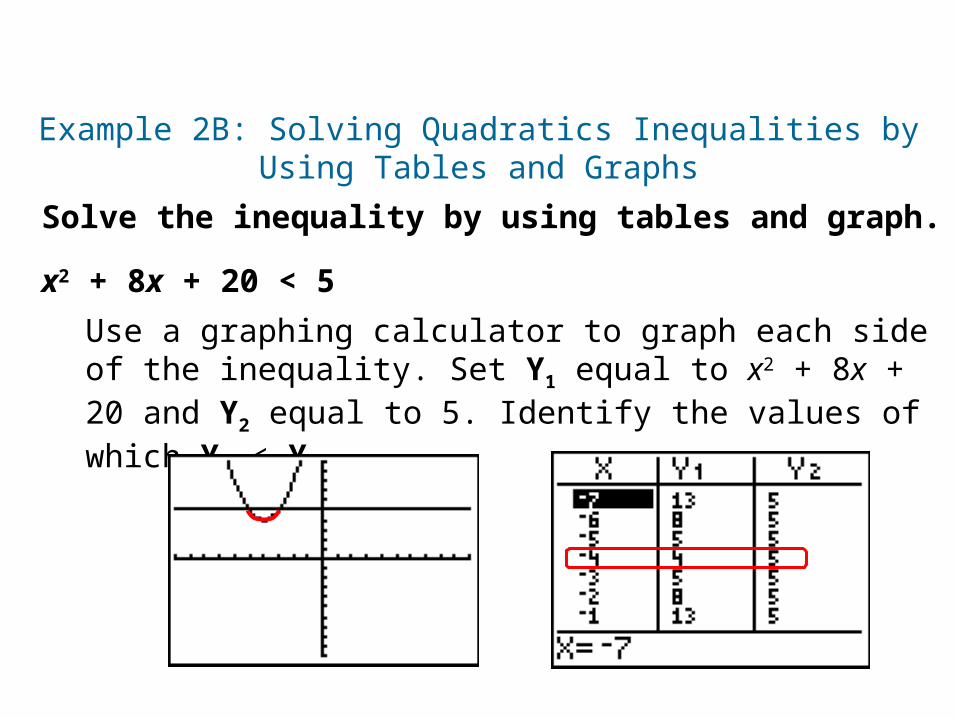
Solve the inequality by using tables and graph.
Example 2B: Solving Quadratics Inequalities by Using Tables and Graphs
x2 + 8x + 20 < 5
Use a graphing calculator to graph each side of the inequality. Set Y1 equal to x2 + 8x + 20 and Y2 equal to 5. Identify the values of which Y1 < Y2.
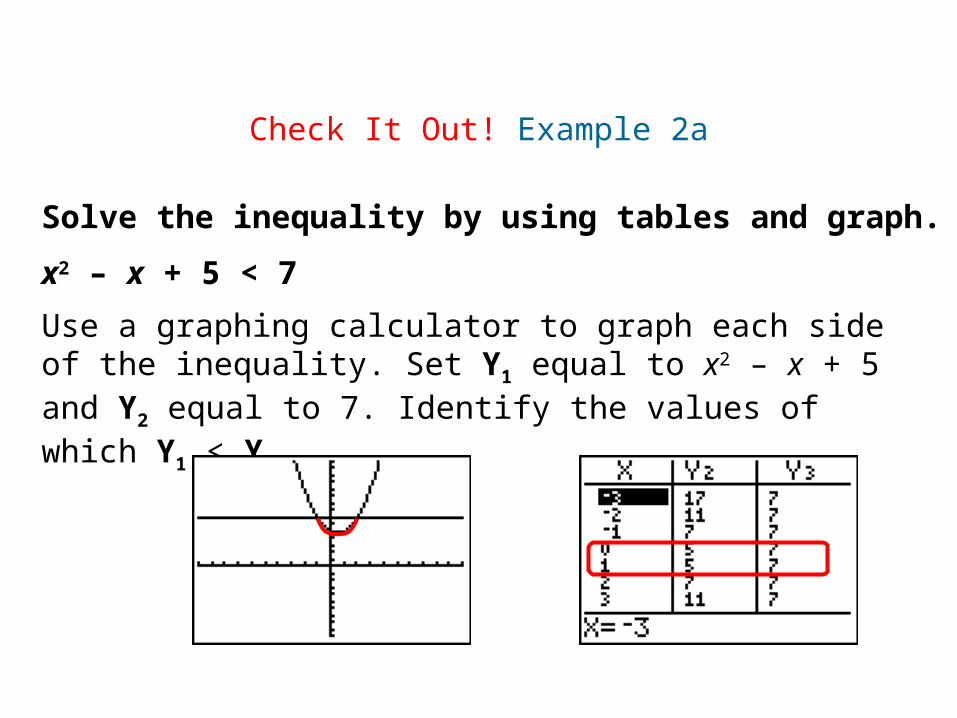
Solve the inequality by using tables and graph.
x2 – x + 5 < 7
Use a graphing calculator to graph each side of the inequality. Set Y1 equal to x2 – x + 5 and Y2 equal to 7. Identify the values of which Y1 < Y2.
Check It Out! Example 2a
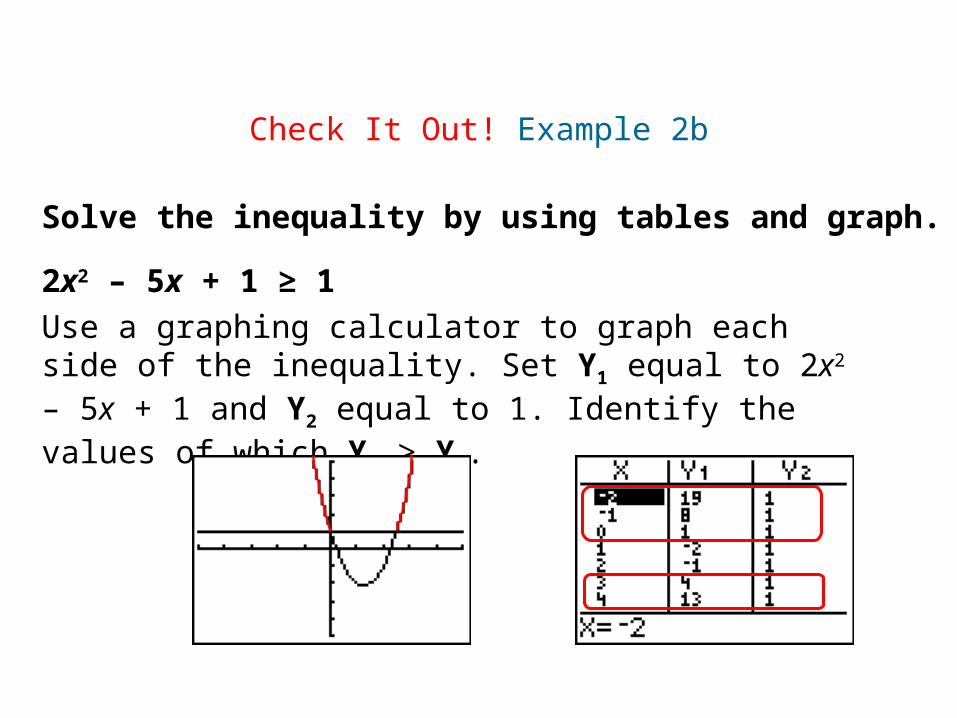
Solve the inequality by using tables and graph.
2x2 – 5x + 1 ≥ 1 Use a graphing calculator to graph each side of the inequality. Set Y1 equal to 2x2 – 5x + 1 and Y2 equal to 1. Identify the values of which Y1 ≥ Y2.
Check It Out! Example 2b
Solve the inequality by using algebra.
Step 1 Write the related equation.
Check It Out! Example 3a
x2 – 6x + 10 ≥ 2
x2 – 6x + 10 = 2
Write in standard form.
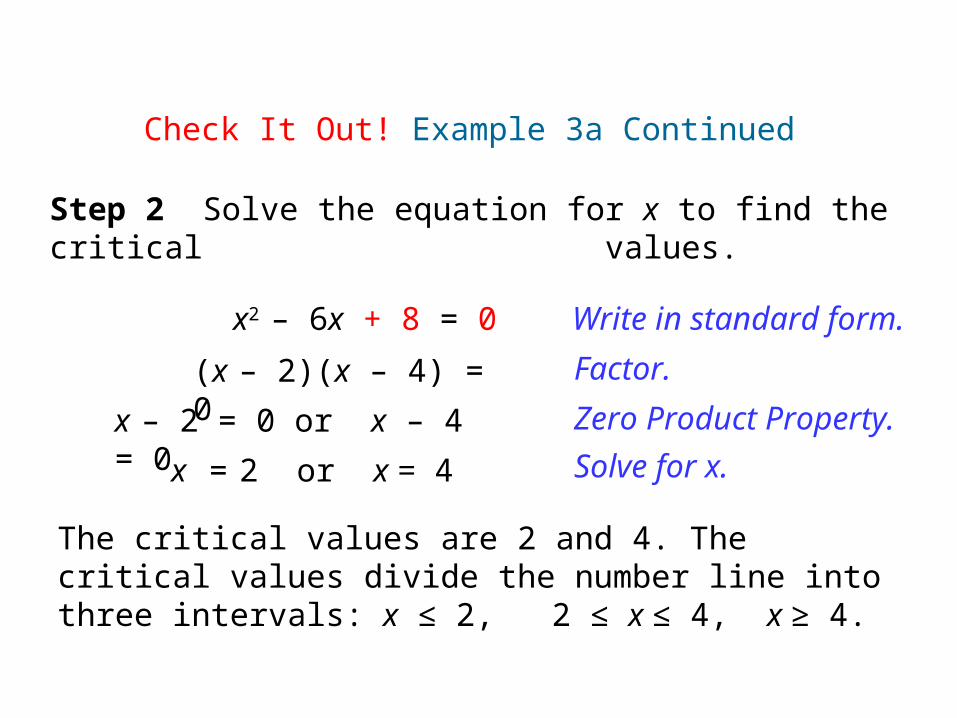
Step 2 Solve the equation for x to find the critical values.
x2 – 6x + 8 = 0
x – 2 = 0 or x – 4 = 0
(x – 2)(x – 4) = 0 Factor.
Zero Product Property.
Solve for x.x = 2 or x = 4
The critical values are 2 and 4. The critical values divide the number line into three intervals: x ≤ 2, 2 ≤ x ≤ 4, x ≥ 4.
Check It Out! Example 3a Continued
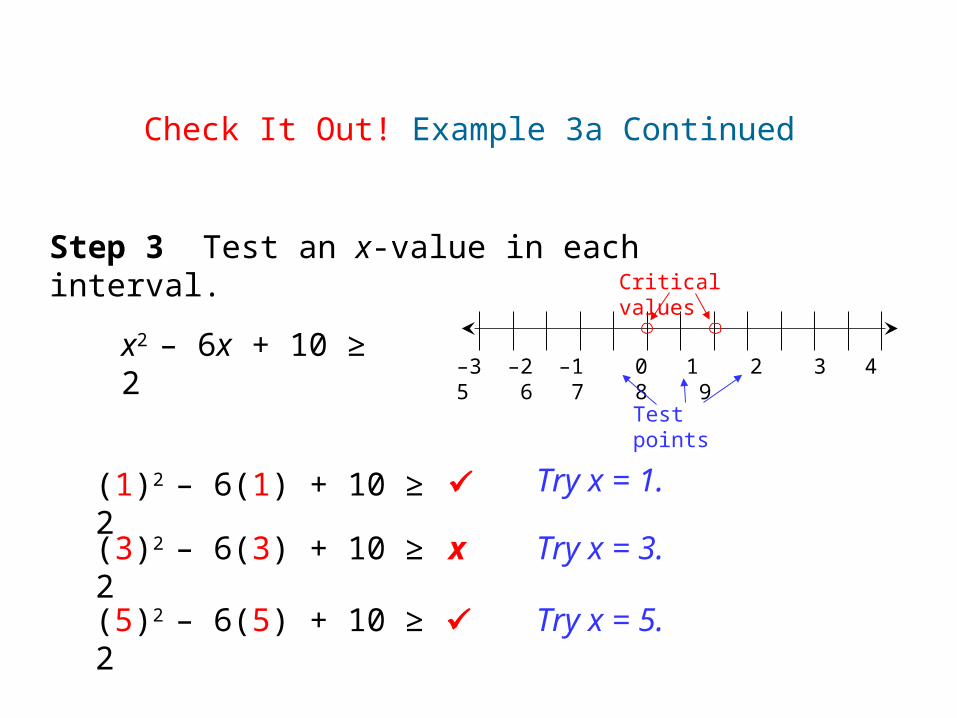
Step 3 Test an x-value in each interval.
(1)2 – 6(1) + 10 ≥ 2
x2 – 6x + 10 ≥ 2
(3)2 – 6(3) + 10 ≥ 2
(5)2 – 6(5) + 10 ≥ 2
Try x = 1.
Try x = 3.
Try x = 5.
Check It Out! Example 3a Continued
x
–3 –2 –1 0 1 2 3 4 5 6 7 8 9
Critical values
Test points
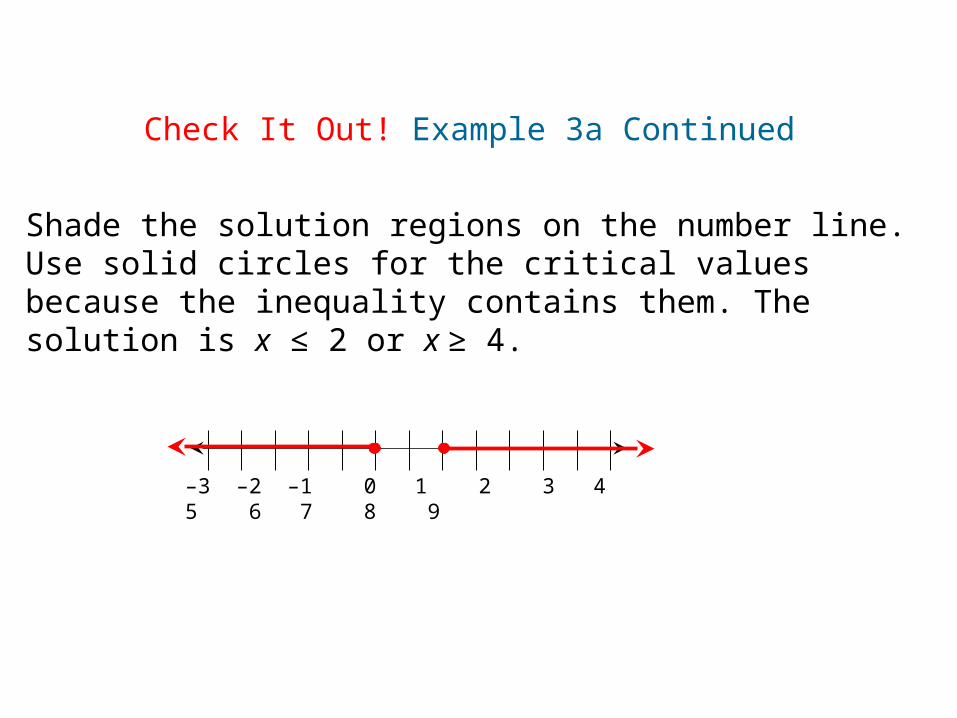
Shade the solution regions on the number line. Use solid circles for the critical values because the inequality contains them. The solution is x ≤ 2 or x ≥ 4.
–3 –2 –1 0 1 2 3 4 5 6 7 8 9
Check It Out! Example 3a Continued
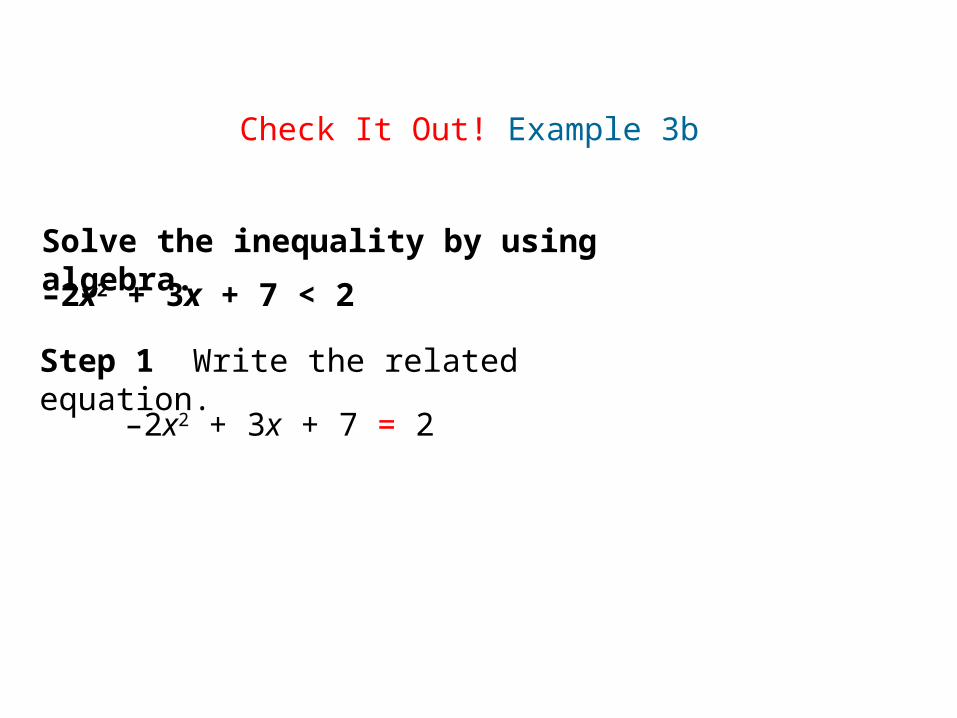
Solve the inequality by using algebra.
Step 1 Write the related equation.
Check It Out! Example 3b
–2x2 + 3x + 7 < 2
–2x2 + 3x + 7 = 2
Write in standard form.
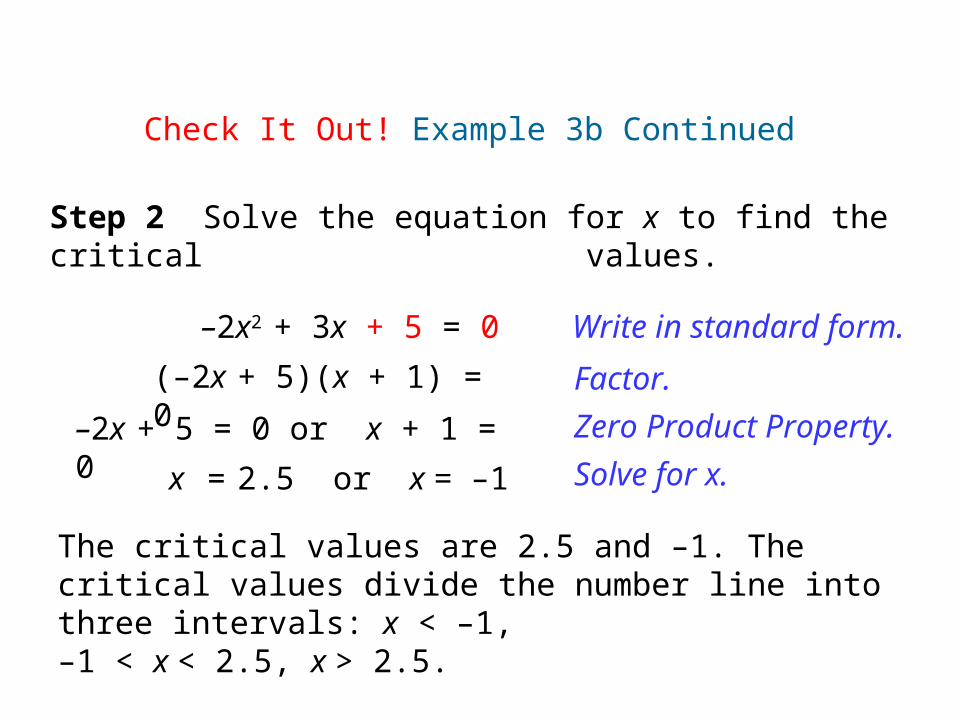
Step 2 Solve the equation for x to find the critical values.
–2x2 + 3x + 5 = 0
–2x + 5 = 0 or x + 1 = 0
(–2x + 5)(x + 1) = 0 Factor.
Zero Product Property.
Solve for x.x = 2.5 or x = –1
The critical values are 2.5 and –1. The critical values divide the number line into three intervals: x < –1, –1 < x < 2.5, x > 2.5.
Check It Out! Example 3b Continued
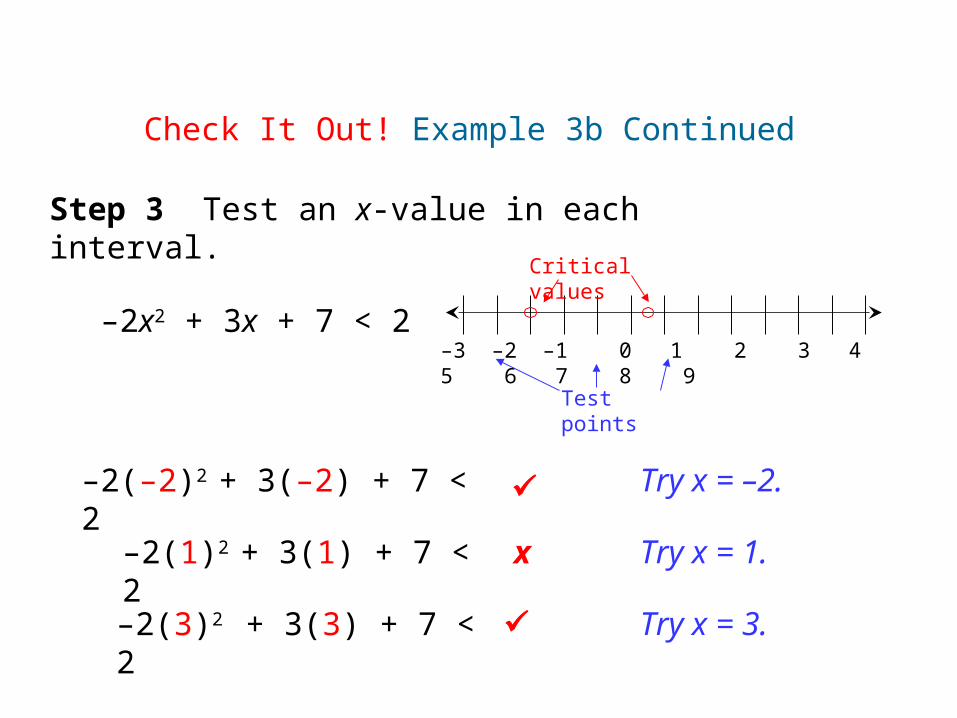
Step 3 Test an x-value in each interval.
–2(–2)2 + 3(–2) + 7 < 2
–2(1)2 + 3(1) + 7 < 2
–2(3)2 + 3(3) + 7 < 2
Try x = –2.
Try x = 1.
Try x = 3.
–3 –2 –1 0 1 2 3 4 5 6 7 8 9
Critical values
Test points
Check It Out! Example 3b Continued
x
–2x2 + 3x + 7 < 2

Shade the solution regions on the number line. Use open circles for the critical values because the inequality does not contain or equal to. The solution is x < –1 or x > 2.5.
–3 –2 –1 0 1 2 3 4 5 6 7 8 9
Check It Out! Example 3

A compound inequality such as 12 ≤ x ≤ 28 can be written as {x|x ≥12 U x ≤ 28}, or x ≥ 12 and x ≤ 28. (see Lesson 2-8).
Remember!
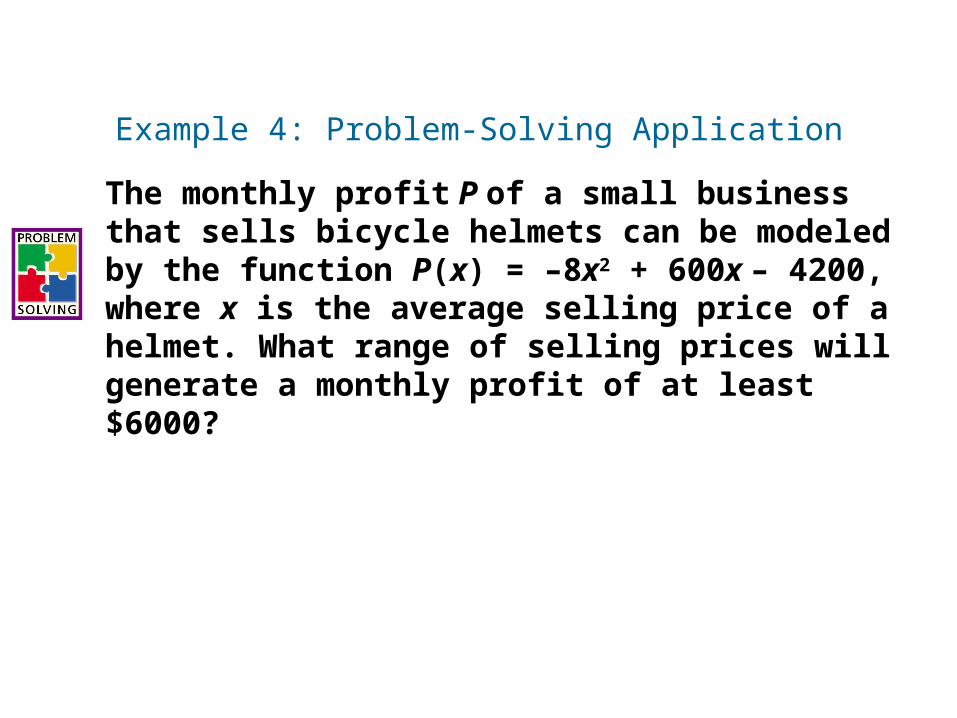
Example 4: Problem-Solving Application
The monthly profit P of a small business that sells bicycle helmets can be modeled by the function P(x) = –8x2 + 600x – 4200, where x is the average selling price of a helmet. What range of selling prices will generate a monthly profit of at least $6000?

11 Understand the Problem
Example 4 Continued
The answer will be the average price of a helmet required for a profit that is greater than or equal to $6000.
List the important information:
• The profit must be at least $6000.
• The function for the business’s profit is P(x) = –8x2 + 600x – 4200.

22 Make a Plan
Write an inequality showing profit greater than or equal to $6000. Then solve the inequality by using algebra.
Example 4 Continued
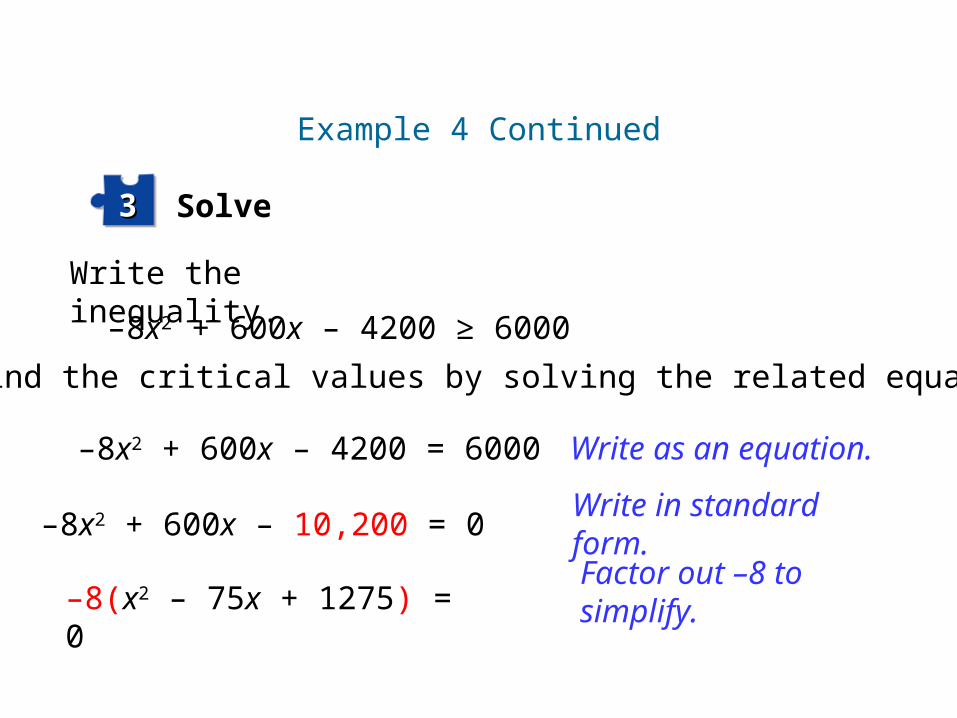
Solve33
Write the inequality.
–8x2 + 600x – 4200 ≥ 6000
–8x2 + 600x – 4200 = 6000
Find the critical values by solving the related equation.
Write as an equation.
Write in standard form.
Factor out –8 to simplify.
–8x2 + 600x – 10,200 = 0
–8(x2 – 75x + 1275) = 0
Example 4 Continued
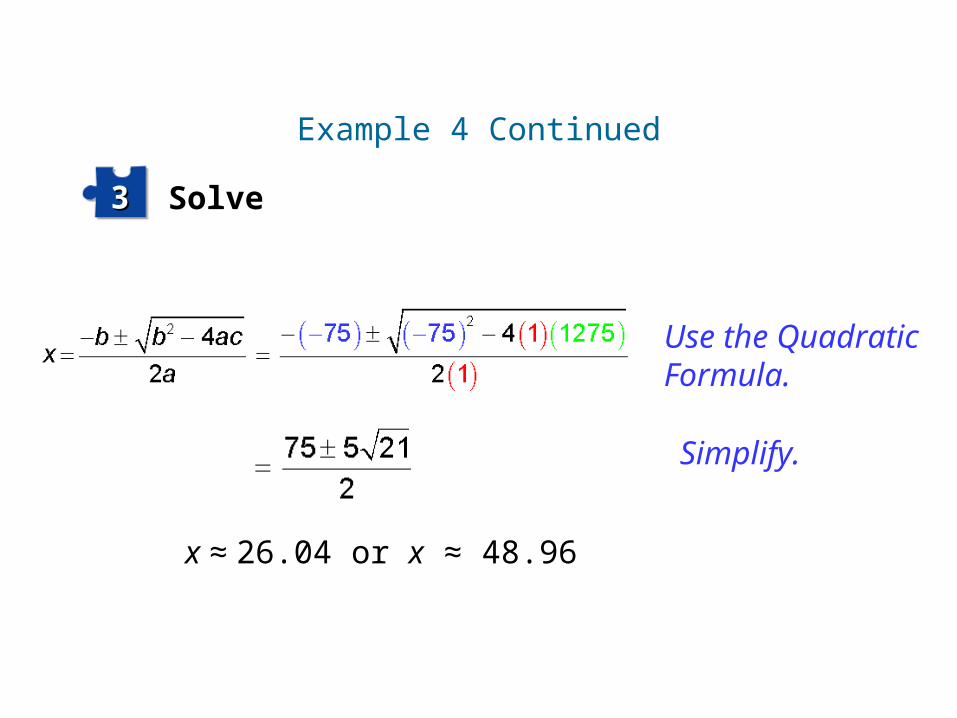
Solve33
Use the Quadratic Formula.
Simplify.
x ≈ 26.04 or x ≈ 48.96
Example 4 Continued

Solve33
Test an x-value in each of the three regions formed by the critical x-values.
10 20 30 40 50 60 70
Critical values
Test points
Example 4 Continued

Solve33
–8(25)2 + 600(25) – 4200 ≥ 6000
–8(45)2 + 600(45) – 4200 ≥ 6000
–8(50)2 + 600(50) – 4200 ≥ 6000
5800 ≥ 6000Try x = 25.
Try x = 45.
Try x = 50.
6600 ≥ 6000
5800 ≥ 6000
Write the solution as an inequality. The solution is approximately 26.04 ≤ x ≤ 48.96.
x
x
Example 4 Continued
Solve33
For a profit of $6000, the average price of a helmet needs to be between $26.04 and $48.96, inclusive.
Example 4 Continued
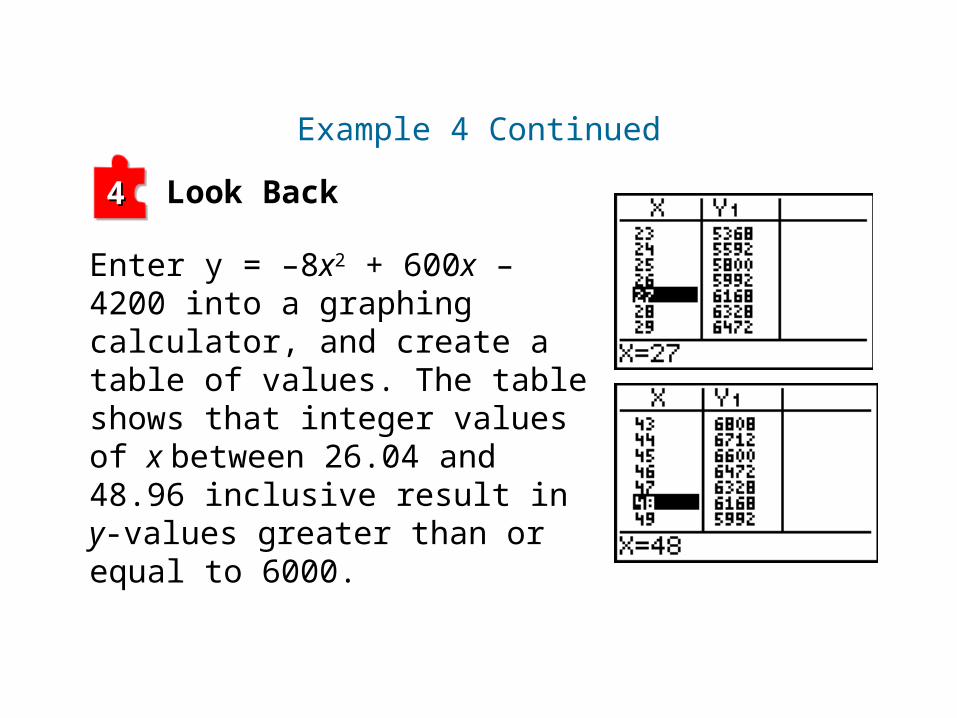
Look Back44
Enter y = –8x2 + 600x – 4200 into a graphing calculator, and create a table of values. The table shows that integer values of x between 26.04 and 48.96 inclusive result in y-values greater than or equal to 6000.
Example 4 Continued
Homework!
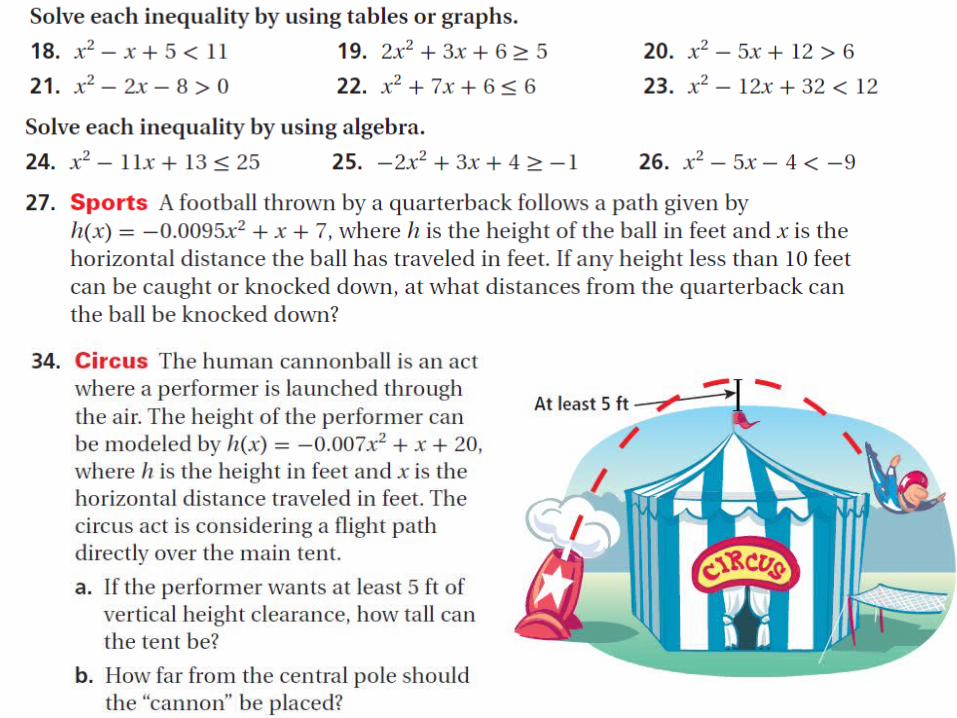
Holt Chapter 5 Section 7Page 370 # 19-27 odd, 34, 35, 38,
43, 442 Additional Problems