Embed Size (px)
Citation preview
Walter Eucken InstitutORDO Constitutio in Libertate
Freiburger Diskussionspapiere zur Ordnungsökonomik
Freiburg Discussion Papers on Constitutional Economics
ISS
N 1
43
7-1
51
0
Political Institutions and Income (Re-)Distribution: Evidence from Developed Economies
Lars P. Feld and Jan Schnellenbach13/6
Institut für Allgemeine Wirtschaftsforschung
Abteilung für WirtschaftspolitikAlbert-Ludwigs Universität Freiburg i. Br.

Political Institutions and Income (Re-)Distribution: Evidence from Developed Economies
Lars P. Feld University of Freiburg and Walter Eucken Institut, Freiburg
Jan Schnellenbach Walter Eucken Institut, Freiburg and University of Heidelberg
Abstract We discuss the effect of formal political institutions (electoral systems, fiscal decentralization, presidential and parliamentary regimes) on the extent and direction of income (re-) distribution. Empirical evidence is presented for a large sample of 70 economies and a panel of 13 OECD countries between 1981 and 1998. The evidence indicates that presidential regimes are associated with a less equal distribution of disposable incomes, while electoral systems have no significant effects. Fiscal competition is associated with less income redistribution and a less equal distribution of disposable incomes, but also with a more equal primary income distribution. Our evidence also is in line with earlier empirical contributions that find a positive relationship between trade openness and equality in primary and disposable incomes, as well as the overall redistributive effort. JEL-Classification: D31, H22, H11, H50, I38, P50. Keywords: Redistribution; Formal Institutions; Fiscal Decentralization; Presidential and Parliamentary Regimes; Electoral Systems.
Mailing Address: Albert-Ludwigs-University Freiburg Walter Eucken Institut Goethestrasse 10 79100 Freiburg Germany Phone +49.761.79097-0 Fax +49.761.79097-97 E-Mail: [email protected] and [email protected].
– 2 –
1. Introduction
An extensive public choice and political economy literature has studied the redistributive
outcomes of political decision-making (Mueller 2003; Harms and Zink 2003; Feld and
Schnellenbach 2007). An influential part of the earlier and primarily theoretical literature has
been concerned with matters of budget incidence and the question of who benefits most from
government activities. Propositions such as Director’s Law (Stigler 1970) have been
formulated, which states that the middle classes are particularly favored by redistributive
policies. This proposition runs counter as to what policy-makers usually claim to be the main
direction of their redistributive efforts. The direction of income redistribution has, however,
become much less of a concern in the recent literature, compared to the question whether the
overall magnitude of redistribution varies with alternative constitutional designs (Persson and
Tabellini 2000, 2003).
In this paper, we shed additional light on the political economics of income redistribution in
democratic countries. Our particular emphasis is on the effects of different political
institutions on the state’s capacity to redistribute. We investigate the impact of electoral
systems and of systems of government on the final distribution of income in a cross section of
70 countries during the years 1990 to 1998. We find a weakly significant positive association
between presidential regimes and inequality in disposable incomes, but no evidence of a
statistically significant relation between electoral systems and inequality. In order to
investigate the association between fiscal decentralization and income inequality, we use
panel data for 13 OECD countries between 1981 and 1998 from the Luxembourg Income
Study, which allows us to distinguish between inequality in market and after-tax disposable
incomes. Furthermore, we use decentralization measures that capture actual tax autonomy on
the sub-central level.
We find robust and highly significant evidence for a negative relation between sub-central tax
autonomy and total redistribution. However, we also find that sub-central autonomy is
associated with more equality in the distribution of primary incomes, and that revenue
decentralization affects redistribution positively if we take sub-central revenue from fiscal
equalization schemes into account. These findings are in line with the theoretical prediction
that fiscal competition reduces the scope for redistribution because of taxpayers’ mobility,
while federal systems, that emphasize cooperation between jurisdictions and provide for
substantial revenue through intergovernmental transfers, appear to facilitate redistribution.

– 3 –
In Section 2, hypotheses regarding the impact of political institutions are outlined. The
additional structure added to the analysis by institutions allows for more clear-cut theoretical
hypotheses. A brief survey of redistribution policies in selected countries is presented in
Section 3. New empirical evidence is presented and discussed in Section 4. Section 5 contains
some concluding remarks.
2. Political institutions and income redistribution
2.1. Presidential and parliamentary democracy
The most important institutional difference between presidential and parliamentary
democracies is that in presidential regimes, the government does not depend on a stable
parliamentary majority. Instead, divided governments occur frequently. This implies that the
head of government in a presidential regime is not able to use the threat of a vote of
confidence as a tool for aligning the majority coalition in parliament with the position of the
government (Huber 1996). One possible consequence is a lack of legislative cohesion in
presidential regimes. It becomes more difficult to enforce an overarching policy framework in
presidential as compared to parliamentary regimes. In the former, policy is thus an outcome of
competition between relatively narrow special interests, which can also form spontaneous
coalitions.
Persson and Tabellini (2000: ch. 10) argue that presidential regimes will typically be
characterized by less total spending than parliamentary regimes. The reason is that in the
former, taxing and spending decisions are often made in independent parliamentary
committees. Those representatives sitting on the budget committee, who decide on the overall
size of the budget, therefore expect that they will not be too influential in the decisions on the
spending of public funds, which are made in separate spending committees. In fact, the
agenda setter in the spending committee can channel most of the funds to his preferred use,
since the institutional setting leads to a Bertrand type of competition. Other representatives
offer their approving votes to the agenda setter in return for small budget shares, just to
become part of the majority coalition and at least receive some spending on their preferred
causes.
Anticipating this process in the spending committees, the agenda setter in the budget
committee will propose a lean government, such that a lack of legislative cohesion leads to

– 4 –
special-interest policy-making combined with a relatively small budget (Voigt 2011). The
capacity to redistribute in the sense of large-scale general income-transfer schemes is thus
reduced in presidential regimes. The remaining capacity is used to a lesser extent in a targeted
fashion to reduce inequality, but to a greater extent in order to serve special interests
(Kroszner and Stratmann 1998). These considerations imply the proposition that presidential
regimes redistribute less income overall, but provide relatively more targeted redistribution
than broad-based redistributive schemes which reduce inequality.
2.2. Plurality rule and proportional representation
Two mechanisms lead to a more narrow representation of interests in government under
plurality rule, compared to proportional voting systems. The first is the low majority
threshold. In the extreme, a government under plurality rule needs only a majority of 50%
plus one vote in 50% plus one of the districts, i.e., the support of 25% of the population. The
second is the greater likelihood of a government that is supported by only one party.
Duverger’s Law, which is empirically well supported (e.g., Mueller 2003: ch. 13) in spite of
some counter-examples such as the Liberal Democrats in Britain, predicts a convergence to a
two-party system under plurality rule due to strategic voting. In this case, coalition
governments become unnecessary and are seldom observed.
Plurality rule, like presidential regimes, can therefore be expected to produce more targeted
policies catering to smaller constituencies, which closely resembles special-interest policy-
making (Persson and Tabellini 1999, 2000). In countries with a middle class sufficiently
strong and homogeneous to support a government, policies of the Director’s Law type
become more likely under plurality rule. Empirical evidence by Milesi-Ferreti et al. (2002)
supports this proposition: For a panel of OECD countries, it is shown that broad transfer
payments indeed increase with proportional representation. The effect of plurality rule on the
overall magnitude of redistributive spending is, on the other hand, theoretically ambiguous.
Persson and Tabellini (2000: ch. 8) predict a larger government under plurality rule, because
the minority is often numerous and in many countries not institutionally protected from fiscal
exploitation. On the other hand, cooperation of representatives in changing coalition
governments under proportional representation may lead to smaller policy changes with
changes of government, and thus also more stable policies of redistribution. Stability, in turn,
may foster the growth of expenditures. Indeed, the empirical evidence so far suggests that
proportional systems are characterized by more overall spending on income redistribution

– 5 –
(e.g., Austen-Smith 2000; Persson and Tabellini 2003). It can thus be hypothesized that they
generate less inequality in post-transfer incomes.
2.3 Unitary and federal countries
The main difference between unitary states and federations is often believed to be rooted in
inter-jurisdictional competition. While unitary states are supposed not to allow for
competition between jurisdictions, federations are assumed to be of the competitive type. This
indeed holds for some key examples like the United States and Britain, but federations
generally offer a variety of different organizational forms. The degree of actual
decentralization that prevails in federal countries, and the extent of inter-governmental
transfer schemes are important institutional details that should be taken into account. In
addition, the regional level of a federation is formally represented in parliamentary decision-
making at the federal level, providing for an additional element of checks and balances. In
contrast, unitary states may allow for more competition at the local level of electoral districts,
and the local rooting of representatives in the central parliament provides for some check on
their decisions. It is thus useful to have a closer look at the actual extent of competition and
cooperation between jurisdictions in a country instead of simply classifying countries as
unitary states or federations.
In the extreme case of perfect competition among local governments, as analyzed by Tiebout
(1956), (decentralized) redistribution becomes impossible. All taxes are Lindahl taxes, such
that the equivalence between individual contributions and the utility enjoyed from locally
supplied public goods is guaranteed. Sub-central redistribution is conceivable only with
imperfect sorting of individuals into jurisdictions, and thus with heterogeneous local
populations. Since earners of higher incomes are often particularly mobile and can more
easily avoid taxation for redistributive purposes by relocating than lower income people,
altruistic motives for redistribution along the lines of Pauly (1973) are often referred to in
order to explain why sub-central redistribution is observed at all.
Even if the mobility of income taxpayers is imperfect, decentralization will reduce tax
burdens and in particular the progressivity of the tax schedule (Sinn 2003). Sub-central
governments competing for tax bases may even find it useful to experiment with regressive
tax schedules, as some Swiss cantons have done in recent years. Regarding the other end of
the income distribution, governments are tempted to deter transfer recipients from
– 6 –
immigrating by offering only a modest level of transfer payments. There are, therefore, two
expected effects of fiscal decentralization: a reduction of explicit transfer policies, and a
tendency towards the equivalence principle for spending on other local public goods.
The effects of inter-governmental transfers or fiscal equalization schemes run in the opposite
direction. The more generous they are, the less sub-federal jurisdictions are exposed to
pressure from fiscal competition (Brennan and Buchanan 1980). The inter-governmental
transfer payments offer sub-federal jurisdictions the possibility to allocate additional spending
to schemes which redistribute incomes between individuals. This need not necessarily happen,
as sub-federal policy-makers may decide to provide more local public goods. Nevertheless,
fiscal equalization schemes could reduce the pressure inter-jurisdictional competition implies
for sub-federal redistribution at least to some extent, because inter-jurisdictional transfers can
either compensate for the reduction of tax rates induced by tax competition or allow to keep
tax rates at a relatively higher level (Büttner 2006).
3. How governments redistribute
Before we start analyzing the relation between these political institutions and income
redistribution econometrically, it is useful to have a closer at the redistributive activity of
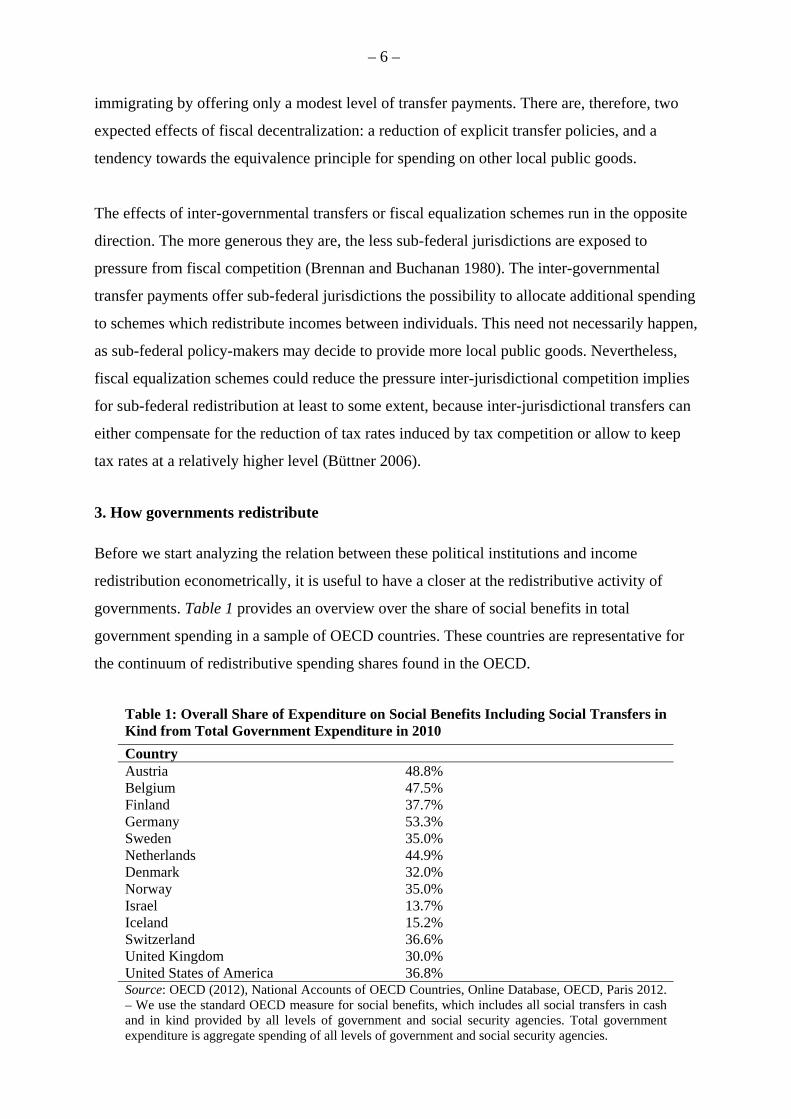
governments. Table 1 provides an overview over the share of social benefits in total
government spending in a sample of OECD countries. These countries are representative for
the continuum of redistributive spending shares found in the OECD.
Table 1: Overall Share of Expenditure on Social Benefits Including Social Transfers in Kind from Total Government Expenditure in 2010 Country Austria 48.8% Belgium 47.5% Finland 37.7% Germany 53.3% Sweden 35.0% Netherlands 44.9% Denmark 32.0% Norway 35.0% Israel 13.7% Iceland 15.2% Switzerland 36.6% United Kingdom 30.0% United States of America 36.8% Source: OECD (2012), National Accounts of OECD Countries, Online Database, OECD, Paris 2012. – We use the standard OECD measure for social benefits, which includes all social transfers in cash and in kind provided by all levels of government and social security agencies. Total government expenditure is aggregate spending of all levels of government and social security agencies.

– 7 –
The share of social spending from total spending varies considerably between countries from
a bit less than 14% in Israel or 37% in the U.S. to 53.3% in Germany. These numbers alone
are, however, not sufficiently informative as to the redistribution of income actually
undertaken. Essentially, they show only that there is substantial variation between countries in
the resources allocated to redistribution. Given the discussion since Director’s Law, it is
unclear whether these resources serve to redistribute income from the rich to the poor or not.
In Table 2, countries are ordered according to their actually achieved degree of income
equalization (fourth column). While Belgium almost cuts its inequality in primary incomes by
half through redistribution, the United States reduce their primary inequality by less than a
fourth. It is also striking that income redistribution in all countries relies mainly on transfers,
rather than taxes. Looking at the relative importance of different transfer types, public pension
systems apparently contribute a significant share to redistributive efforts in all countries.
Table 2: Income Distribution and Redistribution according to Gini-Coefficients, Selected OECD Countries in 2000 Gini coefficients Redistribution
from Contribution of transfer types to the reduction of inequality
Country Market Dispo-sable
Diffe-rence
Taxes Trans-fers
Pensions Unemploy-ment Benefits
Others
Belgium 0.465 0.242 0.223 0.062 0.161 0.107 0.023 0.030 Sweden 0.441 0.223 0.218 0.038 0.180 0.107 0.019 0.055 Netherlands 0.458 0.257 0.202 0.041 0.160 0.088 0.011 0.062 Finland 0.417 0.223 0.194 0.048 0.146 0.087 0.016 0.044 France 0.469 0.292 0.177 0.021 0.157 0.099 0.018 0.039 Denmark 0.412 0.245 0.167 0.036 0.131 0.055 0.024 0.052 Germany 0.421 0.254 0.167 0.047 0.119 0.089 0.006 0.024 UK 0.475 0.323 0.153 0.031 0.121 0.044 0.005 0.073 Norway 0.379 0.235 0.144 0.040 0.104 0.065 0.005 0.043 Australia 0.423 0.297 0.126 0.049 0.077 0.030 0.011 0.036 Canada 0.406 0.290 0.116 0.038 0.078 0.037 0.011 0.030 Switzerland 0.395 0.293 0.102 0.009 0.093 0.078 0.013 0.001 USA 0.447 0.345 0.102 0.046 0.056 0.033 0.002 0.021 Mean 0.431 0.271 0.161 0.039 0.122 0.071 0.013 0.039 Source: Luxembourg Income Study, 2004, http://www.lisdatacenter.org/. – ‘Market’ denotes the primary distribution, i.e., the result of market activity before government and social security redistribution. ‘Disposable’ denotes the final distribution of disposable incomes. The other columns report the contributions of different policy instruments to overall redistribution (columns 4 and 5) and to redistribution through transfers (columns 6-8). All data are from the 2004 wave of the Luxembourg Income Study.
In Table 3, we focus on another narrow policy goal and order countries by their achieved
absolute reductions in poverty. The poverty measure (PM) is defined as follows: First, a
headcount is conducted for which the percentage number of individuals below the poverty
line (HC) is calculated. The poverty line is defined as 50% of a country’s median income, i.e.,
a relative poverty measure is used. In a second step, a poverty gap (PG) is calculated. The

– 8 –
poverty gap divides the absolute difference between the mean income of the poor by the
median income of the population through the median income of the population. The poverty
gap thus measures how large the income difference between the mean poor and the median
household is, relative to the median household’s income. Finally, (PM)=(HC)*(PG) is
calculated. To reduce poverty by these measures, government can thus either reduce the
number of the poor (reduce the (HC) measure) or it can raise the average income of the poor
(reduce the (PG) measure).
Table 3: Poverty Measures and Poverty Reduction in Selected OECD Countries in 2000 Poverty measure Poverty reduction Country Market incomes Disposable incomes Belgium 27.7 4.1 23.6 Netherlands 26.7 4.5 22.3 Sweden 25.7 4.4 21.3 Finland 22.2 3.2 19.0 Denmark 24.1 5.6 18.5 UK 25.4 7.3 18.0 France 22.7 5.3 17.4 Germany 21.5 4.4 17.1 Norway 19.3 4.0 15.3 Australia 21.3 8.0 13.3 Switzerland 17.2 5.5 11.8 Canada 19.1 7.6 11.5 USA 20.1 11.6 8.5 Mean 22.5 5.8 16.7 Source: Luxembourg Income Study, 2004.
According to Table 3, most countries indeed achieve substantial reductions in poverty through
their redistributive policies. Also, the ranking of countries is very similar to the ranking in
Table 2: Countries that are relatively more active in redistributing income are also more active
in organizing targeted transfers to poor individuals.
4. The econometric analysis
4.1 The econometric approach and the data
Instead of analyzing different spending or taxing instruments, we focus on the actual (re-)
distribution achieved by overall governmental activity measured by (differences in) Gini
coefficients. We proceed in two steps in order to test the comparative impact of alternative
constitutional frameworks on income (re-)distribution. First, a cross section of 70 countries
(listed in the Appendix) at the end of the 1990s is used to find out whether there are
differences in the distribution of final (disposable) incomes that can be attributed to the

– 9 –
constitutional differences outlined in Section 2. As this cross country dataset, which has been
collected by Persson and Tabellini (2003), does not contain any measure of the primary
(market) income distribution, it is not possible to infer with certainty whether constitutional
differences also affect income redistribution. This analysis thus allows only a first impression
as to the effects of institutional differences.
A closer look at redistribution is taken with the second step of the analysis. For a small
sample of 13 OECD countries (listed in the notes to Table 5) between 1981 and 1998, a yearly
panel dataset is constructed on the basis of data provided by the Luxembourg Income Study
(Atkinson et al. 1995) which enables us to analyze the impact of institutional factors on the
primary and final income distributions as well as on fiscal redistribution. This dataset has
another drawback, however, as the 13 countries comprise too small numbers of presidential
systems, or systems with plurality rule, such that how that regime type affects income
redistribution cannot be tested. However, these data allow us to focus on differences in fiscal
decentralization.
In general, the following econometric model is used:
GINIit = β0 + β1 CONSTit + β2 Vit + uit, (1)
where GINIit stands for the different Gini indexes used as proxies for income redistribution. In
the first step of the analysis, i.e., in the next section, we analyze Gini coefficients for the final
income distribution, i.e., the distribution of disposable income. In the second step of the
analysis, primary and final income distributions as well as fiscal redistribution as the
difference between these two income distributions are analyzed.
Equation (1) implies that the resulting distribution of disposable incomes is a function of
constitutional differences, CONSTit: As constitutional differences, we consider the differences
between parliamentary and presidential democracies, plurality rule and proportional
representation, and, finally, federal and unitary countries. In each step of the analysis, income
(re-) distribution is additionally explained by several control variables Vit. They vary
depending on the available dataset and are subsequently introduced. However, a basic set of
control variables remains largely unchanged across regressions, namely an income variable, a
proxy for educational attainment and a population variable. The parameter of interest is β1, while uit denotes the error term. Subscript i indicates the cross section units, while t indicates
the years.

– 10 –
4.2 Political institutions and the distribution of disposable incomes
In order to analyze the relation between presidential versus parliamentary democracy or
plurality rule versus proportional representation on the one hand and the distribution of
disposable income measured by Gini-coefficients on the other hand, the cross section data are
averaged over the period from 1990 to 1998 (or shorter periods when data are unavailable for
earlier dates) in order to eliminate the influence of short-term shocks in particular years.
The first variable of interest in our investigation is a dummy variable that is equal to one in
presidential regimes, and zero otherwise; only those regimes in which the government is
immune from a confidence vote of the parliament are considered as presidential. Second, a
dummy variable for electoral systems is included which equals 1 if all members of the lower
house are elected under plurality rule, and zero otherwise. These two variables are discussed
in more detail in Persson and Tabellini (2003: ch. 4). Third, the econometric model contains a
dummy variable that is equal to one if the country has a federal political structure, and zero
otherwise. It should be noted that degrees of sub-federal tax and spending autonomy and thus
fiscal competition in federations are not captured by this dummy variable. Moreover, there are
also many unitary states, such as some Nordic countries with strong fiscal competencies at the
local level, which are not accounted for when a simple dummy variable is used.
The basic control variables are log income (natural log of real GDP per capita in constant
dollars), the total enrolment in primary and secondary education (as a percentage of the
relevant age group in the population), the natural log of total population (in millions), the
population proportion between the ages of 15 and 64, and the population proportion 65 years
years old and above from total population. The selection of these variables is justified by the
broad literature on the determinants of government spending and spending composition (Feld
and Kirchgässner 2001; Persson and Tabellini 2003), but also from previous public choice
analyses of income redistribution (Feld, Fischer and Kirchgässner 2010).
In addition, the model is augmented by further explanatory variables in order to test the
robustness of our results on institutional differences. Central government spending and
revenue as a percentage of GDP are included, as well as ethno-linguistic fragmentation, the
Gastil index of civil liberties and political rights, trade openness and the age of democracy.
The choice of these additional control variables is motivated by theoretical reasoning, e.g.,
because they are related to political institutions. For example, ethno-linguistic fragmentation

– 11 –
may affect the income distribution directly or indirectly through the choice of particular
political institutions.
The model is estimated by OLS and the results are reported in Table 4. As can be seen from
the bottom of the table, the variation in the Gini index of the disposable income distribution is
fairly well explained. Even the simplest model with the baseline control variables explains
almost 60% of the variation of the Gini index according to the adjusted R2. Also, the F-
statistics indicate that the model cannot be rejected on any conventional significance level.
Please note for an interpretation of the estimated coefficients that a Gini-coefficient closer to
zero indicates a more equal (market or disposable) income distribution. A negative sign of a
coefficient thus indicates a reduction of inequality while a positive sign indicates that a
variable increases inequality.
The results in Model (1) of Table 4 imply that countries with a higher real GDP per capita or
a higher enrollment in primary and secondary education have a less equally distributed
disposable income (significant at the 5% or 1% levels respectively), while a country’s
population size has no significant effect on the income distribution. The direction of causation
is particularly difficult to discern for the relation between GDP and inequality. It may be that
in more affluent societies, where even relatively poor individuals enjoy high absolute levels of
consumption, tolerance towards inequality increases and the political demand for
redistribution declines, for example, because in these countries, the market process that
generates an income distribution is considered generally fair (Bjørnskov et al. 2013). It may,
however, also be the case that entrepreneurial societies generate both inequality (through
successful entrepreneurship) and affluence.

– 12 –
Table 4: Cross Country Regressions of the Gini-Index on Electoral Systems and Forms of Government, OLS, 70 Countries, Averages for the Period 1990 to 1998 (1) (2) (3) (4) (5) (6) (7) (8) Log Income 3.067**
[2.29] 3.262** [2.45]
3.556** [2,0]
4.033** [2.30]
3.708* [1.99]
3.901** [2.05]
4.191** [2.18]
4.529** [2.17]
Enrolment in Primary and Secondary Education
0.185*** [2.64]
0.171** [2.45]
0.169** [2.36]
0.204*** [2.77]
0.210*** [2.81]
0.225*** [2.84]
0.217*** [2.73]
0.218*** [2.71]
Log Population 0.043 [0.08]
-0.071 [-0.13]
-0.118 [-0.19]
0.633 [0.11]
-0.006 [-0.01]
-0.136 [-0.21]
-0.627 [-0.76]
-0.562 [-0.67]
Proportion of Population of Age 15 to 64 Years
-0.589** [-2.21]
-0.498* [-1.85]
-0.523* [-1.79]
-0.269 [-0.94]
-0.271 [-0.93]
-0.316 [-1.05]
-0.218 [-0.69]
-0.237 [-0.73]
Proportion of Population above 64 Years
-1.837*** [-6.34]
-1.733*** [-5.79]
-1.754*** [-5.40]
-1.964*** [-5.23]
-1.987*** [-5.22]
-1.880*** [-4.47]
-1.869*** [-4.44]
-1.848*** [-4.33]
Presidential Regimes – 3.522* [1.69]
3.635 [1.60]
4.816** [2.08]
4.696** [2.00]
4.637* [1.97]
4.573* [1.94]
4.916* [1.96]
Plurality Rule – -0.408 [-0.24]
-0.538 [-0.29]
-0.719 [-0.39]
-0.369 [-0.19]
-0.118 [-0.06]
-0.084 [-0.04]
0.040 [0.02]
Federal Political Structure – – 0.226 [0.08]
-0.622 [-0.25]
-0.368 [-0.14]
-0.186 [-0.07]
-0.135 [-0.05]
-0.169 [0.06]
Central Government Expenditure as a Percentage of GDP
– – – -0.013 [0.05]
0.002 [0.01]
0.005 [0.02]
-0.091 [-0.34]
-0.092 [-0.35]
Central Government Revenue as a Percentage of GDP
– – – 0.039 [0.18]
0.024 [0.11]
0.015 [0.07]
0.139 [0.55]
0.137 [0.54]
Ethnolinguistic Fractionalization
– – – – -2.201 [-0.55
-3.072 [-0.71]
-1.890 [-0.42]
-1.393 [-0.30]
Gastil Index of Civil Liberties and Political Rights
– – – – – 0.756 [0.61]
1.352 [0.98]
1.157 [0.79]
Trade Openness (Exports plus Imports of Goods and Services Divided by GDP)
– – – – – – -0.295 [-0.99]
-0.028 [-0.93]
Age of Democracy – – – – – – – -2.190 [-0.43]
Constant 49.197 41.334 40.876 17.938 21.071 18.814 12.006 10.588 Obs. 70 70 68 63 63 63 63 63 Adj. R2 0.595 0.603 0.581 0.617 0.612 0.607 0.607 0.602 F-statistics 21.28 15.95 12.61 10.99 9.89 8.98 8.36 7.65 RMSE 6.633 6.571 6.712 6.085 6.127 6.165 6.166 6.218 Notes: The numbers in parentheses are absolute values of the estimated t-statistics. ‘***’, ‘**’, or ‘*’ indicates significance at the1, 5, or 10 percent levels, respectively.

– 13 –
Larger proportions of older people and people in the working age both imply a significantly
more equal distribution of disposable incomes. This implies in turn that countries with a
larger share of young people have a less equal income distribution. Regarding the coefficients
of both variables, it is obvious that proportionally more older people (and thus pensioners) are
associated with a more equal income distribution. One reason for this may simply be that
young individuals, who either attend school, independent study, or are at the very beginning
of their professional careers typically earn no or very low incomes. An increase in the number
of young people would thus immediately raise the value of the Gini coefficient.1 This is also a
plausible interpretation for the effect reported for enrollment in primary and secondary
education. In addition to this, policy choices are also likely to depend on demographics. An
increase in the share of older individuals, i.e., of those who receive a pension or expect to
receive it relatively soon, may also raise the probability of redistributive policies targeted
towards pensioners.
Model (2) includes the dummy variables for presidential systems and plurality rule.
Presidential systems have a less equal final income distribution, consistent with results on
welfare spending reported above. However, this effect is only marginally significant on the
10% significance level. It loses significance when the dummy variable for federalism is
introduced into the model, but regains significance (up to higher levels) with the inclusion of
other control variables. It should be noted that these effects are not the result of the smaller
sample size.
The dummy variable for plurality rule is, however, not significant on any of the specifications.
It has an unanticipated positive sign, which reverses when the age of democracy is included in
the model. This is somewhat surprising, given that Milesi-Ferreti, Perotti and Rostagno
(2002) found a positive and significant effect of the degree of proportionality of an electoral
system on the magnitude of transfer payments. A possible explanation may be that Milesi-
Feretti et al. choose the funds used for redistribution as their dependent variable, while we
choose inequality of disposable incomes, i.e., a measure of actually achieved equalization. In
other words, the incongruence between the two sets of results may be an indication that higher
transfers in countries with more proportional electoral systems are not necessarily associated
with higher actual equalization of incomes – which in turn is an indication that more
proportional systems tend to redistribute in a less targeted fashion to the poor.
1 This has been pointed out by an anonymous referee.

– 14 –
Less surprising, the dummy variable for federal states does not have any significant impact in
these regressions. As mentioned already above, such a crude dummy variable is not able to
distinguish between federations organized as systems with strong fiscal competition, such as
Switzerland, the United States or Canada, and federations with a cooperative or centralized
form of federalism, such as Germany, Austria or Australia.
It should be noted at this stage as well that none of the additional control variables that are
included to test the robustness of our results has any significant impact on the Gini index of
disposable income distribution. This holds for central government spending and revenue, the
inclusion of which increases the significance of the dummy variable for presidential systems
to the 5% level. It also holds for trade openness, ethno-linguistic fractionalization, the Gastil
index of civil liberties and political rights and for the age of democracy.
Each of these variables has its rationale. For example, there is a broad discussion in the
literature about whether more open economies face stronger demands for income
redistribution by those groups most negatively affected by globalization (Rodrik 1998).
Ethno-linguistic fractionalization is connected to the arguments brought forward by Roemer
and van der Straeten (2006). The Gastil index attempts to control for democracy as such, and
the age of democracy aims at controlling indirectly for the impact of interest groups. As Olson
(1982) argued, a stable democratic regime that persists over a longer time period invites
interest groups to exert more and more influence, which finally leads to a sclerotic society.
Interpreting the lack of impact of these variables, it should be noted that each one could still
affect income redistribution overall or by single redistributive measures as the final income
distribution is the interaction between the primary income distribution and income
redistribution. The fact that they do not influence the distribution of disposable incomes is
still remarkable enough.
4.3 Fiscal autonomy and income (re-)distribution
In order to explore more properly the relation between fiscal competition and income (re-)
distribution, a different approach is now taken. The data provided by the Luxembourg Income
Study (see Atkinson et al. 1995) allows us to construct a panel dataset at least for a few, in our
case 13, OECD countries (see also Table 2). The most important advantage of this dataset is
the possible distinction between primary and final income distributions which allows for an
explicit analysis of the fiscal redistribution efforts undertaken by the government. The most
important disadvantage is the smaller sample size in the cross section domain, which does not

– 15 –
allow us to test for the effect of constitutional differences that featured prominently in the
previous subsection, nor to employ modern panel data techniques, in particular to estimate
fixed effects models. We thus first use the annual panel data with time fixed effects, but no
country fixed effects, and then also conduct our analysis on the basis of six-year-averages of
that data for the three periods 1981-1986, 1987-1992 and 1993-1998.
Nevertheless, insights concerning the impact of fiscal competition on income (re-)distribution
could be gained by using these data. Hence, they are matched with recent data collected by
Stegarescu (2004) on the basis of the methodology developed by the OECD (1999). Owing to
the unsatisfactory measurement of federalism by simple dummy variables, the share of sub-
central government spending in total government spending often is adopted as a variable to
capture the fiscal autonomy of state and local governments. OECD (1999) and Stegarescu
(2004) proceed further by focusing on taxation. The OECD (1999) measures the share of sub-
central tax revenue in total tax revenue for taxes that could be influenced by the state or local
governments. This measure permits differentiating the fiscal autonomy of state and local
governments either with regard to (1) tax rates only, tax bases only or both, (2) but also the
influence of state and local governments on joint taxation systems and (3) on the
determination of inter-governmental grants. Stegarescu (2004) applies the OECD approach
not only to single years, but constructs a yearly panel dataset from 1973 to 1998 and adds
further countries. This approach finally leaves three main indicators of fiscal autonomy with
respect to taxation in addition to the fiscal decentralization measure usually considered on the
spending side, i.e., the share of sub-central spending in total spending. The three measures
are: (1) the share of sub-central revenue in total revenue of which the state and local
governments (SLG) can determine tax rates or bases; (2) the share of sub-central revenue in
total revenue of which state and local governments can co-determine revenue from joint
taxation systems in addition to the former indicator; and, in addition to the revenue share as
calculated before, (3) the share of sub-central revenue in total revenue of which the state and
local governments have a say on grants.
Using these variables, we estimate a model in which the different Gini indexes (primary
income distribution, final income distribution, fiscal redistribution) are explained by GDP per
employee, public education spending, population growth, expenditure decentralization as
usually measured, revenue decentralization with SLG autonomy on tax rates or bases, revenue
decentralization with a SLG say on tax rates, bases or joint taxes, and revenue
decentralization with a SLG say on tax rates, bases, joint taxes or grants. Finally, openness is
– 16 –
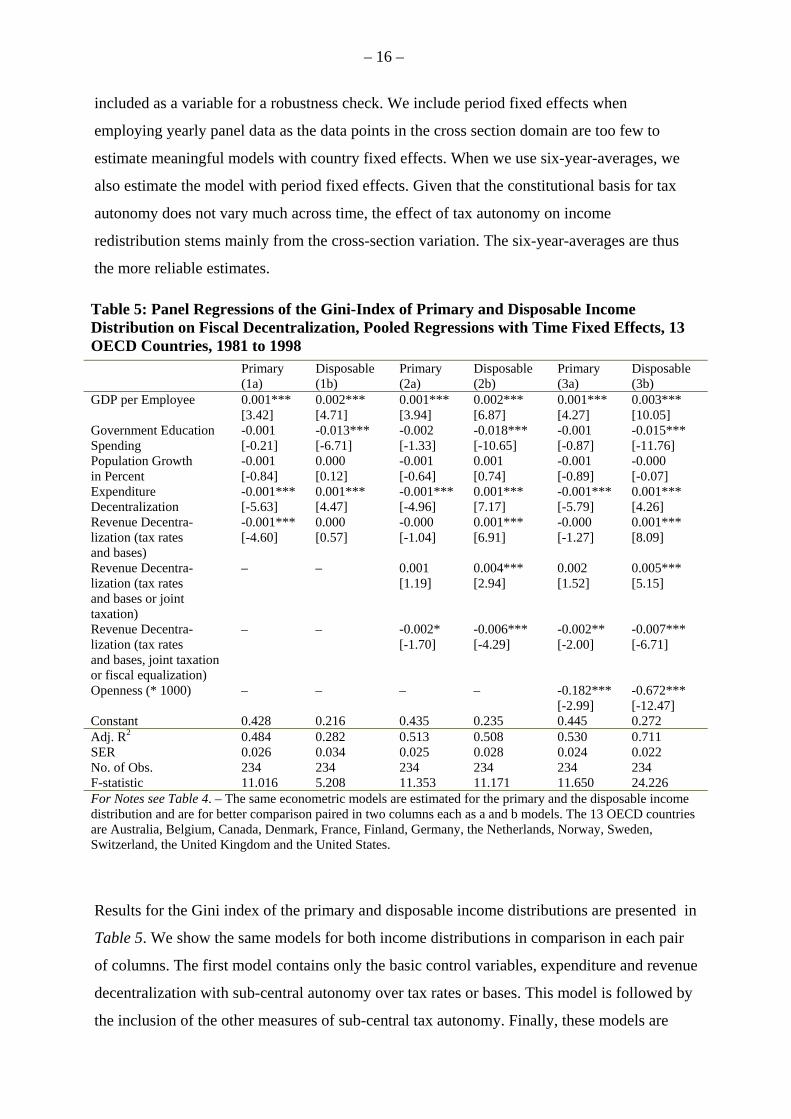
included as a variable for a robustness check. We include period fixed effects when
employing yearly panel data as the data points in the cross section domain are too few to
estimate meaningful models with country fixed effects. When we use six-year-averages, we
also estimate the model with period fixed effects. Given that the constitutional basis for tax
autonomy does not vary much across time, the effect of tax autonomy on income
redistribution stems mainly from the cross-section variation. The six-year-averages are thus
the more reliable estimates.
Table 5: Panel Regressions of the Gini-Index of Primary and Disposable Income Distribution on Fiscal Decentralization, Pooled Regressions with Time Fixed Effects, 13 OECD Countries, 1981 to 1998 Primary
(1a) Disposable (1b)
Primary (2a)
Disposable (2b)
Primary (3a)
Disposable (3b)
GDP per Employee 0.001*** [3.42]
0.002*** [4.71]
0.001*** [3.94]
0.002*** [6.87]
0.001*** [4.27]
0.003*** [10.05]
Government Education Spending
-0.001 [-0.21]
-0.013*** [-6.71]
-0.002 [-1.33]
-0.018*** [-10.65]
-0.001 [-0.87]
-0.015*** [-11.76]
Population Growth in Percent
-0.001 [-0.84]
0.000 [0.12]
-0.001 [-0.64]
0.001 [0.74]
-0.001 [-0.89]
-0.000 [-0.07]
Expenditure Decentralization
-0.001*** [-5.63]
0.001*** [4.47]
-0.001*** [-4.96]
0.001*** [7.17]
-0.001*** [-5.79]
0.001*** [4.26]
Revenue Decentra-lization (tax rates and bases)
-0.001*** [-4.60]
0.000 [0.57]
-0.000 [-1.04]
0.001*** [6.91]
-0.000 [-1.27]
0.001*** [8.09]
Revenue Decentra-lization (tax rates and bases or joint taxation)
– – 0.001 [1.19]
0.004*** [2.94]
0.002 [1.52]
0.005*** [5.15]
Revenue Decentra-lization (tax rates and bases, joint taxation or fiscal equalization)
– – -0.002* [-1.70]
-0.006*** [-4.29]
-0.002** [-2.00]
-0.007*** [-6.71]
Openness (* 1000) – – – – -0.182*** [-2.99]
-0.672*** [-12.47]
Constant 0.428 0.216 0.435 0.235 0.445 0.272 Adj. R2 0.484 0.282 0.513 0.508 0.530 0.711 SER 0.026 0.034 0.025 0.028 0.024 0.022 No. of Obs. 234 234 234 234 234 234 F-statistic 11.016 5.208 11.353 11.171 11.650 24.226 For Notes see Table 4. – The same econometric models are estimated for the primary and the disposable income distribution and are for better comparison paired in two columns each as a and b models. The 13 OECD countries are Australia, Belgium, Canada, Denmark, France, Finland, Germany, the Netherlands, Norway, Sweden, Switzerland, the United Kingdom and the United States.
Results for the Gini index of the primary and disposable income distributions are presented in
Table 5. We show the same models for both income distributions in comparison in each pair
of columns. The first model contains only the basic control variables, expenditure and revenue
decentralization with sub-central autonomy over tax rates or bases. This model is followed by
the inclusion of the other measures of sub-central tax autonomy. Finally, these models are

– 17 –
augmented by openness. In line with the previous subsections, we find that countries with a
higher GDP per employee, i.e., greater overall labor productivity, have a less equal primary
and disposable income distribution. Education or population growth do not have any robustly
significant impact on the primary income distribution, but public education spending is
significantly negatively associated with the Gini index of the disposable income distribution.
The primary income distribution is significantly more equal in countries with higher spending
or revenue decentralization. This particularly holds with respect to more taxing autonomy.
The relationship becomes statistically more uncertain if the revenue from joint taxation or
from grants is also included. This is indicated by the declining significance in model (1a) and
(2a) of Table 5. These results are robust to the inclusion of openness, which is itself highly
significant and negative (Model 3a). More open economies have a more equal primary
income distribution. As the primary income distribution is the income distribution (largely)
obtained due to individuals’ market activities, these results indicate that both fiscal
competition within a country or trade openness as an indicator of globalization do not
exacerbate the gaps between income classes.
Regarding the distribution of disposable income, indicators of fiscal decentralization are
significantly negatively associated with the Gini index of the final income distribution. This
holds for spending decentralization (Model 1b), but also for revenue decentralization when
state and local governments can decide on tax rates or tax bases and the other indicators of
revenue decentralization are included (Model 2b). A stronger participation in grant systems
reduces final income inequality, as it has a significantly negative effect on the Gini index of
the final income distribution. These results are largely robust to the inclusion of trade
openness, which again has a significantly negative coefficient, i.e., more open economies
have a more equal final income distribution (Model 3b).
Fiscal competition appears to restrict income redistribution. Whether this is actually the case
can be studied explicitly by considering the difference between the Gini indexes of the
primary income distribution and the distribution of disposable income measured in Gini
points. The respective estimation results are reported in Table 6 both for models in which the
primary income distribution is not controlled for, and for models in which it is. This is done in
order to capture the differences in the demand for income redistribution that more probably
occur owing to larger gaps between upper and lower income groups. According to the results
reported in models (1a), (2a) and (3a) in Table 6, expenditure and revenue decentralization
restrict the government’s ability to redistribute income when fiscal decentralization also

– 18 –
involves fiscal competition. Including the primary income distribution does not alter these
results as models (1b), (2b) and (3b) in Table 6 show. The less equal is the primary income
distribution, the greater the fiscal redistribution undertaken by the government is.
Nevertheless, fiscal decentralization, when accompanied by strong fiscal autonomy, is
associated with significantly less fiscal redistribution. Please also note that fiscal competition
induces a more equal distribution of primary income and, even though the distribution of
disposable income is less equal, it remains an open question as to how the effect of fiscal
competition on income distribution should be evaluated. Because measures of income
redistribution usually have adverse incentive effects that impact economic growth negatively,
fiscal competition might be favorable for countries with strong egalitarian preferences. A
rising tide lifts all boats, and fiscal decentralization might in the long-run enable some
countries to outperform those with more moderate income redistribution policies.
Table 6: Panel Regressions of Fiscal Redistribution Measured in Gini-Points on Fiscal Decentralization Without and With Controlling for the Primary Income Distribution, Pooled Regressions with Time Fixed Effects, 13 OECD Countries, 1981 to 1998 Without
(1a) With (1b)
Without (2a)
With (2b)
Without (3a)
With (3b)
GDP per Employee -0.001** [-2.40]
-0.001*** [-3.35]
-0.001*** [-3.45]
-0.002*** [-5.49]
-0.001*** [-4.65]
-0.002*** [-8.74]
Government Education Spending
0.013*** [7.36]
0.013** [7.68]
0.016*** [9.65]
0.017*** [11.24]
0.014*** [9.57]
0.015*** [12.66]
Population Growth in Percent
-0.001 [-0.84]
-0.001 [-0.64]
-0.001 [-1.33]
-0.001 [-1.16]
-0.001 [-0.83]
-0.000 [-0.36]
Gini Index of Primary Income Distribution
– 0.319*** [4.16]
– 0.476*** [7.04]
– 0.605*** [11.32]
Expenditure Decentraliza- tion
-0.002*** [-9.78]
-0.001*** [-8.01]
-0.002*** [-11.79]
-0.001*** [-10.12]
-0.001*** [-9.61]
-0.001*** [-7.13]
Revenue Decentralization (tax rates or bases)
-0.001*** [-4.52]
-0.001*** [-3.25]
-0.002*** [-7.97]
-0.001*** [-8.29]
-0.001*** [-8.46]
-0.001*** [-9.62]
Revenue Decentralization (tax rates or bases or joint taxation)
– – -0.002* [-1.93]
-0.003*** [-2.69]
-0.003*** [-3.05]
-0.004*** [-4.97]
Revenue Decentralization (tax rates or bases, joint taxation or fiscal equalization)
– – 0.004*** [2.84]
0.005*** [3.92]
0.004*** [3.95]
0.006*** [6.43]
Openness (* 1000) – – – – 0.489*** [8.07]
0.599*** [12.17]
Constant 0.213 0.076 0.020 -0.008 0.173 -0.096 Adj. R2 0.547 0.578 0.624 0.692 0.709 0.815 SER 0.030 0.029 0.028 0.025 0.024 0.019 No. of Obs. 234 234 234 234 234 234 F-statistic 13.932 15.053 17.338 22.245 24.005 41.214 For Notes see Table 4. – The dependent variable is the difference between the primary and the disposable income distribution measured in Gini points. The same econometric models are estimated for models with and without the primary income distribution as explanatory variable and are for better comparison paired in two columns each as a and b models.

– 19 –
The econometric models shown in Table 7 always include the primary income distribution.
Now we do not use annual panel data with period fixed effects, but use the six-years-averages
of our data in order to consider the fact that the underlying constitutions determining tax
autonomy do not vary that much across time. The results are very much in line with the
previous regressions reported in Table 6 although the reported t-statistics are in general lower.
Expenditure decentralization and revenue decentralization when state and local governments
can decide on tax rates or tax bases, i.e., for countries with strong tax autonomy, have a
negative effect on fiscal redistribution. In countries in which there exists a cooperative
element in fiscal federalism, i.e., joint taxation or grants, plays a role, fiscal redistribution is
higher. This also holds when controlling for openness.
Table 7: Panel Regressions of Fiscal Redistribution Measured in Gini-Points on Fiscal Decentralization Controlling for the Primary Income Distribution, Pooled Regressions with Time Fixed Effects, 13 OECD Countries, 1981 to 1998 (1) (2) (3) (4) GDP per Employee -0.001
[-1.25] -0.002** [-2.07]
-0.002** [-2.11]
-0.002*** [-3.84]
Government Education Spending 0.0145*** [3.19]
0.019*** [4.51]
0.020*** [4.95]
0.017*** [5.92]
Population Growth in Percent
0.000 [0.02]
-0.004 [-0.75]
-0.002 [-0.42]
-0.002 [-0.55]
Gini Index of Primary Income Distribution
0.245 [1.16]
0.404*** [2.12]
0.470** [2.59]
0.620*** [4.66]
Expenditure Decentralization -0.001*** [-3.02]
-0.002*** [-3.62]
-0.002*** [-3.84]
-0.001*** [-3.22]
Revenue Decentralization (tax rates or bases)
-0.001 [-1.41]
-0.002*** [-3.35]
-0.002*** [-3.59]
-0.001*** [-4.17]
Revenue Decentralization (tax rates or bases or joint taxation)
– 0.002*** [3.25]
-0.007* [-1.76]
-0.009*** [-3.38]
Revenue Decentralization (tax rates or bases, joint taxation or fiscal equalization)
– – 0.008** [2.18]
0.011*** [3.90]
Openness (* 1000) – – – 0.617*** [5.27]
Constant 0.090 0.010 -0.033 -0.122 Adj. R2 0.555 0.663 0.701 0.847 SER 0.030 0.026 0.024 0.018 No. of Obs. 39 39 39 39 F-statistic 6.91 9.29 9.91 20.15 For Notes see Table 4. – The dependent variable is the difference between the primary and the disposable income distribution measured in Gini points.
It should be noted that owing to sub-central autonomy, it is indeed warranted to speak of
fiscal competition, even though our decentralization measures prima facie capture
decentralization only. A look at the previous tables reveals a consistently positive effect on
redistribution for the revenue decentralization variable that includes revenue from fiscal
equalization. Moving away from tax competition towards cooperative federalism with a

– 20 –
strong reliance on fiscal transfers appears to reverse the incentives for policy-makers to
engage in redistributive policies.
These results also facilitate the interpretation of the other regressions. For example, by
themselves the results in Table 5 could also be interpreted differently: Countries with a more
equal primary distribution could feel less need to redistribute through the central budget.
Instead, they decentralize and allow the sub-central level to supply public goods. However, as
we see in Tables 6 and 7, the negative effect of decentralization on redistribution is robust
even when controlling for the primary distribution.. This lends some support to our
interpretation.
5. Concluding remarks
In this paper, we have provided evidence on the impact of formal political institutions on the
actual income redistribution achieved by the state, and on inequality in primary and
disposable incomes, as measured by Gini coefficients. The main results support the view that
the way income is redistributed in different countries depends also on the respective
constitutional framework, which is always associated with a particular set of incentives for
policy-makers, and also voters.
The cross country analysis reveals that countries with presidential systems have a
(marginally) significantly less equal distribution of disposable incomes than parliamentary
systems. This result is robust to the inclusion of additional explanatory variables and could
thus be seen as a ceteris paribus result. Strictly speaking, this does not tell us directly how
income redistribution is going on in presidential systems. Together with the well-known result
from the literature that presidential systems have significantly less welfare spending, it is,
however, a plausible conclusion that presidential systems allow for a less broad-based
redistribution of income, and end up with higher inequality.
In contrast to presidential systems, plurality rule does not significantly affect the distribution
of disposable incomes. Majoritarian systems do not end up with more inequality than systems
with proportional representation, despite the fact that welfare spending on average is lower
under plurality rule. More research is thus needed to find out how exactly mechanisms of
income redistribution are working under plurality rule.
In this cross section analysis, we also do not observe any significant effect of a dummy
variable for federalism on the distribution of disposable incomes. This is not surprising given

– 21 –
that federalism can be constituted in different ways. A dummy variable is not able to
distinguish between federations with more or less fiscal competition at the sub-federal levels.
Moreover, fiscal competition might also occur in unitary states if local governments are
fiscally autonomous. We thus have a closer look at the extent of tax autonomy using annual
panel data for 13 OECD countries between 1981 and 1998 as well as six-years-averages for
the same time period and its impact on income distributions. It turns out in the analysis that
more tax autonomy at the sub-federal levels in those countries is associated with a
significantly more equal primary income distribution, a significantly less equal distribution of
disposable incomes and consequently also less fiscal redistribution as measured in Gini
points. The latter result particularly holds when the primary income distribution is controlled
for.
Interestingly, trade openness is associated with more equal primary and final income
distributions and with significantly more fiscal redistribution. While competitive federalism
and trade openness seemingly increase the chances individuals have for raising their incomes
overall, competitive federalism also appears to restrain on the possibilities governments from
redistributing incomes.

– 22 –
Acknowledgments A previous, less focused version of this paper has been circulated under the title “Still a
Director’s Law? On the Political Economy of Income Redistribution”. We thank the Institut
de Recherche Européenne en Economie et Fiscalité (IREF) for funding this research. The
paper has been presented at the meetings of the Public Choice Society in San Antonio, the
European Public Choice Society in Athens, the Mont Pelerin Society in Prague, the European
Economic Association in Milan, the International Institute of Public Finance in Maastricht,
the German Economic Association in Graz, at seminars at the Istituto Bruno Leoni in Milan,
at the University of Siegen and of Hagen. We thank the discussants of our paper and
participants in the sessions, in particular Randy Holcombe for valuable comments and
suggestions. We are also indebted to two anonymous referees and to the editor in charge of
this paper, Bill Shughart, for their careful reading of an earlier version of the manuscript, and
for their detailed comments. Finally, we would like to thank Heiko Burret, Ekkehard Köhler
and Sarah Necker for very valuable research assistance.
References Atkinson, A.B., Rainwater, L. & Smeeding, T.M. (1995). Income Redistribution in OECD Countries:
Evidence from the Luxembourg Income Study. Paris: OECD.
Austen-Smith, D. (2000). Redistributing Income Under Proportional Representation. Journal of Political Economy, 108(6), 1235-1269.
Bjørnskov, C., Dreher, A., Fischer, J., Schnellenbach, J. & Gehring, K. (2013). Inequality and Happiness. When Perceived Social Mobility and Economic Reality Do Not Match. Journal of Economic Behavior and Organization, 91(1), 75-92.
Brennan, G. & Buchanan, J.M. (1980). The Power to Tax: Analytical Foundations of a Fiscal Constitution. Cambridge: Cambridge University Press.
Buettner, T. (2006). The Incentive Effect of Fiscal Equalization Transfers on Tax Policy. Journal of Public Economics, 90(3), 477-497.
Feld, L.P. & Kirchgässner, G. (2001). The Political Economy of Direct Legislation: Direct Democracy in Local and Regional Decision-Making. Economic Policy, 33, 329-367.
Feld, L.P. & Schnellenbach, J. (2007). Still A Director’s Law? On the Political Economy of Income Redistribution. Paris: Institut de Recherches Économiques et Fiscales.
Feld, L.P., Fischer, J. & Kirchgässner, G. (2010). The Effect of Direct Democracy on Income Redistribution: Evidence for Switzerland. Economic Inquiry, 48(4), 817-840.
Harms, P. & Zink, S. (2003). Limits to Redistribution in a Democracy: A Survey. European Journal of Political Economy, 19(4), 651-668.
Huber, J.D. (1996). The Vote of Confidence in Parliamentary Democracies. American Political Science Review, 90(2), 269-282.

– 23 –
Kroszner, R.S. & Stratmann, T. (1998). Interest-Group Competition and the Organization of Congress: Theory and Evidence from Financial Services’ Political Action Committees. American Economic Review, 88(5), 1163-1187.
Milesi-Ferreti, G.-M., Perotti, R. & Rostagno, M. (2002), Electoral Systems and the Composition of Public Spending. Quarterly Journal of Economics, 117(2), 609-657.
Mueller, D.C. (2003). Public Choice III. Cambridge: Cambridge University Press.
OECD (1999). Taxing Powers of State and Local Government. OECD Tax Policy Studies No. 1. Paris: OECD.
Olson, M. (1982). The Rise and Decline of Nations: Economic Growth, Stagflation, and Social Rigidities. New Haven &London: Yale University Press.
Pauly, M.V. (1973). Income Redistribution as a Local Public Good. Journal of Public Economics, 2(1), 35-58.
Persson, T. & Tabellini, G. (1999). The Size and Scope of Government: Comparative Politics with Rational Politicians. European Economic Review, 43(4-6), 699-735.
Persson, T. & Tabellini, G. (2000). Political Economics. Explaining Economic Policy. Cambridge, MA: MIT Press.
Persson, T. & Tabellini, G. (2003). The Economic Effects of Constitutions. Cambridge, MA: MIT Press.
Rodrik, D. (1998). Why Do More Open Economies Have Bigger Governments?. Journal of Political Economy, 106(5), 997-1032.
Roemer, J.E. & van der Straeten, K. (2006). The Political Economy of Xenophobia and Distribution. Scandinavian Journal of Economics, 108(2), 251-277.
Sinn, H.-W. (2003). The New Systems Competition. Oxford: Blackwell.
Stegarescu, D. (2004). Public Sector Decentralization: Measurement Concepts and Recent International Trends. Working Paper, Mannheim: Centre for European Economic Research (ZEW).
Stigler, G.J. (1970). Director’s Law of Public Income Redistribution. Journal of Law and Economics, 13(1), 1-10.
Tiebout, C.M. (1956). A Pure Theory of Local Expenditures. Journal of Political Economy, 64(5), 416-424.
Voigt, S. (2011). Positive Constitutional Economics II – A Survey of Recent Developments. Public Choice, 146(1-2), 205-256.

– 24 –
Appendix The 70 countries included in the analysis of Table 4
Australia Germany Peru Austria Ghana Philippines Bahamas Greece Poland Bangladesh Guatemala Portugal Belarus Honduras Romania Belgium Hungary Senegal Bolivia India Singapore Botswana Ireland Slovak Republic Brazil Israel South Africa Bulgaria Italy Spain Canada Jamaica Sri Lanka Chile Japan Sweden Colombia Luxembourg Switzerland Costa Rica Malawi Thailand Czech Republic Malaysia Trinidad & Tobago Denmark Mauritius Turkey Dominican Republic Mexico United Kingdom Ecuador Nepal Ukraine El Salvador Netherlands USA Estonia New Zeland Venezuela Fiji Nicaragua Zambia Finland Norway Zimbabwe France Pakistan Gambia Paraguay

Freiburger Diskussionspapiere zur Ordnungsökonomik
Freiburg Discussion Papers on Constitutional Economics
2013
13/6 Feld, Lars P. / Schnellenbach, Jan: Political Institutions and Income (Re-)Distribution: Evidence from Developed Economies
13/5 Feld, Lars P. / Osterloh, Steffen: Is a Fiscal Capacity Really Necessary to Complete EMU?
13/4 Vanberg, Viktor J.: James M. Buchanan's Contractarianism and Modern Liberalism
13/3 Vanberg, Viktor J.: Föderaler Wettbewerb, Bürgersouveränität und die zwei Rollen des Staates
13/2 Bjørnskov, Christian / Dreher, Axel / Fischer, Justina A.V. / Schnellenbach, Jan / Gehring, Kai: Inequality and happiness: When perceived social mobility and economic reality do not match
13/1 Mayer, Thomas: Die Ökonomen im Elfenbeinturm: ratlos - Eine österreichische Antwort auf die Krise der modernen Makroökonomik und Finanztheorie
2012
12/5 Schnellenbach, Jan: The Economics of Taxing Net Wealth: A Survey of the Issues
12/4 Goldschmidt, Nils / Hesse, Jan-Otmar: Eucken, Hayek, and the Road to Serfdom
12/3 Goldschmidt, Nils: Gibt es eine ordoliberale Entwicklungsidee? Walter Euckens Analyse des gesellschaftlichen und wirtschaftlichen Wandels
12/2 Feld, Lars P.: Europa in der Welt von heute: Wilhelm Röpke und die Zukunft der Europäischen Währungsunion
12/1 Vanberg, Viktor J.: Hayek in Freiburg
2011
11/4 Leuermann, Andrea / Necker, Sarah: Intergenerational Transmission of Risk Attitudes - A Revealed Preference Approach
11/3 Wohlgemuth, Michael: The Boundaries of the State
11/2 Feld, Lars P. / Köhler Ekkehard A.: Zur Zukunft der Ordnungsökonomik
11/1 Vanberg, Viktor J.: Moral und Wirtschaftsordnung: Zu den ethischen Grundlagen einer freien Gesellschaft
2010
10/5 Bernholz, Peter: Politics, Financial Crisis, Central Bank Constitution and Monetary Policy
10/4 Tietmeyer, Hans: Soziale Marktwirtschaft in Deutschland - Entwicklungen und Erfahrungen
10/3 Vanberg, Viktor J.: Freiheit und Verantwortung: Neurowissenschaftliche Erkenntnisse und ordnungsökonomische Folgerungen
10/2 Vanberg, Viktor J.: Competition among Governments: The State’s Two Roles in a Globalized World
10/1 Berghahn, Volker: Ludwig Erhard, die Freiburger Schule und das ‘Amerikanische Jahrhundert’

2009
09/10 Dathe, Uwe: Walter Euckens Weg zum Liberalismus (1918-1934)
09/9 Wohlgemuth, Michael: Diagnosen der Moderne: Friedrich A. von Hayek
09/8 Bernhardt, Wolfgang: Wirtschaftsethik auf Abwegen
09/7 Mäding, Heinrich: Raumplanung in der Sozialen Marktwirtschaft: Ein Vortrag
09/6 Koenig, Andreas: Verfassungsgerichte in der Demokratie bei Hayek und Posner
09/5 Berthold, Norbert / Brunner, Alexander: Gibt es ein europäisches Sozialmodell?
09/4 Vanberg, Viktor J.: Liberal Constitutionalism, Constitutional Liberalism and Democracy
09/3 Vanberg, Viktor J.: Consumer Welfare, Total Welfare and Economic Freedom – On the Normative Foundations of Competition Policy
09/2 Goldschmidt, Nils: Liberalismus als Kulturideal. Wilhelm Röpke und die kulturelle Ökonomik.
09/1 Bernhardt, Wolfgang: Familienunternehmen in Zeiten der Krise – Nachhilfestunden von oder für Publikumsgesellschaften?
2008
08/10 Borella, Sara: EU-Migrationspolitik. Bremse statt Motor der Liberalisierung.
08/9 Wohlgemuth, Michael: A European Social Model of State-Market Relations: The ethics of competition from a „neo-liberal“ perspective.
08/8 Vanberg, Viktor J.: Markt und Staat in einer globalisierten Welt: Die ordnungs-ökonomische Perspektive.
08/7 Vanberg, Viktor J.: Rationalität, Regelbefolgung und Emotionen: Zur Ökonomik morali-scher Präferenzen. Veröffentlicht in: V. Vanberg: Wettbewerb und Regelordnung, Tübingen: Mohr, 2008, S. 241-268.
08/6 Vanberg, Viktor J.: Die Ethik der Wettbewerbsordnung und die Versuchungen der Sozialen Marktwirtschaft
08/5 Wohlgemuth, Michael: Europäische Ordnungspolitik
08/4 Löwisch, Manfred: Staatlicher Mindestlohn rechtlich gesehen – Zu den gesetzgeberischen Anstrengungen in Sachen Mindestlohn
08/3 Ott, Notburga: Wie sichert man die Zukunft der Familie?
08/2 Vanberg, Viktor J.: Schumpeter and Mises as ‘Austrian Economists’
08/1 Vanberg, Viktor J.: The ‘Science-as-Market’ Analogy: A Constitutional Economics Perspective.
2007
07/9 Wohlgemuth, Michael: Learning through Institutional Competition. Veröffentlicht in: A. Bergh und R. Höijer (Hg.). Institutional Competition, Cheltenham: Edward Elgar, 2008, S. 67-89.
07/8 Zweynert, Joachim: Die Entstehung ordnungsökonomischer Paradigmen – theoriege-schichtliche Betrachtungen.
07/7 Körner, Heiko: Soziale Marktwirtschaft. Versuch einer pragmatischen Begründung.
07/6 Vanberg, Viktor J.: Rational Choice, Preferences over Actions and Rule-Following Behavior.
07/5 Vanberg, Viktor J.: Privatrechtsgesellschaft und ökonomische Theorie. Veröffentlicht in: K. Riesenhuber (Hg.) Privatrechtsgesellschaft – Entwicklung, Stand und Verfassung des Privatrechts, Tübingen: Mohr Siebeck, 2008, S. 131-162.

07/4 Goldschmidt, Nils / Rauchenschwandtner, Hermann: The Philosophy of Social Market Economy: Michel Foucault’s Analysis of Ordoliberalism.
07/3 Fuest, Clemens: Sind unsere sozialen Sicherungssysteme generationengerecht?
07/2 Pelikan, Pavel: Public Choice with Unequally Rational Individuals.
07/1 Voßwinkel, Jan: Die (Un-)Ordnung des deutschen Föderalismus. Überlegungen zu einer konstitutionenökonomischen Analyse.
2006
06/10 Schmidt, André: Wie ökonomisch ist der „more economic approach“? Einige kritische Anmerkungen aus ordnungsökonomischer Sicht.
06/9 Vanberg, Viktor J.: Individual Liberty and Political Institutions: On the Complementarity of Liberalism and Democracy. Veröffentlicht in: Journal of Institutional Economics, Vol. 4, Nr. 2, 2008, S. 139-161.
06/8 Goldschmidt, Nils: Ein „sozial temperierter Kapitalismus“? – Götz Briefs und die Begründung einer sozialethisch fundierten Theorie von Markt und Gesellschaft. Veröffentlicht in: Freiburger Universitätsblätter 42, Heft 173, 2006, S. 59-77.
06/7 Wohlgemuth, Michael / Brandi, Clara: Strategies of Flexible Integration and Enlargement of the European Union. A Club-theoretical and Constitutional Economics Perspective. Veröffentlicht in: Varwick, J. / Lang. K.O. (Eds.): European Neighbourhood Policy, Opladen: Budrich, 2007, S. 159-180.
06/6 Vanberg, Viktor J.: Corporate Social Responsibility and the “Game of Catallaxy”: The Perspective of Constitutional Economics. Veröffentlicht in: Constitutional Political Economy, Vol. 18, 2007, S. 199-222.
06/5 Pelikan, Pavel: Markets vs. Government when Rationality is Unequally Bounded: Some Consequences of Cognitive Inequalities for Theory and Policy.
06/4 Goldschmidt, Nils: Kann oder soll es Sektoren geben, die dem Markt entzogen werden und gibt es in dieser Frage einen (unüberbrückbaren) Hiatus zwischen ‚sozialethischer’ und ‚ökonomischer’ Perspektive? Veröffentlicht in: D. Aufderheide, M. Dabrowski (Hrsg.): Markt und Wettbewerb in der Sozialwirtschaft. Wirtschafts-ethische Perspektiven für den Pflegesektor, Berlin: Duncker & Humblot 2007, S. 53-81.
06/3 Marx, Reinhard: Wirtschaftsliberalismus und Katholische Soziallehre.
06/2 Vanberg, Viktor J.: Democracy, Citizen Sovereignty and Constitutional Economics. Veröffentlicht in: Constitutional Political Economy Volume 11, Number 1, März 2000, S. 87-112 und in: Casas Pardo, J., Schwartz, P.(Hg.): Public Choice and the Challenges of Democracy, Cheltenham: Edward Elgar, 2007, S. 101-120.
06/1 Wohlgemuth, Michael: Demokratie und Marktwirtschaft als Bedingungen für sozialen Fortschritt. Veröffentlicht in: R. Clapham, G. Schwarz (Hrsg.): Die Fortschrittsidee und die Marktwirtschaft, Zürich: Verlag Neue Zürcher Zeitung 2006, S. 131-162.
2005
05/13 Kersting, Wolfgang: Der liberale Liberalismus. Notwendige Abgrenzungen. In erweiterter Fassung veröffentlicht als: Beiträge zur Ordnungstheorie und Ordnungspolitik Nr. 173, Tübingen: Mohr Siebeck 2006.
05/12 Vanberg, Viktor J.: Der Markt als kreativer Prozess: Die Ökonomik ist keine zweite Physik. Veröffentlicht in: G. Abel (Hrsg.): Kreativität. XX. Deutscher Kongress für Philosophie. Kolloquiumsbeiträge, Hamburg: Meiner 2006, S. 1101-1128.
05/11 Vanberg, Viktor J.: Marktwirtschaft und Gerechtigkeit. Zu F.A. Hayeks Kritik am Konzept der „sozialen Gerechtigkeit“. Veröffentlicht in: Jahrbuch Normative und institutio-nelle Grundfragen der Ökonomik, Bd. 5: „Soziale Sicherung in Marktgesellschaften“, hrsg. von M. Held, G. Kubon-Gilke, R. Sturn, Marburg: Metropolis 2006, S. 39-69.

05/10 Goldschmidt, Nils: Ist Gier gut? Ökonomisches Selbstinteresse zwischen Maßlosigkeit und Bescheidenheit. Veröffentlicht in: U. Mummert, F.L. Sell (Hrsg.): Emotionen, Markt und Moral, Münster: Lit 2005, S. 289-313.
05/9 Wohlgemuth, Michael: Politik und Emotionen: Emotionale Politikgrundlagen und Politiken indirekter Emotionssteuerung. Veröffentlicht in: U. Mummert, F.L. Sell (Hrsg.): Emotionen, Markt und Moral, Münster: Lit 2005, S. 359-392.
05/8 Müller, Klaus-Peter / Weber, Manfred: Versagt die soziale Marktwirtschaft? – Deutsche Irrtümer.
05/7 Borella, Sara: Political reform from a constitutional economics perspective: a hurdle-race. The case of migration politics in Germany.
05/6 Körner, Heiko: Walter Eucken – Karl Schiller: Unterschiedliche Wege zur Ordnungspolitik.
05/5 Vanberg, Viktor J.: Das Paradoxon der Marktwirtschaft: Die Verfassung des Marktes und das Problem der „sozialen Sicherheit“. Veröffentlicht in: H. Leipold, D. Wentzel (Hrsg.): Ordnungsökonomik als aktuelle Herausforderung, Stuttgart: Lucius & Lucius 2005, S. 51-67.
05/4 Weizsäcker, C. Christian von: Hayek und Keynes: Eine Synthese. In veränderter Fassung veröffentlicht in: ORDO, Bd. 56, 2005, S. 95-111.
05/3 Zweynert, Joachim / Goldschmidt, Nils: The Two Transitions in Central and Eastern Europe and the Relation between Path Dependent and Politically Implemented Institutional Change. In veränderter Fassung veröffentlicht in: Journal of Economic Issues, Vol. 40, 2006, S. 895-918.
05/2 Vanberg, Viktor J.: Auch Staaten tut Wettbewerb gut: Eine Replik auf Paul Kirchhof. Veröffentlicht in: ORDO, Bd. 56, 2005, S. 47-53.
05/1 Eith, Ulrich / Goldschmidt, Nils: Zwischen Zustimmungsfähigkeit und tatsächlicher Zustimmung: Kriterien für Reformpolitik aus ordnungsökonomischer und politik-wissenschaftlicher Perspektive. Veröffentlicht in: D. Haubner, E. Mezger, H. Schwengel (Hrsg.): Agendasetting und Reformpolitik. Strategische Kommunikation zwischen verschiedenen Welten, Marburg: Metropolis 2005, S. 51-70.
Eine Aufstellung über weitere Diskussionspapiere ist auf der Homepage des Walter Eucken Instituts erhältlich.