Embed Size (px)
Citation preview
Available online at www.sciencedirect.com
t 112 (2008) 1927–1941www.elsevier.com/locate/rse
Remote Sensing of Environmen
QuickBird and Hyperion data analysis of an invasive plant species in theGalapagos Islands of Ecuador: Implications for control
and land use management
Stephen J. Walsh a,⁎, Amy L. McCleary a, Carlos F. Mena a, Yang Shao a, Julie P. Tuttle a,Augusto González b, Rachel Atkinson c
a Department of Geography and Carolina Population Center, University of North Carolina — Chapel Hill, USAb Centro de Levantamientos Integrados de Recursos Naturales por Sensores Remotos, CLIRSEN, Quito, Ecuador
c Charles Darwin Foundation, Puerto Ayora, Santa Cruz Island, Galapagos Islands, Ecuador
Received 16 November 2006; received in revised form 11 May 2007; accepted 2 June 2007
Abstract
In the Galapagos Islands of Ecuador, one of the greatest threats to the terrestrial ecosystem is the increasing number and areal extent of invasivespecies. Increased human presence on the islands has hastened the introduction of plant and animal species that threaten the native and endemic flora andfauna. Considerable research on invasive species in the Galapagos Islands has been conducted by the Charles Darwin Foundation.We complement thatwork through a spatially- and spectrally-explicit satellite assessment of an important invasive plant species (Psidium guajava— guava) on Isabela Islandthat integrates diverse remote sensing systems, data types, spatial and spectral resolutions, and analytical and image processing approaches.QuickBirdandHyperion satellite data are processed to characterize the areal extent and spatial structure of guava through the following approaches: (1)QuickBirddata are classified through a traditional pixel-based approach (i.e., an unsupervised classification approach using the ISODATA algorithm), as well as anObject-Based Image Analysis (OBIA) approach; (2) multiple approaches for spectral “unmixing” of the Hyperion hyper-spectral data are assessed toconstruct spectral end-members from QuickBird data using linear and non-linear mixture modeling approaches; and (3) landscape pattern metrics arecalculated and compared for the pixel-based, object-based, and spectral unmixing approaches. The spectral–spatial characteristics of guava areinterpreted relative to management strategies for the control of guava and the restoration of natural ecosystems in the Galapagos National Park.© 2008 Elsevier Inc. All rights reserved.
Keywords: Galapagos; Guava;Hyperion andQuickBird data; Object-Based Image Analysis (OBIA); Mixture modeling; Pattern metrics; Invasive species management
1. Introduction
In 1959, the Galapagos National Park was formed, and in1973, the archipelago was incorporated as the 22nd province ofEcuador. UNESCO (United Nations Educational, Scientific,and Cultural Organization) designated the Galapagos as a WorldHeritage Site in 1978, a UN designation to honor the“magnificent and unique” natural features of the Galapagosand to ensure their conservation for future generations. Theseislands were further deemed a Biosphere Reserve in 1987, andthe Galapagos Marine Reserve was included in 2001. The
⁎ Corresponding author.E-mail address: [email protected] (S.J. Walsh).
0034-4257/$ - see front matter © 2008 Elsevier Inc. All rights reserved.doi:10.1016/j.rse.2007.06.028
Marine Reserve was formed with the 1998 passage of theSpecial Law for Galapagos by the Ecuadorian government thatwas designed to “protect and conserve the marine and terrestrialresources of the Islands.”
One of the greatest threats to the terrestrial ecosystem of theGalapagos Islands is the ever increasing number and distributionof invasive plant and animal species throughout the archipelago,but particularly evident on the four populated Islands — SantaCruz, San Cristobal, Floreana, and Isabela. Increased humanpresence through in-migration and tourism has hastened theintroduction of non-native species (Mauchamp, 1997), some ofwhich have become invasive and threaten the native and endemicflora and fauna of this fragile and charismatic ecosystem. Manyplant species have been introduced for their fruit, wood, and
1928 S.J. Walsh et al. / Remote Sensing of Environment 112 (2008) 1927–1941
medicines, or as ornamentals. Some of these species have becomeinvasive, thereby, dominating agricultural land, becoming asource of expense and frustration to local farmers, and replacingnatural ecosystems at an alarming rate. To the fragile ecosystemsof the Galapagos, these invasive species change the biologicaldiversity, modify ecological processes and services, and competewith other native species. Thirty-seven of more than 800 alienplant species are considered highly invasive in the Galapagosarchipelago (Tye, 2001). Psidium guajava (guava), the species offocus in this research, is particularly invasive. Introduced for itsfruit, it now dominates large areas of farmland and National Park.The result is the replacement of natural ecosystems with amonoculture of this introduced species.
The basic intent of this research is to describe the use ofQuickBird and Hyperion satellite data to characterize theoccurrence and spatial pattern of guava for a test site on IsabelaIsland in the Galapagos archipelago. Using satellite image dataand field data collected in 2006 and 2007, the areal extent,distribution, and spatial structure of guava are examined throughthe following approaches: (1) QuickBird data are examinedthrough a pixel-based classification approach (i.e., an unsuper-vised classification using the ISODATA algorithm), as well asan Object-Based Image Analysis (i.e., OBIA) approach;(2) Hyperion data are assessed using the Minimum NoiseFraction (MNF) and Pure Pixel Index (PPI) to examine thespectral characteristics of guava, and to link that information tothe classified QuickBird data (i.e., 4×4-m spatial resolution) tocharacterize spectral end-members and to “unmix” the 30×30-mHyperion data using linear and non-linear modeling approaches;and (3) image classifications are compared through the use ofecological pattern metrics that describe the spatial structure ofguava as represented in the pixel- and object-based classifica-tions, as well as the spectral unmixing approaches.
The synergism between remote sensing and landscapeanalysis is necessary, because measurements of the spatialconfiguration and condition of the landscape pattern provideinsights into the process of invasion. For example, field studiesand empirical observations suggest that the control of guava isbest achieved early in the invasion process when plants areyoung and patches are small, disconnected, and isolated (Tye,2007, personal communication). Thus, the use of remotesensing to identify these areas could help increase theeffectiveness of control programs. In this research, we examinethe sensitivity of QuickBird and Hyperion data to characterizethe spectral–spatial characteristics of guava, allowing assess-ment of landscape patterns, and describing the similarities anddifferences in their characterization generated by different datatypes, resolutions, and image processing approaches.
2. Study area
The Galapagos Islands are located approximately 1000 kmfrom the mainland of Ecuador. They are a living laboratory forthe study of evolution, global environmental change, biodiver-sity, and the conflicts between nature and society. TheGalapagos archipelago encompasses 19 large islands (four ofwhich have human populations) and 200 small islands and
rocks totaling approximately 8010 km2 dispersed throughout anarea of 70,000 km2. Nearly 97% of the archipelago is protectedas the Galapagos National Park and Natural Heritage site; theremaining nearly 3% is a colonization zone of communities andagricultural areas. In 1973, the archipelago was incorporated asthe 22nd province of Ecuador.
The Galapagos Islands are a popular tourism destination, andover the past 20 years, development of the tourism industry anda boom in fishing has resulted in the growth of the localpopulation from nearly 10,000 in 1990 to nearly 25,000residents in 2006. In addition to settlement pressures on theIslands, the number of tourist visitors has increased from about41,000 in 1990 to more than 125,000 today.
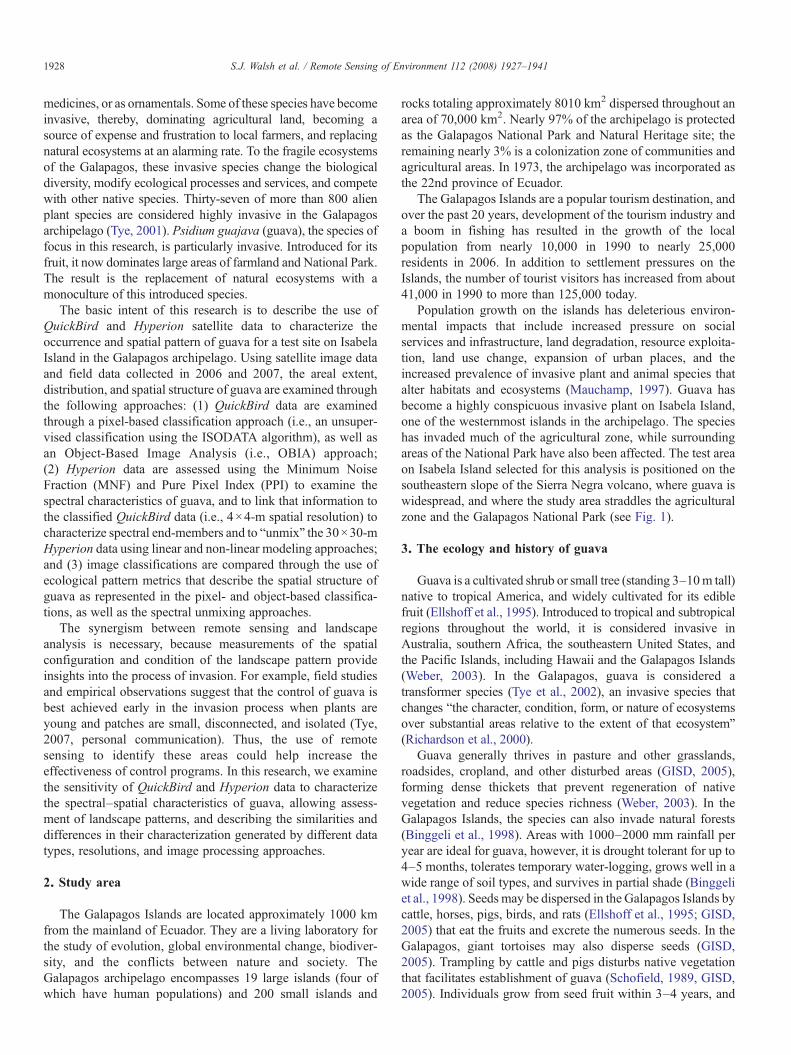
Population growth on the islands has deleterious environ-mental impacts that include increased pressure on socialservices and infrastructure, land degradation, resource exploita-tion, land use change, expansion of urban places, and theincreased prevalence of invasive plant and animal species thatalter habitats and ecosystems (Mauchamp, 1997). Guava hasbecome a highly conspicuous invasive plant on Isabela Island,one of the westernmost islands in the archipelago. The specieshas invaded much of the agricultural zone, while surroundingareas of the National Park have also been affected. The test areaon Isabela Island selected for this analysis is positioned on thesoutheastern slope of the Sierra Negra volcano, where guava iswidespread, and where the study area straddles the agriculturalzone and the Galapagos National Park (see Fig. 1).
3. The ecology and history of guava
Guava is a cultivated shrub or small tree (standing 3–10m tall)native to tropical America, and widely cultivated for its ediblefruit (Ellshoff et al., 1995). Introduced to tropical and subtropicalregions throughout the world, it is considered invasive inAustralia, southern Africa, the southeastern United States, andthe Pacific Islands, including Hawaii and the Galapagos Islands(Weber, 2003). In the Galapagos, guava is considered atransformer species (Tye et al., 2002), an invasive species thatchanges “the character, condition, form, or nature of ecosystemsover substantial areas relative to the extent of that ecosystem”(Richardson et al., 2000).
Guava generally thrives in pasture and other grasslands,roadsides, cropland, and other disturbed areas (GISD, 2005),forming dense thickets that prevent regeneration of nativevegetation and reduce species richness (Weber, 2003). In theGalapagos Islands, the species can also invade natural forests(Binggeli et al., 1998). Areas with 1000–2000 mm rainfall peryear are ideal for guava, however, it is drought tolerant for up to4–5 months, tolerates temporary water-logging, grows well in awide range of soil types, and survives in partial shade (Binggeliet al., 1998). Seeds may be dispersed in the Galapagos Islands bycattle, horses, pigs, birds, and rats (Ellshoff et al., 1995; GISD,2005) that eat the fruits and excrete the numerous seeds. In theGalapagos, giant tortoises may also disperse seeds (GISD,2005). Trampling by cattle and pigs disturbs native vegetationthat facilitates establishment of guava (Schofield, 1989, GISD,2005). Individuals grow from seed fruit within 3–4 years, and

Fig. 1. Study area location on Isabela Island, the Galapagos Islands — Ecuador. Source: Isabela Island map created by CLIRSEN, Quito, Ecuador.
1929S.J. Walsh et al. / Remote Sensing of Environment 112 (2008) 1927–1941
trees have a lifespan of 30–40 years (GISD, 2005). Guava alsoregenerates by root suckering (Binggeli et al., 1998). In theGalapagos, both the high rainfall associated with El Niño eventsand fires are thought to have hastened its spread (Tye, 2001).
Like other cultivated species introduced to the Galapagos,guava was introduced into the humid highlands through theagricultural zone on Isabela Island, an area completelysurrounded by Park land that originally consisted of endemicScalesia forests and the treeless fern-sedge zone (Hamann,1981). Its dispersal from the agricultural zone has beenfacilitated by cattle, pigs, and other feral animals (GISD,2005) that routinely graze in both zones. In our study area,confirmed in the field during 2006 and 2007, guava wasubiquitous on roadsides and in pastures, dominated in densethickets or forests in fallow agricultural areas, and formed adense, mono-specific forest in former fern-sedge areas of thePark between the agricultural zone and the Sierra Negra caldera.
4. Methods
A study of the spectral–spatial characteristics of guava wasconducted as a preliminary assessment of the use of remotesensing in invasive species management in the Galapagosarchipelago. The study design involved the use of (1) QuickBirddata and Hyperion data to characterize the pattern of guava for atest site on Isabela Island, (2) differentially-corrected GPScoordinates to geo-locate field observations and measurementscollected in 2006 and 2007, and (3) image processingapproaches to characterize the composition and spatialorganization of guava patches that involved pixel-based andobject-based classification approaches of QuickBird data,spectral “unmixing” of Hyperion data using the classifiedQuickBird data, and linear and non-linear mixture modeling
approaches to decompose pixels into their guava percentages orfractions using spectral end-members. Ecological patternsmetrics also were used to examine the spatial structure ofguava across the study area for the pixel- and object-basedclassifications, as well as the unmixing approaches.
QuickBird collects data for a 20- to 40-km swath using apanchromatic band and four visible/near-infrared bands. Thepanchromatic band (0.45–0.90 μm) has a pixel resolution of0.61×0.61 m, whereas the multi-spectral bands (ranging from0.45–0.89 μm) have a 2.44×2.44-m spatial resolution. In thisresearch, we used the multi-spectral data characterized at thecoarser spatial resolution. The data collected by QuickBird arequantized to 11-bits, and the sensors are a linear array push-broom design. The QuickBird data used in this analysis werecollected on 22 October 2004.
Hyperion collects 220 unique spectral channels ranging from0.357 to 2.576 μm with a 10-nm bandwidth. The instrumentalso operates in a push-broom fashion, with a spatial resolutionof 30×30 m for all channels. The standard scene width is7.7 km, and the standard scene length is 42 km. The Hyperiondata used in this analysis were collected on 14 June 2002. Boththe QuickBird and the Hyperion data sets were acquired byCLIRSEN, the Ecuadorian remote sensing and land use/landcover agency in Quito.
The persistent problems of clouds and shadows, coupledwith the remote location of the Islands serve to constrain theavailability of data. The relative stability, however, of landcover types and spatial patterns in the protected areas and in theadjacent agricultural sites that were selected for analysispermitted good field-to-image correspondence of conditionseven with the temporal lags between the date of imageacquisition and the date of field assessment. The study areawas sufficiently large to encompass a range of variations of
1930 S.J. Walsh et al. / Remote Sensing of Environment 112 (2008) 1927–1941
guava invasion (i.e., age and density) in the agricultural zoneand in the surrounding Park. The most recent sproutings ofindividual stems and the possible consolidation of them intovery small and young patches, however, were not directlyexamined, because of the temporal lag between the 2002 and2004 remotely-sensed data and the 2006 and 2007 fieldobservations and measurements, as well as the constraintsimposed by the spatial resolution of the remote sensing systems.
4.1. Pixel-based characterization of guava
Unsupervised clustering was performed on the QuickBirdimage using the ISODATA (i.e., Iterative Self-Organizing DataAnalysis) algorithm (see Duda & Hart, 1973) with 30 clusters,10 iterations, and a 0.95 convergence threshold. ISODATAallows the number of clusters to be automatically adjustedduring the iteration by merging similar clusters and splittingclusters with large standard deviations. Differentially-correctedGPS points that geo-located our field observations andmeasurements were overlaid on the QuickBird image. Sitedescriptions and field knowledge of the study area formed thebasis for visually interpreting, consolidating, and attributing thespectral clusters of guava, pasture, bare soil, rock, and cloudsand shadows. The classified image was reclassified as guavaand non-guava for pattern metric analysis.
The Tasseled Cap Transformations were used to expand theQuickBird feature sets for the ISODATA classification. TheTasseled Cap approach transforms the dimensionality of multi-spectral data through linear combinations of multiple channelsinto three primary dimensions or axes: brightness, greenness,and wetness. This transformation was originally derived foragricultural applications of remote sensing to distinguish soil(brightness), green vegetation (greenness), and wet soil/vegetation (wetness). Yarbrough et al. (2005) derived TasseledCap Transform coefficients for the QuickBird sensor. The threederived axes explained greater than 99% of the variance of thetest image. Given that our study area primarily consists ofagricultural land on Isabela Island, and that guava appearsdarker than other green vegetation on the QuickBird image, wecalculated brightness, greenness, and wetness surfaces accord-ing to Yarbrough et al. (2005).
4.2. Oriented-based characterization of guava
Object-Based Image Analysis (i.e., OBIA) methods havebecome popular for a variety of land use/land cover studies
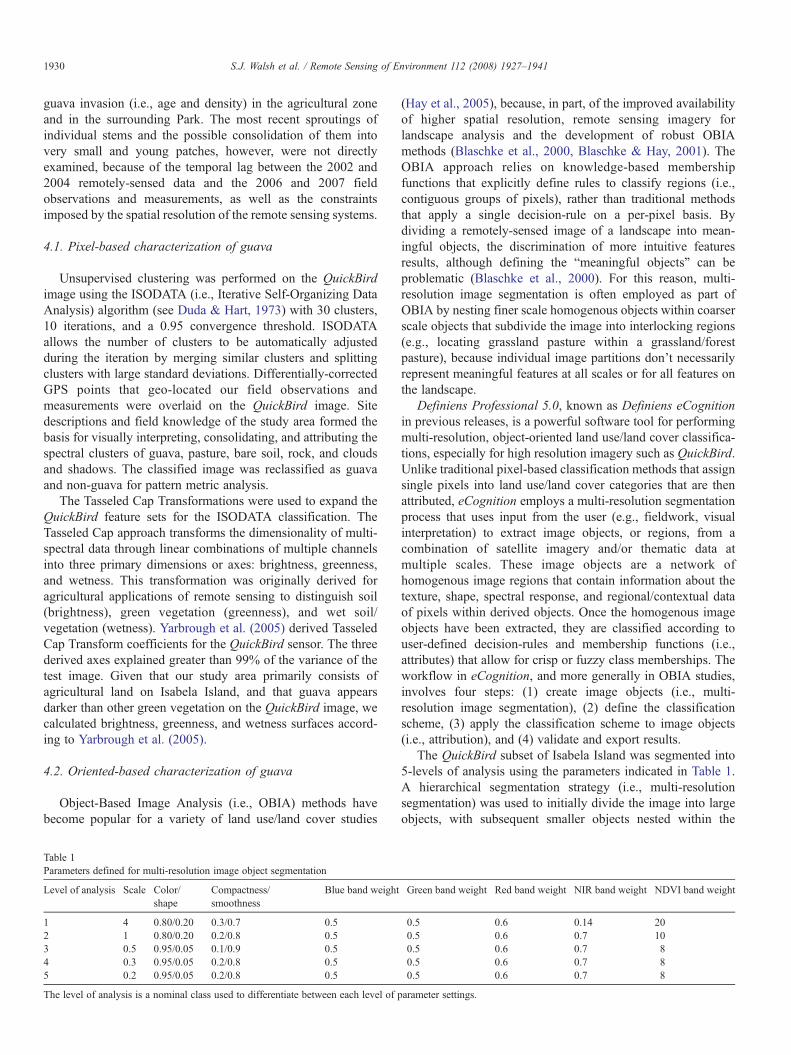
Table 1Parameters defined for multi-resolution image object segmentation
Level of analysis Scale Color/shape
Compactness/smoothness
Blue band weight
1 4 0.80/0.20 0.3/0.7 0.52 1 0.80/0.20 0.2/0.8 0.53 0.5 0.95/0.05 0.1/0.9 0.54 0.3 0.95/0.05 0.2/0.8 0.55 0.2 0.95/0.05 0.2/0.8 0.5
The level of analysis is a nominal class used to differentiate between each level of p
(Hay et al., 2005), because, in part, of the improved availabilityof higher spatial resolution, remote sensing imagery forlandscape analysis and the development of robust OBIAmethods (Blaschke et al., 2000, Blaschke & Hay, 2001). TheOBIA approach relies on knowledge-based membershipfunctions that explicitly define rules to classify regions (i.e.,contiguous groups of pixels), rather than traditional methodsthat apply a single decision-rule on a per-pixel basis. Bydividing a remotely-sensed image of a landscape into mean-ingful objects, the discrimination of more intuitive featuresresults, although defining the “meaningful objects” can beproblematic (Blaschke et al., 2000). For this reason, multi-resolution image segmentation is often employed as part ofOBIA by nesting finer scale homogenous objects within coarserscale objects that subdivide the image into interlocking regions(e.g., locating grassland pasture within a grassland/forestpasture), because individual image partitions don't necessarilyrepresent meaningful features at all scales or for all features onthe landscape.
Definiens Professional 5.0, known as Definiens eCognitionin previous releases, is a powerful software tool for performingmulti-resolution, object-oriented land use/land cover classifica-tions, especially for high resolution imagery such as QuickBird.Unlike traditional pixel-based classification methods that assignsingle pixels into land use/land cover categories that are thenattributed, eCognition employs a multi-resolution segmentationprocess that uses input from the user (e.g., fieldwork, visualinterpretation) to extract image objects, or regions, from acombination of satellite imagery and/or thematic data atmultiple scales. These image objects are a network ofhomogenous image regions that contain information about thetexture, shape, spectral response, and regional/contextual dataof pixels within derived objects. Once the homogenous imageobjects have been extracted, they are classified according touser-defined decision-rules and membership functions (i.e.,attributes) that allow for crisp or fuzzy class memberships. Theworkflow in eCognition, and more generally in OBIA studies,involves four steps: (1) create image objects (i.e., multi-resolution image segmentation), (2) define the classificationscheme, (3) apply the classification scheme to image objects(i.e., attribution), and (4) validate and export results.
The QuickBird subset of Isabela Island was segmented into5-levels of analysis using the parameters indicated in Table 1.A hierarchical segmentation strategy (i.e., multi-resolutionsegmentation) was used to initially divide the image into largeobjects, with subsequent smaller objects nested within the
Green band weight Red band weight NIR band weight NDVI band weight
0.5 0.6 0.14 200.5 0.6 0.7 100.5 0.6 0.7 80.5 0.6 0.7 80.5 0.6 0.7 8
arameter settings.
1931S.J. Walsh et al. / Remote Sensing of Environment 112 (2008) 1927–1941
original boundaries of the larger objects. Smaller objects,therefore, share the same original borders of objects that arehigher in the hierarchy. Image segmentation in eCognition isnot a straightforward process in which the analyst chooses, apriori, a set of partitioning criteria that result in meaningful setsof image objects. Instead, finding useful segmentation levels isan iterative process (Blaschke & Hay, 2001). The parametersettings described in Table 1 are the result of an iterativeprocess, whereby, the segmentation criterion were entered intoeCognition and the resulting image objects were visuallyevaluated to maximize homogeneity (Blaschke et al., 2000).
The second and third steps in the eCognitionworkflow are todefine a meaningful classification scheme and to apply it to theindividual image objects. The classification algorithm ineCognition evaluates the membership value of an image objectrelative to a list of selected classes defined by the analyst (i.e., aclassification scheme). Attributes of the image objects (i.e.,spectral, shape, and hierarchical characteristics) are used asa source of information to define the inclusion or exclusionparameters that attribute the image (Definiens, 2006). Ahierarchical classification scheme was created with three simpleclasses: guava, non-guava vegetation (i.e., pasture, cropland,and forest), and other (i.e., bare soil, clouds, shadows, rock).
Membership functions were defined for each class in thescheme through a set of rules that were implemented within thesoftware. For all three classes, a nearest-neighbor membershipfunction was used with five sub-parameters: (1) brightness, (2)mean of the blue, green, and near-infrared channels, (3)standard deviation of the blue, green, and near-infraredchannels, (4) mean and standard deviation of the NDVIchannel, and (5) maximum difference between the channels.Training samples of known guava classes were collected in thefield in 2006 and 2007 using a hand-held spectroradiometer andspatially-referenced using a GPS. The spectroradiometeroperates in the 300–1100 nm range, and was used to spectrallyand spatially link field observations and measurements of guavaand non-guava vegetation to the satellite data for “partial”control of the pixel- and object-based classifications, primarilythrough attribution of classes. Only approximately 15 measure-ment points were collected in the test area on Isabela Island for arange of guava (i.e., age and density) and non-guava vegetationsamples, as the field survey of invasive plants included otherspecies and other islands, and as such, few data points werecollected that coincided with the test area of this study. For eachtraining sample, the sub-parameter values for all image layerswithin the training image object (e.g., mean of the blue channel)were compared to all other objects in the image. Finally, theclassification scheme was applied to the image objects in all fivelayers of analysis based on the training samples.
Based on the results of the first classification, the classificationhierarchy was re-designed with additional classes, and parent/child relationships were integrated to aid in the discrimination ofguava from all other feature types. The same nearest-neighborfunction (i.e., using the same sub-parameters) described for thefirst classification was applied to a second classification with anexpanded classification scheme: guava, herbaceous vegetation,trees, and rock/bare soil, clouds, and shadows.
4.3. Linear mixture modeling
Linear mixture modeling refers to additive combinations ofseveral diverse materials, such as land use/land cover types thatoccur in patterns too fine to be resolved at the resolutions of thesensors. As long as the radiation from component patchesremains separate until it reaches the sensor, it is possible toestimate proportions of component surfaces from the observedpixel brightness. Spectral mixture modeling (also know asspectral “unmixing”) is devoted to extracting pure spectra fromthe complex composites of spectra that by necessity form eachimage (Adams et al., 1995). It assumes that pixels are formed bylinear mixing and further assumes that it is possible to identifythe components contributing to the mixing. The processinvolves the use of end-members, defined as the pure pixelsthat contribute to the varied mixtures of pixels. Linear mixturemodeling (LMM), the most common approach to spectralunmixing, assumes that there exists a linear relationshipbetween the fractional abundance of the cover types within apixel and the spectra in the reflected radiation. Mixturemodeling was applied to Hyperion data using the classifiedQuickBird data to derive spectral end-members.
A number of researchers have applied LMM to hyper-spectral data to estimate the abundance of general vegetationcover or specific vegetation species (Asner & Heidebrecht,2003; Miao et al., 2006). Commonly used procedures in the“unmixing” of hyper-spectral data include: data preprocessing,feature selection and transformation, end-member selection, andthe estimation of sub-pixel proportions (Kruse et al., 2003).Data preprocessing generally includes initial channel selection,destriping, and atmospheric corrections (Datt et al., 2003). Inthis study, a global “destriping” method was used to remove thevertical “stripe” from the Hyperion data that is typical forimages generated from a “push-broom” instrument (Kruse et al.,2003). No atmospheric corrections were applied, because of alack of availability of atmospheric parameters for the time ofimage acquisition over the Galapagos Islands. In addition, ouranalysis (i.e., image transformations and a land use/land coverclassification) was conducted for a single image date; therefore,no radiometric corrections were applied to harmonize imagehistograms across multiple images (Datt et al., 2003). Of the242 spectral channels of Hyperion, 198 channels were initiallyconsidered for use. Because of similarities between spectralresponse patterns from adjacent image channels for the land-scape characteristics and conditions of our study area, inaddition to, data striping and water vapor channels that furtherlimited the functional channels, our Hyperion data cube con-sisted of 144 spectral channels (i.e., channels 8–57, 79–119,135–164, and 193–217).
The number of end-members is constrained by the number ofinput channels. Considering the correlations between inputchannels, three to four end-member models are typical formulti-spectral imagery (Small, 2001; Wu &Murray, 2003). End-members might include various types and conditions ofvegetation, snow, and shadow in natural environments, and thedegree of imperviousness in urban settings. End-members shouldhave distinct spectra for a successful unmixing (Schowengerdt,

1932 S.J. Walsh et al. / Remote Sensing of Environment 112 (2008) 1927–1941
1997). The most reliable end-member spectra are obtained fromfield measures closely linked in time and condition to thecorresponding satellite imagery (Settle and Drake, 1993; Adamset al., 1995). Due to the difficulty of obtaining field (or laboratory)measures, a number of applications use image-based end-members. For instance, scatter-plots of image channels or theirtransformations (e.g., components from PCA) are used to analyzecandidate end-members (Smith et al., 1985; Small, 2004). Pureend-member pixels are typically identified at the extreme clustersof histograms. Recently, new techniques are emerging thataccount for the end-member signature variation. Bateson et al.(2000) used end-member bundles to account for the variation ofend-members in extracting sub-pixel vegetation information innatural environments. End-member bundles no longer assume asingle signature for an end-member, but rather, a bundle ofspectra. Ju et al. (2003) accounted for the signature variation ofend-members in a Mixture Discriminate Analysis (MDA) witheach end-member modeled as a mixture of sub-classes havingGaussian distributions.
An unsupervised clustering algorithm (i.e., ISODATA) wasused for an initial classification of the Hyperion data to betterunderstand the spectral dimensionality and information contentof the scene. The classification effectively distinguished clouds,shadows, and volcanic lava from other land cover types, such asvegetation, pasture, and bare soil. A mask was generated thatrepresented the clouds, shadows, and volcanic lava classes,so that vegetated areas could be accentuated in subsequentprocessing. A Minimum Noise Fraction (MNF) was used tofurther reduce the spectral dimensionality of the Hyperion datausing cascaded Principal Components Analysis by eliminatingspectral noise in the data cube (Green et al., 1988). The Pixel
Fig. 2. Percentage of guava derived through linear mixture modeling that involvetransformation of Hyperion data. Brighter tones indicate a greater percentage of gua
Purity Index (PPI), after Boardman (1993), was combined withthe use and interpretation of scatter-plots of MNF tocharacterize the relative abundance of guava across our studyarea and to determine that a four end-member model (i.e.,guava, pasture, bare soil and transitional vegetation) couldsufficiently distinguish guava from other primary cover types.The first three Principal Components of the MNF of the Hy-perion data were used in a fully constrained model to estimateguava abundance. Fig. 2 shows the percentage of guavaestimated from the model: the lighter gray tones indicate higherguava percentages, whereas the darker gray tones indicate lowerguava percentages. Similar percentage maps were generated forpasture, bare soil, and transitional vegetation, but are notpresented here.
A neural network-based, non-linear, sub-pixel classificationalso was examined. Neural networks are computer programsthat are designed to simulate human learning through establish-ment and reinforcement of links between input data and outputdata (Campbell, 2007). The approach uses the high spatialresolution image (i.e., QuickBird) to construct training data forthe Hyperion image. Specifically, the pixel-based classificationof the QuickBird image was re-scaled to a 30-m spatialresolution to provide a proportional map of guava that could beco-registered (i.e., a RMSE of 0.38 pixel) to the Hyperion data.A three-layer, Multi-Layer Perceptron (MLP), neural networkwas generated to model the relationships between the spectralresponse patterns of Hyperion and the guava percentages at the30-m pixel resolution. MLP is the most common neural networkmodel. It is a hierarchical structure of several perceptrons thatovercomes the shortcomings of single-layer networks bylearning non-linear function mappings. In this research, three
d a Principal Components Analysis of the Minimum Noise Fraction (MNF)va, and darker tones indicate a lesser percentage of guava.

Fig. 3. Percentage of guava derived through non-linear mixture modeling that involved a neural network analysis of Hyperion data. Brighter tones indicate a greaterpercentage of guava, and darker tones indicate a lesser percentage of guava.
1933S.J. Walsh et al. / Remote Sensing of Environment 112 (2008) 1927–1941
input nodes were designed for the neural network thatrepresented the first three MNF principal components as inputs.One output node was designed for training and generating thepercentage of guava. The number of nodes in the hidden layerwas evaluated through experimentation. The learning rate andmomentum are specified as 0.1 and 0.9 respectively.
The acquisition dates of the QuickBird and Hyperion imagesare approximately 2-years apart. The training sites, therefore,were very carefully identified and restricted to areas where landuse/land cover changes were subtle between the image datesand associated with slight phenological changes induced byvariations in the seasonal rains versus from–to changes in landuse. A total of 696 Hyperion pixels were identified as training
Fig. 4. Cross-plots of the percent guava for sub-pixel classifications of Hyperiondata through linear and non-linear (i.e., neural network model) approaches.
data. The associated guava cover, expressed as the percentage ofguava in the Hyperion pixel, informed through the higherspatial resolution QuickBird pixels (as well as through the useof the approximately 15-points measured in the field using ahand-held spectroradiometer and spatially-referenced using aGPS), was used as the training target. Cross-validation wasemployed to guide the network training. After training, theneural network was applied to the entire Hyperion image toderive the percentage map of guava for the study area (Fig. 3).The estimated percentages of guava from the neural network-based, sub-pixel classification were compared to the estimatedpercentages from the linear mixture model (Fig. 4).
4.4. Ecological pattern metrics and spatial structure
Attributes of spatial heterogeneity are linked to the richnessof invasive species at the regional and local scales (Deutschewitzet al., 2003). To assess spatial structure, we computed a numberof ecological pattern metrics, but only Total Area (TA), PatchDensity (PD), and Contagion1 (CT) are reported here. Thesethree pattern metrics are used to quantify the degree of landfragmentation of guava that was mapped by QuickBird data andcharacterized through pixel-based and object-based classifica-tion approaches, as well as the linear mixture model and theneural networks applied to the Hyperion image. TA is the TotalArea of guava for the defined study area. PD indicates thenumber of patches of guava per 100 ha; PD is constrained by thegrain size of the raster image, because the maximum PD isattained when every cell is a separate patch (McGarigal et al.,
1 Contagion is used to calculate landscape pattern metrics only at the landscapelevel.

1934 S.J. Walsh et al. / Remote Sensing of Environment 112 (2008) 1927–1941
2002). CT is a measurement of the fragmentation of thelandscape; CT approaches 0% when the patch types aremaximally disaggregated and interspersed, and it approaches100% when all patch types are maximally aggregated, that is,when the landscape consists of single patch (McGarigal et al.,2002).
5. Results and discussion
5.1. Pixel-based classification
Visual interpretation of the 30 ISODATA clusters, accom-plished through examination of georeferenced field data,enabled delineation of 6 land use/land cover classes: guava,
Fig. 5. Classification of guava (in red) using the (a) pixel-based unsupervised classifithe references to colour in this figure legend, the reader is referred to the web versio
pasture, other non-guava vegetation (e.g., forest and crops),bare soil, rock, and shadow and clouds (Fig. 5a). Theclassification shows the typical “salt and pepper” appearanceof pixel-based spectral classifications of high spatial resolutionimagery, somewhat obscuring the more defined pattern of landuse/land cover evident on the QuickBird imagery for theagricultural zone. The overall distribution of guava, however, isreadily apparent, with a large area of invasion in the southwestcorner of the study area, scattered patches of invasion across theagricultural zone, and dispersed, smaller patches of invasionalong the transition zone located along the border of the Park(Fig. 5a).
Field knowledge suggests that the larger patches inside theagricultural zone are, in most cases, dense, continuous patches
cation, and the (b) Object-Based Image Analysis approach. (For interpretation ofn of this article.)
1935S.J. Walsh et al. / Remote Sensing of Environment 112 (2008) 1927–1941
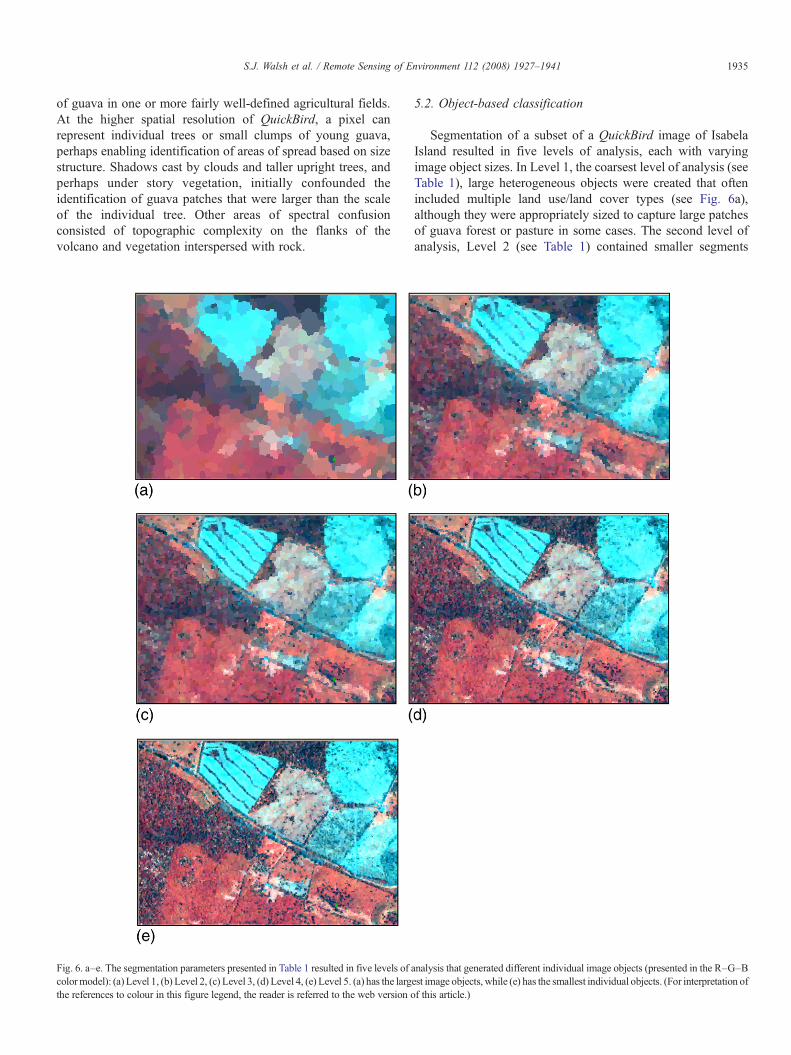
of guava in one or more fairly well-defined agricultural fields.At the higher spatial resolution of QuickBird, a pixel canrepresent individual trees or small clumps of young guava,perhaps enabling identification of areas of spread based on sizestructure. Shadows cast by clouds and taller upright trees, andperhaps under story vegetation, initially confounded theidentification of guava patches that were larger than the scaleof the individual tree. Other areas of spectral confusionconsisted of topographic complexity on the flanks of thevolcano and vegetation interspersed with rock.
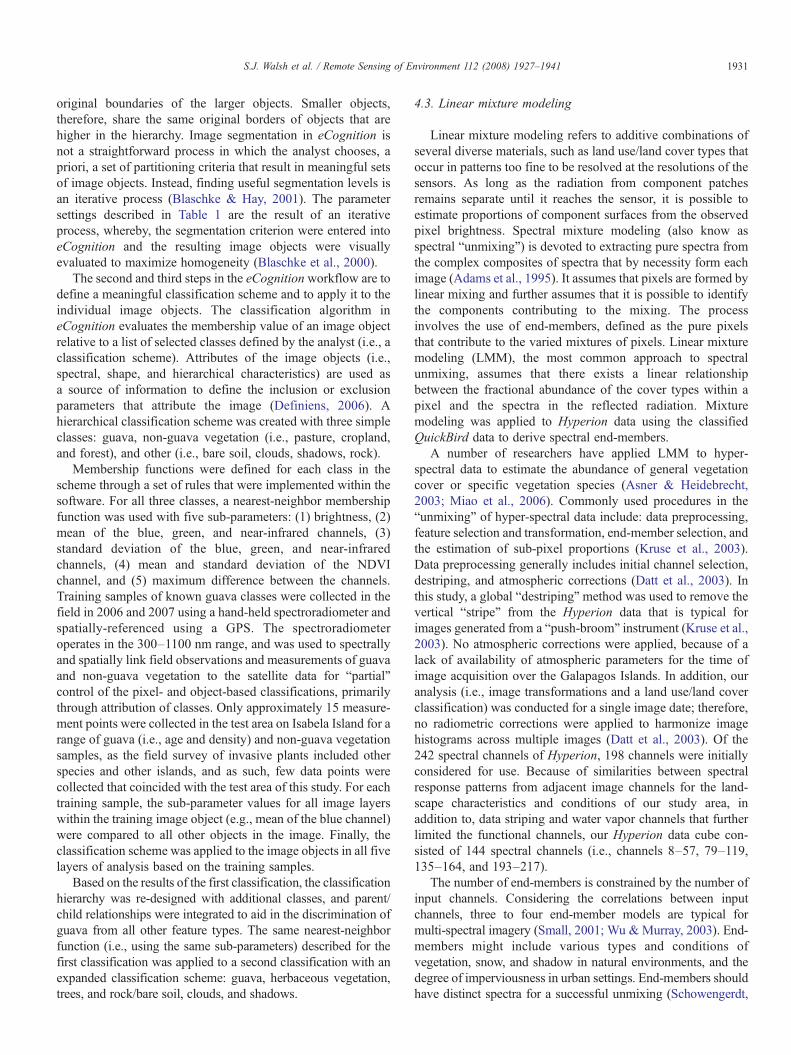
Fig. 6. a–e. The segmentation parameters presented in Table 1 resulted in five levels of acolormodel): (a) Level 1, (b) Level 2, (c) Level 3, (d) Level 4, (e) Level 5. (a) has the largthe references to colour in this figure legend, the reader is referred to the web version o
5.2. Object-based classification
Segmentation of a subset of a QuickBird image of IsabelaIsland resulted in five levels of analysis, each with varyingimage object sizes. In Level 1, the coarsest level of analysis (seeTable 1), large heterogeneous objects were created that oftenincluded multiple land use/land cover types (see Fig. 6a),although they were appropriately sized to capture large patchesof guava forest or pasture in some cases. The second level ofanalysis, Level 2 (see Table 1) contained smaller segments
nalysis that generated different individual image objects (presented in the R–G–Best image objects, while (e) has the smallest individual objects. (For interpretation off this article.)

1936 S.J. Walsh et al. / Remote Sensing of Environment 112 (2008) 1927–1941
within the boundaries of objects in Level 1 (see Fig. 6b).However, the objects were too coarse for identifying singleguava trees that were surrounded by pasture, and in many cases,included heterogeneous image objects. Level 3 (see Table 1) ofthe image segmentation created finer individual image objectsthat more effectively captured some small stands of guava trees(see Fig. 6c), but were not sufficiently small to identify a singleguava tree. The image objects in Levels 4 and 5 (see Table 1)were appropriately sized for identifying individual guava trees,but were inappropriate for representing patches of guava trees orland covers such as pasture (see Fig. 6d and e). Since no singlelevel of analysis was found to be appropriate for identifying allkey features of the landscape, all five levels were used in theclassification of the QuickBird image.
As with each of the levels of analysis defined during imageobject segmentation, the classification results varied from coarser
Fig. 7. a–e. Five classifications were generated using the three-class scheme appliedwhereas (e) shows a similar appearance to pixel-based classifications.
(i.e., Levels 1–3) to finer (i.e., Levels 4 and 5) scale resolutions.The classifications of Levels 1–3 resulted in homogenous andhighly contiguous guava patches (see Fig. 7a, b, and c), but lackedmuch of the detail on guava distribution across the landscape. Forimage objects classified as guava, the membership functions wererelatively high (N0.75), althoughmany areas on the landscape thatwere guava either remained unclassified or had low membershipfunctions in other classes. The finer classification results definedin Levels 4 and 5 (see Fig. 7d and e) contained more classvariation across the entire landscape, but also had the “pixilated”appearance that is common in traditional pixel-based classifica-tions. The finer scale classifications, however, were able toidentify small stands of guava (1–5 trees) in a manner consistentwith a pixel-based classification approach. There was a widerrange of membership functions (i.e., 0.45–0.98) for individualimage objects that were classified as guava as compared to the
to the individual image objects (Fig. 6a–e). (a) shows large, contiguous classes,

Table 2Landscape metrics that describe the spatial structure of guava and non-guavaclassified through the pixel-based vs. object-based approaches
Spatial structure attribute Unsupervised classification Object-Based ImageAnalysis
Guava Class Area (ha) 786.21 1556.52Guava Path Density
(Patches/100 ha)861.13 165.97
Contagion of the landscape(%)
56.43 48.88
1937S.J. Walsh et al. / Remote Sensing of Environment 112 (2008) 1927–1941
coarser scale classification, which is likely a more accuraterepresentation of the heterogeneous landscape.
The second classification involved the addition of “parent/child” relationships and the inclusion of additional classes in theclassification scheme. This classification approach improved theidentification of guava and reduced the level of confusion of guavaimage objects with other classes (e.g., Cedrella trees). In short,increasing the number of non-guava classes seems to improve thediscrimination of guava patches from other land covers.
The larger image objects (Levels 1–3) were less effective indefining guava using the QuickBird imagery, because the testareas covered only a portion of the QuickBird image andrepresented relatively large patches of guava trees against thebackground matrix of pasture. On the other hand, the finerlevels of analysis (Levels 4 and 5) were able to delineate smallstands and individual guava trees for the small subset image.The differences between the ability of each level analysis toidentify different features on the landscape have implicationsfor scaling the image segmentation parameters and classifica-tion schemes to larger image extents.
Once the image segmentation and classification wascomplete, individual image objects still existed that had a
Fig. 8. Comparison of spectral “unmixing” of the Hyperion data for the characterizmodeling that involves the use of a neural network approach.
wide range of membership functions for each class, includingguava. The objects were combined into more functional objects(e.g., all objects with N0.85 membership in guava were assignedto the guava class), and re-segmented into different levelsdepending on the outcome of the image object segmentation andclassification. Fuzzy membership classes were also moreeffectively defined so that image objects with membership intwo classes (e.g., guava and forest) were re-classified into amore functional class (e.g., dense guava). Future work willfocus on working with fuzzy membership classes and expand-ing the membership function parameter to include texturalmeasures of target classes, as well as spatial–spectral relation-ships between neighboring classes and the use of non-spectralattributes that can be linked to defined objects (e.g., terraincharacteristics and/or land ownership characteristics).
5.3. Unmixing Hyperion data
A fully constrained four end-member linear mixture modelwas employed to estimate guava abundance. Themean root errorof the image was 0.00076, indicating a good overall estimation.Fig. 2 shows the percentage of guava estimated from the model:the lighter gray tones indicate higher guava percentages withinthe 30-m pixel, whereas the darker gray tones indicate lowerguava percentages. Similar percentage maps were generated forpasture, bare soil, and transitional vegetation, but are notpresented here. For the neural network-based model, differentnumbers of hidden nodes were evaluated. Using a cross-validation approach, the best results were generated with 12nodes for the hidden layer. The estimated guava percentages areshown in Fig. 3. It can be seen in Figs. 2 and 3 that the twoapproaches generate similar guava distributions at the regionallevel, although large local variations were observed.
ation of guava through (a) linear mixture modeling, and (b) non-linear mixture
1938 S.J. Walsh et al. / Remote Sensing of Environment 112 (2008) 1927–1941
Clouds and shadows exist on the Hyperion and QuickBirdimages. In addition, land use/land cover changes between thetwo image dates have also occurred. It is not realistic, therefore,to conduct an accuracy assessment for the sub-classificationusing the QuickBird image as the primary, or “gold standard,”reference data set. Instead, a cross-plot of guava percentages,achieved from the linear mixture model and the neural networkmodel, was generated (see Fig. 4). Considerable scattering canbe seen in Fig. 4 that indicates differences between the imagesgenerated through linear and neural network approaches.A non-linear trend also was observed in the sub-pixel estimationwhich suggests that different unmixing was derived througheach approach. In linear mixture modeling, the sub-pixelestimation may be affected by the numbers and types of end-members and their spectral signals. The neural network-basedapproach is largely dependent on the availability of high-spatialresolution data and the accuracy of the image classification.
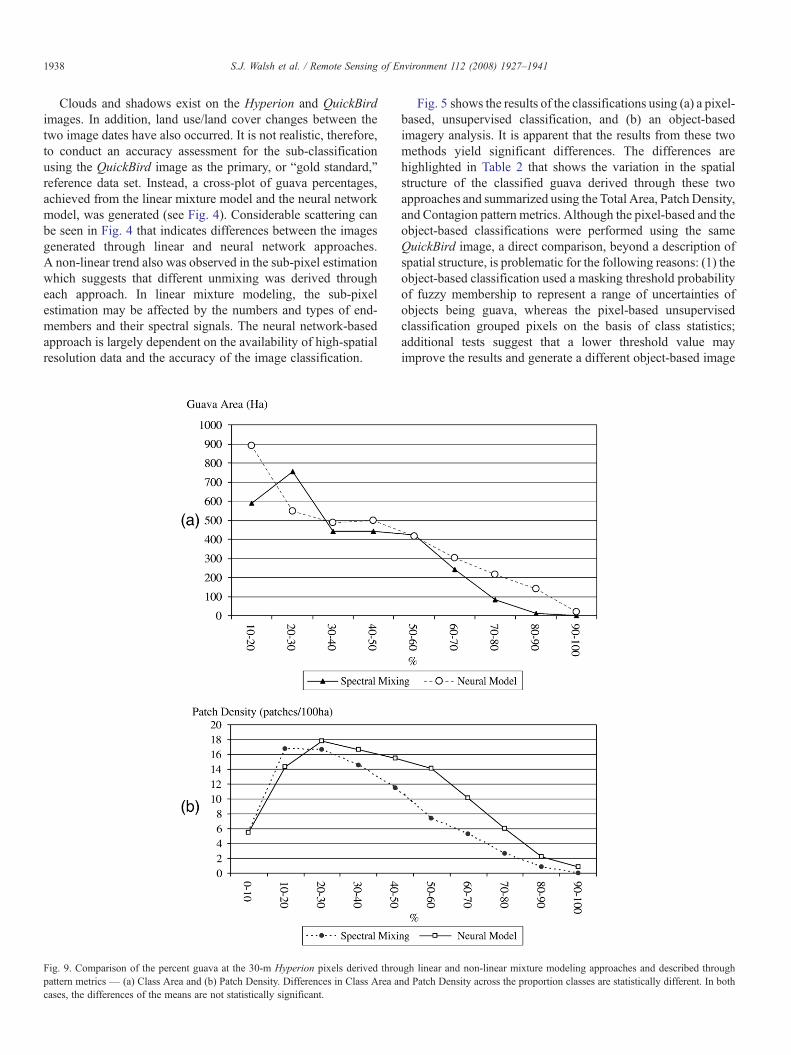
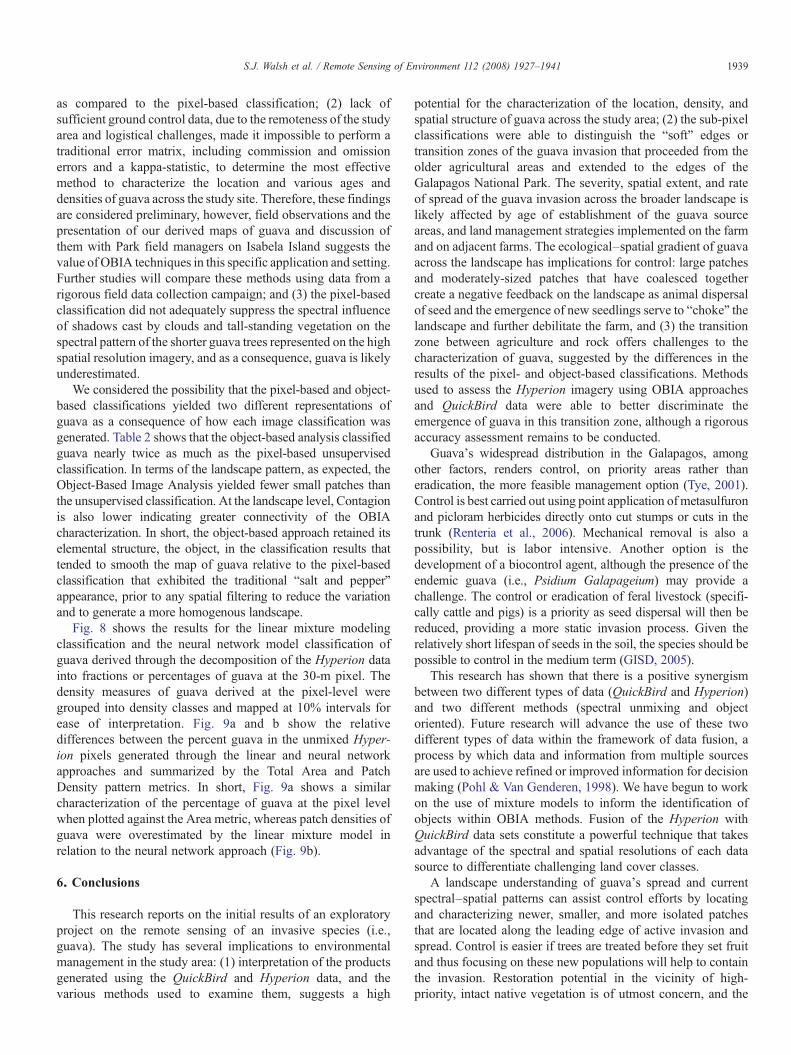
Fig. 9. Comparison of the percent guava at the 30-m Hyperion pixels derived thropattern metrics — (a) Class Area and (b) Patch Density. Differences in Class Area acases, the differences of the means are not statistically significant.
Fig. 5 shows the results of the classifications using (a) a pixel-based, unsupervised classification, and (b) an object-basedimagery analysis. It is apparent that the results from these twomethods yield significant differences. The differences arehighlighted in Table 2 that shows the variation in the spatialstructure of the classified guava derived through these twoapproaches and summarized using the Total Area, Patch Density,and Contagion pattern metrics. Although the pixel-based and theobject-based classifications were performed using the sameQuickBird image, a direct comparison, beyond a description ofspatial structure, is problematic for the following reasons: (1) theobject-based classification used a masking threshold probabilityof fuzzy membership to represent a range of uncertainties ofobjects being guava, whereas the pixel-based unsupervisedclassification grouped pixels on the basis of class statistics;additional tests suggest that a lower threshold value mayimprove the results and generate a different object-based image
ugh linear and non-linear mixture modeling approaches and described throughnd Patch Density across the proportion classes are statistically different. In both
1939S.J. Walsh et al. / Remote Sensing of Environment 112 (2008) 1927–1941
as compared to the pixel-based classification; (2) lack ofsufficient ground control data, due to the remoteness of the studyarea and logistical challenges, made it impossible to perform atraditional error matrix, including commission and omissionerrors and a kappa-statistic, to determine the most effectivemethod to characterize the location and various ages anddensities of guava across the study site. Therefore, these findingsare considered preliminary, however, field observations and thepresentation of our derived maps of guava and discussion ofthem with Park field managers on Isabela Island suggests thevalue of OBIA techniques in this specific application and setting.Further studies will compare these methods using data from arigorous field data collection campaign; and (3) the pixel-basedclassification did not adequately suppress the spectral influenceof shadows cast by clouds and tall-standing vegetation on thespectral pattern of the shorter guava trees represented on the highspatial resolution imagery, and as a consequence, guava is likelyunderestimated.
We considered the possibility that the pixel-based and object-based classifications yielded two different representations ofguava as a consequence of how each image classification wasgenerated. Table 2 shows that the object-based analysis classifiedguava nearly twice as much as the pixel-based unsupervisedclassification. In terms of the landscape pattern, as expected, theObject-Based Image Analysis yielded fewer small patches thanthe unsupervised classification. At the landscape level, Contagionis also lower indicating greater connectivity of the OBIAcharacterization. In short, the object-based approach retained itselemental structure, the object, in the classification results thattended to smooth the map of guava relative to the pixel-basedclassification that exhibited the traditional “salt and pepper”appearance, prior to any spatial filtering to reduce the variationand to generate a more homogenous landscape.
Fig. 8 shows the results for the linear mixture modelingclassification and the neural network model classification ofguava derived through the decomposition of the Hyperion datainto fractions or percentages of guava at the 30-m pixel. Thedensity measures of guava derived at the pixel-level weregrouped into density classes and mapped at 10% intervals forease of interpretation. Fig. 9a and b show the relativedifferences between the percent guava in the unmixed Hyper-ion pixels generated through the linear and neural networkapproaches and summarized by the Total Area and PatchDensity pattern metrics. In short, Fig. 9a shows a similarcharacterization of the percentage of guava at the pixel levelwhen plotted against the Area metric, whereas patch densities ofguava were overestimated by the linear mixture model inrelation to the neural network approach (Fig. 9b).
6. Conclusions
This research reports on the initial results of an exploratoryproject on the remote sensing of an invasive species (i.e.,guava). The study has several implications to environmentalmanagement in the study area: (1) interpretation of the productsgenerated using the QuickBird and Hyperion data, and thevarious methods used to examine them, suggests a high
potential for the characterization of the location, density, andspatial structure of guava across the study area; (2) the sub-pixelclassifications were able to distinguish the “soft” edges ortransition zones of the guava invasion that proceeded from theolder agricultural areas and extended to the edges of theGalapagos National Park. The severity, spatial extent, and rateof spread of the guava invasion across the broader landscape islikely affected by age of establishment of the guava sourceareas, and land management strategies implemented on the farmand on adjacent farms. The ecological–spatial gradient of guavaacross the landscape has implications for control: large patchesand moderately-sized patches that have coalesced togethercreate a negative feedback on the landscape as animal dispersalof seed and the emergence of new seedlings serve to “choke” thelandscape and further debilitate the farm, and (3) the transitionzone between agriculture and rock offers challenges to thecharacterization of guava, suggested by the differences in theresults of the pixel- and object-based classifications. Methodsused to assess the Hyperion imagery using OBIA approachesand QuickBird data were able to better discriminate theemergence of guava in this transition zone, although a rigorousaccuracy assessment remains to be conducted.
Guava's widespread distribution in the Galapagos, amongother factors, renders control, on priority areas rather thaneradication, the more feasible management option (Tye, 2001).Control is best carried out using point application of metasulfuronand picloram herbicides directly onto cut stumps or cuts in thetrunk (Renteria et al., 2006). Mechanical removal is also apossibility, but is labor intensive. Another option is thedevelopment of a biocontrol agent, although the presence of theendemic guava (i.e., Psidium Galapageium) may provide achallenge. The control or eradication of feral livestock (specifi-cally cattle and pigs) is a priority as seed dispersal will then bereduced, providing a more static invasion process. Given therelatively short lifespan of seeds in the soil, the species should bepossible to control in the medium term (GISD, 2005).
This research has shown that there is a positive synergismbetween two different types of data (QuickBird and Hyperion)and two different methods (spectral unmixing and objectoriented). Future research will advance the use of these twodifferent types of data within the framework of data fusion, aprocess by which data and information from multiple sourcesare used to achieve refined or improved information for decisionmaking (Pohl & Van Genderen, 1998). We have begun to workon the use of mixture models to inform the identification ofobjects within OBIA methods. Fusion of the Hyperion withQuickBird data sets constitute a powerful technique that takesadvantage of the spectral and spatial resolutions of each datasource to differentiate challenging land cover classes.
A landscape understanding of guava's spread and currentspectral–spatial patterns can assist control efforts by locatingand characterizing newer, smaller, and more isolated patchesthat are located along the leading edge of active invasion andspread. Control is easier if trees are treated before they set fruitand thus focusing on these new populations will help to containthe invasion. Restoration potential in the vicinity of high-priority, intact native vegetation is of utmost concern, and the

1940 S.J. Walsh et al. / Remote Sensing of Environment 112 (2008) 1927–1941
role of remote sensing in characterizing invasive species adds tothe arsenal of tools and techniques for effective land manage-ment in this fragile and sensitive environment.
Acknowledgements
This research was supported through funds provided by theDepartment of Geography, the College of Arts and Sciences, theCarolina Population Center, and the Office of the Vice-Chancellor for Research and Economic Development at theUniversity of North Carolina at Chapel Hill. In addition, supportwas provided by the Land Cover/Land Use Change Program ofthe National Aeronautics and Space Administration. Logisticalsupport was provided by the Galapagos National Park (RaquelMolina, Director) and Juan Chávez, the Head of Park operationson Isabela Island. We also thank Patricia Puebla, Director ofGIS for the Park, for her administrative and data support. Werecognize Paola Pozo of the Charles Darwin Foundation for herassistance in expanding our understanding of invasive plants inthe Galapagos Islands, and Alan Tye, Director of Research forthe Foundation, for his cooperation and assistance. We alsothank Lino Verduga, Edgar Peñaherrera, Janina Olmedo, andJose Aguiar of CLIRSEN, the Ecuadorian government agencyresponsible for remote sensing and land use/land covermapping, for facilitating our participation in the broader studyof land use/land cover, including invasive plants, in theGalapagos Islands through remote sensing techniques. Finally,we offer our appreciation to The Nature Conservancy for theirsupport of the overall land use/land cover project, and MarceloGuevara, GIS Specialist, for his general support and insights.
References
Adams, J. B., Sabol, D., Kapos, V., Fliho, R. A., Roberts, D. A., & Smith, M. O.(1995). Classification of multispectral images based on fractions ofendmembers: Application to land-cover change in the Brazilian Amazon.Remote Sensing of the Environment, 52, 137−154.
Asner, G. P., & Heidebrecht, K.B. (2003). Imaging spectroscopy fordesertification studies: Comparing AVIRIS and EO-1 Hyperion in Argentinadrylands. IEEE Transactions on Geoscience and Remote Sensing, 41,1283−1296.
Bateson, C. A., Asner, G. P., & Wessman, C. A. (2000). End-member bundles:A new approach to incorporating end-member variability in spectral mixtureanalysis. IEEE Transactions in Geosciences and Remote Sensing, 38,1083−1094.
Binggeli, P., Hall, J. B., & Healey, J. R. (1998). A review of invasive woodyplants in the tropics. School of Agricultural and Forest Sciences PublicationNumber 13. University of Wales, Bangor On-line publication. Available athttp://www.safs.bangor.ac.uk/iwpt
Blaschke, T., & Hay, G. (2001). Object-oriented image analysis and scale-space:Theory and methods for modeling and evaluating multi-scale landscapestructure. International Archives of Photogrammetry and Remote Sensing,34, 22−29.
Blaschke, T., Lang, S., Lorup, E., Stobl, J., & Zeil, P. (2000). Object-orientedimage processing in an integrated GIS/remote sensing environment andperspectives for environmental applications. In A. Cremers & K. Greve(Eds.), Environmental Information for Planning, Politics and the Public,vol. 2 (pp. 555−570). Marburg: Verlag.
Boardman, J. W. (1993). Automated spectral unmixing of AVIRIS data usingconvex geometry concepts. Summaries 4th Jet Propulsion Laboratory.AirborneGeoscience Workshop, Pasadena, California, vol. 1, 11−14.
Campbell, J. B. (2007). Introduction to remote sensing.NewYork: The GuilfordPress.
Datt, B., McVicar, T. R., Van Niel, T. G., Jupp, D. L. B., & Pearlman, J. S.(2003). Preprocessing EO-1 Hyperion hyperspectral data to support theapplication of agricultural indices. IEEE Transactions on Geosciences andRemote Sensing, 41(6), 1246−1259.
Definiens, A. G. (2006). Definiens professional 5 user guide. München, Germany:Definiens AG.
Deutschewitz, K., Lausch, A., Kühn, I., & Klotz, S. (2003). Native and alienplant species richness in relation to spatial heterogeneity on a regional scalein Germany. Global Ecology and Biogeography, 12(4), 299−311.
Duda, R. O., & Hart, P. E. (1973). Pattern classification and scene analysis. NewYork: Wiley and Sons.
Ellshoff, Z. E., Gardner, D. E., Wikler, C., Smith, C. W. (1995), Annotatedbibliography of the genusPsidium, with emphasis onP. cattleianum (strawberryguava) and P. guajava (common guava), forest weeds in Hawaii. TechnicalReport 95, Cooperative National Park Resources Study Unit, University ofHawaii at Manoa.
Global Invasive Species Database (GISD) (2005). Psidium guajava. Available from:http://www.issg.org/database/species/ecology.asp?si=211andfr=1andsts=, lastmodified 4.11.06.
Green, A. A., Berman, M., Switzer, P., & Craig, M. D. (1988). A transformationfor ordering multispectral data in terms of image quality with implicationsfor noise removal. IEEE Transactions on Geoscience and Remote Sensing,26, 65−74.
Hamann, O. (1981). Plant communities of the Galápagos Islands. DanskBotanisk Forening, 106−109.
Hay, G. J., Castilla, G., Wulder, M. A., & Ruiz, J. R. (2005). An automated object-based approach for the multiscale image segmentation of forest scenes. Inter-national Journal of Applied Earth Observation and Geoinformation, 7,339−359.
Ju, J., Kolaczyk, E. D., & Gopal, S. (2003). Gaussian mixture discriminantanalysis and sub-pixel land cover characterization in remote sensing. RemoteSensing of Environment, 84, 550−560.
Kruse, F. A., Boardman, J. W., & Huntington, J. F. (2003). Comparison ofairborne hyperspectral data and EO-1 Hyperion for mineral mapping. IEEETransactions on Geoscience and Remote Sensing, 41(6), 1388−1400.
Mauchamp, A. (1997). Threats from alien plant species in the GalapagosIslands. Conservation Biology, 11, 260−263.
McGarigal, K., Cushman, S. A., Neel, M. C., & Ene, E. (2002). FRAGSTATS:Spatial pattern analysis program for categorical maps. Computer softwareprogram produced by the authors at the University of Massachusetts,Amherst. Available at the following web site: www.umass.edu/landeco/research/fragstats/fragstats.html
Miao, X., Gong, P., Swope, S., Pu, R., Carruthers, R., Anderson, G. L., et al.(2006). Estimation of yellow starthistle abundance through CASI-2hyperspectral imagery using linear spectral mixture models. Remote Sensingof Environment, 101, 329−341.
Pohl, C., & Van Genderen, J. L. (1998). Multisensor image fusion in remotesensing: Concepts, methods and applications. International Journal ofRemote Sensing, 19(5), 823−854.
Renteria, J. L., Atkinson, R., Guerrero, A. M., & Mader, J. (2006). Manual deIdentificación y Manejo de Malezas. Quito, Ecuador: Imprenta Flores.
Richardson, D. M., Pysek, P., Rejmanek, M., Barbour, M. G., Panetta, F. D., &West, C. J. (2000). Naturalization and invasion of alien plants: Concepts anddefinitions. Diversity and Distributions, 6(2), 93−107.
Schofield, E. K. (1989). Effects of introduced plants and animals on islandvegetation: Examples from the Galápagos Archipelago.Conservation Biology,3(3), 227−238.
Schowengerdt, R. A. (1997). Remote sensing. Models and methods for imageprocessing (Second edition). San Diego: Academic Press.
Settle, J. J., & Drake, N. A. (1993). Linear mixing and the estimation ofground cover proportions. International Journal of Remote Sensing, 14,1159−1177.
Small, C. (2001). Estimation of urban vegetation abundance by spectral mixtureanalysis. International Journal of Remote Sensing, 22(7), 1305−1334.
Small, C. (2004). The Landsat ETM+ spectral mixing space. Remote Sensing ofEnvironment, 93, 1−17.

1941S.J. Walsh et al. / Remote Sensing of Environment 112 (2008) 1927–1941
Smith, M. O., Johnson, P. E., & Adams, J. B. (1985). Quantitative determinationof mineral types and abundances from reflectance spectra using principalcomponent analysis. Journal of Geophysical Research, 90, 792−804.
Tye, A. (2001). Invasive plant problems and requirements for weed riskassessment in the Galápagos islands. In R. H. Groves, F. D. Panetta, & J. G.Virtue (Eds.), Weed risk assessment (pp. 153−175). Melbourne: CSIROPublishing.
Tye, A., Soria, M. C., & Gardener, M. R. (2002). A strategy for Galápagosweeds. In C. R. Veitch & M. N. Clout (Eds.), Turning the tide: The
eradication of invasive species. IUCN, Gland, Switzerland and Cambridge,UK: IUCN SSC Invasive Species. Specialist Group.
Weber, E. (2003). Invasive plant species of the world: A reference guide toenvironmental weeds. Wallingford, UK: CABI Publishing.
Wu, C., & Murray, A. T. (2003). Estimating impervious surface distribution byspectral mixture analysis. Remote Sensing of Environment, 84, 493−505.
Yarbrough, L. D., Easson, G., &Kuszmaul, J. S. (2005).QuickBird 2 Tasseled CapTransform coefficients: A comparison of derivation methods. Pecora 16 globalpriorities in land remote sensing, Sioux Falls, South Dakota (electronic).