Embed Size (px)
Citation preview

Waikato and Upper North
Island (WUNI) Voltage
Management Investigation
1
Transpower, Development Group
Anna Li

Presentation Outline
• Needs Investigation (phase 1)– UNI thermal decommissionings, identified voltage stability limits
• Options Investigation (phase 2)– Long-list consultation paper, short-list components, development plans
and economic analysis
• Preferred Options (phase 3)– Short-list consultation of preferred option, Major Capital Expenditure
Project (MCP) submission to Commerce Commission

Upper North Island thermal decommissioning
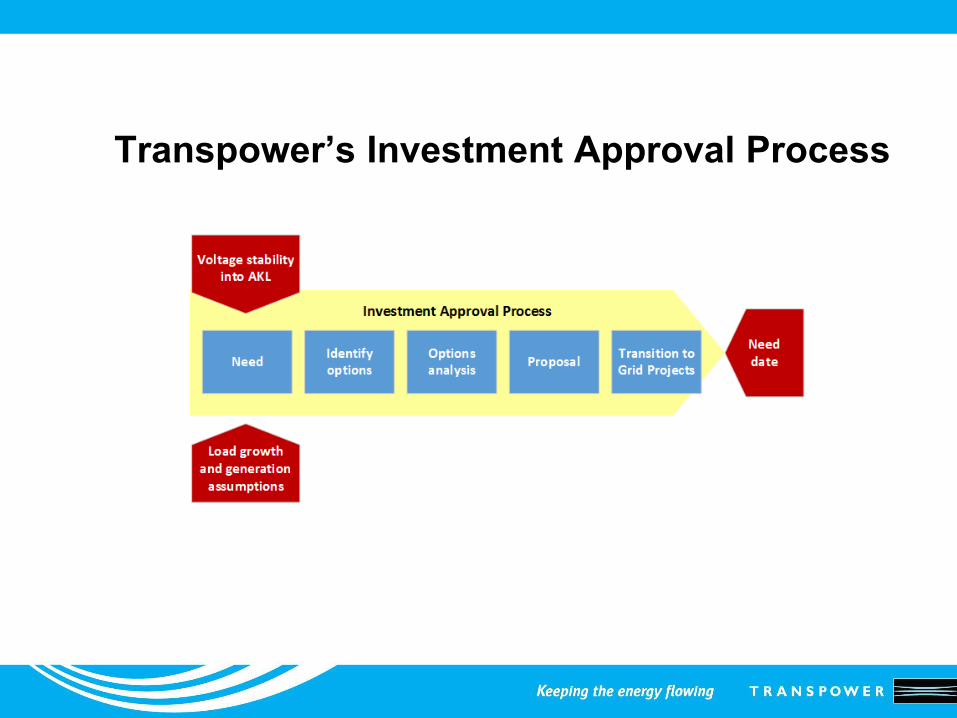
Transpower’s Investment Approval Process

Phase 1 - Needs Investigation
Completion date Q2 2016

System support required beyond Year 2022

Phase 2 - Options Investigation
Scheduled completion date Q1 2017

Long-list consultation paper
Covered:
• Need and project scope
• Long-list of components
• Information on non-transmission
solutions
• Grid Support Contract product
design
• Criteria for short-listing
• Demand growth assumptions
• Removal of DGPP and RCPD
charges
• Motor load information
• Existing generation in the UNI
• Dynamic reactive support
• Generation scenarios
• Demand growth assumptions
• Analysis period
• Value of unserved energy
• Discount rate assumptions
DGPP - distributed generation pricing principles
RCPD - regional coincident peak demand

Long-list consultation feedback
Key points:
• Agreement to the need
• Lots of uncertainty hence
need for flexibility
• Don’t assume any new
thermal plant in UNI
• Allow for possibility of early
Tiwai exit
• Synchronous condenser
conversions
• RCPD and ACOT
proposals will raise UNI
peak
• Support for batteries
• What about thermal
transfer issues?
• Comments about the TPM!
ACOT - Avoided Cost of Transmission

System condition post 2022
Static limit (PV)
at 95% (MW) Dynamic limit at
95% (MW) Binding limit Forecast year
Base case 2702 >2702 static 2014
0.85
0.9
0.95
1
1.05
1.1
2640 2660 2680 2700 2720 2740 2760 2780 2800 2820 2840 2860
V-P curve for North Island buses base case
MDN220A1
ALB220A1
BRB220
SWN220
GLN220
HEN220A1a
PAK220A
OTA220B1
HLY220A
OHW220A
HAM220A
WKM220A1
TWH220
TMN220
TKU-220-1
TNG220
SFD220A1
BPE220A1a
HAY220A
BPESFD
TMN TWH
HLY
HAY BPE
TNGTKU WRK
WKM
HAM
OHW HLY
OTAHEN ALB
MDN
0.88
0.9
0.92
0.94
0.96
0.98
1
1.02
1.04
1.06
0 1 2 3 4 5 6 7 8 9 10 11 12 13 14
V (pu) North Island voltage profile at nose point and at 95% from PV nose pointbase case
at PV Nose via CNI at PV Nose via Taranaki at 95% PV nose via CNI at 95% PV nose via Taranaki

Short-list of components categories
Include:
• Generation - Huntly Rankine units
• Synchronous condenser
• Static synchronous compensator (STATCOM)
• Static Var compensator (SVC)
• Shunt Capacitors
• Series capacitor –– 220 kV and 400 kV conversion
– with and without 3rd cable from Brownhill-Otahuhu

Development Plans and Economic Analysis
Building BlockPV
nose
PV
(95%)
Dynamic
(95% PV)
Forecast
yearCost
Base Case xxxx xxxx pass/fail 20xx $$
Component 1 xxxx xxxx pass/fail 20xx $$
Component 2 xxxx xxxx pass/fail 20xx $$
Component 3 xxxx xxxx pass/fail 20xx $$
Component 4 xxxx xxxx pass/fail 20xx $$
Component 5 xxxx xxxx pass/fail 20xx $$
Development Plan 1Year 1 Year 2 Year 3 Year 4 … 2045
Total
Cost
PV
nose
PV
(95%)
Dyn
(95% PV)
PV
nose
PV
(95%)
Dyn
(95% PV)
PV
nose
PV
(95%)
Dyn
(95% PV)
PV
nose
PV
(95%)
Dyn
(95% PV)
PV
nose
PV
(95%)
Dyn
(95% PV)
Componet 1 xxxx xxxx pass
Componet 2 xxxx xxxx pass
Componet 3 xxxx xxxx pass
Componet 4 xxxx xxxx pass
… $$$

Phase 3 - Preferred Options
Scheduled completion date Q4 2018

• Short-list consultation of preferred option
• Major Capital Expenditure submission to Commerce Commission
• Commission's approval and transition to Grid Projects
Key Milestones – Phase 3

Presentation Summary
• Needs Investigation (phase 1 – completed – Q3 2016)
• Options Investigation (phase 2 – underway – Q2 2017)
• Preferred Options (phase 3 – Q4 2018)

WUNI Voltage Management Project Site

Outage VisualisationTranspower, System Operator Service
Industry Workshop 2016
Angela Houston Richard Rowell

Current outage information
POCP
IONS

Other information available

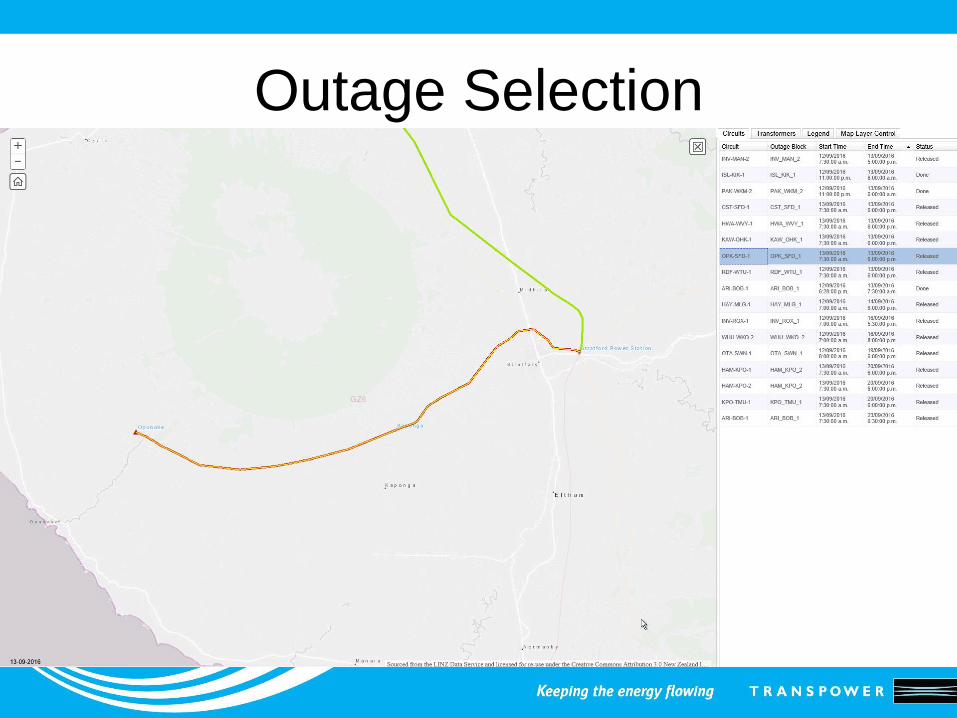
Outage Visualisation Tool
• Outage visualisation prototype created by EMS
• Outages can be seen on geographic maps of
New Zealand using our geospatial capability
• More visibility of what outages are happening
where and when
• Easier to see concurrent outages and highlight
possible conflicts
• Assist in covering for future risks

Planning Benefits
• Benefits to outage management across a
wide audience
• Many different needs and uses of outage
information
• Make it easier and more efficient to assess
and manage outages

Daily Outages

Daily Outages

Outage Detail

Outage Selection
Outage Selection

Transformer Outage Detail

Outages on same line

Outages on same line

Outages on same line

Outages on same line

Generation outages

Generation outage detail

Rain risk

Rain risk

Substation equipment

Substation equipment

Schematic view

Schematic view

NIPS/SIPS Schematic

National Winter GroupTranspower, System Operator Service
Industry Workshop 2016
Erich Livengood

National Winter Group
• Winter 2006
• Industry working
group
• Initiated improvements
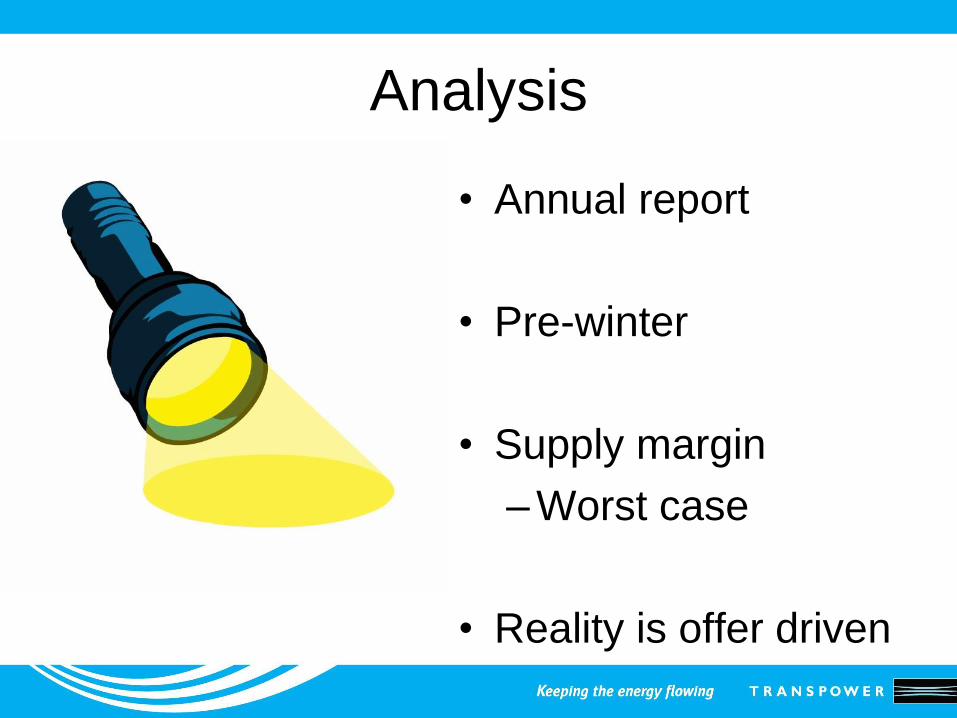
Analysis
• Annual report
• Pre-winter
• Supply margin
– Worst case
• Reality is offer driven

The Twin Peaks
GenerationDemand
Gap
analysis

The Future
• Supply margin
analysis is required
• Does it have to be
National Winter
Group?

New Zealand
Generation Balance

NWG vs NZGB

Where to from here?
• Communication with
National Winter
Group members
• Comparison of
NWG and NZGB
analysis
• 1 March 2017

Load Forecast AccuracyTranspower, System Operator Service
Industry Workshop 2016
Erich Livengood Richard Rowell

Agenda
• Load forecast and its use
• Load forecast and other schedule inputs
• System Operator load forecast accuracy
• Developments: EMS load forecast
• Options for an improved
forecast?

Load forecasting and use
• Medium term load forecast (MTLF)
– Spans 15 days, including today – regional
– Components
• Long term – ‘seasonal’ component from last 4 wks
• Short term – ‘local’ component from last 2 days
• Weather – based on forecast weather
• Refined – adjusts based on prior performance
• Energy Market Services load forecast*Load forecast methodology link

Schedule accuracy is more than
load forecast• Market schedules match forecast load, bids and offers
• Variables which may cause the forecast price to vary
from actual include (but are not limited to):
– Intermittent and distributed generation
– Load management (by networks and autonomous)
– Accuracy of load forecast
– Bid and offer ∆ and
compliance
• Price is the intersection
of demand and supply

Load management and intermittent generation
equate to hundreds of MW of difference
For August 2016, average wind forecast error was 45MW vs. LF error of
101 MW. 27% of the time, wind error was greater than LF error.
37 MW~200 MW
Wind Forecast accuracy 2.5 hours ahead
2-5 August 2016 Load Management, sample day July 16
Orion Network

Accuracy of SO medium term
load forecast• Sample accuracy for August 2016
– 2.5 hours ahead of the trading period vs actual
• Bias – average
error ~50 MW
• MAPE 2.0% (2.2%
conforming nodes)
• Bias higher for high
loads

Forecasting does improve
closer to gate closure
Demand forecast 6.5 hours ahead
August 16
Demand forecast 2.5 hours ahead
August 16
Transpower is now noting accuracy monthly – what
information is useful?

Transpower will commence publishing
forecast accuracy periodically
• MAPE for month
• Conforming and total demand
• What would you find useful in forecast reporting?

Load forecasting trial 2012

Load forecasting trial 2012

Developments in forecasting:
EMS load forecast

Variables used in forecasting
• Actual load
• Historical load
• Temperature
• Humidity
• Cloud cover
• Wind speed
• Wind direction
• Rain
• Radiation

Measuring accuracy
• Error calculations are based on differences between
forecast at 2.5 hours prior to dispatch and observed
SCADA load.
• MAPE (mean absolute percentage error) is defined as
arithmetic average of absolute differences between
actual and observed value divided by actual value

Comparison
(MAPE %)
June July August
Transpower 1.5% 1.6% 2.0%
EMS / TESLA 0.8% 1.2% 1.2%

MAPE(%) – June-August

Peak load performance – 8 August
TESLA Forecast vs Actual 8 August 2016
0
1000
2000
3000
4000
5000
6000
7000
8000
Forecast Actual
Tesla: MAPE: 1.3%

MAPE Comparison – 8 Aug 2016

MAPE Comparison – 26 July 2016

MAPE Comparison – 2 June 2016

What are my options for an
improved forecast?• EMS forecast available for subscription
• An industry enhancement project
– Tesla based forecast, benefits from forecaster
inputs (probably)
– Includes adjustments for demand management
– Significant capital and ongoing operational costs
– Forecast improvements flow thought to schedules
– If approved, earliest project start – Spring 2018

Emerging Technology
Transpower’s Programme of
Work
69
Transpower, System Operator Service
Industry Workshop 2016
Andrew Gard

Outline
• Emerging Technology Programme
• Solar PV Investigation Project
• Battery storage study and trial

Emerging Technology
Programme
• Background
• Objectives
• Components

Solar PV Investigation Project
Objectives:
Understand the technology and its impacts
on the power system.
Ensure we have ability to plan and operate
future power system to meet our PPOs.

Solar PV Investigation - Scope
Phase 1
Impacts
System Operations
• Ramping capability
• Frequency Management
• Volt. Management
System Stability
• Transient stability
• Voltage stability
Phase 2
Solutions
Market
Real Time Operation
Policy and standards

Solar PV Investigation - Status
• Ramping capability• Ramp rate limits – no issue with 4GW solar PV
• Remaining Phase 1 scope underway, due for
completion by mid 2017
• Phase 2 - only if issues are identified in Phase 1

Battery Storage System Study & Trial
• Investigate potential benefits at transmission level:
• Frequency Control
- Synthetic inertia
- Governor response
- Frequency keeping
• Voltage Control
- Improve voltage control
- Provide additional dynamic reactive power reserve
- Improve voltage stability limit
• System Security
- Improve operation limits by locating near to load
centres

Battery Storage System - Study & Trial
• Trial objectives & learnings:
• Battery technologies
• Design criteria and mode of operation
• Electrical behaviour and performance
• Commissioning and testing requirements
• Regulatory, market and technical challenges
• System operation requirements
• Economic benefit opportunities

Where to from here?• Transpower emerging technology programme
• Solar PV Investigation Project
– Balance of Phase 1 underway
– Preparation for Phase 2 as required
• Battery Storage System studies & trial
• Challenges to come
– What about EV?
– Other?

Questions?

Extended Contingent Event
Bus Bar Policy ProjectTranspower, System Operator Service
Industry Workshop 2016
Justin Blass

Our role
• Role of system operator
– Analyse, evaluate, and recommend the
appropriate risk management of power
system events
• Credible event review process
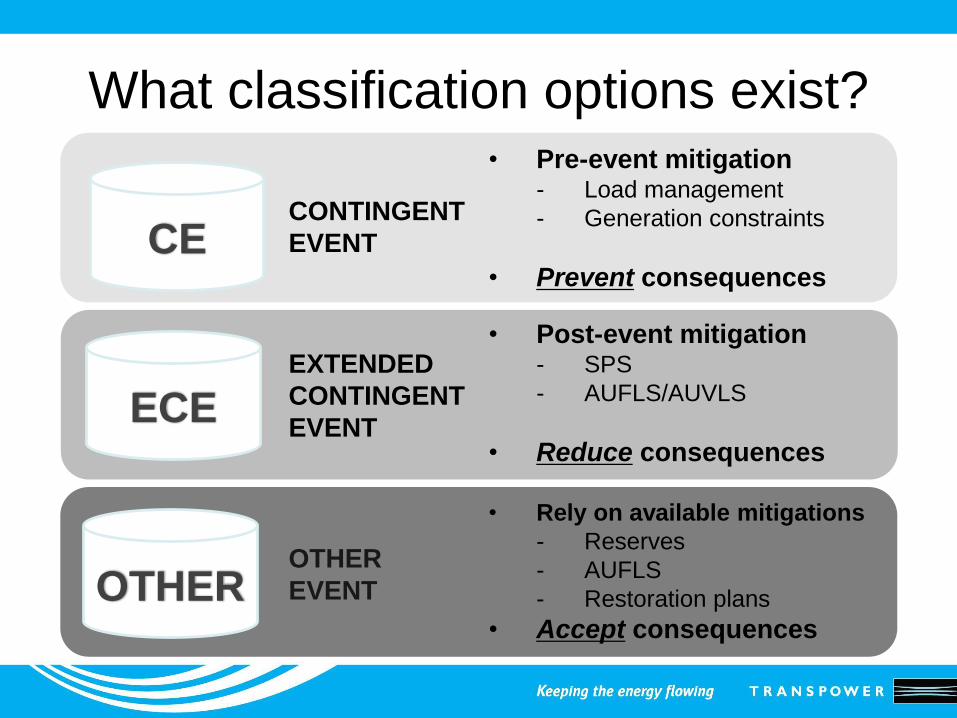
What classification options exist?
CE
• Pre-event mitigation- Load management
- Generation constraints
• Prevent consequences
CONTINGENT
EVENT
ECE
• Post-event mitigation- SPS
- AUFLS/AUVLS
• Reduce consequences
EXTENDED
CONTINGENT
EVENT
OTHER
• Rely on available mitigations
- Reserves
- AUFLS
- Restoration plans
• Accept consequences
OTHER
EVENT

Why review?• Credible event reviews
– 2009 and 2014 classified loss of a bus bar as
ECE
– In 2015 Manapouri bus bar treated as CE
during double circuit outage
• What mitigation should New Zealand have
for bus bar trippings?
R
C
E

Scope of project
Establish interim policy– Bus bar classified as “other events” for voltage
Review and improve classification
methodology
Trial new classification methodology
• Document and present findings
• Complete bus bar classification
assessment

What’s next?
Present
proposed
methodology
and trial results
Complete bus
bar classification
assessment
Complete
interconnecting
transformer
classification
assessment
Oct/Nov 2016
June 2017
2017/2018

Hawkes Bay Snow Storm
6 August 2016Transpower, System Operator Service
Industry Workshop 2016
Matt Hansen

Introduction
• Summary of the Hawkes Bay event
• Potential islanding process

Heavy Snow
• Heavy snow hit the central North Island in
the early hours of Saturday morning.
• The Hawkes Bay is supplied via a single
line between Taupo and Napier
• RDF_WRK_1 and WHI_WRK_1 circuits.
• Permanent operational split between
Woodville and Fernhill

Core Grid WRK
WTURDF 220kV
FHL
WPW
X
RDF 220kV
WHIG
TUI G
70MW 70MW
70MW
Pre-event

Core Grid WRK
WTURDF 220kV
FHL
WPW
X
RDF 110kV
WHIG
TUI G
140MW 0MW
70MW
X02:30

Core Grid WRK
WTURDF 220kV
FHL
WPW
X
RDF 110kV
WHIG
TUI G
0MW 0MW
70MW
X02:45X

Core Grid WRK
WTURDF 220kV
FHL
WPW
X
RDF 110kV
WHIG
TUI X
0MW 0MW
0MW
X02:45X

Core Grid WRK
WTURDF 220kV
FHL
WPW
X
RDF 110kV
WHIG
TUI G
170MW 0MW
40MW
X05:30

Core Grid WRK
WTURDF 220kV
FHL
WPW
X
RDF 110kV
WHIG
TUI G
0MW 0MW
120MW
X09:30
85MW

Core Grid WRK
WTURDF 220kV
FHL
WPW
X
RDF 110kV
WHIG
TUI G
0MW 0MW
120MW
XIf Successful
85MW
X

Core Grid WRK
WTURDF 220kV
FHL
WPW
X
RDF 110kV
WHIG
TUI G
38MW 0MW
120MW
X09:59
125MW

Core Grid WRK
WTURDF 220kV
FHL
WPW
X
RDF 110kV
WHIX
TUI X
0MW 0MW
0MW
X10:01X

New Process for Areas on ‘N’If all of the following are true:
• Area >100MW of load on ‘N’ security
• Increased risk of trip on remain asset enough
local generation to meet local load
• The generation is capable of islanding
Then:
• We will constrain local generation to match local
load to increase chance of successfully islanding

New Process Continued
• Connected parties can opt-out through
agreement by all distributors and direct connects
• Area <100MW of load on ‘N’ can opt-in by
agreement
• Area large enough to cause cascade failure will
be managed regardless of level of risk (no opt-
out)