Embed Size (px)
Citation preview

January 2015
Wages, Fringe Benefits, and Turnover for Direct Care Workers
Working for Long-Term Care Providers in Oregon
Final Report
Prepared for:
Nathan M. Singer Deputy Chief Operating Officer APD
Oregon Department of Human Services Salem, Oregon
Prepared by:
Sara Zuckerbraun, Project Director Joshua M. Wiener Celia Eicheldinger
Mary McGinn-Shapiro Kristie Porter
Lanting Dai Hillary Kruger
RTI International 230 W. Monroe St
Suite 2100 Chicago, IL 60606-4901
RTI Project Number: 0214375.000.003.200


RTI Project Number 0214375.000.003.200
Wages, Fringe Benefits, and Turnover for Direct Care Workers
Working for Long-Term Care Providers in Oregon
Final Report
January 2015
Prepared for:
Nathan M. Singer Deputy Chief Operating Officer APD
Oregon Department of Human Services Salem, Oregon
Prepared by:
Sara Zuckerbraun, Project Director Joshua M. Wiener Celia Eicheldinger
Mary McGinn-Shapiro Kristie Porter
Lanting Dai Hillary Kruger
RTI International 230 W. Monroe St
Suite 2100 Chicago, IL 60606-4901
_________________________________
RTI International is a registered trademark and a trade name of Research Triangle Institute.


CONTENTS
Section Page
Executive Summary ES-1
1. Introduction 1-1
2. Data Collection and Data Analysis Methods 2-1
2.1 Survey Methodology ................................................................................. 2-1
2.2 Weights .................................................................................................. 2-3
2.3 Data Recodes .......................................................................................... 2-3
2.4 Statistical Analysis ................................................................................... 2-3
3. Landscape Of Oregon Long-Term Care System 3-1
3.1 Characteristics of Long-Term Care Providers Participating in Medicaid in Oregon ................................................................................................... 3-1 3.1.1 Total Long-Term Care Providers ..................................................... 3-5 3.1.2 Nursing Facilities .......................................................................... 3-5 3.1.3 Residential Care Facilities: Aged and Physically Disabled ................... 3-6 3.1.4 Residential Care Facilities: Adults with Developmental Disabilities ...... 3-7 3.1.5 Adult Foster Care Homes: Aged and Physically Disabled .................... 3-7 3.1.6 Adult Foster Care Homes: Adults with Developmental Disabilities ....... 3-8 3.1.7 Assisted Living Facility: Aged and Physically Disabled ....................... 3-9 3.1.8 In-Home Care Agencies .............................................................. 3-10
3.2 Characteristics of Long-Term Care Service Users ........................................ 3-11 3.2.1 Total Long-Term Care Service Users ............................................. 3-14 3.2.2 Nursing Facilities ........................................................................ 3-14 3.2.3 Residential Care Facilities: Aged and Physically Disabled ................. 3-14 3.2.4 Residential Care Facilities: Adults with Developmental Disabilities .... 3-14 3.2.5 Adult Foster Care Homes: Aged and Physically Disabled .................. 3-15 3.2.6 Adult Foster Care Homes: Adults with Developmental Disabilities ..... 3-15 3.2.7 Assisted Living Facilities: Aged and Physically Disabled ................... 3-15 3.2.8 In-Home Care Agencies .............................................................. 3-16
3.3 Characteristics of Long-Term Care Direct Care Workers .............................. 3-16 3.3.1 Total Long-Term Care Direct Care Workers .................................... 3-20 3.3.2 Nursing Facilities ........................................................................ 3-20 3.3.3 Residential Care Facilities: Aged and Physically Disabled ................. 3-21
iii

3.3.4 Residential Care Facilities: Adults with Developmental Disabilities .... 3-21 3.3.5 Adult Foster Care Homes: Aged and Physically Disabled .................. 3-21 3.3.6 Adult Foster Care Homes: Adults with Developmental Disabilities ..... 3-21 3.3.7 Assisted Living Facilities: Aged and Physically Disabled ................... 3-22 3.3.8 In-Home Care Agencies .............................................................. 3-22
4. Wages Provided to Direct Care Workers Employed by Long-Term Care Providers 4-1
4.1 Current Wages for Long-Term Care Direct Care Workers ............................... 4-1
4.2 Factors in Determining Wages and Fringe Benefits for Long-Term are Direct Care Workers ................................................................................. 4-3 4.2.1 Total Long-Term Care Providers ..................................................... 4-4 4.2.2 Nursing Facilities .......................................................................... 4-6 4.2.3 Residential Care Facilities: Aged and Physically Disabled ................... 4-6 4.2.4 Residential Care Facilities: Adults with Developmental Disabilities ...... 4-6 4.2.5 Adult Foster Care Homes: Aged and Physically Disabled .................... 4-7 4.2.6 Adult Foster Care Homes: Adults with Developmental Disabilities ....... 4-7 4.2.7 Assisted Living Facilities: Aged and Physically Disabled ..................... 4-7 4.2.8 In-Home Care Agencies ................................................................ 4-8
4.3 Current Wages for Direct Care Workers ....................................................... 4-8 4.3.1 Nursing Facilities ........................................................................ 4-11 4.3.2 Residential Care Facilities: Aged and Physically Disabled ................. 4-12 4.3.3 Residential Care Facilities: Adults with Developmental Disabilities .... 4-13 4.3.4 Adult Foster Care Homes: Aged and Physically Disabled .................. 4-13 4.3.5 Adult Foster Care Homes: Adults with Developmental Disabilities ..... 4-14 4.3.6 Assisted Living Facilities: Aged and Physically Disabled ................... 4-15 4.3.7 In-Home Care Agencies .............................................................. 4-15
4.4 Prior Wages for Long-Term Care Direct Care Workers ................................. 4-16 4.4.1 Prior Wages for Total Direct Care Workers ..................................... 4-17 4.4.2 Nursing Facilities ........................................................................ 4-20 4.4.3 Residential Care Facilities: Aged and Physically Disabled ................. 4-20 4.4.4 Residential Care Facilities: Adults with Developmental Disabilities .... 4-23 4.4.5 Adult Foster Care Homes: Aged and Physically Disabled .................. 4-23 4.4.6 Adult Foster Care Homes: Adults with Developmental Disabilities ..... 4-26 4.4.7 Assisted Living Facilities: Aged and Physically Disabled ................... 4-26 4.4.8 In-Home Care Agencies .............................................................. 4-29
4.5 Average Wages for Long-Term Care Direct Care Workers by Provider Characteristics ....................................................................................... 4-31 4.5.1 Facility Characteristics ................................................................ 4-33 4.5.2 Service User Characteristics ........................................................ 4-34
iv

4.5.3 Direct Care Worker Characteristics ............................................... 4-35
4.6 Predictors of Wages for Long-Term Care Direct Care Workers ...................... 4-36 4.6.1 Long-Term Care Provider Factors ................................................. 4-36 4.6.2 Direct Care Worker Factors ......................................................... 4-38 4.6.3 Service User Factors ................................................................... 4-38
5. Provision of Fringe Benefits to Direct Care Workers 5-1
5.1 Current Provision of Fringe Benefits by LTC Provider Type ............................. 5-2 5.1.1 Introduction ................................................................................ 5-2 5.1.2 Overall........................................................................................ 5-7 5.1.3 Nursing Facilities .......................................................................... 5-8 5.1.4 Residential Care Facility: Aged and Physically Disabled ..................... 5-8 5.1.5 Residential Care Facility: Individuals with Developmental
Disabilities .................................................................................. 5-9 5.1.6 Adult Foster Care: Aged/Physical Disabilities ................................. 5-10 5.1.7 Adult Foster Care: Developmental Disabilities ................................ 5-11 5.1.8 Assisted Living Facility: Aged/Physical Disabilities .......................... 5-12 5.1.9 In-Home Care Agency................................................................. 5-13
5.2 Prior Coverage and Take-up of Fringe Benefits by LTC Provider Type ............ 5-13 5.2.1 Introduction .............................................................................. 5-13 5.2.2 Overall...................................................................................... 5-14 5.2.3 Nursing Facilities ........................................................................ 5-16 5.2.4 Residential Care Facility: Aged and Physically Disabled ................... 5-18 5.2.5 Residential Care Facility: Developmental Disabilities ....................... 5-20 5.2.6 Adult Foster Care: Aged/Physical Disabilities ................................. 5-22 5.2.7 Adult Foster Care: Developmental Disabilities ................................ 5-24 5.2.8 Assisted Living Facility: Aged/Physical Disabilities .......................... 5-26 5.2.9 In-Home Care Agency................................................................. 5-28
5.3 Provision of Fringe Benefits by LTC Provider Characteristics ......................... 5-30 5.3.1 Introduction .............................................................................. 5-30 5.3.2 Health Insurance: Family Coverage .............................................. 5-35 5.3.3 Health Insurance: Employee Only ................................................ 5-37 5.3.4 Paid Personal Time Off: Vacation and Sick Leave ............................ 5-38 5.3.5 Paid Time Off: Paid Holidays ........................................................ 5-40 5.3.6 Retirement Benefits: Pension, 401(k) or 403(b) ............................. 5-41 5.3.7 Life Insurance ............................................................................ 5-43 5.3.8 Health Insurance: Family Coverage .............................................. 5-49 5.3.9 Health Insurance: Employee-only ................................................. 5-50 5.3.10 Paid Personal Time Off: Vacation and Sick Leave ............................ 5-51
v

5.3.11 Paid Time Off: Paid Holidays ........................................................ 5-52 5.3.12 Retirement Benefits: Pension, 401(k) or 403(b) ............................. 5-53 5.3.13 Life Insurance ............................................................................ 5-54
5.4 Predictors of Benefit Offerings for Long-Term Care Direct Care Workers ........ 5-56 5.4.1 Employee-Only Health Insurance for Full-Time Direct Care
Workers (Table 5-5a) ................................................................. 5-56 5.4.2 Paid Time Off for Full-Time Direct Care Workers (Table 5-5b) .......... 5-59
6. Turnover 6-1
6.1 Introduction ............................................................................................ 6-1 6.1.1 Overall Turnover Rates (Figure 6-1) (Table 6-1) .............................. 6-2 6.1.1 Provider Characteristics ................................................................ 6-4
6.2 Predictors of the Annual Turnover Rate for Long-Term Care Direct Care Workers .................................................................................................. 6-7 6.2.1 Long-Term Care Provider Factors ................................................... 6-8 6.2.2 Direct Care Worker Factors ........................................................... 6-9 6.2.3 Service User Factors ..................................................................... 6-9
7. Discussion 7-1
7.1 Characteristics of Direct Care Workers ........................................................ 7-1
7.2 Wages of Direct Care Workers ................................................................... 7-1
7.3 Fringe Benefits ......................................................................................... 7-2 7.3.1 Direct Care Worker Turnover ......................................................... 7-3 7.3.2 Policy Variables of Interest: Dependence on Medicaid Payments ........ 7-3 7.3.3 Policy Variable of Interest: Aged/Physical Disability vs.
Developmental Disability .............................................................. 7-4 7.3.4 Policy Variable of Interest: Training ................................................ 7-5 7.3.5 Strategies to Increase Direct Care Workforce Wages through
Medicaid Rate Increases ............................................................... 7-5
7.4 Conclusion............................................................................................... 7-7
References R-1
Appendices
A Quality Control Steps on Questionnaire Data A-1 B Data Weights B-1 C Data Recodes C-1 D Supplemental Tables D-1 E Oregon Wage and Fringe Benefit Survey of Long-term Care (LTC) Providers E-1
vi

FIGURES
Number Page
3-1. Estimated Number of Oregon Long-Term Care Providers Participating in Medicaid, by Provider Type, 2014 .................................................................... 3-2
3-2. Long-Term Care Service Users, by Provider Type in Oregon, 2014 ..................... 3-11 3-3. Number of Direct Care Workers, by LTC Provider Type, 2014 ............................ 3-16
4-1. Mean and Median Wages for Direct Care Workers, by Provider Type, 2014 (Averaged Across Direct Care Workers) ............................................................ 4-2
4-2. Mean and Median Wages for Direct Care Workers, by Provider Type, 2014 (Averaged Across Providers) ........................................................................... 4-3
4-3. Average Wages for Direct Care Workers for All Long-Term Care Providers Participating in Medicaid, 2003-2014 ............................................................. 4-18
5-1. Offer of Employee-Only Health Insurance and Personal Paid Time Off to Direct Care Workers, by Provider Type, 2014 ............................................................. 5-3
6-1. Average Turnover Rate of Direct Care Workers, by Provider Type, 2014 ............... 6-3
vii

TABLES
Number Page
2-1. Oregon Wage and Fringe Benefit Survey of Long-Term Care (LTC) Providers Sample Disposition ........................................................................................ 2-5
3-1. Oregon LTC Provider Characteristics, by Provider Type....................................... 3-3 3-2. Service User Characteristics, by Provider Type ................................................ 3-12 3-3. Characteristics of Direct Care Workers, by Provider Type.................................. 3-17
4-1. Weighted Factors in Determining Wages and Fringe Benefits for Direct Care Workers by LTC Provider Type in Oregon .......................................................... 4-5
4-2. Wages for Direct Care Workers, by Provider Type, 2014 ..................................... 4-9 4-3. Direct Care Worker Weighted Current Wages for Direct Care Workers, by LTC
Provider Type ............................................................................................. 4-10 4-4. Wages for Direct Care Workers for Total Providers, 2003-2014 ......................... 4-19 4-5. Weighted Wages for Direct Care Workers at Nursing Facilities in Oregon,
2003-2014 ................................................................................................. 4-21 4-6. Wages for Direct Care Workers at Residential Care Facilities for Aged/Physical
Disabilities in Oregon, 2003-2014 ................................................................. 4-22 4-7. Wages for Direct Care Workers at Residential Care Facilities for Adults with
Developmental Disabilities in Oregon, 2003-2014 ............................................ 4-24 4-8. Wages for Direct Care Workers at Foster Care Homes for Aged/Physical
Disabilities in Oregon, 2003-2014 ................................................................. 4-25 4-9. Wages for Direct Care Workers at Foster Care Homes for Adults with
Developmental Disabilities in Oregon, 2003-2014 ............................................ 4-27 4-10. Wages for Direct Care Workers at Assisted Living Facilities in Oregon, 2003-
2014 ......................................................................................................... 4-28 4-11. Wages for Direct Care Workers at In-Home Agencies, 2003-2014 ..................... 4-30 4-12. Wages for Direct Care Workers, Total Providers, by Provider Characteristics,
2014 ......................................................................................................... 4-31 4-13. OLS Regression of Average Wages, Total Providers, 2014 ................................ 4-37
5-1. Offer of Fringe Benefits to Direct Care Workers, by Provider Type, 2014 .............. 5-4 5-2a. Offer of Fringe Benefits and Enrollment/Use by Direct Care Workers, Across
All Providers and All Direct Care Workers, 2010-2014 ...................................... 5-15 5-2a. Offer of Fringe Benefits and Enrollment/Use by Direct Care Workers, Across
All Providers and All Direct Care Workers, 2010-2014 ...................................... 5-16 5-2b. Fringe Benefits Offers and Enrollment/Use by Direct Care Workers at Nursing
Facilities, 2010-2014 ................................................................................... 5-17
viii

5-2c. Fringe Benefits Offers and Enrollment/Use by Direct Care Workers at Residential Care APD Facilities, 2010-2014 ..................................................... 5-19
5-2d. Fringe Benefits Offers and Enrollment/Use by Direct Care Workers at Residential Care Facilities for Adults with Developmental Disabilities, 2010-2014 ......................................................................................................... 5-21
5-2e. Fringe Benefits Offers and Enrollment/Use by Direct Care Workers at Foster Care Homes for Aged/Physical Disabilities, 2010-2014 ..................................... 5-23
5-2f. Fringe Benefits Offers and Enrollment/Use by Direct Care Workers at Foster Care Homes for Adults/Developmental Disabilities, 2010-2014, ........................ 5-25
5-2g. Fringe Benefits Offers and Enrollment/Use by Direct Care Workers at Assisted Living Facilities: Aged/Physical Disabilities, 2010-2014 .................................... 5-27
5-2h. Fringe Benefits Offers and Enrollment/Use by Direct Care Workers at In-Home Care Agencies, 2010-2014, Weighted by Direct Care Workers ........................... 5-29
5-3. Offer of Fringe Benefits, Total Providers, by Provider Characteristics, 2014 (% of Providers) ............................................................................................... 5-31
5-4. Direct Care Workers Use/Enrollment in Fringe Benefits, by Provider Characteristics, 2014 (% of Direct Care Workers) ............................................ 5-45
5-5a. Logistic Regression of Employee-only Health Insurance Offered to Full-time Direct Care Workers .................................................................................... 5-58
5-5b. Logistic Regression of Paid Personal Time off, Vacation Time, or Sick Leave offered for Full-Time Direct Care Workers ....................................................... 5-60
6-1. Average Turnover Rate of Direct Care Workers, by LTC Provider Type, 2014......... 6-4 6-2. Average Turnover Rate of Direct Care Workers, by Provider Characteristics,
2014 ........................................................................................................... 6-5 6-3. OLS Regression of Direct Care Worker Turnover Rate, 2014 ............................... 6-7
D-1. Provider Characteristics, by Provider Type, 2014 .............................................. D-1 D-2. Service User Characteristics, by Provider Type, 2014 ........................................ D-3 D-3. Characteristics of Direct Care Workers, by Provider Type, 2014 ......................... D-4 D-4. Factors in Determining Wages and Fringe Benefits for Direct Care Workers, by
Provider Type, 2014 ..................................................................................... D-6 D-5. Direct Care Worker Wages for Direct Care Workers, by Provider Type, 2014 ........ D-7 D-6. Wages for Direct Care Workers, by Provider Type, 2014 (Weighted by
Providers) ................................................................................................... D-8 D-7. Wages for Direct Care Workers at Residential Care Facilities for Children with
Developmental Disabilities, 2003-2014 ........................................................... D-9 D-8. Wages for Direct Care Workers at Supportive Living Services for Individuals
with Developmental Disabilities, 2003-2014 ................................................... D-10 D-9. Fringe Benefits for Direct Care Workers at Residential Care Facilities for
Children with Developmental Disabilities, 2003-2014 ....................................... D-11 D-10. Fringe Benefits for Direct Care Workers at Supportive Living Services for
Individuals with Developmental Disabilities, 2003-2014 ................................... D-12 D-11. Fringe Benefits for Direct Care Workers, by Provider Type, 2014 ....................... D-13
ix

D-12. Fringe Benefits for Direct Care Workers at Foster Care Homes for Aged/Physical Disabilities in Oregon, 2003-2014 ............................................. D-15
D-13. Fringe Benefits for Direct Care Workers at Residential Care Facilities for Children with Developmental Disabilities, 2003-2014 ....................................... D-16
D-14. Fringe Benefits for Direct Care Workers at Supportive Living Services for Individuals with Developmental Disabilities, 2003-2014 ................................... D-17
x

Executive Summary
This report provides the information required by the budget note included in the Budget
Report for HB5029. This budget note seeks information on the number and type of direct
care workers employed by long-term services and supports providers, the wages and fringe
benefits of the direct care workers they employ, and turnover rates of these direct care
workers. The budget note requests information on how trends over time in wages and fringe
benefit offerings. In addition, the legislature seeks information about how wages relate to
the Medicaid payment rates and to inflation over time.
Direct care workers, such as certified nurse assistants, home health aides, and personal
care aides, are the backbone of the formal long-term services and supports delivery system.
These workers often receive low wages. In addition, direct care workers often receive little
in the way of fringe benefits. Advocates for direct care workers argue that low wages and
lack of fringe benefits have adverse consequences in terms of turnover and quality of care.
Proposals to improve extrinsic benefits of the job, such as wages and fringe benefits, make
a straightforward economic case. Workers are more likely to stay on the job when they are
well paid, especially relative to other employment opportunities. The argument is also that
better worker compensation packages could help draw marginal workers into the labor
force. In addition, increases in the compensation of long-term care staff relative to other
low-wage positions could reallocate the available low-wage workforce to long-term care.
Survey Methodology
Data for this study was collected primarily through a mail survey with telephone follow-up of
long-term care providers participating in the Oregon Medicaid program. Individuals who act
as independent providers are not included. Provider categories included Nursing Facilities,
Residential Care Facility: Aged/Physical Disabilities, Residential Care: Adults/ Developmental
Disabilities, Adult Foster Care: Aged/Physical Disabilities, Adult Foster Care: Developmental
Disabilities, Assisted Living Facility: Adult/Physical Disabilities, In-Home Care Agencies,
Residential Care Contracts, Residential Care: Children/Developmental Disabilities,
Supportive Living: Developmental Disabilities, Adult Day Services, and Specialized Living
Facilities. Direct care workers were defined as “A paid worker who is a full-time or part-time
employee of the provider (i.e., the provider is required to issue a US Federal Tax Form W-2
on their behalf) and who provides direct hands-on personal care services to persons with
disabilities or the elderly requiring long-term services and supports in the provider’s facility,
client’s home or other setting. Contract workers are not included in this definition, and
administrators/directors who provide direct care in addition to their administrative duties
are not included in this definition.”
ES-1

Wages, Fringe Benefits, and Turnover for Direct Care Workers Working for Long-Term Care Providers in Oregon
Most, but not all, long-term care providers participating in the Oregon Medicaid program
were surveyed. Working from a master list of Oregon Medicaid long-term care providers
supplied by the Oregon Department of Human Services, we began by cleaning the file,
removing duplicates from the sampling frame. For the survey, we took a census of all
providers with the exception of adult foster homes where a stratified random sample was
selected. Because of the large number of adult foster homes, a full census was not required
to produce precise estimates for this provider type, which allowed us to conduct the survey
at a lower cost.
The survey was developed by RTI International staff, drawing on previous surveys of long-
term care providers. Historical data on wages and fringe benefits, in particular, were difficult
for providers to obtain from their records and to accurately report. The final questionnaire
was reviewed and approved by officials at the Oregon Department of Human Services.
The survey initially was mailed to 2,924 providers. The introductory letter stressed that
completion of the survey was a condition of participating in the Oregon Medicaid program.
At the end of the data collection, complete questionnaires were collected from 2,008
providers. After excluding duplicates, providers that were out of business, providers that
submitted incomplete questionnaires, and providers that did not have an active contract
from the Oregon Department of Human Services, the final response rate for the survey was
81.2%, calculated using American Association of Public Opinion Research (AAPOR) Response
rates by provider types ranged from a low of 72.3% for Residential Care: Developmental
Disabilities to a high of 100.0% for IC Specialized Services.
In order to make the survey responses descriptive of the total population, the response
questionnaires were weighted to make them descriptive of the total population of long-term
care providers, service users, and direct care workers. The report mostly presents
descriptive statistics, with a few multivariate analyses of the determinants of wages,
provision of fringe benefits, and turnover rates.
Characteristics of Long-Term Care Providers Participating in Medicaid in Oregon
▪ Not counting independent providers, an estimated 3,819 long-term care providers participate in Medicaid. The three largest categories in terms of the number of providers are adult foster care: aged/physical disabilities, adult foster care: adult/developmental disabilities, and residential care: developmental disabilities, which together account for more than four-fifths of all long-term care providers participating in Medicaid.
▪ The typical long-term care provider is a small, for-profit organization that is not part of a chain, which is located in a metropolitan area. Providers are split almost equally between those serving an older population and people with physical disabilities and a population with developmental disabilities. Other categories make up a small proportion of providers. Over three-quarters of providers require less than 75 hours of training before direct care workers start providing care to consumers. Only nursing
ES-2

Executive Summary
facilities required more than 75 hours of training, as stipulated by federal regulations. About a third of adult foster care homes did not employ any direct care workers.
▪ Long-term care providers served 45,858 current residents or other service users over the last 7 days, with assisted living facilities for aged/ physically disabled, nursing facilities and in-home care agencies serving the largest number of consumers.
• Most service users were white, non-Hispanics, female, and over age 65. About two-
fifths of service users used Medicaid as their primary source of payment for services.
• There were 36,685 direct care workers employed by long-term care providers, with
the largest employers being nursing facilities, assisted living facilities for aged/
physical disabilities, and in-home care agencies.
• The typical direct care worker was white, non-Hispanic, female, aged 18-44, with a
high school education. About two-thirds of direct care workers are employed full
time.
Wages Provided to Direct Care Workers Employed by Long-Term Care Workers
▪ Providers reported that the most important factors that they considered when setting wages for direct care workers were: the legally required minimum wage, the education and experience of individual workers, and the wages of other long-term care providers. The Medicaid rate was cited as a factor by about a third of long-term care providers, and was especially important for nursing facilities and in-home care agencies.
▪ Weighted by providers, the mean (average) wage per hour for direct care workers was $12.38 and the median was $11.15. There was not much variation by provider type, except that nursing facilities and adult foster care facilities for aged/physically disabilities paid higher salaries.
▪ Mean and median salaries were lower when weighted by the number of direct care workers employed by each provider. Weighted by direct care workers, the mean (average) wage per hour for direct care workers was $11.10 and the median was $10.51. There was not much variation by provider type, except that nursing facilities and adult foster care facilities for aged/physical disabilities paid higher salaries.
▪ Over the period 2003 to 2014, wages for providers in operation in 2014 increased, although less than 2003 wages adjusted for inflation. For example, weighted by the number of direct care workers, average wages increased from $9.21 in 2003 to $11.20 in 2014; inflation-adjusted 2003 wages would be $12.07 in 2014.
▪ Although there is variation across provider types, Medicaid payment rates to providers serving older people and younger persons with physical disabilities generally increased faster than direct care payment rates. For example, the Medicaid payment rate for nursing facilities increased by 88% increase between 2003 and 2014, which was over three times faster than the reported direct care worker wage increase. Overall, Medicaid payment rates increased at a slower rate from 2009 to
ES-3

Wages, Fringe Benefits, and Turnover for Direct Care Workers Working for Long-Term Care Providers in Oregon
2014 and were more comparable to increases in wages by direct care workers. Data is not available to conduct a comparable analysis of payment rates for providers of services to people with developmental disabilities.
▪ In a multivariate analysis of the wages, the following variables were statistically significant predictors of higher wages: nursing facility, adult foster care for aged/ physical disabilities (compared to supported living for people with developmental disabilities, nonprofit and for-profit ownership (compared to government facilities), proportion of direct care workers who are Hispanic/Latino, number of service users, and 75 or more hours of required training. Statistically significant predictors of lower wages included: proportion of direct care workers who are minority, proportion of service users who have their care paid primarily by Medicaid, and micropolitan location.
Provision of Fringe Benefits to Direct Care Workers
▪ Provision of fringe benefits varies greatly among long-term care providers. As expected, the offer of fringe benefits is much more common for full-time employees than for part-time workers. Where offered to part-time workers, they generally must work a quarter-to-half time to qualify for benefits.
▪ The most commonly offered fringe benefit is paid personal time off (60.21%), followed by paid holidays (45.60%), employee-only health insurance (41.90%), health insurance with family coverage (34.03%), retirement plan (33.81%), and life insurance (30.97). Nursing facilities, assisted living facilities, and residential care facilities for adults with developmental disabilities offer benefits to a substantial portion of direct care workers; in home care agencies and adult foster care facilities offer few benefits. For providers in operation in 2014, a greater proportion of long-term care providers offered various fringe benefits in 2014 than they did in 2010.
▪ Direct care worker participation in fringe benefits varies greatly by the type of fringe benefit. Fringe benefits that typically require an employee financial contribution, such as health insurance, retirement benefits, and life insurance, have low participation rates. For example, while about 31% (30.85%) of long-term care providers offer some type of retirement benefits, only about 15% (14.25%) of direct care workers participate. Conversely, participation rates for “free” benefits are much higher. For example, about 56% (56.06%) of providers offered personal time off and almost two-thirds of (65.17%) direct care workers used the benefit.
▪ Various provider characteristics are associated with offering fringe benefits. While the effect varies by fringe benefit, in general, government providers, chains, providers with a higher proportion of Medicaid beneficiaries, providers serving people with intellectual disabilities, providers with a higher proportion of Hispanic/Latino direct care workers, providers with a lower proportion of minority service users, providers serving younger people with disabilities, providers requiring higher levels of training, and providers that pay direct care workers higher wages are more likely to offer fringe benefits.
▪ The relationship between provider characteristics and enrollment or use of fringe benefits by direct care workers is complicated and the effects are not as consistent. In general, direct care workers employed by providers that have nonprofit or government ownership, are owned by chains, have a lower proportion of Medicaid beneficiaries, provide services to people with intellectual disabilities, provide services to a lower proportion of minority direct care workers, have a high proportion of
ES-4

Executive Summary
minority beneficiaries, provide services primarily to younger people, with disabilities, provide services to a larger number of service users, employ a more educated workforce, require more training and pay direct care workers a higher wage are more likely to have direct care workers that enroll or use fringe benefits.
▪ In a multivariate analysis of factors associated with the offering of paid time off, the following variables were statistically significantly associated with an increase in the probability that providers would offer the benefit include: nonprofit ownership (compared to government ownership), for-profit ownership (compared to government ownership), chain ownership, larger providers, requiring 75 hours or more of training, metropolitan location. Statistically significant variables associated with a reduction in the probability that providers would offer the benefit include: proportion of direct care workers who are minority and providers who pay their workers less.
Turnover among Direct Care Workers Employed by Long-Term Care Providers Participating in the Medicaid Program in Oregon
▪ Average annual turnover among direct care workers was 64% a year, with wide variation across provider types. Residential care facilities for adults with developmental disabilities had the highest turnover rates at 90% per year, while adult foster care homes for people with developmental disabilities had the lowest turnover rate at 30%. Nursing facilities had turnover rates of 54%.
▪ Provider, service user, and direct care worker characteristics were associated with different turnover rates. Nonprofit ownership, chain ownership, micropolitan and rural location, providers focusing on people with developmental disabilities and severe mental illness, a low proportion of minority workers, and a high proportion of minority service users were associated with high turnover rates. Turnover rates did not differ by whether the provider served a high or low proportion of Medicaid beneficiaries.
▪ A multivariate analysis of turnover rates found that, controlling for other factors, the following variables were statistically significantly associated with higher turnover rates: residential care facilities for adults with developmental disabilities, for-profit and chain ownership, requiring direct care workers to have 75 or more hours of training, and lower wages paid to direct care workers. Variables statistically significantly associated with lower turnover rates include: proportion of long-term care workers who are nonwhite location in a metropolitan areas and proportion of service users who use Medicaid as their primary method of payment for services.
Discussion
Direct care workers are the backbone of the long-term services and supports industry.
These workers provide residents, clients, and patients (depending on provider type) with
day-to-day basic care to ensure that their daily care needs are being met. Nationally, the
U.S. Bureau of Labor Statistics (2013) estimates the need for an additional 1.3 million direct
care worker positions between 2012 and 2022. The nation, including Oregon, will have
difficulty recruiting and retaining these workers unless working conditions—including wages
and fringe benefits—are improved.
ES-5


1. INTRODUCTION
This report provides the information required by the budget note included in the Budget
Report for HB5029. This budget note states:
The Department of Human Services shall provide a report to the Joint Committee on
Ways and Means during the 2015 legislative session on services, providers, and rates
for each agency program relying on direct care workers for service delivery.
Dependent on the project’s final scope and expertise required, the Department may
contract with a third party to complete the report. The report will include a
description of the services, provider type, number of direct care workers, and worker
turnover rates.
In addition, the report will show provider rates for the 2009-11, 2011-13, and 2015
biennia and the relationship between those rates and direct care worker wages.
Where possible, the report will also show comparisons between the 2013-15 rates
and what those rates would be if 2003-05 rates had been indexed to inflation from
that biennium forward.
Within programs or specific services, the report will also describe how worker wages
are determined, for example, whether by the employer or through a collective
bargaining agreement. The Department will also identify any current data gaps,
attempt to resolve them if possible, and outline strategies to resolve them for future
reporting.
Finally, the report will explore other options – beyond simply increasing rates – for
ensuring that funding increases translate into in wage increases for direct care
workers. Some recognized strategies include implementing wage pass through
legislation, providing enhanced reimbursements tied to workforce outcomes,
specifying a minimum allocation of rate to direct care labor costs, and revising
contract language. It is the intent of the Joint Committee on Ways & Means that
provider rate increases in the 2013-15 budget have as a priority salary and benefit
increases for direct care workers in order to reduce turnover rates.
Direct care workers, such as certified nurse assistants, home health aides, and personal
care aides, are the backbone of the formal long-term services and supports delivery system
(Stone and Wiener, 2001). These workers often receive low wages (Khatutsky et al., 2011).
For example, according to the U.S. Bureau of Labor Statistics (BLS), the median hourly
wage of personal care aides in Oregon was $10.46 in 2012, down 7.7% from 2002 in
inflation-adjusted dollars (PHI, 2013; U.S. Bureau of Labor Statistics, 2013a). In addition,
direct care workers often receive relatively little in the way of fringe benefits. In an analysis
of the National Health Interview Survey, researchers at the Institute for Women’s Policy
1-1

Wages, Fringe Benefits, and Turnover for Direct Care Workers Working for Long-Term Care Providers in Oregon
Research found that nationally only 31% of personal care and service workers, an
occupational category that includes personal care aides, had paid sick leave in 2012
(Williams and Gault, 2014).
Advocates for direct care workers argue that low wages and lack of fringe benefits have
adverse consequences in terms of turnover and quality of care. An analysis of certified
nursing assistants suggests that among those workers likely to leave their jobs in the next
year, one in three workers cited pay as a reason they would leave their job (Squillace,
Bercovitz, Remsburg, & Rosenoff, 2008). Similarly, an analysis of the National Nursing
Assistance Survey found that extrinsic rewards, such as higher wages, paid time off, and
availability of a pension, have a consistently positive effect on job tenure (Wiener, Squillace,
Anderson, and Khatutsky, 2009). Similar results have been found for home care aides in
Maine (Butler et al., 2014).
In a rare study of the effects of wage increases, a near doubling of wages of home care
workers in San Francisco County, California, increased the retention rate over a 52-month
period from 39% to 74% (Howes, 2005). However, an analysis that merged the National
Nursing Home Survey, the National Nursing Assistant Survey, and Centers for Medicare &
Medicaid nursing home quality of care data, the wages of certified nurse assistants were not
found to be a statistically significant predictor of nursing home quality (Wiener, Anderson,
and Khatutsky, 2011).
Proposals to improve extrinsic benefits of the job, such as wages and fringe benefits, make
a straightforward economic case. Workers are more likely to stay on the job when they are
well paid, especially relative to other employment opportunities. The argument is also that
better worker compensation packages could help draw marginal workers into the labor
force. In addition, increases in the compensation of long-term care staff relative to other
low-wage positions could reallocate the available low-wage workforce to long-term care
(Holzer, 2001), drawing more qualified staff into long-term care.
This report attempts to answer four broad questions:
▪ What are the characteristics of long-term care providers that participate in the Oregon Medicaid program? What are the characteristics of the people they serve and the direct care workers that they employ?
▪ What are the current wages of direct care workers employed by providers that participate in the Oregon Medicaid program? How do they wages vary by provider type, characteristics of service users, and characteristics of direct care workers? How have wages varied over time and do they relate to inflation and increases in Medicaid rates?
▪ What are the current fringe benefits offered to and used by direct care workers employed by providers that participate in the Oregon Medicaid program? How do fringe benefit offerings and use vary by provider type, characteristics of service
1-2

Section 1 — Introduction
users, and characteristics of direct care workers? How have the offering and use of fringe benefits varied over time?
▪ What is the current turnover rate among direct care workers employed by providers that participate in the Oregon Medicaid program? How do turnover rates benefits vary by provider type, characteristics of service users, and characteristics of direct care workers? How have the offering and use of fringe benefits varied over time?
The remainder of this report is divided into five chapters. Chapter 2 provides an overview
of the survey of long-term care providers and the data analysis methods. Chapter 3
provides a profile of long-term care providers, service users, and direct care workers.
Chapter 4 provides an analysis of direct care wages. Chapter 5 provides an analysis of the
offer and use of fringe benefits. Chapter 6 provides an analysis of turnover among direct
care workers. Chapter 7 provides a discussion of the main findings of the report, including
a discussion of options to pass through more of Medicaid rate increases to direct care wages
in the form of wage increases and more fringe benefits.
1-3


2. DATA COLLECTION AND DATA ANALYSIS METHODS
2.1 Survey Methodology
Data for this study was collected primarily through a mail survey with telephone follow-up of
long-term care providers participating in the Oregon Medicaid program. Individuals who act
as independent providers are not included. Provider categories included Nursing Facilities,
Residential Care Facility: Aged/Physical Disabilities, Residential Care: Adults/ Developmental
Disabilities, Adult Foster Care: Aged/Physical Disabilities, Adult Foster Care: Developmental
Disabilities, Assisted Living Facility: Adult/Physical Disabilities, In-Home Care Agencies,
Residential Care Contracts, Residential Care: Children/Developmental Disabilities,
Supportive Living: Developmental Disabilities, Adult Day Services, and Specialized Living
Facilities. These long-term care providers served older people, younger persons with
physical disabilities, people with intellectual/developmental disabilities, people with
traumatic brain injuries, persons with HIV, and people with severe mental illness. The main
purpose of the survey was to obtain information on direct care workers employed by these
long-term services and supports providers, especially their training, wages, fringe benefits,
and turnover.
Most, but not all, providers were surveyed. Working from a master list of Oregon Medicaid
long-term care providers supplied by the Oregon Department of Human Services, we began
by cleaning the file, removing duplicates from the sampling frame. For the survey, we took
a census of all providers with the exception of adult foster homes where a stratified random
sample was selected. Because of the large number of adult foster homes, a full census was
not required to produce precise estimates for this provider type, which allowed us to
conduct the survey at a lower cost.
The adult foster homes were stratified into two groups: Adult Aged and Physically Disabled
(Adult APD) and Adult Developmental Disabilities (Adult DD). The sample for the two groups
was proportionally allocated based on the population size for the two groups. This
proportional allocation resulted in a simple random sample of 394 providers from the Adult
DD stratum and a simple random sample of 720 providers from the Adult APD stratum. A
power calculation determined that these sample sizes would allow for estimates with +/-
0.04 precision for a 50% estimate at the 95% confidence level.
Direct care workers were defined as follows: “A paid worker who is a full-time or part-time
employee of the provider (i.e., the provider is required to issue a US Federal Tax Form W-2
on their behalf) and who provides direct hands-on personal care services to persons with
disabilities or the elderly requiring long-term services and supports in the provider’s facility,
client’s home or other setting. Contract workers are not included in this definition, and
administrators/directors who provide direct care in addition to their administrative duties
are not included in this definition.”
2-1

Wages, Fringe Benefits, and Turnover for Direct Care Workers Working for Long-Term Care Providers in Oregon
The survey was developed by RTI International staff, drawing on previous surveys of long-
term care providers, including the National Nursing Home Survey (NNHS), the National
Nursing Assistant Survey (NNAS), the National Home Health and Hospice Care Survey
(NHHCS), the National Home Health Aide Survey (NHHAS), the National Survey of
Residential Care Facilities (NSRCF), and the National Study of Long-Term Care Providers
(NSLTCP). In designing the questionnaire, we strove to balance the need to gather the
information required to develop the legislative report with the need to limit the reporting
burden on providers. Historical data on wages and fringe benefits, in particular, were
difficult for providers to obtain from their records and to accurately report. The final
questionnaire, Appendix E, was reviewed and approved by officials at the Oregon
Department of Human Services.
The survey followed industry best-practices for conducting mailouts and non-response
follow-up. On July 2-3, 2014, a package containing the introductory letter, frequently asked
questions (FAQs), the questionnaire and a postage-paid business reply envelope was mailed
to 2,924 providers. The introductory letter stressed that completion of the survey was a
condition of participating in the Oregon Medicaid program. On July 23, a reminder letter was
mailed to 2,573 providers for whom a response was not received. On August 6, a second
package containing a final request letter, FAQs, the questionnaire and a postage-paid
business reply envelope was mailed to 2,183 providers for whom a response was not
received. All packages were mailed via the United States Postal Service. In order to increase
the response rate, DHS sent e-mail Alerts to all providers reinforcing the mandatory nature
of the survey and reminding providers to complete their questionnaires.
A Toll-Free Inquiry line as well as an e-mail address for RTI project staff was printed on the
letters, the FAQs, and the survey. During the mailout phase of the project, approximately
360 providers made inquiries via telephone or e-mail, all of which RTI responded to through
a personal e-mail message, a personal phone call, or by leaving a voicemail message. The
most common types of inquiries were: (1) providers wanting to confirm that their
questionnaire was received; (2) provider requested another mailing; (3) provider did not
have direct care workers or a Medicaid contract; (4) provider wanted to know the deadline
for the survey; and (5) provider thought they had received duplicate questionnaire or had
multiple facilities and wanted clarification as to how to complete the questionnaire..
In addition to the mailings a telephone “prompting” procedure began on August 12, 2014.
After receiving a 4-hour training and passing a detailed certification testing, telephone
interviewers began calling the providers who had not yet responded to the survey. The
telephone prompters reminded them about the survey, asked if there were questions or
concerns, clarified response procedures for co-located providers and providers with multiple
sites, and, when requested, resent questionnaires. Questionnaires were sent either by mail
or by sending a PDF to the e-mail address the interviewer collected from the provider.
2-2

Section 2 — Data Collection and Data Analysis Methods
Prompting was performed for the 2,153 providers with outstanding questionnaires. Up to 10
calls were made to each provider.
Returned questionnaires were received in RTI’s offices. The questionnaires were scanned
into the Teleform system, which extracted answers to coded questions and all write-in
numeric questions. On all questionnaires, data clerks compared the Teleform’s digital image
of all write-in numeric questions to hardcopy and made any corrections to data files, when
necessary. Data collection ended on October 28, 2014.
The final response rate for the survey was 81.2%, calculated using American Association of
Public Opinion Research (AAPOR) Response Rate #1 methods (Table 2-1). Response rates
by provider types ranged from a low of 72.3% for Residential Care: Developmental
Disabilities to a high of 100.0% for IC Specialized Services.
2.2 Weights
In order to make the survey responses descriptive of the total population, the response
questionnaires were weighted to make them descriptive of the total population of long-term
care providers, service users, and direct care workers. The provider-level analysis weights
were calculated in three steps: (1) calculate the sample weights, (2) calculate the non-
response adjustment factor and, (3) apply the non-response adjustment factor to the
sample weights to create the provider-level analysis weights. After the provider-level
analysis weights were calculated, we created direct care worker-level analysis weights and
beneficiary-level analysis weights using a similar methodology. A detailed description of how
the provider, service user, and direct care worker weights were created are presented in
Appendix B.
2.3 Data Recodes
Prior to conducting any analyses or creating estimates we thoroughly reviewed the survey
data for any reporting inconsistencies. As a result of our review we implemented a series of
data recodes. In determining the rules for the data recodes we followed the data recoding
conventions used on the National Study of Long Term Care Facilities funded by NCHS. A
detailed description of the data recodes are found in Appendix C.
2.4 Statistical Analysis
The statistical analyses conducted for this report are primarily descriptive statistics and
cross tabulations. No significance testing was conducted for these analyses. Most analyses
were conducted for all long-term care providers and by individual provider type. Depending
on the type of analyses, provider, service user or direct care worker weights were used. As
in many industries, many long-term care providers are small, employing relatively few
direct care workers. By weighting some analyses by the number of direct care workers, for
example, the analyses directly takes into account that some providers employ 5 direct care
2-3
Wages, Fringe Benefits, and Turnover for Direct Care Workers Working for Long-Term Care Providers in Oregon
workers while another employs 50, and gives recognition in the weighting to that larger
provider.
To preserve respondent anonymity without compromising the utility of the analyses we
suppressed estimates for any provider specialty subgroup with fewer than 29 respondents.
The subgroups that were suppressed were Adult Day Services and Specialized Living
Facilities. The results for these two provider specialties were rolled together and combined
with all the other provider specialties and presented in the “total” estimates. Any analysis or
set of table estimates not split out by provider specialty also retained the responses for
these two provider specialties.
Data on some provider types are included in Appendix D rather than the main report text.
These providers include Residential Care Facilities with Contract Rates (residential care
facilities that carry a separate contract for additional work, usually tied to serving individuals
in a memory care community), Residential Care Facilities for Children with Developmental
Disabilities, and Supportive Living Services for Individuals with Developmental Disabilities.
In addition, due to small sample sizes (i.e., under 30 respondents), certain providers,
including Adult Day Services and Specialized Living Facilities, could not be separately
analyzed without disclosing data on individual providers. However, data on these long-term
care providers are in included in the analyses of “all long-term care providers.”
While descriptive statistics and cross tabulations account for the bulk of the analyses,
multiple regression analyses were conducted on a few important outcomes Multivariate
analyses allow several variables to be controlled for simultaneously, allowing the analyst to
determine the independent effect of a particular variable controlling for all of the others.
Ordinary least squares regression analyses were conducted of direct care worker wages and
turnover; logistic regression was performed on whether providers offered or did not offer
employee-only health insurance and whether providers offered paid time off.
2-4

Sectio
n 2
— D
ata Collection
and D
ata Analysis M
ethods
2-5
Table 2-1. Oregon Wage and Fringe Benefit Survey of Long-Term Care (LTC) Providers Sample Disposition
Total Complete
Ineligible
Not Complete
Response Rate Complete/
(Total - Ineligible). %
Duplicate Questionnaire
Received Duplicate
No Medicaid Contract
Out of Business
All Provider Types 2924 2008 13 174 35 229 465 81.2
By Provider Specialty Type (including imputations)
Adult Foster Care APD 394 301 0 1 13 18 61 83.1
Adult Day Services APD 23 15 0 0 0 6 2 88.2
Adult Foster Care DD 720 580 0 1 5 59 75 88.5
Assisted Living Facility APD 214 149 1 22 5 10 27 84.7
IC Specialized Living 8 7 0 1 0 0 0 100.0
In Home Care Agency 67 52 0 2 0 2 11 82.5
Nursing Facility 169 118 0 7 10 14 20 85.5
Residential Care APD 119 79 1 12 0 6 21 79.0
Residential Care Contract Rates 131 81 5 28 0 5 12 87.1
Residential Care DD Adult 933 552 1 80 2 86 212 72.3
Residential Care DD Child 48 29 0 1 0 7 11 72.5
Specialized Living Services 2 2 0 0 0 0 0 100.0
Supported Living DD 96 43 5 19 0 16 13 76.8
Source: RTI International analysis of the 2014 Oregon Wage and Fringe Benefit Survey of Long-Term Care (LTC) Providers.


3. LANDSCAPE OF OREGON LONG-TERM CARE SYSTEM
3.1 Characteristics of Long-Term Care Providers Participating in Medicaid in Oregon
This chapter provides a snapshot of the characteristics of long-term care providers in
Oregon as well for each type of provider. Highlights Box 1 summarizes the main findings
from this chapter.
Highlight Box 1: Characteristics of Long-Term Care Providers Participating in Medicaid in Oregon
• Not counting independent providers, an estimated 3,819 long-term care providers participate in Medicaid. The three largest categories in terms of the number of providers are adult foster care: aged/physical disabilities, adult foster care: adult/developmental disabilities, and residential care: developmental disabilities, which together account for more than four-fifths of all long-term care providers participating in Medicaid.
• The typical long-term care provider is a small, for-profit organization that is not part of a chain, which is located in a metropolitan area. Providers are split almost equally between those serving an older population and people with physical disabilities and a population with developmental disabilities. Other categories make up a small proportion of providers. Over three-quarters of providers require less than 75 hours of training before direct care workers start providing care to consumers. Only nursing facilities required more than 75 hours of training, as stipulated by federal regulations. About a third of adult foster care homes did not employ any direct care workers.
• Long-term care providers served 45,858 current residents or other service users over the last 7 days, with assisted living facilities for aged/physical disabilities, nursing facilities and in-home care agencies serving the largest number of consumers.
• Most service users were white, non-Hispanics, female, and over age 65. About two-fifths of service users used Medicaid as their primary source of payment for services.
• There were 36,685 direct care workers employed by long-term care providers, with the largest employers being nursing facilities, assisted living facilities for aged/ physical disabilities, and in-home care agencies.
• The typical direct care worker was white, non-Hispanic, female, aged 18-44, with a high school education. About two-thirds of direct care workers are employed full time.
Figure 3-1 is the distribution of the estimated 3,819 long-term care providers participating
Medicaid in Oregon, by the type of provider. The three largest categories in terms of the
number of providers are adult foster care for aged/physical disabilities, adult foster care:
adult/developmental disabilities, and residential care: developmental disabilities, which
3-1

Wages, Fringe Benefits, and Turnover for Direct Care Workers Working for Long-Term Care Providers in Oregon
together account for more than four-fifths of all long-term care providers participating in
Medicaid. Table 3-1 presents data on how providers varied by characteristics including type
of ownership, location, types of individuals served, size, and requirements around training
for direct care.
Figure 3-1. Estimated Number of Oregon Long-Term Care Providers Participating in Medicaid, by Provider Type, 2014
Note: unit of analysis is provider. No columns for Adult Day Services, Specialized Living Facilities because there were <30 responses, but they are included in total column. Data on Residential Care Facilities with Contract Rates Residential Care Facilities for Children with Developmental Disabilities, and Supportive Living Services for Individuals with Developmental Disabilities are included in Appendix D.
Source: RTI International analysis of the 2014 Oregon Wage and Fringe Benefit Survey of Long-Term Care (LTC)
Providers.
3-2

Sectio
n 3
— Lan
dscap
e of O
regon Lo
ng-T
erm C
are System
3-3
Table 3-1. Oregon LTC Provider Characteristics, by Provider Type
Characteristics of Providers
Total Providers
Nursing Facility
Residential Care Facilities Adult Foster Care Homes Assisted Living
Facility: Aged/
Physical Disabilities
In-Home Care Agency
Facility: Aged/
Physical Disabilities
Adults/ Developmental
Disabilities
Aged/Physical Disabilities Developmental Disabilities Total % (Number of Providers)
3,819 138 101 765 987 544 433 399 178 63
Direct Care Workers
No Direct Care
Workers
Direct Care Workers
No Direct Care
Workers
Type of Ownership Private, non-profit 34.27 13.68 15.38 84.32 16.40 20.59 17.28 35.77 14.67 6.00 Private, for profit 59.10 81.20 82.05 15.68 75.66 70.59 69.49 50.41 83.33 94.00 Government: federal, state, county or local
6.63 5.13 2.56 0.00 7.94 8.82 13.24 13.82 2.00 0.00
Chain Ownership Part of corporate chain (yes)
33.44 82.05 64.10 52.41 24.21 13.33 14.81 3.73 80.54 60.00
Individual entity (no)
66.56 17.95 35.90 47.59 75.79 86.67 85.19 96.27 19.46 40.00
MSA Metropolitan 79.06 74.36 52.50 75.72 84.97 82.24 86.38 76.17 63.58 61.22 Micropolitan 14.05 14.53 21.25 16.85 11.92 12.15 11.96 14.80 21.19 24.49 Non-Metropolitan/ Non-Micropolitan
6.89 11.11 26.25 7.43 3.11 5.61 1.66 9.03 15.23 14.29
Most Common Disability Among Individuals Served
Frailty, dementia, and physical disabilities
51.20 97.37 96.00 2.23 90.22 84.85 3.89 1.14 99.32 100.00
Intellectual/ developmental disabilities
45.13 1.75 0.00 97.58 3.26 8.08 92.93 97.72 0.68 0.00
Severe mental illness
1.57 0.88 4.00 0.00 2.17 2.02 2.47 0.76 0.00 0.00
(continued)

Wag
es, Fringe B
enefits, an
d T
urn
over fo
r Direct C
are Workers W
orkin
g fo
r Lo
ng-T
erm C
are Provid
ers in O
regon
3-4
Table 3-1. Oregon LTC Provider Characteristics, by Provider Type (continued)
Characteristics of Providers
Total Providers
Nursing Facility
Residential Care Facility Adult Foster Care Homes Assisted Living Facility: Aged/
Physical Disabilities In-Home
Care Agency
Aged/ Physical
Disabilities
Adults/ Developmental
Disabilities
Adults/Physical
Disabilities Developmental
Disabilities Traumatic brain injury
1.93 0.00 0.00 0.19 4.35 4.04 0.71 0.38 0.00 0.00
HIV 0.17 0.00 0.00 0.00 0.00 1.01 0.00 0.00 0.00 0.00 Number of Individuals Served
0-25 87.55 9.32 56.25 98.01 100.00
100.00 99.67 100.00 10.67 12.00
26-50 5.45 37.29 23.75 0.91 0.00 0.00 0.00 0.00 38.67 24.00 51-75 4.13 35.59 13.75 0.72 0.00 0.00 0.00 0.00 31.33 18.00 76-100 1.47 12.71 6.25 0.00 0.00 0.00 0.00 0.00 10.00 12.00 100+ 1.40 5.08 0.00 0.36 0.00 0.00 0.33 0.00 9.33 34.00
Training Required for Direct Care Workers
No formal training
14.26 0.85 11.25 1.31 18.52
46.48 10.21 19.73 5.96 6.00
Less than 75 hours of training
63.41 26.50 73.75 64.35 63.49
40.85 76.76 68.71 77.48 84.00
75 hours of training
8.94 11.97 8.75 14.82 6.88 5.63 4.23 4.08 9.27 6.00
More than 75 hours of training
13.39 60.68 6.25 19.51 11.11
7.04 8.80 7.48 7.28 4.00
Uses Contract Workers to Provide Direct Care
Yes 12.16 42.74 21.25 5.29 12.17
17.14 8.28 11.02 11.33 1.96
No 87.84 57.26 78.75 94.71 87.83
82.86 91.72 88.98 88.67 98.04
Owner, Administrator/ Director or Other Administrative Staff Provides Direct Care
Yes 73.68 17.95 54.43 45.49 91.49
95.10 95.21 87.45 44.00 45.10
No 26.32 82.05 45.57 54.51 8.51 4.90 4.79 12.55 56.00 54.90
Note: unit of analysis is provider. No columns for Adult Day Services and Specialized Living Facilities because there were <30 responses, but they are included in total column. Data on Residential Care Facilities with Contract Rates Residential Care Facilities for Children with Developmental Disabilities, and Supportive Living Services for Individuals with Developmental Disabilities are included in Appendix D. Calculated percentages exclude missing data so percentages within each variable sum to 100%.
Source: RTI International analysis of the 2014 Oregon Wage and Fringe Benefit Survey of Long-Term Care (LTC) Providers.

Section 3 — Landscape Of Oregon Long-Term Care System
3.1.1 Total Long-Term Care Providers
The typical long-term care provider in Oregon is a relatively small, non-chain, for-profit
organization that provides services in a metropolitan area to either the elderly population or
those with intellectual and developmental disabilities. Among total long-term care providers
responding to the survey, the majority of providers in the state (59.10%) reported as
private, for-profit organizations, just over a third (34.27%) of the providers reported as
private, non-profit organizations and few providers (6.63%) reported as government-
owned. Only a third (33.44%) of the providers reported that they are part of a corporate
chain as opposed to operating as an individual entity (66.56%). Over three-quarters of the
providers are located in metropolitan areas (79.06%), which include core urban areas of
50,000 or more population. The remaining providers are located either in micropolitan
(14.05%) areas that are urban areas with 10,000 to 50,000 population, or non-metropolitan
or micropolitan areas (6.89%) (rural areas with less than 10,000 population). About half
(51.20%) of the long-term care providers served primarily individuals with frailty, dementia
and physical disabilities as the most common disability among the individuals served by the
long-term care provider survey respondents, although almost as many other providers
(45.17%) primarily served individuals with intellectual or developmental disabilities. Far
fewer providers primarily served individuals with severe mental illness, traumatic brain
injury, or HIV. Most providers (87.55%) are small and serve 25 or less individuals.
Training requirements for long-term care providers in Oregon are modest, with a large
majority requiring less than 75 hours of formal training, which is less than the federal
government requirement for certified nurse assistants working in nursing homes or home
health aides working for home health agencies. Almost two-thirds (63.41%) of providers
required less than 75 hours or less of formal training (63.41%) by their direct care workers
and almost 15% of providers required no formal training for their direct care staff (14.26%)
before they start serving consumers. Almost 9% (8.94%) of provider respondents reported
that they require exactly 75 hours of training and 13.39% of providers reported they
required more than 75 hours of training for their direct care workers. Relatively few
providers used contract workers for their direct care staff (12.16%), although almost three-
quarters of providers (73.68%) responded that the owner, administrator, or other
administrative staff provided some direct care to the service users.
3.1.2 Nursing Facilities
In 2014, Oregon had approximately 138 nursing facilities participating in the Medicaid
program. For Oregon Medicaid purposes, a nursing facility is an establishment with
permanent facilities, including inpatient beds; that provides medical services, including
nursing services but excluding surgical procedures; and that provides care and treatment
for two or more unrelated residents. The typical nursing facility provider reported that it was
part of a for-profit chain in a metropolitan area that primarily serves people with frailty,
3-5

Wages, Fringe Benefits, and Turnover for Direct Care Workers Working for Long-Term Care Providers in Oregon
dementia, and physical disabilities. The average nursing facility was larger than the typical
Oregon long-term care provider, and direct care workers received more training than the
typical long-term care provider, with administrators or owners less involved in direct care
than in other types of long-term care.
A large majority of nursing facilities (81.20%) reported as private, for-profit entities; only
about one-fifth of facilities are either non-profit or government-owned organizations. In
contrast to other types of long-term care providers in the state, most nursing facilities were
part of a corporate chain (82.05%) rather than a single entity (17.95%). The nursing
facilities were primarily located in metropolitan areas (74.36%), with only about a quarter
of facilities located in micropolitan (14.53%) or rural (11.11%) areas. Almost all (97.37%)
nursing facilities in the state primarily serve individuals with frailty, dementia, and physical
disabilities. Compared to the total makeup of long-term care providers in the state, the size
of the nursing facilities was more variable and tended to be larger. Most nursing facilities
(90.68%) reported that they served than 25 residents. The amount of training required for
direct care workers in nursing facilities was higher than the average long-term care provider
in the state – 60.68% of nursing facilities in the state required more than 75 hours of
training for their direct care workers. However, about a quarter of the nursing facilities
(26.50%) required less than 75 hours of training, which was less than the federal minimum
for certified nurse assistants; 11.97% required exactly 75 hours of training. Close to a half
of nursing facilities (42.74%) used contract workers as part of their direct care staff and
only a small proportion of the owners or administrators (17.95%) provided direct care.
3.1.3 Residential Care Facilities: Aged and Physically Disabled
In 2014, Oregon had approximately 101 residential care facilities for the aged and
individuals who are physically disabled (RCFs-APD). Residential care facilities include
buildings or complexes that consist of shared or individual living units in a homelike setting
where six or more seniors and adult individuals with disabilities may reside. These
residential care facilities offer and coordinate a range of supportive services available on a
24-hour basis to meet the activities of daily living, health, and social needs of the residents.
The typical residential care facility was part of a for-profit chain located in a metropolitan
area serving fewer than 25 residents. The large majority of facilities required direct care
workers to receive less than 75 hours of training prior to starting to serve residents and
about half of the owners or administrators were involved to some extent in direct care of
residents.
The large majority (82.05%) of the facilities were private, for-profit entities. Similar to
nursing facilities in the state, most RCFs-APD (64.10%) were part of a corporate chain. The
locations of the RCFs-APD were slightly more variable than other types of long-term care
providers in the state. Just over half of the RCFs-APD (52.50%) were located in
metropolitan area, while just under a quarter (21.25%) were located in micropolitan areas
3-6

Section 3 — Landscape Of Oregon Long-Term Care System
and another quarter of these types of facilities (26.25%) were located in more rural areas.
Because these providers focus on serving adults with physical disabilities, 96.00% of these
residential care facility respondents reported that they primarily serve individuals with
frailty, dementia, and physical disabilities. The remaining 4.00% reported that they served
individuals with traumatic brain injury. Over half of the RCFs-APD (56.25%) had 25 or fewer
residents, while the remaining 43.75% reported that they have more than 25 residents that
they served. Almost three-quarters of the RCFs-APD (73.75%) required less than 75 hours
of training for their direct care workers and another 11.25% did not require any formal
training for their direct care staff. Only about of fifth (21.25%) of providers in the state
used contract workers as part of their direct care workforce, and over half of the owners or
administrators of these facilities also provided direct care to their residents (54.43%).
3.1.4 Residential Care Facilities: Adults with Developmental Disabilities
In 2014, Oregon had a large number (765) of residential care facilities for adults with
developmental disabilities (RCFs-DD) that participated in Medicaid. For Medicaid purposes,
an RCF-DD is a residential home or small residential home that serves residents with
developmental disabilities. The home consists of shared or individual living units in a
homelike surrounding where six or more adults with developmental disabilities. The typical
facility is a private, nonprofit facility that is part of a corporate chain located in metropolitan
area, with most facilities requiring less than 75 hours of training for direct care workers.
Very few facilities use contract workers, and administrators or owners are often involved in
direct care.
Unlike most other long-term care providers in Oregon, RCF-DDs reported as mostly private,
non-profit entities (84.32%), while the remaining facilities reported as private, for profit
facilities (15.68%). Just over half of these types of facilities were part of a corporate chain
(52.41%), which was slightly less than RCFs-APD. Residential care facilities for adults with
developmental disabilities were primarily located in metropolitan areas (75.72%), with
16.85% located in micropolitan areas. Due to the nature of these residential care providers’
population focus, almost all of these respondents (97.58%) reported that they primarily
care for individuals with intellectual or developmental disabilities. Virtually all (98.01%)
RCFs-DD were small providers, serving 25 or fewer residents. These providers required little
in the way of training of direct care workers as almost two-thirds of these types of providers
(64.35%) required less than 75 hours of formal training for their direct care workers.
However, about a fifth (19.51%) required more than 75 hours of training. Very few (5.29%)
RCFs-DD used contract workers to provide direct care, although almost half of the owners or
administrators of these facilities (45.49%) provided direct care to their residents.
3.1.5 Adult Foster Care Homes: Aged and Physically Disabled
In 2014, approximately 1,531 adult foster homes in Oregon participated in Medicaid. For
Medicaid purposes, an adult foster care home for the aged and individuals with physical
3-7

Wages, Fringe Benefits, and Turnover for Direct Care Workers Working for Long-Term Care Providers in Oregon
disabilities (AFC-APD) include any family home or facility licensed by the Department in
which residential care and services are provided in a home-like environment for
compensation to five or fewer adults who are not related to the provider by blood, marriage,
or adoption. About one-third of AFC-APDs are small enough that they employ no direct care
workers. Although data on providers with and without direct care workers are reported in
Table 2-1, the discussion below relates only to facilities that employed direct care workers,
who are the focus of this report. The typical AFC-APD is a for-profit, non-chain facility in a
metropolitan area providing care primarily to individuals with frailty, dementia, and physical
disabilities. Almost all providers require less than 75 hours of training and almost all owners
or administrators are involved in direct care.
Of total AFCs-APD who served the aged and individuals with physical disabilities and
participate in Medicaid (n=1,531), about two-thirds employed direct care workers and the
rest do not. Of the adult foster care homes who serve aged and individuals with physical
disabilities (AFCs-APD) and employed direct care workers, three-quarters of these providers
(75.66%) were privately owned, for-profit facilities and 16.40% were privately owned, non-
profit facilities. Almost a quarter of AFCs-APD who used direct care workers (24.21%) were
part of a corporate chain. AFCs-APD who used direct care workers were primarily located in
metropolitan areas (84.97%) and 11.92% were located in micropolitan areas. Over 90%
(90.22%) of AFCs-APD who used direct care workers served primarily individuals with
frailty, dementia, and physical disabilities. Fewer than 5% (4.35%) of these providers
reported that they primarily serve individuals with traumatic brain injury. Similar to the
AFCs-APD who do not use direct care workers, 100% of these providers with direct care
workers served 25 or fewer residents. Relatively little training is required of direct care
workers at these facilities. Approximately one-fifth (18.52%) of providers had no training
requirements and almost two-thirds of the AFCs-APD with direct care workers required less
than 75 hours of formal training for their direct care staff. These providers generally did not
use contract workers to provide direct care (87.83%), and the owners or administrators of
the facilities were almost all involved with providing direct care (91.49%).
3.1.6 Adult Foster Care Homes: Adults with Developmental Disabilities
Of the total adult foster care homes who serve adults with developmental disabilities (AFCs-
DD) (n=832) who participate in Medicaid, almost half (47.96%, 399) do not use direct care
workers. Facilities that employ direct care workers and those that do not employ direct care
workers are very similar. For Medicaid purposes, an AFC-DD is any family home or facility in
which residential care is provided in a homelike environment for five or fewer adults with
developmental disabilities who are not related to the provider by blood or marriage. The
typical AFCs-DD is a small, private, for-profit, non-chain organization located in a
metropolitan area serving people with intellectual or developmental disabilities. Very little
formal training is required of direct care workers and the owner or administrators are almost
all involved in direct care.
3-8

Section 3 — Landscape Of Oregon Long-Term Care System
Of the AFCs-DD who did use direct care workers, over two-thirds (69.49%) were privately
owned, for-profit entities and 17.28% were private, non-profit facilities. Similar to other
long-term care providers in the state, they were generally individual entities (85.19%)
rather than chains, and they were also primarily located in metropolitan areas of the state
(86.38%). Over 90% (92.93%) served primarily individuals with intellectual or
developmental disabilities, although almost 4% (3.89%) reported that they primarily served
individuals with frailty, dementia, and physical disabilities. As for other adult foster care
homes, almost all reported that they serve 25 or fewer residents (99.67%). These facilities
required very little training for direct care workers. About one-tenth of facilities required no
formal training and another three-quarters of these facilities with direct care workers
required less than 75 hours of training for their direct care staff. Only a very small
percentage of AFCs-DD (8.32%) used contract workers to provide direct care, and most
owners or administrators of these providers did provide direct care to their residents
(95.21%)
3.1.7 Assisted Living Facility: Aged and Physically Disabled
A total of 178 assisted living facilities for the aged and individuals with physical disabilities
(ALFs) are estimated to participate in Medicaid. Assisted living facilities include buildings or
complexes that consist of fully, self-contained, individual living units where six or more
seniors and adult individuals with disabilities may reside in homelike surroundings. The
assisted living facility offers and coordinates a range of supportive services available on a
24-hour basis to meet the activities of daily living, health, and social needs of the. The
assisted living facilities for ALFs reported similar characteristics to those of the nursing
facilities in the state. The typical ALF is a non-chain, private for-profit facility in a
metropolitan area serving people with frailty, dementia, or physical disabilities. ALFs are
larger than most residential settings. These facilities do not require much training for their
direct care workers; about half of the administrators or owners report that they are involved
in direct care.
The ALFs reported as primarily private ownership, for-profit facilities (83.33%), while
another 14.67% were privately owned, non-profit facilities. Most ALFs were part of a
corporate chain (80.54%). Almost two-thirds of these facilities (63.58%) were located in
metropolitan areas of the state, with another 21.19% located in micropolitan areas. Almost
all of the ALFs (99.32%) reported that the most common disabilities among their residents
were frailty, dementia, or physical disabilities. The ALFs respondents reported varying sizes:
the largest share (38.67%) reported serving 26 to 50 residents, which was similar to
nursing facility sizes (37.29%). Also similar to nursing facilities, 31.33% of ALFs reported
serving 51 to 75 residents where 35.59% of nursing facilities reported serving the same
number of residents. ALFs also reported that 10.67% served 25 or fewer residents, which is
also similar to nursing facility sizes (9.32% reported serving 25 or fewer residents) and in-
home care agencies (12.00% reported serving 25 or fewer residents). Among the ALFs,
3-9
Wages, Fringe Benefits, and Turnover for Direct Care Workers Working for Long-Term Care Providers in Oregon
10.00% reported serving 76 to 100 residents, and 9.33% reported serving 100 or more
residents, which was second to in-home care agencies in the number of individuals served
at that range. Assisted Living Facilities require very little training for their direct care
workers. Over three-quarters of ALFs (77.48%) required less than 75 hours of training for
their direct care workers. However, almost 10% (9.27%) reported they required 75 hours of
training and 7.28% reported they required more than 75 hours of training for their direct
care staff. Only about a tenth (11.33%) of ALFs used contract workers to provide direct
care, and the majority of the owners or administrators of ALFs (56.00%) did not provide
direct care.
3.1.8 In-Home Care Agencies
A total of 63 In-home care agencies are estimated to participate in Medicaid. In-home care
agencies included agencies primarily engaged in providing in-home care services for
compensation to an individual in that individual’s place of residence. These providers do not
include home health agencies. The typical in-home care agency is a chain, for-profit entity
that located in a metropolitan area and provides care primarily to individuals with frailty,
dementia, and physical disabilities. The median agency served more than 76 consumers in
the last week. Training requirements for direct care workers are below that for home health
aides for Medicare and Medicaid certified home health agencies. Agencies rarely use
contract workers and in about half of agencies, the owner or administrators provides some
direct care.
Of those in-home care agency respondents, 94.00% reported that they were privately
owned, for-profit agencies, and the remaining 6.00% reported that they were privately
owned, non-profit agencies. The majority of the in-home care agencies (60.00%) were part
of a corporate chain rather than an individual entity. These providers were more likely
located in metropolitan areas of the state (61.22%), although almost a quarter of in-home
care agency respondents (24.49%) reported their location in micropolitan areas and
14.29% reported their location in more rural areas. All in-home care agencies (100.00%)
reported that they primarily served individuals with frailty, dementia, and physical
disabilities. Over a third of these agencies (34.00%) served more than 100 individuals.
Another quarter (24.00%) reported that they served between 24 and 50 residents. In-home
care agencies required less training of their direct care workers than do Medicare and
Medicaid certified home health agencies. Most of the in-home care agencies (84.00%)
required less than 75 hours of training for their direct care worker staff, although 6.00%
reported that they required 75 hours of training, and 4.00% reported that they required
more than 75 hours of training. Almost no in-home care agencies (1.96%) used contract
workers to provide direct care, and about half of the agencies (45.10%) reported that their
owners or administrators provide direct care.
3-10

Section 3 — Landscape Of Oregon Long-Term Care System
3.2 Characteristics of Long-Term Care Service Users
Figure 3-2 provides an estimate of the number of long-term care service users
(n=45,858), by the type of provider. The three biggest providers in terms of number of
people served were assisted living facilities for the aged and people with physical disabilities
in-home care agencies, and nursing facilities, which account for over half of all service users
being served by long-term care providers participating in Medicaid. Independent providers
participating in Medicaid’s consumer-directed home care program are not included. In the
survey, providers were asked to provide information about people living in the facility as of
midnight the night before if they were residential settings or about people who received
services over the last seven days if they provided nonresidential services. The provider
respondents reported their service users’ ethnicity, race, gender, age, and the service user’s
primary payer for the services received from the provider. Table 3-2 presents detailed
information on the characteristics long-term care service users
Figure 3-2. Long-Term Care Service Users, by Provider Type in Oregon, 2014
Note: Unit of analysis is service users. Note: No columns for Adult Day Services, Specialized Living Facilities because there were <30 responses, but they are included in total column. Data on Residential Care Facilities with Contract Rates Residential Care Facilities for Children with Developmental Disabilities, and Supportive Living Services for Individuals with Developmental Disabilities are included in Appendix D. Calculated percentages exclude missing data so percentages within each variable sum to 100%.
Source: RTI International analysis of the 2014 Oregon Wage and Fringe Benefit Survey of Long-Term Care (LTC) Providers.
3-11

3-1
2
Wag
es, Fringe B
enefits, an
d T
urn
over fo
r Direct C
are Workers W
orkin
g fo
r Lo
ng-T
erm C
are Provid
ers in O
regon
Table 3-2. Service User Characteristics, by Provider Type
Characteristics of Service Users
Total Service Users
Nursing Facility
Residential Care Facilities Adult Foster Care Homes Assisted Living
Facility: Aged/Physical
Disabilities Facility: Aged/Physical
Disabilities Adults/ Developmental
Disabilities
Aged/Physical Disabilities Developmental
Disabilities
Total % (Number of Service Users)
45,858 7,603 3,029 4,086 3,852 1,644 1,816 862 9,977
Direct Care Workers
No Direct Care
Workers
Direct Care Workers
No Direct Care
Workers
Ethnicity
Hispanic/Latino 7.82 12.31 12.25 2.34 9.85 16.14 1.20 15.59 10.96
Not Hispanic/Latino
92.18 87.69 87.75 97.66 90.15 83.86 98.80 84.41 89.04
Race
American Indian or Alaska Native
1.94 4.09 1.70 1.00 1.68 1.21 0.24 2.44 1.77
Asian 2.66 4.92 3.39 0.50 2.37 4.80 0.10 0.94 2.07
Black or African American
2.80 7.06 2.48 1.65 2.25 3.38 0.36 3.80 1.84
Native Hawaiian or Other Pacific Islander
1.78 3.59 1.27 0.83 0.72 1.71 0.04 0.79 1.63
White 81.56 70.75 88.87 94.93 91.70 86.17 98.90 86.80 87.40
Other 9.26 9.59 2.29 1.10 1.28 2.72 0.36 5.22 5.29
Sex
Male 36.14 39.91 35.02 54.80 34.60 40.52 36.44 50.53 28.56
Female 63.86 60.09 64.98 45.20 65.40 59.48 63.56 49.47 71.44
(continued)

Sectio
n 3
— Lan
dscap
e of O
regon Lo
ng-T
erm C
are System
3-1
3
Table 3-2. Weighted Service Users Characteristics by LTC Provider Type in Oregon (continued)
Characteristics of Service Users
Total Service Users
Nursing Facility
Residential Care Facilities Adult Foster Care Homes Assisted Living
Facility: Aged/Physical
Disabilities Facility: Aged/Physical
Disabilities
Adults/ Developmental
Disabilities
Adults/Physical Disabilities Developmental Disabilities
Age of Individuals Served
17 Years or Younger
2.60 0.87 0.65 1.48 0.40 0.02 0.11 0.98 2.15
18-65 24.94 16.95 9.75 75.88 19.26 18.73 99.00 90.18 6.22
65-74 17.20 21.61 16.09 12.03 17.22 21.65 0.65 6.41 13.97
75-84 23.41 27.89 30.49 5.84 24.46 27.84 0.18 1.45 30.26
85+ 31.85 32.67 43.01 4.77 38.67 31.76 0.07 0.98 47.40
Primary Payer for Services Received by Provider
Medicaid 43.15 57.64 36.10 50.48 42.82 43.55 7.41 67.90 34.64
Private Pay 21.09 11.58 43.56 4.89 34.38 29.51 0.17 0.89 54.07
Other Payer 35.76 30.78 20.34 44.62 22.80 26.94 92.42 31.21 11.29
Note: Unit of analysis is service users. No columns for Adult Day Services and Specialized Living Facilities because there were <30 responses, but they are included in total column. Data on Residential Care Facilities with Contract Rates Residential Care Facilities for Children with Developmental Disabilities, and Supportive Living Services for Individuals with Developmental Disabilities are included in Appendix D. Calculated percentages exclude missing data so percentages within each variable sum to 100%.
Source: RTI International analysis of the 2014 Oregon Wage and Fringe Benefit Survey of Long-Term Care (LTC) Providers

Wages, Fringe Benefits, and Turnover for Direct Care Workers Working for Long-Term Care Providers in Oregon
3.2.1 Total Long-Term Care Service Users
The typical long-term care service user from service providers participating in the Oregon
Medicaid program was a non-Hispanic white female who used Medicaid to pay for their long-
term care services. Of the reported total long-term care service users, over 90% (92.18%)
were non-Hispanic/Latino and 81.56% were white. Almost two-thirds (63.86%) of the long-
term care service users were female. The age range of service users varied more than other
characteristics. Almost three-quarters (72.46%) were age 65 or older: 17.20% were
between the age of 65 to 74 years, 23.41% were between the ages of 75 and 84 years, and
31.85% were 85 years or older. Another quarter (24.94%) were working-age adults
(between 18 and 64 years of age). Medicaid was the source of payment for the largest
share of service users (43.15%), with another third (35.76%) using “other payer” (e.g.,
Medicare, VA, and other government programs) for their service use and the remaining fifth
(21.09%) were private pay.
3.2.2 Nursing Facilities
Nursing facilities reported 7,603 nursing facility service users in Oregon. The average
nursing facility resident had similar characteristics to long-term care service users overall –
primarily non-Hispanic, white, female and used Medicaid as the primary payer for services.
Over 85% (87.69%) of nursing facility residents were non-Hispanic/Latino, and 70.75%
were reported as white. Just under two-thirds (60.09%) of nursing facility residents were
female and most (82.17%) were age 65 and older, with almost a third (32.67%) were age
85 or older. The majority (57.64%) of nursing facility residents had Medicaid as their
primary payer for services used, with another almost third (30.78%) reporting using other
payers for the services provided.
3.2.3 Residential Care Facilities: Aged and Physically Disabled
Residential care facilities for the aged or individuals physically disabled (RCFs-APD) reported
3,029 residents. Similar to long-term care users overall, RCFs-APD residents were non-
Hispanic, white, and female. Residents were mostly elderly and the plurality of residents
were private pay. The vast majority of residents of RCFs-APD were non-Hispanic/Latino
(87.75%) and white (88.87%). Just under two-thirds (64.98%) of these residents were
female. Most RCF-APD residents (89.59%) were age 65 or older, with 43.01% age 85 years
or older. Over 40% (43.56%) of RCF-APD residents were private pay and another third
(36.10%) used Medicaid as their primary payer.
3.2.4 Residential Care Facilities: Adults with Developmental Disabilities
Residential care facilities for adults with developmental disabilities (RCFs-DD) reported
4,086 residents. Most residents were non-Hispanic, white, and age 18 to 65. Almost all
(97.66%) residents of RCFs-DD were reported as non-Hispanic/Latino and 94.93% were
3-14

Section 3 — Landscape Of Oregon Long-Term Care System
reported as white. Unlike long-term care users overall, the majority of RCF-DD residents
were male (54.80%). Three-quarters (75.88%) were working-age adults (age 18 to 65),
with only 22.64% age 65 or older. Half (50.48%) of the residents used Medicaid as their
primary payer for services, and another 44.62% reported using other payers to pay for
services received.
3.2.5 Adult Foster Care Homes: Aged and Physically Disabled
Adult foster care homes for the aged and individuals with physical disabilities (AFCs-APD)
reported 5,496 residents. As discussed previously, about one-third of AFC-APD do not
employ direct care workers. The data discussed here relates only to service users of
facilities that employed direct care workers (n=3,852), who are the focus of this report.
Most residents of an AFC-APD that used direct care workers were non-Hispanic, white, and
female. They were also likely to be age 65 or older and to use Medicaid as their primary
payer for services. Most residents of AFCs-APD were reported as non-Hispanic/Latino
(90.15%) and white (91.70%). Over two-thirds (65.40%) of residents of AFCs-APD were
female and generally (80.35%) aged 65 and older, with 38.67% of residents reported as 85
or older. The largest share of residents (42.82%) used Medicaid as their primary payer, and
another third (34.38%) reported as using private pay.
3.2.6 Adult Foster Care Homes: Adults with Developmental Disabilities
Adult foster care home for adults with developmental disabilities (AFCs-DD) reported 2,678
residents. Of these facilities, almost a third of residents (32.19%, 862) were residents of
AFCs-DD that did not use direct care workers. However, this section will focus on residents
of AFCs-DD that did use direct care workers (n=1,816).
Most residents of AFC-DD with direct care workers were non-Hispanic, white, female, age 18
to 64 years, and relied on “other payers” to pay for the AFC-DD services. Almost all
(98.80%) of the AFC-DD residents were reported as non-Hispanic/Latino, and similarly,
almost all (98.90%) were reported as white. Almost two-thirds (63.56%) of these residents
were female and almost all (99.00%) were aged 18 to 64 years old. Most (92.42%) of the
residents of AFCs-DD used other payers to pay for services received.
3.2.7 Assisted Living Facilities: Aged and Physically Disabled
Assisted living facilities for the aged and individuals with physical disabilities (ALFs) had the
largest share of total long-term care users (n=9,977). Most ALF residents were non-
Hispanic, white, and female. Residents were nearly all age 65 or older and a majority were
private pay. Almost 90% (89.04%) of ALF residents were non-Hispanic/Latino, and 87.40%
of residents were white. Almost three-quarters (71.44%) were female. ALF residents were
primarily (91.63%) age 65 and older, with more than half of these (47.40%) age 85 and
3-15

Wages, Fringe Benefits, and Turnover for Direct Care Workers Working for Long-Term Care Providers in Oregon
older. The majority (54.07%) of ALF residents were private pay for the services received,
and about a third (34.64%) used Medicaid to pay for services.
3.2.8 In-Home Care Agencies
In-Home Care Agencies reported 7,232 service users over the past 7 days. Most In-Home
Care Agency service users were non-Hispanic, white, and female. Most consumers were age
65 or older and about half were private pay. Over 90% (93.53 %) of the in-home care
agency users were non-Hispanic/Latino and 79.04% were white. Two-thirds (66.40%) of in-
home care agency services users were female. Over three-quarters (78.07%) of these
service users were age 65 or older, with the largest share (33.59%) age 85 or older. Almost
half (48.33%) used “other payers” as their payment source for services received, and
35.65% reported used Medicaid to pay for their services.
3.3 Characteristics of Long-Term Care Direct Care Workers
Figure 3-3 provides an overview of the characteristics of the estimated 36,685 long-term
care direct care workers employed by long-term care providers participating in Medicaid as
well as by each type of long-term care provider. Providers supplied information on the
ethnicity, race, gender, age, education level, and full-time versus part-time status of direct
care workers. Table 3-3 presents detailed information on the characteristics of direct care
workers.
Figure 3-3. Number of Direct Care Workers, by LTC Provider Type, 2014
Note: Unit of analysis is direct care worker. No columns for Adult Day Services and Specialized Living Facilities because there were <30 responses, but they are included in total column. Data on Residential Care Facilities with Contract Rates Residential Care Facilities for Children with Developmental Disabilities, and Supportive Living Services for Individuals with Developmental Disabilities are included in Appendix D.
Source: RTI International analysis of the 2014 Oregon Wage and Fringe Benefit Survey of Long-Term Care (LTC) Providers.
3-16

Sectio
n 3
— Lan
dscap
e of O
regon Lo
ng-T
erm C
are System
3-1
7
Table 3-3. Characteristics of Direct Care Workers, by Provider Type
Characteristics of Direct Care
Workers
Total Direct Care
Workers Nursing Facility
Residential Care Facilities Adult Foster Care Homes Assisted Living
Facility: Aged/
Physical Disabilities
In-Home Care
Agency
Facility: Aged/Physical
Disabilities
Adults/ Developmental
Disabilities Aged/Physical
Disabilities Developmental
Disabilities
Total Number of Direct Care Workers
36,685 7,837 1,810 7,679 4,727 1,426 4,640 4,719
Ethnicity
Hispanic/Latino 18.38 17.05 24.98 11.07 41.30 36.16 16.03 24.97
Not Hispanic/Latino
81.62 82.95 75.02 88.93 58.70 63.84 83.97 75.03
Race
American Indian or Alaska Native
3.69 1.81 4.07 1.76 3.58 7.00 1.73 7.46
Asian 5.30 5.92 7.62 1.39 11.42 8.24 4.21 8.14
Black or African American
6.49 7.12 7.76 2.46 3.75 19.57 3.70 9.38
Native Hawaiian or Other Pacific Islander
4.94 3.21 5.35 2.14 2.07 7.29 7.39 7.71
White 66.60 70.98 60.04 74.20 70.95 45.63 67.24 56.52
Other 12.99 10.97 15.16 18.05 8.25 12.27 15.72 10.78
Sex
Male 19.17 18.40 13.06 32.17 9.69 43.81 17.68 11.56
Female 80.83 81.60 86.94 67.83 90.31 56.19 82.32 88.44
(continued)

Wag
es, Fringe B
enefits, an
d T
urn
over fo
r Direct C
are Workers W
orkin
g fo
r Lo
ng-T
erm C
are Provid
ers in O
regon
3-1
8
Table 3-3. Characteristics of Direct Care Workers, by Provider Type (continued)
Characteristics of Direct Care
Workers
Total Direct Care
Workers Nursing Facility
Residential Care Facilities Adult Foster Care Homes Assisted Living
Facility: Aged/
Physical Disabilities
In-Home Care
Agency
Facility: Aged/Physical
Disabilities
Adults/ Developmental
Disabilities Aged/Physical
Disabilities Developmental
Disabilities
Age of Direct Care Workers
17 years or younger
1.17 1.87 2.01 0.08 0.47 9.90 3.03 0.45
18-44 years 65.10 63.70 75.93 76.71 68.93 58.21 65.29 55.99
45-64 years 29.77 30.03 19.03 21.20 27.76 20.95 28.28 38.56
65 years or older
3.96 4.40 3.04 2.02 2.83 10.94 3.39 5.00
Education of Direct Care Workers
Less than high school graduate
6.83 5.98 7.55 0.51 3.90 8.26 8.96 10.96
High school graduate or GED
59.72 48.25 60.29 93.37 36.24 36.11 35.21 57.66
Some college 13.70 13.98 16.48 4.01 47.29 24.39 26.63 12.87
Associate’s degree
8.65 17.19 5.24 0.78 6.11 12.00 8.96 7.87
Bachelor’s degree
6.92 8.70 6.15 1.02 5.34 11.77 13.08 6.00
Post graduate degree
4.18 5.91 4.27 0.32 1.13 7.59 7.16 4.64
(continued)

Sectio
n 3
— Lan
dscap
e of O
regon Lo
ng-T
erm C
are System
3-1
9
Table 3-3. Characteristics of Direct Care Workers, by Provider Type (continued)
Characteristics of Direct Care
Workers
Total Direct Care
Workers Nursing Facility
Residential Care Facilities Adult Foster Care Homes Assisted Living
Facility: Aged/
Physical Disabilities
In-Home Care
Agency
Facility: Aged/Physical
Disabilities
Adults/ Developmental
Disabilities Aged/Physical
Disabilities Developmental
Disabilities
Full-Time vs Part-Time Status Currently
Full-time 65.92 78.12 66.04 75.52 46.10 56.78 74.80 31.84
Part-time 34.06 21.88 33.96 24.48 53.66 43.12 25.20 68.16
Full-Time vs Part-Time Status Ever Employed Between January 1, 2014 and Survey Completion
Full-time 64.25 76.87 64.86 72.60 45.74 52.46 69.93 34.57
Part-time 35.75 23.13 35.14 27.40 54.26 47.54 30.07 65.43
Note: Unit of analysis is service users. No columns for Adult Day Services and Specialized Living Facilities because there were <30 responses, but they are included in total column. Data on Residential Care Facilities with Contract Rates Residential Care Facilities for Children with Developmental Disabilities, and Supportive Living Services for Individuals with Developmental Disabilities are included in Appendix D. Calculated percentages exclude missing data so percentages within each variable sum to 100%.
Source: RTI International analysis of the 2014 Oregon Wage and Fringe Benefit Survey of Long-Term Care (LTC) Providers.

Wages, Fringe Benefits, and Turnover for Direct Care Workers Working for Long-Term Care Providers in Oregon
3.3.1 Total Long-Term Care Direct Care Workers
In 2014, there were 36,685 full- and part-time direct care workers employed by long-term
care providers in Oregon. The typical long-term care direct care worker in Oregon was a
non-Hispanic, white, female who was 18 to 44 years of age. Most direct care workers had at
least a high school level of education and worked full time. Nursing facilities reported the
largest share of direct care workers in the state (n=7,837), although residential care
facilities for adults with developmental disabilities reported almost as many direct care
workers (n=7,679). In descending order of number of direct care workers, are nursing
facilities (n=7,837), residential care facilities for adults with developmental disabilities
(n=7,679), adult foster care homes for the aged and individuals with physical disabilities
(n=4,727), in-home care agencies (n=4,719), assisted living facilities for the aged and
individuals with physical disabilities (n=4,640), residential care facilities for the aged and
individuals with physical disabilities (n=1,810), and adult foster care homes for adults with
developmental disabilities (n=1,426).
Of the total number of direct care workers employed by long-term care providers, 83.97%
were reported as non-Hispanic/Latino and 66.60% were reported as white. Just over 80%
(80.83%) of the direct care workers overall were reported as female. Almost two-thirds
(65.10%) were reported as aged 18 to 44 years, with another 30% (29.77%) age 45 to 64.
The majority (59.72%) of direct care workers in the state had a high school level of
education, with 8.65% reported as having an associate’s degree and 11.10% reported as
having a bachelor’s degree or higher. Almost two-thirds (65.92%) of the direct care workers
were reported to currently work full time. The analysis also accounted for the total direct
care workers that were ever employed by the providers on a full-time or part-time basis to
determine whether these results were different than the responses to the number of current
direct care workers. Because both of these responses were virtually the same for each
provider, only the results from information on direct care workers who were currently
working are reported in this section.
3.3.2 Nursing Facilities
Nursing facilities reported 7,837 direct care workers in Oregon. The average nursing facility
direct care worker had similar characteristics to long-term care direct care workers overall –
primarily non-Hispanic, white, female who was most likely to have a high school level of
education and worked full-time. Over 80% (82.95%) of nursing facility direct care workers
were non-Hispanic/Latino, and 70.98% were white. Most (81.60%) of the nursing facility
direct care workers were female, and almost two-thirds (63.70%) were aged 18 to 44 years
and another third (30.03%) were aged 45 to 64 years. The largest share (48.25%) of
nursing facility direct care workers had a high school level education, with another 13.98%
having had some college level education and 17.19% having an associate’s degree. Over
three-quarters (78.12%) worked full time.
3-20

Section 3 — Landscape Of Oregon Long-Term Care System
3.3.3 Residential Care Facilities: Aged and Physically Disabled
Residential care facilities for the aged or individuals with physical disabilities (RCFs-APD)
reported 1,810 direct care workers. RCFs-APD direct care workers were primarily non-
Hispanic, white, and female. Most direct care workers were between the ages of 18 and 44
years old, had a high school level of education, and worked full time. Over three-quarters
(75.02%) of direct care workers for RCFs-APD were non-Hispanic/Latino and 60.04% were
white. The vast majority (86.94%) of direct care workers for RCFs-APD are female and just
over three-quarters (75.93%) are between the ages of 18 and 44. The majority of direct
care workers (60.29%) had high school level of education, with another 16.48% having
some college education. Two-thirds (66.04%) of RCF-APD direct care workers worked full
time.
3.3.4 Residential Care Facilities: Adults with Developmental Disabilities
Residential care facilities for adults with developmental disabilities reported 7,679 direct
care workers. Most direct care worker for residential care facilities for adults with
developmental disabilities (RCF-DD) are non-Hispanic, white, female, between the ages of
18 to 44, and had a high school level of education. Most (88.93%) direct care workers for
RCFs-DD were reported as non-Hispanic/Latino and three-quarters (74.20%) were reported
as white. Over two-thirds (67.83%) are female and three-quarters (76.71%) are between
the ages of 18 and 44. Almost all (93.37%) direct care workers for RCFs-DD had a high
school level of education, and three quarters (75.52%) worked full time.
3.3.5 Adult Foster Care Homes: Aged and Physically Disabled
Adult foster care homes for the aged and physically disabled (AFCs-APD) reported 4,727
direct care workers. Most direct care workers for AFCs-APD are non-Hispanic, white, and
female. They were also more likely to be between the ages of 18 and 44 years and to be
especially well educated, but were much less likely to work full time. The majority (58.70%)
of AFC-APD direct care workers are non-Hispanic/Latino and 70.95% are white, with
another 11.422% reports as Asian. Over 90% (90.31) are female and two-thirds (68.93%)
are between the ages of 18 and 44. Unlike direct care workers for other long-term care
providers in the state, a large share (47.29%) of AFC-APD workers had some college
education, while 36.24% were reported to have a high school level of education. Also unlike
most other long-term care direct care workers, a minority (46.10%) of AFC-APD direct care
workers work full time.
3.3.6 Adult Foster Care Homes: Adults with Developmental Disabilities
Adult foster care home for adults with developmental disabilities (AFCs-DD) reported 1,426
direct care workers. Most direct care workers for an AFC-DD were non-Hispanic, white,
female, age 18 to 44 years old. Direct care workers had higher levels of education than
most other direct care workers and about half worked full time. Almost two-thirds (63.84%)
3-21

Wages, Fringe Benefits, and Turnover for Direct Care Workers Working for Long-Term Care Providers in Oregon
of AFC-DD direct care workers are non-Hispanic/Latino. The largest share (45.63%) of AFC-
DD direct care workers are white, with another 20% (19.57%) Black or African-American.
Unlike other long-term care providers in Oregon, a substantial portion of direct care workers
are male. Although a majority (56.19%) of direct care workers for AFCs-DD are female,
male constituted almost half (43.81%) of direct care workers. The majority (58.21%) of
direct care workers for AFCs-DD are between the ages of 18 and 44. Just over 10%
(10.94%) AFC-DD direct care workers were reported as age 65 or older, which was the
largest share reported for this age range among all long-term care direct care workers in
Oregon. There was also much more variation reported among the different education levels
of direct care workers for AFCs-DD. Just over a thirds (36.11%) had a high school level of
education, with another quarter (24.39%) having some college education. Twelve percent
(12.00%) were reported to have an Associate’s degree and another 20% (19.36%) had a
bachelor’s degree or higher. The majority (56.78%) of AFC-DD direct care workers worked
full time, less than most direct care workers employed by other providers.
3.3.7 Assisted Living Facilities: Aged and Physically Disabled
Assisted living facilities for the aged and individuals with physical disabilities (ALFs) reported
4,640 direct care workers. Most ALF direct care workers were non-Hispanic, white, female,
and between the ages of 18 and 44 years. Compared to those working for other long-term
care providers in Oregon, direct care workers in ALFs are quite well educated, with over half
with more than a high-school education; a large majority work full time. Most (83.97%) ALF
direct care workers are non-Hispanic/Latino, and just over two-thirds (67.24%) are white.
Over 80% (82.32%) were female and just under two-thirds (65.29%) were age 18 to 44
years. The largest share (35.21%) of ALF direct care workers graduated from high school
level or have a GED, with another quarter (26.63%) have some college education and over
20% (20.24%) have a bachelor’s degree or higher. Almost three quarters (74.80%) were
reported to work full time.
3.3.8 In-Home Care Agencies
In-home care agency services reported 4,719 direct care workers. Most in-home care
agency direct care workers are non-Hispanic, white, female and between the ages of 18 and
44. Three quarters (75.03 %) of the in-home care agency direct care workers are non-
Hispanic/Latino and 56.52% are white. Almost 90% (88.44%) of in-home care agency
direct care workers were female. The majority (55.99%) of these direct care workers were
between the ages of 18 and 44 years with another 38.56% reported as between 45 and 64
years. The majority (57.66%) of in-home care agencies have a high school level of
education. Unlike all other long-term care direct care workers in the state, most in-home
care agency direct care workers work part-time (68.16%), with only 31.86% working full
time.
3-22

4. WAGES PROVIDED TO DIRECT CARE WORKERS EMPLOYED BY LONG-TERM CARE PROVIDERS
4.1 Current Wages for Long-Term Care Direct Care Workers
Chapter 4 presents data on the wages of direct care workers. Highlights Box 2
summarizes the main findings from this chapter. Figures 4-1 and 4-2 present mean and
median wages for direct care workers, weighted by the number of long-term care providers
and by the number of direct care workers, by provider type. Results are lower when
weighted by the number of direct care workers than when weighted by long-term care
providers.
Highlights Box 2: Wages Provided to Direct Care Workers Employed by Long-Term Care workers in Oregon
• Providers reported that the most important factors that they considered when setting wages for direct care workers were: the legally required minimum wage, the education and experience of individual workers, and the wages of other long-term care providers. The Medicaid rate was cited as a factor by about a third of long-term care providers, and was especially important for nursing facilities and in-home care agencies.
• Weighted by providers, the mean (average) wage per hour for direct care workers was $12.38 and the median was $11.15. There was not much variation by provider type, except that nursing facilities and adult foster care facilities for aged/physically disabled paid higher salaries.
• Mean and median salaries were lower when weighted by the number of direct care workers employed by each provider. Weighted by direct care workers, the mean (average) wage per hour for direct care workers was $11.10 and the median was $10.51. There was not much variation by provider type, except that nursing facilities and adult foster care facilities for aged/physically disabled paid higher salaries.
• Over the period 2003 to 2014, wages for providers in operation in 2014 increased, although less than 2003 wages adjusted for inflation. For example, weighted by the number of direct care workers, average wages increased from $9.21 in 2003 to $11.20 in 2014; inflation-adjusted 2003 wages would be $12.07 in 2014.
• In a multivariate analysis of the wages, the following variables were statistically significant predictors of higher wages: nursing facility, adult foster care for aged/physical disabilities (compared to supported living for people with developmental disabilities, nonprofit and for-profit ownership (compared to government facilities), proportion of direct care workers who are Hispanic/ Latino, number of service users, and 75 or more hours of required training. Statistically significant predictors of lower wages included: proportion of direct care workers who are minority, proportion of service users who have their care paid primarily by Medicaid, and micropolitan location.
• Although there is variation across provider types, Medicaid payment rates to providers serving older people and younger persons with physical disabilities generally increased faster than direct care payment rates. For example, the Medicaid payment rate for nursing facilities increased by 88% increase between 2003 and 2014, which was over three times faster than the reported direct care worker wage increase. Overall, Medicaid payment rates increased at a slower rate from 2009 to 2014 and were more comparable to increases in wages by direct care workers. Data is not available to conduct a comparable analysis of payment rates for providers of services to people with developmental disabilities.
4-1

Wages, Fringe Benefits, and Turnover for Direct Care Workers Working for Long-Term Care Providers in Oregon
Figure 4-1. Mean and Median Wages for Direct Care Workers, by Provider Type, 2014 (Averaged Across Direct Care Workers)
Note: Unit of analysis is direct care worker. No columns for Adult Day Services and Specialized Living Facilities because there were <30 responses, but they are included in total column. Data on Residential Care Facilities with Contract Rates Residential Care Facilities for Children with Developmental Disabilities, and Supportive Living Services for Individuals with Developmental Disabilities are included in Appendix D.
Source: RTI International analysis of the 2014 Oregon Wage and Fringe Benefit Survey of Long-Term Care (LTC) Providers.
4-2
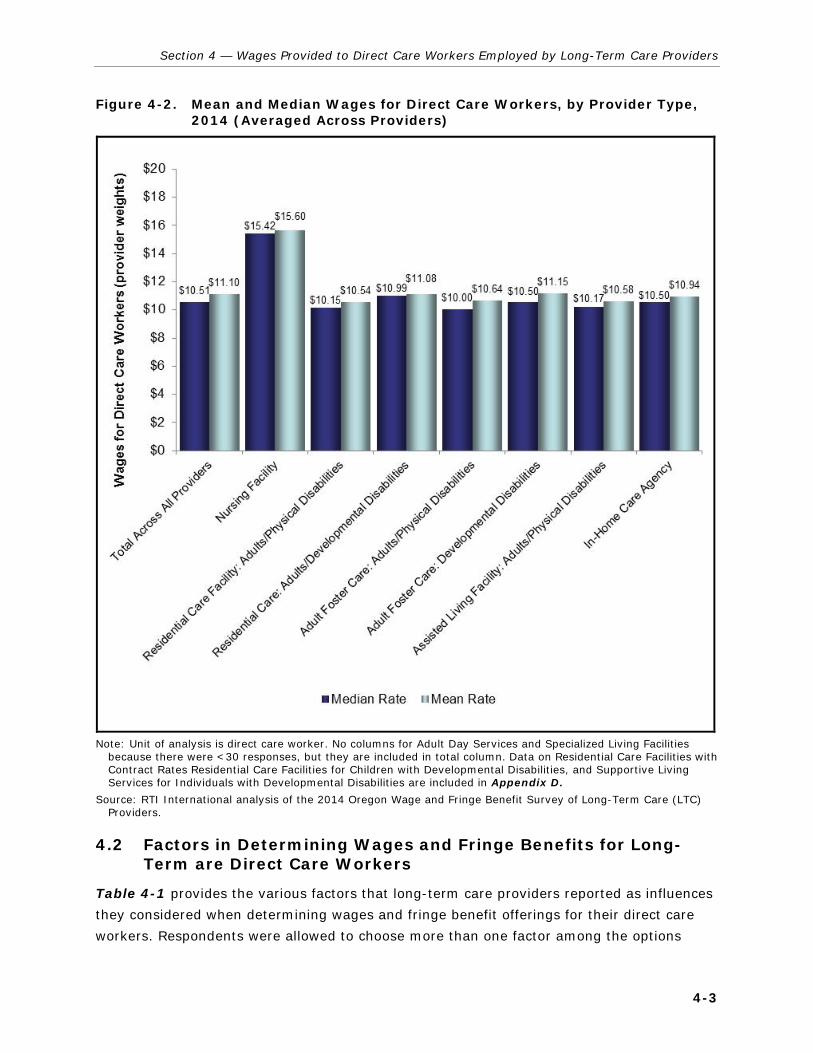
Section 4 — Wages Provided to Direct Care Workers Employed by Long-Term Care Providers
Figure 4-2. Mean and Median Wages for Direct Care Workers, by Provider Type, 2014 (Averaged Across Providers)
Note: Unit of analysis is direct care worker. No columns for Adult Day Services and Specialized Living Facilities because there were <30 responses, but they are included in total column. Data on Residential Care Facilities with Contract Rates Residential Care Facilities for Children with Developmental Disabilities, and Supportive Living Services for Individuals with Developmental Disabilities are included in Appendix D.
Source: RTI International analysis of the 2014 Oregon Wage and Fringe Benefit Survey of Long-Term Care (LTC) Providers.
4.2 Factors in Determining Wages and Fringe Benefits for Long-Term are Direct Care Workers
Table 4-1 provides the various factors that long-term care providers reported as influences
they considered when determining wages and fringe benefit offerings for their direct care
workers. Respondents were allowed to choose more than one factor among the options
4-3

Wages, Fringe Benefits, and Turnover for Direct Care Workers Working for Long-Term Care Providers in Oregon
provided in the survey. The types of factors that the respondents considered included the
role of unions or other collective bargaining processes, the Medicaid payment rates to the
provider, the proportion of private-pay service users for that provider, the level of charitable
donations to the provider organization, the local unemployment rate, the legally required
minimum wage, the profitability of the provider, the relative wages of other long-term care
providers, the wages offered to employees of fast food companies, and the education and
experience of the individual direct care worker.
4.2.1 Total Long-Term Care Providers
For long-term care providers as a whole, the most often cited factors that providers consider
include the legally required minimum wage and the education and experience of the
individual direct care worker. Almost two-thirds (61.98%) of the providers said that they
consider the legally required minimum wage and another 56.63% reported that they
consider the education and experience of the individual direct care worker when determining
the wages and fringe benefit offerings to their direct care workers. Almost half (46.42%) of
providers reported that they consider what wages other long-term care providers are
offering their direct care workers and another third (31.95%) reported that they consider
their Medicaid payment rates for services provided. A quarter (26.98%) of providers
reported that they consider their profitability. Factors that were considered much less
among the long-term care provider respondents included the local unemployment rate
(9.31%), the proportion of private-pay service users (8.63%), the wages of fast food
company employees (4.71%), or the level of charitable donations made to the provider
organizations (4.39%).. Few providers (7.23%) reported that they considered unions or
other collective bargaining processes.
4-4

Sectio
n 4
— W
ages Pro
vided
to D
irect Care W
orkers E
mplo
yed b
y Long-T
erm C
are Provid
ers
4-5
Table 4-1. Weighted Factors in Determining Wages and Fringe Benefits for Direct Care Workers by LTC Provider Type in Oregon
Wage and Benefit Determining Factors
Total Providers
Nursing Facility
Residential Care Facilities Adult Foster Care Homes Assisted Living Facility: Aged/
Physical Disabilities
In-Home Care
Agency
Facility: Aged/ Physical
Disabilities
Adults/ Developmental
Disabilities
Aged/ Physical
Disabilities Developmental
Disabilities
Total Number of Providers 2,867 138 101 765 987 433 178 63 Role of Unions in Determining Wages and Benefits
Provider Determined 92.77 72.12 100.00 88.99 94.59 94.93 99.33 90.20 Collective Bargaining 7.23 27.88 0.00 11.01 5.41 5.07 0.67 9.80
Factors Taken into Account When Determining Wages and Fringe Benefits
Medicaid Rate 31.95 52.54 23.75 37.97 26.29 23.51 18.54 65.38
Proportion of Private-Pay Individuals Served by Provider
8.63 5.93 18.75 2.89 12.37 3.97 12.58 21.15
Level of Charitable Donations to Organization
4.39 2.54 2.50 11.75 0.00 0.66 0.00 0.00
Local Unemployment Rate 9.31 16.10 6.25 15.91 4.12 7.95 3.31 9.62 Legally Required Minimum Wage
61.98 64.41 62.50 72.33 55.67 53.64 63.58 57.69
Profitability of Provider 26.98 31.36 28.75 35.44 19.07 19.54 26.49 48.08 Wages of other Long-Term Services and Supports Providers
46.42 77.97 50.00 70.71 22.16 29.47 58.94 59.62
Wages of Fast Food Companies 4.71 9.32 0.00 12.30 0.52 0.66 2.65 7.69 Education and Experience of Individual Workers
56.63 86.44 77.50 37.43 56.70 61.92 78.15 75.00
Note: Unit of analysis is provider. No columns for Adult Day Services and Specialized Living Facilities because there were <30 responses, but they are included in total column. Respondents were given the option to “mark all that apply” for questions related to the factors taken into account when determining wages and fringe benefits. Therefore, numbers do not sum to 100%. Data on Residential Care Facilities with Contract Rates Residential Care Facilities for Children with Developmental Disabilities, and Supportive Living Services for Individuals with Developmental Disabilities are included in Appendix D.
Source: RTI International analysis of the 2014 Oregon Wage and Fringe Benefit Survey of Long-Term Care (LTC) Providers.

Wages, Fringe Benefits, and Turnover for Direct Care Workers Working for Long-Term Care Providers in Oregon
4.2.2 Nursing Facilities
The most commonly cited factors that nursing facility providers reported as considering
when determining wage and fringe benefits for the direct care workers included the
education and experience of the individual direct care worker, the wages offered by other
long-term care providers, and the legally required minimum wage. Unlike other long-term
care providers, just over a quarter (27.88%) of nursing facility provider respondents
reported that they used collective bargaining processes when determining wage and fringe
benefit offerings to their direct care workers. The most commonly cited factor that nursing
facility providers reported that they considered was the education and experience of the
individual direct care worker (86.44%). Over three-quarters of providers (77.97%) reported
that they consider the wages that other long-term care providers offer, and another two-
thirds (64.41%) said that they also account for the legally required minimum wage. More
than half (54.54%) of nursing facility providers reported that they considered their Medicaid
payment rate, and just under a third (31.36%) reported that they considered their
profitability. About a tenth (9.32%) of nursing facilities reported that they considered the
wages of fast food restaurants.
4.2.3 Residential Care Facilities: Aged and Physically Disabled
Residential care facilities for the aged and individuals with physical disabilities (RCFs-APD)
reported that they most often considered the education and experience of the individuals
direct care worker when determining wages and fringe benefits. In 2014, all (100.00%) of
the RCFs-APD respondents reported that they did not use collective bargaining processes
when determining the wage and fringe benefit offerings for their direct care workers. Similar
to nursing facility provider respondents, the most often-cited factor (77.50%) was the
education and experience of the individual direct care worker. Almost two-thirds (62.50%)
reported that they considered the legally required minimum wage, while half (50.00%)
reported that they also considered the wages offered by other long-term care providers in
the state. Just over a quarter (28.75%) of the RCFs-APD reported that they considered their
profitability and just under a quarter (23.75%) reported that they considered their Medicaid
payment rates when determining the wage and fringe benefit offerings to their direct care
workers. No facility reported that they considered the wages of fast-food restaurants.
4.2.4 Residential Care Facilities: Adults with Developmental Disabilities
Residential care facilities for adults with developmental disabilities (AFCs-DD) reported that
the most commonly cited factor was the legally required minimum wage, closely followed by
the wages offered by other long-term care providers. In 2014, most (88.99%) of the RCFs-
DD reported that they did not use collective bargaining processes when determining wage
and fringe benefit offerings for their direct care workers. Almost three-quarters of the RCFs-
DD respondents reported that they considered the legally required minimum wage when
determining wage and fringe benefits for their direct care workers. Seventy percent
4-6

Section 4 — Wages Provided to Direct Care Workers Employed by Long-Term Care Providers
(70.71%) reported that they also considered the wages offered by other long-term care
providers in the state. At much lower rates, just over a third (37.97%) reported that they
also considered the Medicaid payment rate, 37.43% reported that they considered the
education and experience of the direct care worker, and 35.44% reported that they
considered their profitability. About one-eighth (12.30%) of providers cited the wages paid
in fast food restaurants as a factor.
4.2.5 Adult Foster Care Homes: Aged and Physically Disabled
Adult foster care homes for the aged and individuals with physical disabilities (AFCs-APD)
respondents reported that the two most commonly cited factors considered for determining
wage and fringe benefits for their direct care workers were the legally required minimum
wage and the experience and education of the individual direct care worker. Similar to other
long-term care providers, almost all (94.59%) AFC-APD providers reported that they did not
use collective bargaining processes. The majority (56.70%) reported that they considered
the education and experience of the individual direct care worker and 55.67% also reported
that they considered the legally required minimum wage. A quarter (26.29%) reported that
they considered their Medicaid payment rates, and just over a fifth (22.16%) responded
that they considered the wages offered by other long-term care providers. Less than 1%
(0.52%) of providers reported that they considered the wages of fast-food restaurants.
4.2.6 Adult Foster Care Homes: Adults with Developmental Disabilities
Adult foster care home for adults with developmental disabilities (AFCs-DD) reported that
the education and experience of the individual direct care worker and the legally required
minimum wage were the most important factors considered when determining wages and
fringe benefits for their direct care workers. As with many of the other long-term care
providers, 94.93% of the AFCs-DD respondents reported that they determined their own
wages and benefits rather than going through a collective bargaining process. Almost two-
thirds of providers (61.92%) reported that they considered the experience and education of
the individual direct care worker, while 53.64% reported that they considered the legally
required minimum wage. Fewer than 30% (29.47%) reported that they considered the
wages offered by other long-term care providers and about a quarter (23.51%) reported
that they considered the Medicaid payment rates when determining wages and fringe
benefits for their direct care workers. Less than 1% (0.66%) of providers reported that they
considered the wages of fast food restaurants.
4.2.7 Assisted Living Facilities: Aged and Physically Disabled
Assisted living facilities for the aged and individuals with physical disabilities (ALFs) reported
that the education and experience of the individual direct care worker, the legally required
minimum wage, and the wages offered by other long-term care providers were the most
important factors considered when determining wages and fringe benefits for their direct
4-7

Wages, Fringe Benefits, and Turnover for Direct Care Workers Working for Long-Term Care Providers in Oregon
care workers. Almost all (99.33%) of the ALF respondents reported that they determined
wages and fringe benefits on their own rather than going through a collective bargaining
process. Over three quarters (78.15%) reported that they considered the education and
experience of the individual direct care worker when determining wages and fringe benefits.
Almost two-thirds of the ALF respondents reported that they also considered the legally
required minimum wage, and 58.94% reported that they considered the wages offered by
other long-term care providers in the state. Just over a quarter (26.49%) reported that they
considered their profitability. Less than a fifth of providers (18.54%) said that they
considered the Medicaid rate when making these decisions.
4.2.8 In-Home Care Agencies
In-home care agency services reported that they most often considered the education and
experience of the individual direct care worker as well as the Medicaid payment rates when
determining the wages and fringe benefits of their direct care workers. Most (90.20%) in-
home care agency respondents reported that they determined the wages and fringe benefits
rather than going through a collective bargaining process. Three-quarters (75.00%) of these
providers reported that they considered the education and experience of the individual
direct care worker, and two-thirds (65.38%) reported that they considered their Medicaid
payment rates. Other often-cited considerations made by in-home care agency providers
include the wages offered by other long-term care providers (59.62%) and the legally
required minimum wage (57.69%). Only a small percentage (7.69%) of providers said that
they considered the wages of fast food restaurants.
4.3 Current Wages for Direct Care Workers
Wages are analyzed two ways. First, the responses are weighted by the number of direct
care workers that each provider employs so that providers which employ a greater number
of workers are given more weight than providers who employ fewer workers (Table 4-2).
Second, responses are weighted by the number of providers, so that each provider is
weighted equally. In the second method, a provider that employs 3 direct care workers is
given the same weight as a provider that employs 100 workers (Table 4-3).
4-8

Sectio
n 4
— W
ages Pro
vided
to D
irect Care W
orkers E
mplo
yed b
y Long-T
erm C
are Provid
ers
4-9
Table 4-2. Wages for Direct Care Workers, by Provider Type, 2014
Wages for Direct Care Workers Total Across All Providers
Nursing Facility
Residential Care Facilities Adult Foster Care Homes Assisted Living Facility: Aged/
Physical Disabilities
In-Home Care
Agency
Aged/ Physical
Disabilities
Adults/ Developmental
Disabilities
Aged/
Physical
Adult Foster Care:
Developmental
Total Number of Direct Care Workers 2,867 138 101 765 987 433 178 63 Current Average Hourly Rate for Direct Care Workers (weighted by the number of direct care workers by provider)
Median Rate 10.51 15.42 10.15 10.99 10.00 10.50 10.17 10.50
Mean Rate 11.10 15.60 10.54 11.08 10.64 11.15 10.58 10.94 Percentage Distribution of Direct Care Worker Wages (Rate per Hour)
Less than $9.10 0.73 0.03 0.85 0.14 5.27 3.11 0.40 0.00 $9.10 - $9.99 18.17 1.62 31.66 19.89 16.74 15.57 35.12 17.12
$10.00 - $10.99 29.70 4.29 34.95 38.60 38.84 30.92 28.54 49.73
$11.00 - $11.99 15.62 8.20 14.66 20.98 13.31 19.09 12.74 19.04 $12.00 - $12.99 10.46 16.90 5.95 9.97 12.84 11.97 6.95 5.66
$13.00 - $13.99 6.35 14.31 2.43 4.73 3.97 4.62 4.56 2.55 $14.00 - $14.99 3.70 9.66 2.01 1.89 2.08 2.17 2.54 0.70
$15.00 - $15.99 3.03 8.44 1.59 1.24 2.55 4.43 1.59 0.03 $16.00 - $16.99 2.15 6.02 1.17 1.16 1.13 1.79 1.12 0.08
$17.00 and more 10.09 30.53 4.73 1.41 3.26 6.32 6.43 5.09
Average Wage per Hour for Most Recently Hired Direct Care Worker
10.48 12.74 9.81 10.21 10.52 10.81 9.84 10.37
Current Average Hourly Rate for Direct Care Worker Who Has Worked for Provider for 5 or More Years
12.16 15.77 11.73 12.19 11.47 12.12 11.59 11.19
Note: Unit of analysis is direct care worker. No columns for Adult Day Services, Specialized Living Facilities because there were <30 responses, but they are included in total column. Data on Residential Care Facilities with Contract Rates Residential Care Facilities for Children with Developmental Disabilities, and Supportive Living Services for Individuals with Developmental Disabilities are included in Appendix D. Calculated percentages exclude missing data so percentages within each variable sum to 100%.
Source: RTI International analysis of the 2014 Oregon Wage and Fringe Benefit Survey of Long-Term Care (LTC) Providers.

Wag
es, Fringe B
enefits, an
d T
urn
over fo
r Direct C
are Workers W
orkin
g fo
r Lo
ng-T
erm C
are Provid
ers in O
regon
4-1
0
Table 4-3. Direct Care Worker Weighted Current Wages for Direct Care Workers, by LTC Provider Type
Wages for Direct Care Workers Total Across All Providers
Nursing Facility
Residential Care Facilities Adult Foster Care Homes
Assisted Living Facility: Aged/
Physical Disabilities
In-Home Care Agency
Aged/ Physical
Disabilities
Adults/ Developmental
Disabilities
Aged/
Physical Disabilities
Adult Foster Care:
Developmental Disabilities
Total Number of Direct Care Workers 36,685 7,837 1,810 7,679 4,727 1,426 4,640 4,719 Current Average Hourly Rate for Direct Care Workers (weighted by the number of direct care workers by provider)
Median Rate ($) 11.15 16.50 10.28 10.87 15.00 11.00 10.18 10.75 Mean Rate ($) 12.38 16.03 10.97 11.02 13.20 11.22 10.94 11.59
Distribution of Direct Care Worker Wages (Rate per Hour)
Less than $9.10 0.23 0.01 0.47 0.02 2.99 5.03 0.34 0.00
$9.10 - $9.99 18.78 1.62 29.08 30.95 11.74 16.14 30.05 18.47 $10.00 - $10.99 29.67 4.10 36.51 33.88 30.24 21.94 17.08 51.23
$11.00 - $11.99 14.44 7.80 12.78 16.83 8.99 15.84 11.30 17.33 $12.00 - $12.99 8.94 16.87 6.57 9.24 9.97 9.97 6.99 3.46
$13.00 - $13.99 5.80 12.95 3.50 3.97 4.09 6.60 7.87 1.40 $14.00 - $14.99 3.49 9.09 2.20 2.18 1.32 5.09 2.95 0.39
$15.00 - $15.99 3.11 8.31 1.90 2.18 27.70 6.18 2.34 0.01
$16.00 - $16.99 1.89 5.53 1.40 0.45 0.71 4.47 2.03 0.02 $17.00 and more 13.66 33.71 5.59 0.28 2.25 8.73 19.05 7.68
Average Wage per Hour for Most Recently Hired Direct Care Worker ($)
11.15 12.87 9.95 10.14 13.12 10.72 9.94 10.87
Current Average Hourly Rate for Direct Care Worker Who Has Worked for Provider for 5 or More Years ($)
12.87 15.86 12.17 12.13 11.84 12.21 12.14 11.46
Note: Unit of analysis is direct care worker. No columns for Adult Day Services and Specialized Living Facilities because there were <30 responses, but they are included in total column. Data on Residential Care Facilities with Contract Rates Residential Care Facilities for Children with Developmental Disabilities, and Supportive Living Services for Individuals with Developmental Disabilities are included in Appendix D. Calculated percentages exclude missing data so percentages within each variable sum to 100%.
Source: RTI International analysis of the 2014 Oregon Wage and Fringe Benefit Survey of Long-Term Care (LTC) Providers.

Section 4 — Wages Provided to Direct Care Workers Employed by Long-Term Care Providers
When weighting the responses for all long-term care providers by the number of direct care
workers, the overall current average rate paid to direct care workers was $12.38 an hour.
Weighting the responses by the number of providers drops the current average rate paid to
direct care workers to $11.10 an hour. Because the average might be skewed by a few
providers that paid a lot more or less than the average, the analysis also provides the
median reported wage, which is the middle wage value reported among all respondents.
When weighted by the number of direct care workers a provider employs, the median wage
reported for all direct care workers was $11.15 an hour. Weighting this response by the
number of providers drops the median wage to $10.51 an hour. The legal minimum wage in
Oregon is $9.10 and nationally is $7.25.
When examining the distribution of the current wages offered to direct care workers, the
largest share of respondents reported that they paid between $10.00 and $10.99 an hour,
both when weighted by the number of direct care workers a provider employs and when
weighted by the number of providers. Almost 30% (29.67%) of the respondents reported
that they paid their direct care workers between $10.00 and $10.99 an hour when weighted
by the number of direct care workers. When weighting the respondents by the number of
providers, the response is almost the same – 29.70% reported that they paid their direct
care workers between $10.00 and $10.99 an hour. Another fifth (18.78%) of respondents
reported that they paid their direct care workers between $9.10 and $9.99 an hour when
weighting the providers by the number of direct care workers they employed. The response
remains similar when weighting it by the number of providers – 18.17% reported that they
paid their direct care workers between $9.10 and $9.99 an hour.
Respondents reported that they paid their most recently hired direct care worker $11.15 an
hour, when weighting the responses by the number of direct care workers. This amount
dropped to $10.48 an hour when weighting the responses by the number of providers.
When asked about the current average wage rate for the direct care worker who has worked
for the provider for five or more years, respondents reported that they paid that worker
$12.87 an hour (weighted by the number of direct care workers). When weighting the
response by the number of providers, the amount was $12.16 an hour.
4.3.1 Nursing Facilities
In 2014, the nursing facility providers paid their direct care workers much higher hourly
rates than compared to all other long-term care providers in the state. The average rate
reported was $16.03 an hour when weighted by the number of direct care workers
employed by the nursing facility providers. This average rate was $15.60 an hour when
weighted by the number of nursing facility providers. When weighted by the number of
direct care workers a provider employs, the median wage reported for all direct care
workers was $16.50 an hour. Weighting this response by the number of providers, the
median wage was $15.42 an hour.
4-11
Wages, Fringe Benefits, and Turnover for Direct Care Workers Working for Long-Term Care Providers in Oregon
When weighted by the number of direct care workers, a third (33.71%) of the nursing
facility providers reported that they paid their direct care workers $17.00 or more an hour,
much more than other providers. The next largest share (16.87%) of nursing facility
providers reported they pay their direct care workers $12.00 to $12.99 an hour. When
weighted by the number of providers, almost a third (30.53%) of nursing facility providers
reported they paid their direct care workers $17.00 or more an hour, and 16.90% reported
that they paid their direct care staff $12.00 to $12.99 an hour.
Nursing facility providers reported that they paid their most recently hired direct care
workers an average of $12.87 an hour, when weighted by the number of direct care
workers. When weighted by the number of providers, this average rate was $12.74 an hour.
The average rates paid to direct care workers who had worked for the provider for longer
were paid at much higher rates. When asked what the nursing facility providers paid their
direct care workers who had worked for them for 5 years or more, the average was $15.86
an hour weighted by number of direct care workers and $15.77 an hour weighted by
number of providers.
4.3.2 Residential Care Facilities: Aged and Physically Disabled
Residential care facilities for the aged and individuals with physical disabilities (RCFs-APD)
reported average wages for their direct care workers that were slightly lower than the
average rates for long-term care providers in the state overall. RCF-APD providers reported
an average wage rate of $10.97 an hour when weighted by the number of direct care
workers and $10.54 an hour when weighted by the number of providers. When examining
the median wage rate paid to RCF-APD direct care workers, these providers paid $10.28 an
hour when weighted by the number of direct care workers and $10.15 when weighted by
the number of providers.
A larger share of the distribution of wages paid to RCF-APD direct care workers were
reported at the lower end of average hourly rates. Over a third (36.51%) of RCF-APD
providers reported that they paid their direct care workers $10.00 to $10.99 an hour, and
another 29.08% reported they paid between $9.10 to $9.99 an hour when weighted by the
number of direct care workers. When weighted by the number of providers, 34.51%
reported that they paid $10.00 to $10.99 an hour and 31.66% reported they paid $9.10 to
$9.99 an hour.
The average wage RCF-APD providers reported that they paid their most recently hired
direct care worker was $9.95 an hour when weighted by the number of direct care workers
and $9.81 an hour when weighted by the number of providers. The average wages paid to
direct care workers who have worked for 5 years or more was $12.17 an hour when
weighted by the number of direct care workers and $11.73 an hour when weighted by the
number of providers.
4-12

Section 4 — Wages Provided to Direct Care Workers Employed by Long-Term Care Providers
4.3.3 Residential Care Facilities: Adults with Developmental Disabilities
Average wages paid to direct care workers for residential care facilities for adults with
developmental disabilities (RCFs-DD) were similar to the average rates paid to direct care
workers overall. RCFs-DD reported that the average wage paid to direct care workers was
$11.02 an hour when weighted by the number of direct care workers and $11.08 an hour
when weighted by the number of providers. The median wage paid to RCF-DD direct care
workers was $10.87 an hour when weighted by the number of direct care workers and
$10.99 an hour when weighted by the provider.
RCF-DD providers reported that they tended to pay their direct care workers slightly higher
than the legally required minimum wage ($9.10 an hour). A third (33.88%) of these
providers reported that they paid their direct care workers between $10.00 and $10.99 an
hour when weighted by the number of direct care workers employed by the provider. This
average wage range increases to almost 40% (38.60%) providers when weighted by the
number of providers. Another almost third (30.95%) reported that they paid their direct
care workers between $9.10 and $9.99 an hour, when weighted by the number of direct
care workers and about a fifth (19.89%) of providers when weighted by the number of
providers.
RCFs-DD paid their most recently hired direct care worker $10.14 an hour when weighted
by the number of direct care workers and $10.21 an hour when weighted by the number of
providers. For the more experienced direct care workers, RCFs-DD paid $12.13 an hour for
direct care workers with 5 years with that provider weighted by number of direct care
workers and $12.19 an hour weighted by number of providers.
4.3.4 Adult Foster Care Homes: Aged and Physically Disabled
Among the adult foster care homes for the aged and individuals with physical disabilities
(AFCs-APD), the average wage paid to their direct care workers was at the higher end of
wages paid to all direct care workers when weighted by the number of direct care workers,
but dropped to the lowest wages when weighted by the number of providers. The average
wage reported for AFC-APD direct care workers was $13.20 an hour when weighted by the
number of direct care workers for a provider and $10.64 an hour when weighted by the
number of providers. The median rate reported for these types of direct care workers was
$15.00 an hour when weighted by the number of direct care workers and $10.00 an hour
when weighted by the number of providers.
When examining the distribution of wages paid to AFC-APD direct care workers, the
weighted averages changed substantially between weighting the responses by the number
of direct care workers versus weighting the responses by the number of providers. Almost a
third (30.24%) of providers reported that they paid their direct care workers between
$10.00 and $10.99 an hour, which increased to 38.84% when weighted by the number of
4-13

Wages, Fringe Benefits, and Turnover for Direct Care Workers Working for Long-Term Care Providers in Oregon
providers. On the other end of the distribution, just over a quarter of AFCs-APD reported
that they paid $15.00 to $15.99 an hour for their direct care workers, when weighted by the
number of direct care workers for the provider, but only 2.55% reported this range when
weighted by the number of providers. On the other hand, 16.74% of AFC-APD providers
paid their direct care workers between $9.10 and $9.99 an hour when weighted by the
number of providers, but 11.74% of providers reported this range when weighted by the
number of direct care workers.
The AFC-APD providers also reported higher wages for their more recent direct care worker
hires than the workers that had worked for them for at least 5 years. When weighted by the
number of direct care workers, AFC-APD providers reported that they paid their most
recently hired direct care worker $13.12 an hour, and they paid direct care workers with 5
years or more experience with this provider $11.84 an hour. However, weighting the
responses by the number of providers indicates that the AFCs-APD paid their most recent
direct care worker $10.52 an hour and $11.47 an hour for their more experienced direct
care workers.
4.3.5 Adult Foster Care Homes: Adults with Developmental Disabilities
Adult foster care home for adults with developmental disabilities (AFCs-DD) reported
relatively similar wages to those of AFCs-APD. The average wage rate paid to AFC-DD direct
care workers was $11.22 an hour when weighted by the number of direct care workers and
$11.15 an hour when weighted by the number of providers. The median wage rate reported
for these types of direct care workers was $11.00 an hour when weighted by the number of
direct care workers and $10.50 an hour when weighted by the number of providers.
When weighted by the number of direct care workers, the largest share (21.94%) of AFCs-
DD paid their direct care workers between $10.00 and $10.99 an hour. Another 16.14%
reported that they paid their direct care workers between $9.10 and $9.99 an hour, 15.84%
reported they paid between $11.00 and $11.99 an hour, and 9.97% reported that they paid
between $12.00 and $12.99 an hour. When examining the distribution when weighted by
the number of providers, the largest share (30.92%) remains with the range of $10.00 to
$10.99 an hour. Another 19.09% paid between $11.00 and $11.99 an hour, 15.57% paid
between $9.10 and $9.99 an hour, and 11.97% paid between $12.00 and $12.99 an hour.
The AFCs-DD paid their most recent direct care worker hire around the same as recent
direct care workers overall. AFCs-DD paid an average of $10.72 an hour to their most
recent direct care worker hire when weighted by the number of direct care workers. This
average increased to $10.81 an hour when weighted by the number of providers. When
asked about the average wage paid to direct care workers with 5 years or more experience
with this provider, AFCs-DD paid an average of $12.21 an hour when weighted by the
number of direct care workers and $12.12 when weighted by the number of providers.
4-14

Section 4 — Wages Provided to Direct Care Workers Employed by Long-Term Care Providers
4.3.6 Assisted Living Facilities: Aged and Physically Disabled
Assisted living facilities for the aged and individuals with physical disabilities (ALFs) paid
direct care workers on the lower end of the average wages paid to direct care workers in the
state. ALFs paid an average $10.94 an hour to their direct care workers when weighted by
the number of direct care workers and $10.58 an hour when weighted by the number of
providers. The median wage for ALF direct care workers was $10.18 an hour when weighted
by the number of direct care workers and $10.17 an hour when weighted by the number of
providers.
The distribution of wages paid to ALF direct care workers was also towards the lower end of
the wage ranges compared to direct care workers overall. Almost a third (30.015%) of ALFs
paid their direct care workers between $9.10 and $9.99 an hour when weighted by the
number of direct care workers. This increased to over a third (35.12%) when weighted by
the number of providers. However, when examining the second largest wage ranges, the
distribution varies by the type of weighting. Almost a fifth (19.05%) of ALFs reported that
they paid their direct care workers $17.00 or more an hour when weighted by the number
of direct care workers, but this changes to 6.43% of ALFs when weighting by the number of
providers. On the other hand, 28.54% of ALFs reported that they paid their direct care
workers between $10.00 and $10.99 an hour when weighted by the number of providers
and this drops to 17.08% when weighting this range by the number of direct care workers.
The average wage paid to most recently hired direct care workers for ALFs was $9.94 an
hour when weighted by the number of direct care workers and $9.84 an hour when
weighted by the number of providers. The average wages paid to direct care workers with 5
years or more experience at the provider was $12.14 an hour when weighted by the
number of direct care workers and $11.59 an hour when weighted by the number of
providers.
4.3.7 In-Home Care Agencies
In-home care agencies reported average wages for their direct care workers that were
similar to average wages of direct care workers overall in the state. The average wage paid
to in-home care agency direct care workers was $11.59 an hour when weighted by the
number of direct care workers and $10.94 an hour when weighted by the number of
providers. The median wage among in-home care agency service direct care workers was
$10.75 an hour when weighted by the number of direct care workers compared to $10.50
an hour when weighted by the number of providers.
Also similar to direct care workers overall in the state, the majority of in-home care
agencies paid their direct care workers between $10.00 and $10.99 an hour. Over 50%
(51.23%) of in-home care agencies paid their direct care workers in this wage range when
weighted by the number of direct care workers and just under half (49.73%) when weighted
4-15

Wages, Fringe Benefits, and Turnover for Direct Care Workers Working for Long-Term Care Providers in Oregon
by the number of providers. When weighted by the number of direct care workers, the next
largest share of in-home care agency providers was 18.47% of providers who reported that
they paid their direct care workers between $9.10 and $9.99 an hour. However the next
largest share of these providers when weighted by the number of providers was 19.04% of
providers who reported that they paid between $11.00 and $11.99 an hour.
The average wage paid to the most recent in-home care agency direct care workers was
$10.87 an hour when weighted by the number of direct care workers. This dropped slightly
when weighted by the number of providers to $10.37 an hour. For direct care workers with
5 years or more experience at the provider, in-home care agency providers paid $11.46 an
hour when weighted by the number of direct care workers and $11.19 an hour when
weighted by the number of providers.
4.4 Prior Wages for Long-Term Care Direct Care Workers
Figure 4-3 and Tables 4-4 through 4-11 provide data on wages for direct care workers,
overall and by individual provider type for 2003 to 2014. The analysis of these prior wages
also included information on how these average wages related to the Medicaid payment
rates as well as general inflation over time. The analysis includes Medicaid payment rates
for providers where the information on their payment rates could be readily and definitively
collected, including providers who primarily served the aged and individuals with physical
disabilities (e.g., residential care facilities for the aged and individuals with physical
disabilities). However, the Medicaid payment rates for long-term care providers who
primarily served individuals with developmental disabilities (e.g., residential care facilities
for adults with developmental disabilities), the components to the their Medicaid payment
rates are based on the individual beneficiary’s specific plan of care, varying from individual
to individual greatly and cannot therefore be appropriately applied to the provider group as
a whole. For this reason, information about the trends in Medicaid payment rates for these
providers who primarily serve individuals with developmental disabilities are not included in
this report.
To conduct the analysis of what wages would have been if 2003 wages increased with
general inflation, the analysis multiplied the wages in 2003 by the annual rate of inflation
obtained from the Bureau of Labor Statistics (BLS) between 2003 and 2014. The tables also
include data on wages of long-term care workers in the State of Oregon collected by the
BLS Occupational Employment Statistics Programs as a supplemental estimate (U.S. Bureau
of Labor Statistics, 2014). A limitation of this supplement is that the provider categories do
not exactly map to the long-term care provider categories used by Oregon. The analysis
reports personal care aides for any direct care workers employed by long-term care
providers other than nursing facilities and in-home care agencies. Nursing aides is the BLS
employment categories used for comparison for direct care workers employed by nursing
facilities and home health aides is the BLS employment category used for comparison for
4-16

Section 4 — Wages Provided to Direct Care Workers Employed by Long-Term Care Providers
direct care workers employed by in-home care agencies. Data from the survey show that
average wages for direct care workers increased from 2003 to 2014, but did not quite keep
up with general inflation. U.S. Bureau of Labor Statistics (BLS) data on direct care workers
in Oregon suggest a slightly higher rate of increase, but not enough to match inflation.
The tables also present information on the change in the number of long-term care
providers as well as the number of direct care workers in Oregon for these providers.
A limitation is that the wages reported only apply to the providers in operation in 2014.
Providers that closed over the 2003 to 2014 time period are not included because they were
not available to answer the survey. Also not included are data for providers which were sold
over the time period for the portion of the time period prior to their being sold. Data on
providers that opened over the 2003 to 2014 time period are available only for the period in
which they were open.
Overall, the number of long-term care providers for providers that were in operation in 2014
increased from 734 to 2,867 from 2003 to 2014, which was a 291% increase over that
period of time. Nursing facilities increased by 146%; residential care facilities for the aged
and individuals with physical disabilities (RCFs-APD) increased by 281%; residential care
facilities for adults with developmental disabilities (RCFs-DD) increased by 257%; adult
foster care homes for the aged and individuals with physical disabilities (AFCs-APD)
increased by 313%; adult foster care homes for adults with developmental disabilities
(AFCs-DD) increased by 529%; assisted living facilities for the aged and individuals with
physical disabilities (ALFs) increased by 297%; and in-home care agencies increased by
420%.
The number of direct care workers in the state overall for providers that were in operation in
2014 increased from 10,143 in 2003 to 36,685 in 2014, which was a 262% increase over
that period of time. Nursing facility direct care workers increased by 156%; RCF-APD direct
care workers increased by 251%; RCF-DD direct care workers increased by 297%; AFC-APD
direct care workers increased by 932%; AFC-DD direct care workers increased by 606%;
ALF direct care workers increased by 293%; and in-home care agency direct care workers
increased by 383%.
4.4.1 Prior Wages for Total Direct Care Workers
Figure 4-3 and Table 4-4 show that the average hourly wage paid to all direct care
workers in the state increased over the past 10 years. In 2003, the reported average wage
for direct care workers overall was $9.21 an hour. By 2014, the average wage for a long-
term care direct care worker was $11.10 an hour, which was a 21% increase over that 10
year time period. In the past 5 years, from 2009 to 2014, the average hourly rate increased
from $10.23 to $11.10, which was an 8% increase over 5 years.
4-17

Wages, Fringe Benefits, and Turnover for Direct Care Workers Working for Long-Term Care Providers in Oregon
When adjusting the average wages in 2003 by general inflation over time, the reported
average hourly rate ($11.10) in 2014 was lower than the inflation adjusted rate ($11.88).
The BLS Occupational Employment Statistics Programs (BLS) reported over the same time
period that the average rate for personal care aides increased from $9.67 an hour in 2003
to $11.07 an hour in 2013 (the latest data available), which was a 14% increase. For
nursing aides, the BLS reported that the average rate was $10.47 an hour in 2003 and
$13.32 an hour in 2013, which was a 27% increase. For home health aides, the BLS
reported that the average wage rate was $9.30 an hour in 2003 and $11.65 an hour in
2013, a 25% increase over that time period.
Figure 4-3. Average Wages for Direct Care Workers for All Long-Term Care Providers Participating in Medicaid, 2003-2014
Note: Unit of analysis is direct care worker. Estimates for personal care aides, nursing aides, and home health aides are from U.S. Bureau of Labor Statistics (BLS) estimates for Oregon. BLS estimates are not available for 2014.
Source: RTI International analysis of the 2014 Oregon Wage and Fringe Benefit Survey of Long-Term Care (LTC) Providers.
4-18

Sectio
n 4
— W
ages Pro
vided
to D
irect Care W
orkers E
mplo
yed b
y Long-T
erm C
are Provid
ers
4-1
9
Table 4-4. Wages for Direct Care Workers for Total Providers, 2003-2014
Year Provider in Operation 2003 2005 2007 2009 2010 2011 2012 2013 2014
Total Number of Providers 734 878 1,108 1,364 1,577 1,729 1,894 2,256 2,867
Total Number of Direct Care Workers
10,143 12,538 18,296 22,758 27,095 28,492 31,639 36,430 36,685
Average Wages for Direct Care Workers
Reported average hourly wage (weighted by number of direct care workers)
$9.21 $9.44 $9.89 $10.23 $10.38 $10.54 $10.67 $10.90 $11.10
2003 wage rate adjusted for inflation
$9.21 $9.78 $10.38 $10.74 $10.91 $11.26 $11.49 $11.66 $11.88
BLS estimates
Personal care aides $9.67 $10.08 $10.49 $10.80 $10.77 $10.70 $10.78 $11.07
Nursing aides $10.47 $11.09 $12.06 $12.89 $12.77 $12.73 $12.69 $13.32
Home health aides $9.30 $9.28 $9.87 $10.37 $10.32 $10.71 $11.11 $11.65
Note: Unit of analysis is direct care worker. Includes Adult Day Services and Specialized Living Facilities. BLS is U.S. Bureau of Labor Statistics. BLS estimates for wages not available for 2014.
Source: RTI International analysis of the 2014 Oregon Wage and Fringe Benefit Survey of Long-Term Care (LTC) Providers.

Wages, Fringe Benefits, and Turnover for Direct Care Workers Working for Long-Term Care Providers in Oregon
4.4.2 Nursing Facilities
Table 4-5 shows that the average wage paid to nursing facility direct care workers
increased at a slightly faster rate than direct care workers total over the 10 years reported
in the survey. Nursing facility providers reported that they paid direct care workers an
average of $12.16 an hour in 2003, which increased to an average of $15.60 an hour in
2014, a 28% increase over the time period. In the past 5 years, the average nursing facility
direct care worker wages increased from $14.13 an hour to $15.60 an hour, which was a
10% increase. When adjusting the 2003 wages by general inflation, the reported average
rate in 2014 ($15.60 an hour) was just under the inflation-adjusted rate in 2014 ($15.73 an
hour). Comparing the reported rates to the BLS reported wages, the BLS reported nursing
aide average wages increased from $10.47 an hour in 2003 to $13.32 an hour in 2013,
which was a 27% increase - around the same as the reported wage rate increase.
The Medicaid payment rates to the nursing facilities increased from $138.88 per basic
resident in 2003 to $257.56 per basic resident in 2014, which was an 88% increase during
this time period. The Medicaid payment rate increase was over three times faster than the
reported direct care worker wage increase. In the last 5 years, from 2009 to 2014, the
Medicaid payment rate to nursing facilities increased from $208.29 to $257.56, which was a
24% increase over this time period – almost two and half times faster than the wage rate
increase for direct care workers in the last 5 years.
4.4.3 Residential Care Facilities: Aged and Physically Disabled
Table 4-6 shows that the average wage paid to Residential Care Facilities: Aged and
Physically Disabled (RCFs-APD) direct care workers increased at a rate to nursing facility
direct care workers over the 10 years reported in the survey, but at a much lower starting
and ending payment level. RCF-APD providers reported that they paid direct care workers
an average of $8.33 an hour in 2003, which increased to an average of $10.54 an hour in
2014, a 27% increase over that time period. In the past 5 years, the average RCF-APD
direct care worker wages increased from $9.64 an hour to $10.54 an hour, a 9% increase.
When adjusting the 2003 wages for RCF-APD direct care workers by general inflation, the
reported average rate in 2014 ($10.54 an hour) was just under the inflation-adjusted rate
in 2014 ($10.84 an hour). Compared to the BLS reported wages, the personal care aide
average wages increased from $9.67 an hour in 2003 to $11.07 an hour in 2013, which was
a 14% increase over that time period.
4-20

Sectio
n 4
— W
ages Pro
vided
to D
irect Care W
orkers E
mplo
yed b
y Long-T
erm C
are Provid
ers
4-2
1
Table 4-5. Weighted Wages for Direct Care Workers at Nursing Facilities, 2003-2014
Year Provider in Operation 2003 2005 2007 2009 2010 2011 2012 2013 2014
Total Number of Providers 56 68 82 90 98 99 105 112 138
Total Number of Direct Care Workers
3,057 3,583 5,463 6,588 6,957 6,861 6,973 7,569 7,837
Average Wages for Direct Care Workers
Reported average hourly wage (weighted by number of direct care workers)
$12.16 $13.17 $13.61 $14.13 $14.56 $14.80 $14.86 $14.99 $15.60
2003 wage rate adjusted for inflation
$12.16 $12.91 $13.70 $14.18 $14.41 $14.87 $15.17 $15.40 $15.73
BLS estimates for nursing aides
$10.47 $11.09 $12.06 $12.89 $12.77 $12.73 $12.69 $13.32
Daily Medicaid Payment Rate per Nursing Facility Resident
$136.88 $165.89 $187.06 $208.29 $208.29 $212.12 $212.12 $256.47 $257.56
Note: Unit of analysis is direct care worker. BLS is U.S. Bureau of Labor Statistics. BLS estimates for wages not available for 2014.
Source: RTI International analysis of the 2014 Oregon Wage and Fringe Benefit Survey of Long-Term Care (LTC) Providers.
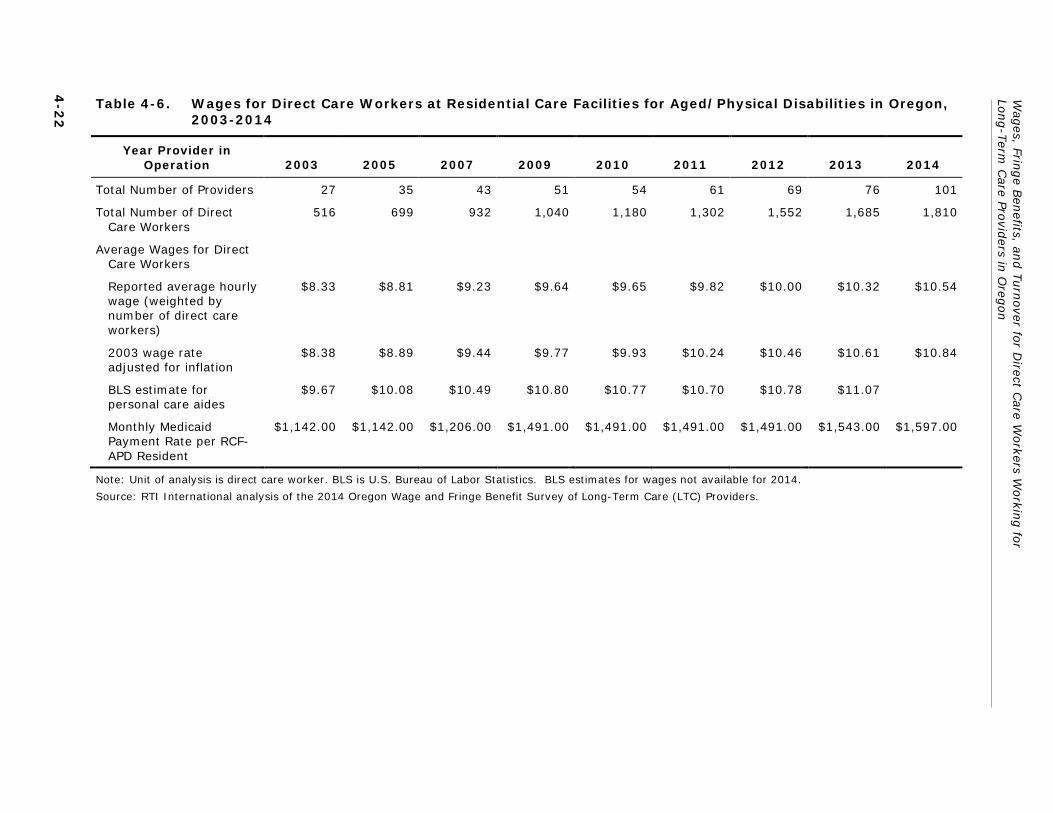
Wag
es, Fringe B
enefits, an
d T
urn
over fo
r Direct C
are Workers W
orkin
g fo
r Lo
ng-T
erm C
are Provid
ers in O
regon
4-2
2
Table 4-6. Wages for Direct Care Workers at Residential Care Facilities for Aged/Physical Disabilities in Oregon, 2003-2014
Year Provider in Operation 2003 2005 2007 2009 2010 2011 2012 2013 2014
Total Number of Providers 27 35 43 51 54 61 69 76 101
Total Number of Direct Care Workers
516 699 932 1,040 1,180 1,302 1,552 1,685 1,810
Average Wages for Direct Care Workers
Reported average hourly wage (weighted by number of direct care workers)
$8.33 $8.81 $9.23 $9.64 $9.65 $9.82 $10.00 $10.32 $10.54
2003 wage rate adjusted for inflation
$8.38 $8.89 $9.44 $9.77 $9.93 $10.24 $10.46 $10.61 $10.84
BLS estimate for personal care aides
$9.67 $10.08 $10.49 $10.80 $10.77 $10.70 $10.78 $11.07
Monthly Medicaid Payment Rate per RCF-APD Resident
$1,142.00 $1,142.00 $1,206.00 $1,491.00 $1,491.00 $1,491.00 $1,491.00 $1,543.00 $1,597.00
Note: Unit of analysis is direct care worker. BLS is U.S. Bureau of Labor Statistics. BLS estimates for wages not available for 2014.
Source: RTI International analysis of the 2014 Oregon Wage and Fringe Benefit Survey of Long-Term Care (LTC) Providers.

Section 4 — Wages Provided to Direct Care Workers Employed by Long-Term Care Providers
The Medicaid payment rates to the RCFs-APD increased from $1,142.00 per resident in
2003 to $1,597.00 per resident in 2014, which was a 40% increase in payment rates during
this time period. The Medicaid payment rate increase was almost one and half times faster
than the reported RCF-APD direct care worker wage increase. In the last 5 years, from 2009
to 2014, the Medicaid payment rate to RCFs-APD increased from $1,491.00 to $1,597.00,
which was a 7% increase over this time period, which was slower than the wage rate
increase for RCF-APD direct care workers in the last 5 years.
4.4.4 Residential Care Facilities: Adults with Developmental Disabilities
Table 4-7 shows that the average wage paid to Residential Care Facilities: Adults with
Developmental Disabilities (RCFs-DD) direct care workers increased at the same rate as
overall direct care workers over the 10 years reported in the survey. RCF-DD providers
reported that they paid direct care workers an average of $9.18 an hour in 2003, which
increased to an average of $11.08 an hour in 2014. This was a 21% increase over that time
period. In the past 5 years, the average RCF-APD direct care worker wages increased from
$10.37 an hour to $11.08 an hour, which was a 7% increase. When adjusting the 2003
wages by general inflation, the reported average rate in 2014 ($11.08 an hour) was slightly
under the inflation-adjusted rate in 2014 ($11.88 an hour). The BLS reported average
wages for personal care aides increased from $9.67 an hour in 2003 to $11.07 an hour in
2013, which was a 14% increase over that time period.
4.4.5 Adult Foster Care Homes: Aged and Physically Disabled
Table 4-8 shows that the average wage paid to Adult Foster Care Homes: Aged and
Physically Disabled (AFC-APD) direct care workers increased at a slightly slower rate than
the rate reported for direct care workers overall over the 10 years reported in the survey.
AFC-APD providers reported that they paid direct care workers an average of $8.85 an hour
in 2003, which increased to an average of $10.64 an hour in 2014, a 20% increase over
that time period. In the past 5 years, the average RCF-APD direct care worker wages
increased from $9.64 an hour to $10.64 an hour, a 10% increase. When adjusting the 2003
wages for AFC-APD direct care workers by general inflation, the reported average rate in
2014 ($10.64 an hour) was almost a dollar an hour under the inflation-adjusted rate in
2014 ($11.45 an hour). The BLS reported wages for personal care aide average wages
increased from $9.67 an hour in 2003 to $11.07 an hour in 2013, which was a 14%
increase over that time period.
4-23

Wag
es, Fringe B
enefits, an
d T
urn
over fo
r Direct C
are Workers W
orkin
g fo
r Lo
ng-T
erm C
are Provid
ers in O
regon
4-2
4
Table 4-7. Wages for Direct Care Workers at Residential Care Facilities for Adults with Developmental Disabilities in Oregon, 2003-2014
Year Provider in Operation 2003 2005 2007 2009 2010 2011 2012 2013 2014
Total Number of Providers 214 260 343 397 429 473 512 642 765
Total Number of Direct Care Workers
1,935 2,765 4,481 5,948 6,603 7,073 8,238 10,035 7,679
Average Wages for Direct Care Workers
Reported average hourly wage (weighted by number of direct care workers)
$9.18 $9.40 $9.90 $10.37 $10.51 $10.56 $10.68 $10.92 $11.08
2003 wage rate adjusted for inflation
$9.18 $9.74 $10.34 $10.70 $10.88 $11.22 $11.45 $11.62 $11.88
BLS estimate for personal care aides
$9.67 $10.08 $10.49 $10.80 $10.77 $10.70 $10.78 $11.07
Note: Unit of analysis is direct care worker. BLS is U.S. Bureau of Labor Statistics. BLS estimates for wages not available for 2014.
Source: RTI International analysis of the 2014 Oregon Wage and Fringe Benefit Survey of Long-Term Care (LTC) Providers.

Sectio
n 4
— W
ages Pro
vided
to D
irect Care W
orkers E
mplo
yed b
y Long-T
erm C
are Provid
ers
4-2
5
Table 4-8. Wages for Direct Care Workers at Foster Care Homes for Aged/Physical Disabilities, 2003-2014
Year Provider in Operation 2003 2005 2007 2009 2010 2011 2012 2013 2014
Total Number of Providers 239 270 331 427 529 580 651 779 987
Total Number of Direct Care Workers
458 550 697 1,109 1,608 1,857 2,046 2,269 4,727
Average Wages for Direct Care Workers
Reported average hourly wage (weighted by number of direct care workers)
$8.85 $8.94 $9.33 $9.64 $9.82 $10.10 $10.24 $10.48 $10.64
2003 wage rate adjusted for inflation
$8.85 $9.39 $9.97 $10.32 $10.49 $10.82 $11.04 $11.20 $11.45
BLS estimate for personal care aides
$9.67 $10.08 $10.49 $10.80 $10.77 $10.70 $10.78 $11.07
Monthly Medicaid Payment Rate per AFC-APD Resident
$1,142.00 $1,142.00 $1,206.00 $1,491.00 $1,491.00 $1,491.00 $1,491.00 $1,543.00 $1,597.00
Note: Unit of analysis is direct care worker. BLS is U.S. Bureau of Labor Statistics. BLS estimates for wages not available for 2014.
Source: RTI International analysis of the 2014 Oregon Wage and Fringe Benefit Survey of Long-Term Care (LTC) Providers.

Wages, Fringe Benefits, and Turnover for Direct Care Workers Working for Long-Term Care Providers in Oregon
The Medicaid payment rates to the AFCs-APD increased from $1,142.00 per resident in
2003 to $1,597.00 per resident in 2014, which was the same as RFCs-APD and a 40%
increase in payment rates during this time period. The Medicaid payment rate increase was
two times faster than the reported AFC-APD direct care worker wage increase. In the last 5
years, from 2009 to 2014, the Medicaid payment rate to AFCs-APD increased from
$1,491.00 to $1,597.00, which was a 7% increase over this time period – which was slower
than the wage rate increase for RCF-APD direct care workers in the last 5 years.
4.4.6 Adult Foster Care Homes: Adults with Developmental Disabilities
Table 4-9 shows that the average wage paid to Adult Foster Care Homes: Adults with
Developmental Disabilities (AFCs-DD) direct care workers increased at a slower rate than
the rate reported for direct care workers overall during the 10 years reported in the survey.
AFC-DD providers reported that they paid direct care workers an average of $9.41 an hour
in 2003, which increased to an average of $11.15 an hour in 2014, an 18% increase over
that time period. In the past 5 years, the average RCF-DD direct care worker wages
increased from $9.87 an hour to $11.15 an hour, a 13% increase. When adjusting the 2003
wages for AFC-DD direct care workers by general inflation, the reported average rate in
2014 ($11.15 an hour) was over a dollar an hour less than the inflation-adjusted rate in
2014 ($12.17 an hour). And compared to the BLS reported wages, the personal care aide
average wages increased from $9.67 an hour in 2003 to $11.07 an hour in 2013, which was
a 14% increase over that time period.
4.4.7 Assisted Living Facilities: Aged and Physically Disabled
Table 4-10 shows that the average wage paid to Assisted Living Facilities: Aged and
Physically Disabled (ALFs) direct care workers increased at a faster rate than the rate
reported for direct care workers overall during the 10 years reported in the survey. ALF
providers reported that they paid direct care workers an average of $8.18 an hour in 2003,
which increased to an average of $10.58 an hour in 2014. This was a 29% increase over
that time period. In the past 5 years, the average ALF direct care worker wages increased
from $9.55 an hour to $10.58 an hour, which was an 11% increase. When adjusting the
2003 wages by general inflation, the reported average rate in 2014 ($10.58 an hour) was
the exactly the same as the inflation-adjusted rate in 2014. The BLS reported wages for
personal care aides increased from $9.67 an hour in 2003 to $11.07 an hour in 2013, which
was a 14% increase over that time period.
4-26

Sectio
n 4
— W
ages Pro
vided
to D
irect Care W
orkers E
mplo
yed b
y Long-T
erm C
are Provid
ers
4-2
7
Table 4-9. Wages for Direct Care Workers at Foster Care Homes for Adults with Developmental Disabilities in Oregon, 2003-2014
Year Provider in Operation 2003 2005 2007 2009 2010 2011 2012 2013 2014
Total Number of Providers 69 97 126 179 218 239 265 320 433
Total Number of Direct Care Workers
202 275 396 578 1,991 836 972 1,155 1,426
Average Wages for Direct Care Workers
Reported average hourly wage (weighted by number of direct care workers)
$9.41 $9.28 $9.54 $9.87 $10.14 $10.35 $10.61 $11.03 $11.15
2003 wage rate adjusted for inflation
$9.41 $9.99 $10.60 $10.97 $11.15 $11.50 $11.74 $11.91 $12.17
BLS estimate for personal care aides
$9.67 $10.08 $10.49 $10.80 $10.77 $10.70 $10.78 $11.07
Note: Unit of analysis is direct care worker. BLS is U.S. Bureau of Labor Statistics. BLS estimates for wages not available for 2014.
Source: RTI International analysis of the 2014 Oregon Wage and Fringe Benefit Survey of Long-Term Care (LTC) Providers.

Wag
es, Fringe B
enefits, an
d T
urn
over fo
r Direct C
are Workers W
orkin
g fo
r Lo
ng-T
erm C
are Provid
ers in O
regon
4-2
8
Table 4-10. Wages for Direct Care Workers at Assisted Living Facilities, 2003-2014
Year Provider in Operation 2003 2005 2007 2009 2010 2011 2012 2013 2014
Total Number of Providers 45 47 61 67 83 93 99 114 178
Total Number of Direct Care Workers
1,181 1,291 1,958 2,051 2,566 3,259 3,611 4,165 4,640
Average Wages for Direct Care Workers
Reported average hourly wage (weighted by number of direct care workers)
$8.18 $8.50 $9.21 $9.55 $9.65 $9.97 $10.15 $10.39 $10.58
2003 wage rate adjusted for inflation
$8.18 $8.68 $9.22 $9.54 $9.69 $10.00 $10.21 $10.36 $10.58
BLS estimate for personal care aide
$9.67 $10.08 $10.49 $10.80 $10.77 $10.70 $10.78 $11.07
Monthly Medicaid Payment Rate per ALF Resident
$1,142.00 $1,142.00 $1,206.00 $1,491.00 $1,491.00 $1,491.00 $1,491.00 $1,543.00 $1,597.00
Note: Unit of analysis is direct care worker. BLS is U.S. Bureau of Labor Statistics. BLS estimates for wages not available for 2014.
Source: RTI International analysis of the 2014 Oregon Wage and Fringe Benefit Survey of Long-Term Care (LTC) Providers.
Section 4 — Wages Provided to Direct Care Workers Employed by Long-Term Care Providers
The Medicaid payment rates to the ALFs increased from $1,490.76 per resident in 2003 to
$2,096.00 per resident in 2014, a 41% increase in payment rates during this time period.
The Medicaid payment rate increase was almost one and half times faster than the reported
ALF direct care worker wage increase. In the last 5 years, from 2009 to 2014, the Medicaid
payment rate to ALFs increased from $1,957.00 to $2,096.00, which was a 7% increase
over this time period – slower than the wage rate increase for RCF-APD direct care workers
in the last 5 years.
4.4.8 In-Home Care Agencies
Table 4-11 shows that the average wage paid to in-home care agency direct care workers
increased at a faster rate than the rate reported for direct care workers overall during the
10 years reported in the survey. ALF providers reported that they paid direct care workers
an average of $8.78 an hour in 2003, which increased to an average of $10.94 an hour in
2014, a 25% increase over that time period. In the past 5 years, the average ALF direct
care worker wages increased from $9.90 an hour to $10.94 an hour, an 11% increase.
When adjusting the 2003 wages for in-home care agency direct care workers by general
inflation, the reported average rate in 2014 ($10.94 an hour) was less than the inflation-
adjusted rate in 2014 ($11.36 an hour). The BLS reported wages for personal care aides
increased from $9.67 an hour in 2003 to $11.07 an hour in 2013, a 14% increase over that
time period. The home health aide average wages increased from $9.30 an hour in 2003 to
$11.65 an hour in 2013, a 25% increase.
Although information about the Medicaid payment rates to in-home care agencies was not
available for 2003, in the last 5 years from 2009 to 2014, the Medicaid payment rate to
ALFs increased from $20.70 an hour to $21.24 an hour, which was a 6% increase over this
time period – slower than the wage rate increase for in-home care agency direct care
workers in the last 5 years.
4-29

Wag
es, Fringe B
enefits, an
d T
urn
over fo
r Direct C
are Workers W
orkin
g fo
r Lo
ng-T
erm C
are Provid
ers in O
regon
4-3
0
Table 4-11. Wages for Direct Care Workers at In-Home Agencies, 2003-2014
Year Provider in Operation 2003 2005 2007 2009 2010 2011 2012 2013 2014
Total Number of Providers 69 97 126 179 218 239 265 320 433
Total Number of Direct Care Workers
202 275 396 578 1,991 836 972 1,155 1,426
Average Wages for Direct Care Workers
Reported average hourly wage (weighted by number of direct care workers)
$9.41 $9.28 $9.54 $9.87 $10.14 $10.35 $10.61 $11.03 $11.15
2003 wage rate adjusted for inflation
$9.41 $9.99 $10.60 $10.97 $11.15 $11.50 $11.74 $11.91 $12.17
BLS estimates $9.67 $10.08 $10.49 $10.80 $10.77 $10.70 $10.78 $11.07
Personal care aides $9.67 $10.08 $10.49 $10.80 $10.77 $10.70 $10.78 $11.07
Home health aides $9.30 $9.28 $9.87 $10.37 $10.32 $10.71 $11.11 $11.65
Hourly Medicaid Payment Rate per In-Home Care Agency Service User
No data No data $19.25 $20.07 $20.07 $20.07 $20.07 $21.24 $21.24
Note: Unit of analysis is direct care worker. BLS is U.S. Bureau of Labor Statistics. BLS estimates for wages not available for 2014.
Source: RTI International analysis of the 2014 Oregon Wage and Fringe Benefit Survey of Long-Term Care (LTC) Providers.

Section 4 — Wages Provided to Direct Care Workers Employed by Long-Term Care Providers
4.5 Average Wages for Long-Term Care Direct Care Workers by Provider Characteristics
Table 4-12 provides information on the average wages provided to all direct care workers,
examining the differences by a variety of characteristics of long-term care providers, service
users, and direct care workers. The analysis of these average wages for direct care workers
are presented two ways. First, survey responses are weighted by the number of providers,
so that so that each provider is weighted equally. Second, survey responses are weighted
by the number of direct care workers employed by the provider, so that providers who
employ a greater number of workers are given more weight than providers who employ
fewer workers. The different long-term care provider characteristics examined include the
type of provider ownership, location, the provider dependence on Medicaid payers, the most
common disability among service users, the ethnicity and race of direct care workers, the
ethnicity and race of the service users, the average age of the services users, the provider
size, the education of the direct care worker, the required training of the direct care
workers, and the fringe benefits offered to direct care workers in 2014.
Table 4-12. Wages for Direct Care Workers, Total Providers, by Provider Characteristics, 2014
Provider Characteristics
Average Wages ($) in 2014
Averaged Across All Providers
Averaged Across All Direct Care Workers
Total Average Wages 11.10 12.38
Type of Ownership
Private, non-profit 11.06 11.65
Private, for profit 11.16 12.70
Government: federal, state, county or local
10.80 12.90
Chain Ownership
Part of corporate chain (yes) 11.32 12.66
Individual entity (no) 10.93 12.00
MSA
Metropolitan 11.16 12.53
Micropolitan 10.84 11.54
Non-Metropolitan/Non-Micropolitan 10.95 12.23
Dependence on Medicaid
High percent of beneficiaries with Medicaid as primary payer (> median)
11.41 12.51
Low percent of beneficiaries with Medicaid as primary payer (<= median)
10.88 12.03
(continued)
4-31

Wages, Fringe Benefits, and Turnover for Direct Care Workers Working for Long-Term Care Providers in Oregon
Table 4-12. Wages for Direct Care Workers, Total Providers, by Provider Characteristics, 2014 (continued)
Provider Characteristics
Average Wages ($) in 2014
Averaged Across All Providers
Averaged Across All Direct Care Workers
Most Common Disability Among Individuals Served
.
Frailty, dementia, and physical disabilities 11.14 12.96
Intellectual/ developmental disabilities 11.09 11.09
Severe mental illness 10.73 11.18
Traumatic brain injury 10.65 10.81
HIV . .
Ethnicity of Direct Care Workers
High Hispanic/Latino workers (> median) 11.33 12.72
Low Hispanic/Latino workers (< =median)
10.89 12.07
Race of Direct Care Workers
High minority workers (> median of all non-white race categories)
10.78 11.68
Low minority workers (< =median of all non-white race categories)
11.41 13.00
Ethnicity of Beneficiaries
High Hispanic/Latino beneficiaries (> median)
11.47 13.11
Low Hispanic/Latino beneficiaries (<= median)
10.97 11.86
Race of Beneficiaries
High minority beneficiaries (> median of all non-white race categories)
10.91 12.24
Low minority beneficiaries (< =median of all non-white race categories)
11.35 12.50
Age of Target Population .
Elderly (65 years or more) 11.13 12.90
Younger individuals with disabilities (Less than 65 years)
11.07 11.13
Employer Size .
Large provider (>75 beneficiaries) 12.42 12.93
Small provider (<= 75 beneficiaries) 11.04 12.19
Education of Direct Care Workers
Higher than median education 11.26 12.65
Lower than median education 11.06 12.32
(continued)
4-32

Section 4 — Wages Provided to Direct Care Workers Employed by Long-Term Care Providers
Table 4-12. Wages for Direct Care Workers, Total Providers, by Provider Characteristics, 2014 (continued)
Provider Characteristics
Average Wages ($) in 2014, Weighted by All
Averaged Across All Providers
Averaged Across All Direct Care Workers
Required training of Direct Care Workers
< 75 hours 10.93 11.73
>=75 hours 11.62 13.72
Fringe Benefits Offered in 2014
Health insurance with family coverage 11.60 13.00
Health insurance for employee only 11.51 12.80
Paid personal time off, vacation time, or sick leave
11.34 12.38
Paid holidays 11.49 12.64
Pension or 401(k) or 403(b) accounts 11.63 12.91
Employer-sponsored life insurance 11.69 13.02
Source: RTI International analysis of the 2014 Oregon Wage and Fringe Benefit Survey of Long-Term Care (LTC) Providers.
4.5.1 Facility Characteristics
The average wages offered to direct care workers in Oregon in 2014 was $11.10 an hour
when weighted by the number of providers. Providers that were private, for-profit and part
of a chain ownership, located in metropolitan areas, that served larger numbers of
beneficiaries, served more Medicaid beneficiaries, and served primarily individuals with
frailty, dementia, and physical disabilities paid higher rates than the average wages
provided to direct care workers overall.
Those providers who reported that they were private, for-profit entities paid direct care
workers at a slightly higher rate ($11.16 an hour) than the average rate overall. Those
providers who were private, non-profit or government entities paid less ($11.06 an hour or
$10.80 an hour, respectively) than the average hourly rate. Long-term care providers that
reported that they were part of chain ownership paid higher wages ($11.32 an hour) than
the average wage, and those that reported as individual entities reported lower ($10.93 an
hour) than the average wages overall. Long-term care providers located in metropolitan
areas reported slightly higher wages ($11.16 an hour) than the average wage overall, while
those in micropolitan or more rural areas paid slightly less. Among those providers who had
a higher percentage of service users who used Medicaid as their primary payer, the wages
paid to direct care workers were higher ($11.41 an hour) than the average wages overall,
while those providers with a lower percentage of Medicaid payers for their services paid
lower wages ($10.88 an hour). And when examining the most common disability among the
individuals served, those providers who primarily served individuals with frailty, dementia,
and physical disabilities paid slightly more ($11.14 an hour) than the average wage. Those
4-33

Wages, Fringe Benefits, and Turnover for Direct Care Workers Working for Long-Term Care Providers in Oregon
providers who primarily served individuals with intellectual or developmental disabilities,
severe mental illness, traumatic brain injury, or HIV paid slightly less than the average
wages for direct care workers. Larger providers that served more than 75 service users paid
higher average wages ($12.42 an hour) to direct care workers than the average wages to
direct care workers overall.
When weighted by the number of direct care workers employed by the provider, the
average wage for direct care workers was $12.38 an hour. Those providers who reported
that they were run by government entities or were private, for-profit entities paid direct
care workers at higher rates ($12.90 an hour and $12.70 an hour, respectively) than the
average rate overall. Those providers who were private, non-profit entities paid less ($11.65
an hour) than the average hourly rate. Those long-term care providers that reported that
they were part of a chain paid higher wages ($12.66 an hour) than the average wage, and
those that were individual entities reported lower ($12.00 an hour) than the average wages
overall. Long-term care providers located in metropolitan areas reported slightly higher
wages ($12.53 an hour) than the average wage overall, while those in micropolitan or more
rural areas paid slightly less. Among those providers who had a higher percentage of service
users who used Medicaid as their primary payer, the wages paid to direct care workers were
higher ($12.51 an hour) than the average wages overall, while those providers with a lower
percentage of Medicaid payers for their services paid lower wages ($12.03 an hour). And
when examining the most common disability among the individuals served, those providers
who primarily served individuals with frailty, dementia, and physical disabilities paid more
($12.96 an hour) than the average wage. Those providers who primarily served individuals
with intellectual or developmental disabilities, severe mental illness, traumatic brain injury,
or HIV paid more than a dollar less an hour than the average wages for direct care workers.
Larger providers that served more than 75 service users paid higher average wages ($12.93
an hour) to direct care workers than the average wages to direct care workers overall.
4.5.2 Service User Characteristics
Providers who served a higher percentage of Hispanic/Latino s, a lower percentage of
minority individuals, and primarily served individuals age 65 and older paid higher wages to
their direct care workers than the average wages for direct care workers overall.
Weighting the average wages offered to direct care workers by the number of providers,
long-term care providers that served a higher percentage of Hispanic/Latinos paid higher
($11.47 an hour) wages than those who had a lower percentage of Hispanic/Latino service
users. However, those providers who served a lower percentage of minority service users
reported higher wages ($11.35 an hour) than those with a higher percentage of minority
service users. The providers who reported serving primarily individuals age 65 or older paid
higher average wages ($11.13 an hour) than the average wage, while those who served
4-34

Section 4 — Wages Provided to Direct Care Workers Employed by Long-Term Care Providers
primarily individuals under 65 with disabilities paid slightly lower average wages ($11.07 an
hour).
Weighting the average wages offered to direct care workers by the number of direct care
workers employed by the provider, those long-term care providers serving a higher
percentage of Hispanic/Latinos paid higher average wages ($13.11 an hour) to direct care
workers compared to the average wages (S12.38 an hour). Providers with lower
percentages of Hispanic/Latino ethnic service users paid less ($11.86 an hour) than the
average wages for direct care workers. Providers who served a lower percentage of minority
service users reported higher wages ($12.50 an hour) than the average wages. The
providers who served primarily individuals age 65 or older reported paying higher ($12.90
an hour) than average wages and those providers who primarily served individuals under
age 65 ($11.13 an hour).
4.5.3 Direct Care Worker Characteristics
Average wages of direct care workers varied greatly with the characteristics of direct care
workers. Those providers who employed a higher percentage of Hispanic/Latino direct care
workers, had a lower percentage of minority direct care workers, had a higher percentage of
direct care workers with higher levels of education, and were more likely to offer any fringe
benefit paid higher wages to their direct care workers than the average wages for direct
care workers overall.
Weighting the average wages offered to direct care workers by the number of providers,
long-term care providers who employed a higher percentage of Hispanic/Latino direct care
workers paid higher ($11.33 an hour) wages than the average wages overall. Providers with
a lower percentage of minority direct care workers reported higher ($11.41 an hour) wages
than the average wages for direct care workers as well as those providers with a higher
number of minority direct care workers ($10.78 an hour). Providers who employed a higher
percentage of direct care workers with higher levels of education (higher than the median
education level reported) also paid higher average wages to their direct care workers
($11.26 an hour) than the average wage and those with direct care workers with lower
levels of education ($11.06 an hour).
Providers that required at least 75 hours of training for their direct care workers also paid
higher average rates to their direct care workers at $11.62 an hour compared to the
average rate and those who required less training for their direct care workers ($10.93 an
hour). Providers who offered any fringe benefit to their direct care workers (i.e., health
insurance with family coverage, health insurance for employee only, paid personal time off,
paid holidays, retirement benefits, or employer-sponsored life insurance) also paid higher
average wages to their direct care workers than the average wages to direct care workers
overall. The providers who reported providing employer-sponsored life insurance paid the
4-35

Wages, Fringe Benefits, and Turnover for Direct Care Workers Working for Long-Term Care Providers in Oregon
highest average wage ($11.69 an hour) compared to the average wages associated with
other fringe benefit offerings.
Weighting the average wages offered to direct care workers by the number of direct care
workers employed by the provider, the long-term care providers who employed a higher
percentage of Hispanic/Latino direct care workers paid higher ($12.72 an hour) wages than
the average wages overall and those providers who had less service users with
Hispanic/Latino ethnicity ($12.07 an hour). Providers with a lower percentage of minority
direct care workers reported higher ($13.00 an hour) wages than the average wages for
direct care workers as well as those providers with a higher percentage of minority direct
care workers ($11.68 an hour). Providers who employed a higher percentage of direct care
workers with higher levels of education (higher than the median education level reported)
also paid higher average wages to their direct care workers ($12.65 an hour) than the
average wage and those with direct care workers with lower levels of education ($12.32 an
hour).
Providers that required at least 75 hours of training for their direct care workers also paid
over a dollar an hour higher average rates to their direct care workers at $13.72 an hour
compared to the average payment rate and more than those who required less training for
their direct care workers ($11.73 an hour). Providers who offered any fringe benefit to their
direct care workers (i.e., health insurance with family coverage, health insurance for
employee only, paid personal time off, paid holidays, retirement benefits, or employer-
sponsored life insurance) also paid higher average wages to their direct care workers than
the average wages to direct care workers overall. The providers who reported providing
employer-sponsored life insurance paid the highest average wage ($13.02 an hour)
compared to the average wages associated with other fringe benefit offerings.
4.6 Predictors of Wages for Long-Term Care Direct Care Workers
Table 4-13 presents the results of a multivariate analysis of wages paid to direct care
workers. The analysis was conducted pooling all long-term care providers. The table
provides information on which factors affect the level of wages paid to direct care workers in
Oregon holding other factors constant. The analysis focuses on certain characteristics of
long-term care providers that may influence wages, including the types of providers as well
as their ownership, size, location, and requirements around training for direct care workers.
Other factors that were accounted for include the ethnicity, race, and education levels of the
direct care workers, as well as the service users’ age and primary payer source for services
received.
4.6.1 Long-Term Care Provider Factors
Among the long-term care provider factors included in the analysis, certain long-term care
provider types, privately nonprofit ownership, and higher training requirements had a
4-36

Section 4 — Wages Provided to Direct Care Workers Employed by Long-Term Care Providers
statistically significant positive effect on wages paid to direct care workers. Although most
provider types were not statistically significant predictors of wages, nursing facilities and
adult foster care homes for the aged and individuals with physical disabilities (AFCs-APD)
were statistically significant positive predictors of wages (p<0.0001 for nursing facilities;
p=0.0002 for AFCs-APD).
For-profit and non-profit providers also significantly paid their direct care workers more than
long-term care providers who were owned by a government entity (p<0.0001, private non-
profit; p=0.0012, private for-profit). Providers that required that their direct care worker
staff have at least 75 hours of training or more also had higher wages compared to those
providers who did not require as much training (p<0.0001). Larger providers who served
more service users than other long-term care providers also had higher wages than smaller
providers (p<0.0001). The one provider characteristic factor that had a statistically
significantly decreasing effect on direct care worker wages was location in micropolitan
areas (p=0.0033).
Table 4-13. OLS Regression of Average Wages, Total Providers, 2014
Variables Coefficient P-Value
Type of Provider
Nursing Facility 4.9716 <.0001
Residential Care APD -0.1546 0.7777
Residential Care DD Adult 0.2905 0.5163
Adult APD 1.9867 0.0002
Adult DD 1.0682 0.0452
Assisted Living Facility APD -0.0617 0.9056
In Home Care Agency -0.1032 0.8354
Adult Day Services APD 0.4061 0.7314
IC Specialized Living 0.2554 0.9070
Specialized Living Services 1.4355 0.3287
Type of Ownership
Private, nonprofit organization 1.6996 <.0001
Private, for profit organization 1.2192 0.0012
Government - federal, state, county, or local 0.0000
Part of Corporate Chain Ownership
Yes 0.2376 0.0835
No 0.0000
Proportion of Direct Care Workers Who are Hispanic/ Latino 0.0113 <.0001
Proportion of Direct Care Workers Who are Nonwhite -0.0130 <.0001
(continued)
4-37

Wages, Fringe Benefits, and Turnover for Direct Care Workers Working for Long-Term Care Providers in Oregon
Table 4-13. OLS Regression of Average Wages, 2014 (continued)
Variables Coefficient P-Value
Proportion of Beneficiaries Who Have Their Care Paid by Medicaid
-0.0101 <.0001
Proportion of Beneficiaries Who Are Over Age 65 -0.0009 0.7495
Number of Beneficiaries 0.0050 <.0001
Proportion of Direct Care Workers With More Than a High School Education
0.0033 0.5486
Whether the Provider Requires 75 or More Hours of Training
Yes 0.6990 <.0001
No 0.0000
Whether the Provider is Rural
Metropolitan 0.1009 0.6097
Micropolitan -0.7071 0.0033
Non-Metropolitan/Non-Micropolitan 0.0000
Note: Unit of analysis is direct care worker
Note: Include providers <30 (Adult day services, IC Specialized Living, and Specialized living services
*Coefficients significant at p<.05
Source: RTI International analysis of the 2014 Oregon Wage and Fringe Benefit Survey of Long-Term Care (LTC) Providers.
4.6.2 Direct Care Worker Factors
Among the direct care worker factors included in the analysis, the ethnicity and race of the
direct care workers significantly affected the wages provided to direct care workers overall.
Providers who had higher proportions of direct care workers who were Hispanic/Latino were
significantly more likely to pay higher wages than those providers with lower proportions of
direct care workers who were Hispanic/Latino (p<0.0001). On the other hand, providers
who had higher proportions of direct care workers who were minorities were significantly
more likely to have lower wages (p<0.0001). In contrast to the training discussed above,
education levels of direct care workers had no significant effect on wages.
4.6.3 Service User Factors
The service user factor that had a significant effect on the wages offered to direct care
workers was the source of payment for services provided. Providers who had a higher
proportion of service users who used Medicaid as their primary payer for services
statistically significantly paid less to direct care workers than those providers with lower
proportions of Medicaid service users (p<0.0001). The proportion of providers who served
more individuals who were age 65 and older did not have a significant effect on the wages
paid to direct care workers compared to providers who served a lower proportion of
individuals age 65 and older.
4-38

5. PROVISION OF FRINGE BENEFITS TO DIRECT CARE WORKERS
This chapter presents information on the offer and use of various fringe benefits by long-
term care providers and of their use by direct care workers, currently and between 2010-
2014. Fringe benefits analyzed include health insurance: family and employee only; paid
time off: personal vacation time or sick leave and paid holidays; retirement benefits such as
a 401(k) or 403(b); and/or life insurance. Fringe benefits can be offered to both full time
and part-time employees. We present information for both categories including the monthly
minimum average hours a part-time direct care worker must work to obtain each benefit.
The data are presented first across all providers next sequentially by each individual
provider in the table. Highlights Box 3 summarizes the main findings of this chapter.
Highlights Box 3: Provision of Fringe Benefits to Direct Care Workers
• Provision of fringe benefits varies greatly among long-term care providers. As expected, the offer of fringe benefits is much more common for full-time employees than for part-time workers. Where offered to part-time workers, they generally must work a quarter-to-half time to qualify for benefits.
• The most commonly offered fringe benefit is paid personal time off (60.21%), followed by paid holidays (45.60%), employee-only health insurance (41.90%), health insurance with family coverage (34.03%), retirement plan (33.81%), and life insurance (30.97). Nursing facilities, assisted living facilities, and residential care facilities for adults with developmental disabilities offer benefits to a substantial portion of direct care workers; in home care agencies and adult foster care facilities offer few benefits. For providers in operation in 2014, a greater proportion of long-term care providers offered various fringe benefits in 2014 than they did in 2010.
• Direct care worker participation in fringe benefits varies greatly by the type of fringe benefit. Fringe benefits that typically require an employee financial contributions, such as health insurance, retirement benefits, and life insurance, have low participation rates. For example, while about 31% (30.85%) of long-term care providers offer some type of retirement benefits, only about 15% (14.25%) of direct care workers participate. Conversely, participation rates for “free” benefits are much higher. For example, about 56% (56.06%) of providers offered personal time off and almost two-thirds of (65.17%) direct care workers used the benefit.
• Various provider characteristics are associated with offering fringe benefits. While the effect varies by fringe benefit, in general, government providers, chains, providers with a higher proportion of Medicaid beneficiaries, providers serving people with intellectual disabilities, providers with a higher proportion of Hispanic/Latino direct care workers, providers with a lower proportion of minority service users, providers serving younger people with disabilities, providers requiring higher levels of training, and providers that pay direct care workers higher wages are more likely to offer fringe benefits.
• The relationship between provider characteristics and enrollment or use of fringe benefits by direct care workers is complicated and the effects are not as consistent. In general, direct care workers employed by providers that have nonprofit or government ownership, are owned by chains, have a lower proportion of Medicaid beneficiaries, provide services to people with intellectual disabilities, provide services to a lower proportion of minority direct care workers, have a high proportion of minority beneficiaries, provide services primarily to younger people, with disabilities, provide services to a larger number of service users, employ a more educated workforce, require more training and pay direct care workers a higher wage are more likely to have direct care workers that enroll or use fringe benefits.
5-1

Wages, Fringe Benefits, and Turnover for Direct Care Workers Working for Long-Term Care Providers in Oregon
• In a multivariate analysis of factors associated with the offering of paid time off, the following variables were statistically significantly associated with an increase in the probability that providers would offer the benefit include: nonprofit ownership (compared to government ownership), for-profit ownership (compared to government ownership), chain ownership, larger providers, requiring 75 hours or more of training, metropolitan location. Statistically significant variables associated with a reduction in the probability that providers would offer the benefit include: proportion of direct care workers who are minority and providers who pay their workers less.
5.1 Current Provision of Fringe Benefits by LTC Provider Type
5.1.1 Introduction
Figure 5-1 and Table 5-1 presents information on the percentage of long-term care
providers that offered either employee-only health insurance or paid time off their direct
care workers in 2014, by type of provider. Nursing facilities, assisted living facilities:
aged/physical disabilities, and residential care facilities: developmental disabilities were
most likely to offer fringe benefits; both types of adult foster care and in-home care
agencies were least likely to offer fringe benefits.
Three quarters of providers (75.07%) reported they provided some fringe benefit to their
direct care workers. Paid, personal time off (vacation or sick leave) was offered by the
highest proportion of providers to their full-time and part-time direct care workers
compared to all other benefits in 2014. A higher proportion of Nursing Facilities generally
provided all fringe benefits to their full-time direct care workers compared to all other
provider types. AFCs-APD and AFCs-DD providers were least likely to have offered all
benefits to their full-time direct care workers compared to all other providers. For part-time
direct care workers, a higher percentage of ALFs-APD offered health insurance both with
family coverage and for the employee compared to all other provider types. A higher
percentage of nursing facilities, compared to all provider types, offered all other fringe
benefits to their part-time direct care workers. A lower proportion of AFCs-APD and AFCs-
DD offered any of the fringe benefits described in Figure 5-1 to their part-time direct care
workers compared to all other providers.
5-2

Section 5 — Provision of Fringe Benefits to Direct Care Workers
Figure 5-1. Offer of Employee-Only Health Insurance and Personal Paid Time Off to Direct Care Workers, by Provider Type, 2014
Note: Unit of analysis is provider. No columns for Adult Day Services and Specialized Living Facilities because there were <30 responses, but they are included in total column. Data on Residential Care Facilities with Contract Rates Residential Care Facilities for Children with Developmental Disabilities, and Supportive Living Services for Individuals with Developmental Disabilities are included in Appendix D. “Any fringe benefit” includes: health insurance: family and employee only; paid time off: personal vacation time or sick leave and paid holidays; retirement benefits such as a pension plan such as a 401(k) or 403(b); and/or life insurance.
Source: RTI International analysis of the 2014 Oregon Wage and Fringe Benefit Survey of Long-Term Care (LTC) Providers.
42
86
46
85
6 6
77
25
60
100
84
98
2528
96
44
0
20
40
60
80
100
Dire
ct C
are
Wor
kers
Ben
efits
Health Insurance for Employee Only
Paid Personal Time Off, Vacation Time, or Sick Leave
5-3

Wag
es, Fringe B
enefits, an
d T
urn
over fo
r Direct C
are Workers W
orkin
g fo
r Lo
ng-T
erm C
are Provid
ers in O
regon
5-4
Table 5-1. Offer of Fringe Benefits to Direct Care Workers, by Provider Type, 2014
Direct Care Worker Benefits
Total Across All Providers
Nursing Facility
Residential Care Facilities Adult Foster Care Homes
Assisted Living Facility: Aged/
Physical Disabilities
In-Home Care
Agency
Aged/ Physical
Disabilities
Residential Care: Adults/
Developmental Disabilities
Aged/ Physical
Disabilities
Adult Foster Care:
Developmental Disabilities
Total Number of Providers 2,867 138 101 765 987 433 178 63
Health Insurance with Family Coverage
Percent offer to full-time direct care workers
34.03 91.53 46.25 64.56 3.09 2.32 70.86 25.00
Percent offer to part-time direct care workers
9.19 19.49 8.75 11.39 2.06 0.99 29.80 11.54
Average minimum required hours per month to receive benefit for part-time employees (mean minimum hours required)
87.82 71.61 54.71 110.97 61.67 76.67 55.03 116.67
Health Insurance for Employee Only
Percent offer to full-time direct care worker
41.90 86.44 46.25 85.17 6.19 5.96 77.48 25.00
Percent offer to part-time direct care workers
11.08 19.49 11.25 18.44 1.55 1.99 31.13 7.69
Average minimum required hours per month to receive benefit for part-time employees (mean minimum hours required)
83.80 79.57 53.00 92.17 40.50 116.20 60.98 73.50
(continued)

5-5
Sectio
n 5
— Pro
vision o
f Fringe B
enefits to
Direct C
are Workers
Table 5-1. Offer of Fringe Benefits to Direct Care Workers, by Provider Type, 2014 (% of providers) (continued)
Direct Care Worker Benefits
Total Across All Providers
Nursing Facility
Residential Care Facilities Adult Foster Care Homes
Assisted Living Facility: Aged/
Physical Disabilities
In-Home Care
Agency
Aged/ Physical
Disabilities
Residential Care: Adults/
Developmental Disabilities
Aged/ Physical
Disabilities
Adult Foster Care:
Developmental Disabilities
Paid Personal Time Off, Vacation Time, or Sick Leave
Percent offer to full-time direct care workers
60.21 100.00 83.75 97.65 24.74 28.48 96.03 44.23
Percent offer to part-time direct care workers
37.56 74.58 52.50 66.55 6.19 16.89 69.54 36.54
Average minimum required hours per month to receive benefit for part-time employees (mean minimum hours required)
47.82 43.16 53.81 45.68 54.09 50.45 43.32 38.56
Paid Holidays
Percent offer to full-time direct care workers
45.60 77.97 65.00 77.22 15.98 18.54 74.83 34.62
Percent offer to part-time direct care workers
30.66 60.17 51.25 49.91 7.73 11.92 58.94 25.00
Average minimum required hours per month to receive benefit for part-time employees (mean minimum hours required)
40.02 33.15 36.03 40.98 32.08 54.27 39.52 27.17
(continued)

Wag
es, Fringe B
enefits, an
d T
urn
over fo
r Direct C
are Workers W
orkin
g fo
r Lo
ng-T
erm C
are Provid
ers in O
regon
5-6
Table 5-1. Offer of Fringe Benefits to Direct Care Workers, by Provider Type, 2014 (% of providers) (continued)
Direct Care Worker Benefits
Total Across All Providers
Nursing Facility
Residential Care Facilities Adult Foster Care Homes Assisted Living
Facility: Aged/
Physical Disabilities
In-Home Care
Agency
Aged/ Physical
Disabilities
Residential Care: Adults/
Developmental Disabilities
Aged/ Physical
Disabilities
Adult Foster Care:
Developmental Disabilities
Pension, or a 401(k) or 403(b)
Percent offer to full-time direct care workers
33.81 85.59 40.00 68.35 2.06 1.32 70.86 21.15
Percent offer to part-time direct care workers
19.97 61.86 21.2D5 35.26 1.55 1.66 42.38 21.15
Average minimum required hours per month to receive benefit for part-time employees (mean minimum hours required)
43.47 39.36 43.92 39.67 80.00 25.25 71.74 47.88
Life Insurance
Percent offer to full-time direct care workers
30.97 81.36 27.50 67.99 0.52 0.99 56.95 9.62
Percent offer to part-time direct care workers
13.23 37.29 11.25 24.95 0.52 0.66 28.48 5.77
Average minimum required hours per month to receive benefit for part-time employees (mean minimum hours required)
76.06 53.45 51.25 82.78 80.00 50.00 58.41 94.00
Note: Providers are the unit of analysis. No columns for Adult Day Services and Specialized Living Facilities because there were <30 responses, but they are included in total column Data on Residential Care Facilities with Contract Rates Residential Care Facilities for Children with Developmental Disabilities, and Supportive Living Services for Individuals with Developmental Disabilities are included in Appendix D.
Source: RTI International analysis of the 2014 Oregon Wage and Fringe Benefit Survey of Long-Term Care (LTC) Providers.

Section 5 — Provision of Fringe Benefits to Direct Care Workers
5.1.2 Overall
Health Insurance: Family Coverage and Employee Only
One third (34.09%) of all providers with direct care workers reported offering health
insurance with family coverage to full-time employees. A somewhat higher proportion of
providers (41.90%) reported offering health insurance coverage only for the employee.
About 10% of providers indicated they provide health insurance with family coverage
(9.19% of providers) or employee only health insurance (11.08% of providers) to part-time
employees. Part-time direct care workers were required to work a monthly minimum
average of 87.82 hours to receive family coverage while 83.80 hours is the monthly
minimum average required for employee-only health insurance. Thus, part-time employees
had to work about half-time to receive the offered of health insurance benefits.
Paid Time Off: Personal Time (Vacation and Sick) and Paid Holidays
Across all providers, paid, personal time for vacation time or sick time off was the most
frequently reported fringe benefit providers offered to their direct care workers. More than
half (60.21%) of providers offered this benefit to their full-time direct care workers. Fewer
providers (37.56%), however, offered this benefit to part-time workers. The monthly
minimum average number of hours per month providers reported as the minimum to
receive this benefit was 47.82, equal to a part-time schedule of about 10 hours per week.
Paid holidays was the second most common fringe benefit reported by providers. Again,
more providers (45.60%) offered this benefit to full time direct care workers compared to
approximately a third (30.66%) of providers offering this benefit to part-time direct care
workers. Providers reported that their direct-care workers were required to work a monthly
minimum average of about 40 hours per month (40.02 hrs.) to be eligible for paid holidays,
again roughly 10 hours a week.
Retirement Benefits: Pension, 401(k) or 403(b)
Only approximately a third of providers (33.81%) offered retirement benefits to full-time
direct care workers. Fewer part-time workers are offered retirement benefits by providers
(19.97%). Part-time direct care workers were required to work a monthly minimum average
of 43.47 hours to receive this benefit.
Life Insurance
Similar to retirement benefits, life insurance is only offered to full-time direct care workers
by about a third (30.97%) of providers. Just over 10% of providers offered life insurance to
part-time direct care workers. The monthly minimum average number of hours providers
require for life insurance, 76.06 hours, is close to a 0.5 full-time equivalent (FTE) position.
5-7

Wages, Fringe Benefits, and Turnover for Direct Care Workers Working for Long-Term Care Providers in Oregon
5.1.3 Nursing Facilities
Health Insurance: Family Coverage and Employee Only
Almost all nursing facilities (91.53%) reported that they offered health insurance with family
coverage to their full-time direct care workers. Fewer nursing facilities (86.44%), reported
offering employee only coverage to their full-time staff. The same percentage of facilities,
about 20% (19.49%), reported offering both health insurance with family coverage and
employee only health insurance to part-time direct care workers. Nursing facilities require a
monthly minimum average of about 70 hours (70.61 hrs.) for part-time direct care workers
to receive family coverage compared to about 80 hours (79.57 hrs.) for employee only
coverage. Thus, part-time employees need to work roughly half time to qualify for health
insurance.
Paid Time Off: Personal Time (Vacation and Sick) and Paid Holidays
All nursing facilities reported that they offered paid, personal time off (sick or vacation) to
their full-time direct care workers. In contrast, about 25% fewer nursing facilities (77.97%)
offered direct care workers the benefit of paid holidays. A smaller proportion of nursing
facilities offered both personal time and paid holidays to their part-time direct care workers
(74.58% and 60.17%, respectively). Nursing facilities reported that direct care workers
were required to work a monthly minimum average of 43.16 hours to receive personal time
off compared to 33.15 hours to receive paid holidays.
Retirement Benefits: Pension, 401(k) or 403(b)
A large majority of nursing facilities (85.59%) offered retirement benefits to their full-time
direct care workers. Just under two-thirds of nursing facilities (60.86%) offered this benefit
to these staff. Nursing facilities reported that direct care workers were required to work a
monthly minimum average of 39.36 hours to receive retirement benefits.
Life Insurance
Similar to retirement benefits, a large share of nursing facilities (81.36%) offered life
insurance to their full-time direct care workers. In contrast, only about a third of nursing
facilities (37.29%) reported offering life insurance to their part-time direct care workers.
Part-time direct care workers were required to work a monthly minimum average of 53.45
hours to receive this benefit.
5.1.4 Residential Care Facility: Aged and Physically Disabled
Health Insurance: Family Coverage and Employee Only
Less than half of RCFs-APD (46.25%) offered health insurance with family coverage or
employee only health insurance to their full-time direct-care workers. Very few (8.75%)
RCFs-APD offered family coverage to their part-time direct care workers while employee-
5-8

Section 5 — Provision of Fringe Benefits to Direct Care Workers
only insurance is offered to part-time direct care workers by slightly higher proportion of
facilities (11.25%). Part-time direct care workers were required to work a monthly minimum
average of 54.71 hours to receive the family coverage benefit which is similar to the 53.00
hours required for employee-only health insurance.
Paid Time Off: Personal Time (Vacation and Sick) and Paid Holidays
A large majority of RCFs-APD (83.75%) reported that they offered paid, personal time off to
full-time direct care workers. More than half (52.50%) of these providers also reported that
they also offered paid, personal time off to their part-time workers. More than half of RCFs-
APD offered paid holidays to full-time and part-time direct-care workers (65.00% and
51.25%, respectively). Part-time direct care workers were required to work a minimum of
53.81 hours per month to receive personal time off and fewer hours, 36.03 hour, to receive
paid holidays.
Retirement Benefits: Pension, 401(k) or 403(b)
Two-fifths (40.00%) of RCFs-APD offered retirement benefits to their full-time direct care
workers while just a fifth (21.25%) offered this benefit to their part-time direct care
workers. Part-time direct care workers were required to work a monthly minimum average
of 43.93 hours per month to receive this benefit.
Life Insurance
Only about a quarter (27.50%) of RCFs-APD offered life insurance to their full-time direct
care workers. Similarly, fewer RCFs-APD offered this benefit to their part-time direct care
workers (11.25%). Part-time direct care workers were required to work a monthly minimum
average of 51.25 hours per month to receive life insurance.
5.1.5 Residential Care Facility: Individuals with Developmental Disabilities
Health Insurance: Family Coverage and Employee Only
About two-thirds (64.56%) of RCFs-DD offered health insurance with family coverage to
their direct care workers. About 10% (11.39%) offered this benefit to their part-time
workers. Facilities reported that part-time direct care workers were required to work a
minimum average of 110.97 hours per month to receive this benefit, which is approximately
70% time. Eighty-five percent (85.17%) of RCFs-DD offered employee-only health
insurance to their full-time direct care workers. Almost 20% (18.17%) of RCFs-DD offered
this benefit to their part-time direct care workers. Part-time direct care workers were
required to work a monthly minimum average of 92.17 hours per month to receive this
benefit, which is approximately 60% time.
5-9

Wages, Fringe Benefits, and Turnover for Direct Care Workers Working for Long-Term Care Providers in Oregon
Paid Time Off: Personal Time (Vacation and Sick) and Paid Holidays
Almost all (97.65%) RCFs-DD offered paid personal time off to their full-time direct care
workers. Two-thirds of these facilities (66.55%) offered this benefit to their part-time direct
care workers. Part-time direct care workers were required to work an average of 45.68
hours to receive personal time off. About three quarters (77.22%) of RCFs-DD offered paid
holidays to their full-time direct care workers; about half (49.91%) offered this benefit to
part-time direct care workers. Part-time direct care workers were required to work a
monthly minimum average of 40.98 hours per month to receive paid holidays.
Retirement Benefits: Pension, 401(k) or 403(b)
Retirement benefits were offered to full-time direct care workers by about two-thirds
(68.35%) of RCFs-DD. About a third of facilities (35.26%) offered this benefit to their part-
time direct care workers. Part-time direct care workers were required to work a monthly
minimum average of 40 hours (39.67) per month to receive paid holidays.
Life Insurance
Two-thirds of RCFs-DD (67.99%) offered life insurance to full-time direct care workers. A
quarter (24.95%) offered this benefit to their part-time direct care workers. Part-time direct
care workers were required to work a monthly minimum average of 82.78 hours per month
to receive this benefit.
5.1.6 Adult Foster Care: Aged/Physical Disabilities
Health Insurance: Family Coverage and Employee Only
Few AFCs-APD offered health insurance with family coverage to their direct care workers or
to their part-time workers (3.09% and 2.06%, respectively). Part-time direct care workers
were required to work a monthly minimum average of 61.67 hours per month to receive
this benefit. Very few ACFs-APD also offered employee only health insurance to their full-
time and part-time direct care workers. Six percent (6.19%) offered this benefit to full-time
direct care workers and less than 2% (1.55%) offered it to part-time direct care workers.
Part-time direct care workers were required to work a monthly minimum average of about
40 hours (40.50 hrs.) hours per month, or about 10 hours per week, to receive employee
only health insurance.
Paid Time Off: Personal Time (Vacation and Sick) and Paid Holidays
A larger proportion of AFCs-APD (24.75%) offered personal time off to their full-time direct
care workers compared to other fringe benefits. In contrast, about 6% (6.19%) of AFCs-
APD offered this benefit to their part-time direct care workers. Part-time direct care workers
were required to work a monthly minimum average of 54.09 hours per month to receive
employee only health insurance. A lower proportion of AFCs-APD offered paid holidays to
their full-time direct care workers (15.98%). About 8% (7.73%) offered paid holidays to
5-10

Section 5 — Provision of Fringe Benefits to Direct Care Workers
part-time direct care workers who were required to work a monthly minimum average of
32.08 hours per month to receive paid holidays.
Retirement Benefits: Pension, 401(k) or 403(b)
Almost no AFCs-APD reported offering retirement benefits to their full-time or part-time
direct care workers. Two percent (2.06%) offered this benefit to full-time direct care
workers; similarly, about 2% offered this benefit to their part-time direct care workers.
Part-time direct care workers were required to work a monthly minimum average of 80
hours per month to receive this benefit.
Life Insurance
Less than 1% of AFCs-APD offered life insurance to full-time and part-time direct care
workers (0.52% for both benefit categories). Similarly to the requirements for retirement
benefits, part-time workers were required to work a monthly minimum average of 80 hours
per month to receive life insurance.
5.1.7 Adult Foster Care: Developmental Disabilities
Health Insurance: Family Coverage and Employee Only
Very few AFCs-DD offered health insurance to their direct care workers. Only 2% of AFCs-
DD (2.32%) offered family health insurance coverage to their full-time direct care workers.
Less than 1% (0.99%) offered this benefit to part-time direct care workers. Part-time direct
care workers were required to work a monthly minimum average of 76.27 hours per month
to receive this benefit. Six percent of AFCs-DD (6.19%) offered employee-only health
insurance to full-time direct care workers, while only 2% (1.99%) offered it to their part-
time direct care workers. AFCs-DD reported that part-time direct care workers were
required to work a monthly minimum average of 116 hours per month to receive this
benefit.
Paid Time Off: Personal Time (Vacation and Sick) and Paid Holidays
About one-quarter (28.48%) of AFCs-DD offered paid, personal time off to their full-time
direct care workers. About 17% (16.89%) offered paid, personal time off to their part-time
direct care workers. Part-time direct care workers were required to work a monthly
minimum average of 50.45 hours per month to receive this benefit. Close to 20% (18.54%)
of AFCs-DD offered paid holidays to their full-time direct care workers, while only 12%
(11.92%) offered this benefit to their part-time direct care workers. Part-time direct care
workers were required to work a monthly minimum average of 54.27 hours per month to
receive this benefit.
5-11

Wages, Fringe Benefits, and Turnover for Direct Care Workers Working for Long-Term Care Providers in Oregon
Retirement Benefits: Pension, 401(k) or 403(b)
AFCs-DD, similar to AFCs-APD, did not offered retirement benefits to their full-time or part-
time direct care workers. Less than 2% of AFCs-DD offered this benefit to both full-time
(1.32%) and part-time direct care workers (1.66%). Part-time direct care workers were
required to work a monthly minimum average of 25.25 hours per month to receive this
benefit.
Life Insurance
Less than 1% of AFCs-DD offered life insurance to full-time or part-time direct care workers
(0.99% and 0.66%, respectively). Part-time direct care workers were required to work a
minimum average of 50.00 hours per month to receive this life insurance.
5.1.8 Assisted Living Facility: Aged/Physical Disabilities
Health Insurance: Family Coverage and Employee Only
Seventy-one percent (70.86) of ALFs-APD offered health insurance with family coverage to
their full-time direct care workers while a slightly higher proportion of ALFs-APD (77.48%)
offered employee only health insurance to their direct care workers. Family coverage and
employee-only insurance were offered by about a third of ALFs-APDs (29.80% and 31.13%,
respectively) to their part-time direct care workers. Part-time workers were required to
work a monthly minimum average of 55.03 hours for health insurance with family coverage
and an average of 60.98 hours for employee-only health insurance.
Paid Time Off: Personal Time (Vacation and Sick) and Paid Holidays
Almost all (96.03%) ALFs-APD offered personal time off to their full-time direct care
workers. A lower proportion of ALFs-APD (75.83%) offered paid holidays to these same
staff. A lower proportion of ALFs-APD offered personal time and paid holidays to their part-
time direct care workers (69.54% and 58.94%, respectively). The monthly, minimum
average hours required by ALFs-APD for part-time direct care workers to receive these
benefits is about 40 hours for both categories of paid time off (43.32 and 39.52 hrs.).
Retirement Benefits: Pension, 401(k) or 403(b)
Seventy-one percent (70.86%) of ALFs-APD offered retirement benefits to direct care
workers. Far fewer ALFs-APD (42.38%) offered retirement benefits. Part-time direct care
workers were required to work a monthly, minimum average of 71.74 hours per month to
receive this benefit.
Life Insurance
Over half (56.95%) of ALFs-APD offered life insurance to their full-time direct care workers
and only a quarter (28.48%) offered this benefit to their part-time direct care staff. Part-
5-12

Section 5 — Provision of Fringe Benefits to Direct Care Workers
time direct care workers were required to work a monthly minimum average of 58.41 hours
per month to receive this benefit.
5.1.9 In-Home Care Agency
Health Insurance: Family Coverage and Employee Only
A quarter (25.00%) of in-home care agencies offered health insurance, including health
insurance with family coverage or employee only coverage, to their full-time direct care
workers. Close to 12% (11.54%) of these providers offered part-time direct care workers
family coverage health insurance. Only 8% (7.69%) of in-home care agencies offered
employee-only health insurance. The monthly minimum average hours that part-time direct
care staff must work to obtain either benefit is about the same, 55.09 hours for family
health insurance and 60.98 hours for employee only health insurance.
Paid Time Off: Personal Time (Vacation and Sick) and Paid Holidays
Less than half (44.23%) of in-home care agencies offered paid time off to their full-time
direct care workers. Only a third (34.62%) offered paid holidays to these same staff. A
lower proportion of facilities provided part-time staff with either personal time or paid
holidays (36.54% and 25.00%). Part-time direct care workers were required to work a
minimum average of 38.56 hours per month to receive paid personal time off and 27.17
hours to receive paid holidays.
Retirement Benefits: Pension, 401(k) or 403(b)
A fifth (21.15%) of in-home care agencies offered retirement benefits to their full-time or
part-time direct care workers. Part-time direct care workers were required to work a
monthly minimum average of 47.88 hours per month to receive this benefit.
Life Insurance
Even fewer in-home care agencies provided life insurance to their full-time or part-time
direct care workers compared to retirement benefits. Ten percent of agencies (9.62%)
provided this benefit to their full-time staff and about 6% (5.77%) provided this to their
part-time staff. Part-time direct care workers were required to work a monthly minimum
average of 94.00 hours per month to receive this benefit.
5.2 Prior Coverage and Take-up of Fringe Benefits by LTC Provider Type
5.2.1 Introduction
Tables 5-2a through-5-2h and Table 5-3 present data on fringe benefits offered by long-
term care providers from 2010 to 2014. Providers also supplied information on the
proportion of their direct care staff that used the benefits that they offered. Tables 5-2a
through-5-2h present the data by provider type and Table 5-3 presents the data for all
5-13

Wages, Fringe Benefits, and Turnover for Direct Care Workers Working for Long-Term Care Providers in Oregon
providers. The fringe benefit categories are (1) health insurance: family and employee only;
(2) paid time off: personal vacation time or sick leave and paid holidays; (3)retirement
benefits such as a pension plan such as a 401(k) or 403(b); and (4) life insurance. We do
not separate full-time and part-time direct care staff for this analysis. The data is weighted
by long-term care provider type.
The total number of direct care workers among all providers who were in operation in 2014
increased from 27,095 in 2010 to 36,685 in 2014 which represents a 35% (35.39%)
increase. Nursing homes increased their total direct care workers by 81% (80.79%) from
2,566 direct care workers in 2010 to 4,640 in 2014. RCFs-APD also had an increase in direct
care workers from 2010 to 2014 (1,180 and 1,810, respectively) in 2014. RCFs-DD also
increased their total number of direct care workers from 2010 to 2014 although the percent
change (16.30%) was relatively small (6,603 and 7,679, respectively) in comparison to
other providers. AFCs-APD increased their total direct care workers by 194% (193.98%)
from 1,608 direct care workers in 2010 to 4,727 in 2014. This represents the largest
percent increase of direct care workers from 2010 to 2014 by any OR provider type. AFCs-
DD, in comparison, had a reduction in the total number of direct care workers in 2010
(1,608) compared to 2014 (1,426). ALFs-APD increased their total direct care workers by
80% (80.80%) from 2,566 direct care workers in 2010 to 4,640 direct care workers in
2014. In home care agencies also experienced growth from 2,880 direct care workers in
2010 to 4,719 in 2014, a 63.86% increase.
5.2.2 Overall
Health Insurance: Family Coverage and Employee Only
Table 5-2a shows that the proportion of providers operating in 2014 that offered health
insurance to their direct care workers increased from 2010 to 2014. In 2010, 24%
(24.19%) of providers offered family health insurance coverage compared to 32% (31.77%)
in 2014. Employee-only insurance was also offered by slightly more providers across all 5
years and had an 11% increase from 2010-2014 (28.96% in 2010 to 36.65% in 2014). A
much lower percentage of direct care workers enrolled in health insurance with family
coverage in 2014 compared to employee-only health insurance (8.73% and 30.51%,
respectively); this percentage remained roughly constant over the past 5 years, although
individual coverage spiked in 2014.
Paid Time Off: Personal Time off (Vacation and Sick) and Paid Holidays
Looking at the years 2010 to 2014, more providers historically offered the benefit of paid
time off, including paid, personal time off and paid holidays compared to all other fringe
benefit categories. Across all 5 years, a higher percentage of providers have consistently
offered personal time off to their direct care workers compared to paid holidays. In 2010, 40
percent (39.21%) of providers offered personal time off compared to 56% (56.06%) of
5-14

Section 5 — Provision of Fringe Benefits to Direct Care Workers
providers in 2014 (an increase of about 17%). In 2010, over half (53.04%) of direct care
workers used paid, personal time off which increased in 2014 to almost two thirds (65.17%)
of direct care workers.
The proportion of providers offering paid holidays increased over time although there was a
smaller increase in the proportion of direct care workers using the benefit overtime. Over a
quarter (27.84%) of providers offered paid holidays to direct care workers in 2010
compared to two fifths (39.88%) of providers in 2014. In 2010, 41% (40.83%) of direct
care workers used this benefit compared to almost half (48.24%) in 2014.
Retirement Benefits: Pension, 401(k) or 403(b)
The proportion of providers offering retirement benefits increased over time although there
was a smaller increase in the proportion of direct care workers using the benefit overtime.
Retirement benefits were offered to direct care workers by about 22% (22.03%) of
providers in 2010 and 31% (30.85%) of providers in 2014. Few direct care workers were
enrolled in retirement benefits in 2010 or 2014 (9.56% and 14.25%, respectively).
Life Insurance
Among the fringe benefits examined, the smallest proportion of providers offered life
insurance, although the proportion of providers offering this benefit has steadily increased
from 2010 to 2014. About 19% (18.81%) of providers offered life insurance to direct care
workers in 2010 compared to over a quarter (27.06%) of providers in 2014. About a quarter
(23.96%) of direct care workers enrolled in this benefit in 2010 compared to 30% (30.09%)
in 2014.
Table 5-2a. Offer of Fringe Benefits and Enrollment/Use by Direct Care Workers, Across All Providers and All Direct Care Workers, 2010-2014
Year Provider in Operation
All LTC Providers
2010 2011 2012 2013 2014
Total Number of Direct Care Workers 27,095 28,492 31,639 36,430 36,685
Health Insurance with Family Coverage
Percent of providers who offered benefit 24.19 25.52 26.76 28.93 31.77
Percent of direct care workers who enroll/use benefit
6.97 7.19 7.22 6.59 8.73
Health Insurance for Employee Only
Percent of providers who offered benefit 28.96 30.55 32.05 35.49 39.65
Percent of direct care workers who enroll/use benefit
24.98 25.17 25.16 23.43 30.51
(continued)
5-15

Wages, Fringe Benefits, and Turnover for Direct Care Workers Working for Long-Term Care Providers in Oregon
Table 5-2a. Offer of Fringe Benefits and Enrollment/Use by Direct Care Workers, Across All Providers and All Direct Care Workers, 2010-2014
Year Provider in Operation
All LTC Providers
2010 2011 2012 2013 2014
Paid Personal Time Off, Vacation Time, or Sick Leave
Percent of providers who offered benefit 39.21 40.85 44.48 49.97 56.06
Percent of direct care workers who enroll/use benefit
53.04 53.76 51.44 50.42 65.17
Paid Holidays
Percent of providers who offered benefit 27.84 29.62 32.04 35.88 39.88
Percent of direct care workers who enroll/use benefit
40.83 41.41 40.21 39.67 48.24
Pension or 401(k) or 403(b) Account
Percent of providers who offered benefit 22.03 23.38 24.51 26.39 30.85
Percent of direct care workers who enroll/use benefit
9.56 10.95 12.10 11.45 14.25
Employer-sponsored Life Insurance
Percent of providers who offered benefit 18.81 19.46 19.99 21.99 27.06
Percent of direct care workers who enroll/use benefit
23.96 23.99 24.54 22.55 30.09
Note: Unit of analysis is providers for offer of benefit and direct care workers for enrollment/use.
Source: RTI International analysis of the 2014 Oregon Wage and Fringe Benefit Survey of Long-Term Care (LTC) Providers.
5.2.3 Nursing Facilities
Health Insurance: Family Coverage and Employee Only
Table 5-2b shows that in 2010, just over two-thirds of nursing facilities offered family
health insurance or employee only insurance to their full-time direct care workers (67.80%
and 66.95%, respectively). By 2014, the percentage offering family or employee-only
health insurance had increased (85.59% and 83.05%, respectively). The proportion of
direct care workers enrolling in family and employee only coverage increased slightly from
2010 to 2014 with 15% (14.94%) of direct care workers enrolled in family health insurance
in 2010 compared to about 17% (16.65%) in 2014. Although more direct care workers
enrolled in employee-only insurance compared to family coverage, just under a third
(32.11%) of them enrolled in employee only insurance in 2010 with little change in the
percent enrolled in 2014 (37.05%).
Paid Time Off: Personal Time off (Vacation and Sick) and Paid Holidays
Over three quarters (77.12%) of nursing facilities offered personal time off to their direct
care staff in 2010, which increased to almost all nursing facilities (90.68%) by 2014.
5-16

Section 5 — Provision of Fringe Benefits to Direct Care Workers
Despite this increase, the proportion of nursing facility direct care workers using personal
time off has remained about the same in 2010 and 2014 (76.06% and 79.96%,
respectively).
The proportion of nursing facilities that offered paid holidays increased from 2010 to 2014
(57.63% and 70.34%, respectively). Despite this increase, the proportion of direct care
workers using paid holidays has not changed substantially over time, about 61% (61.34%)
used this benefit in 2010 compared to about 65% (64.81%) in 2014.
Retirement Benefits: Pension, 401(k) or 403(b)
Just over two-thirds (68.64%) of nursing facilities in 2010 offered retirement benefits to
their direct care workers, which increased to over three-quarters (77.12%) of nursing
facilities in 2014. The proportion of direct care workers enrolled in this benefit slightly
increased from 2010 to 2014 (14.24% and 18.21%, respectively).
Life Insurance
In 2010, over half (51.69%) of nursing facilities offered life insurance to their direct care
workers, with about 63% (62.71%) of nursing facilities offering the benefit in 2014. The
proportion of direct care workers enrolled in life insurance increased from 31% (31.00%)
enrolled in 2010 to 38% (37.77%) in 2014.
Table 5-2b. Fringe Benefits Offers and Enrollment/Use by Direct Care Workers at Nursing Facilities, 2010-2014
Year Provider in Operation
Nursing Facilities
2010 2011 2012 2013 2014
Total Number of Direct Care Workers 6,957 6,861 6,973 7,569 7,837
Health Insurance with Family Coverage
Percent of providers who offered benefit 67.80 67.80 71.19 73.73 85.59
Percent of direct care workers who enroll/use benefit
14.94 14.91 16.05 15.44 16.65
Health Insurance for Employee Only
Percent of providers who offered benefit 66.95 67.80 71.19 73.73 83.05
Percent of direct care workers who enroll/use benefit
32.11 32.11 33.03 32.34 37.05
Paid Personal Time Off, Vacation Time, or Sick Leave
Percent of providers who offered benefit 77.12 78.81 83.05 83.90 90.68
Percent of direct care workers who enroll/use benefit
76.06 75.42 76.08 76.27 79.96
(continued)
5-17

Wages, Fringe Benefits, and Turnover for Direct Care Workers Working for Long-Term Care Providers in Oregon
Table 5-2b. Fringe Benefits Offers and Enrollment/Use by Direct Care Workers at Nursing Facilities, 2010-2014 (continued)
Year Provider in Operation
Nursing Facilities
2010 2011 2012 2013 2014
Paid Holidays
Percent of providers who offered benefit 57.63 58.47 62.71 64.41 70.34
Percent of direct care workers who enroll/use benefit
61.34 60.59 61.67 61.26 64.81
Pension or 401(k) or 403(b) Account
Percent of providers who offered benefit 68.64 68.64 71.19 73.73 77.12
Percent of direct care workers who enroll/use benefit
14.24 14.78 17.18 17.83 18.21
Employer-sponsored Life Insurance
Percent of providers who offered benefit 51.69 51.69 54.24 56.78 62.71
Percent of direct care workers who enroll/use benefit
31.00 31.84 32.94 32.35 37.77
Note: Unit of analysis is providers for offer of benefit and direct care workers for enrollment/use.
Source: RTI International analysis of the 2014 Oregon Wage and Fringe Benefit Survey of Long-Term Care (LTC) Providers.
5.2.4 Residential Care Facility: Aged and Physically Disabled
Health Insurance: Family Coverage and Employee Only
Table 5-2c shows that just over a quarter (28.75%) of residential care facility: aged and
individuals who are physically disabled (RCFs-APD) offered family coverage insurance to
their direct care workers in 2010 compared to 39% (38.75%) in 2014. Very few RCFs-APD
direct care workers enrolled in health insurance with family coverage from 2010-2014.
About 7% (6.63%) of direct care workers were enrolled in 2010 compared with about 5%
(5.37%) in 2014.
A similar proportion of RCFs-APD offered employee only health insurance compared to
family coverage insurance to their direct care workers. Just over 25% (26.25%) of RCFs-
APD also offered this benefit in 2010 compared to 39% (38.75) in 2014. The proportion of
RCF-APD direct care workers enrolled in employee-only insurance increased overall from
2010 to 2014 (5.99% to 9.76%, respectively).
Paid Time Off: Personal Time off (Vacation and Sick) and Paid Holidays
Just over half (55.00%) of RCFs-APD offered personal time off to their direct care workers in
2010 compared to almost three-quarters (72.50%) in 2014. Just under half (48.02%) of
RCF-APD direct care workers used personal time off in 2010 compared to about 55%
(55.37%) in 2014.
5-18

Section 5 — Provision of Fringe Benefits to Direct Care Workers
A lower proportion of RCFs-APD offered paid holidays to their direct care workers compared
to personal time off. Just over a third (35.00%) of RCFs-APD offered paid holidays to direct
care workers in 2010 compared to over half (52.50%) in 2014. Very few RCF-APD direct
care workers used paid holidays in 2010 or 2014 (5.13% and 7.67% respectively).
Retirement Benefits: Pension, 401(k) or 403(b)
The percentage of RCFS-APD offering retirement benefits has increased overtime with little
increase in the percentage of direct care workers enrolled. About a quarter (23.75%) of
RCFs-APD offered retirement benefits to their direct care staff in 2010 compared to almost a
third (31.25%) of RCFs-APD in 2014. Overall, comparing 2010 to 2014, the proportion of
direct care workers enrolled in retirement benefits has increased slightly. About 5%
(5.13%) were enrolled in 2010 compared to 8% (7.67%) in 2014.
Life Insurance
There has been very little change in the proportion of RCFs-APD providing life insurance to
their direct care workers over the past 5 years. The proportion of RCFs-APD that offered life
insurance was about 16% (16.25%) in 2013 and had a slight increase to 19% (18.75%) in
2014. The proportion of direct care workers enrolled in life insurance has not changed
overtime. In 2010 and 2014 about 11% of RCF-APD direct care workers were enrolled in life
insurance (10.48% and 10.95%, respectively).
Table 5-2c. Fringe Benefits Offers and Enrollment/Use by Direct Care Workers at Residential Care APD Facilities, 2010-2014
Year Provider in Operation
Residential Care Facility: Aged/Physical Disabilities
2010 2011 2012 2013 2014
Total Number of Direct Care Workers 1,180 1,302 1,552 1,685 1,810
Health Insurance with Family Coverage
Percent of providers who offered benefit 28.75 28.75 27.50 35.00 36.25
Percent of direct care workers who enroll/use benefit 6.63 2.91 2.20 3.75 5.37
Health Insurance for Employee Only
Percent of providers who offered benefit 26.25 27.50 27.50 35.00 38.75
Percent of direct care workers who enroll/use benefit 5.99 7.18 5.53 7.57 9.76
Paid Personal Time Off, Vacation Time, or Sick Leave
Percent of providers who offered benefit 55.00 57.50 60.00 66.25 72.50
Percent of direct care workers who enroll/use benefit 48.02 47.04 41.66 46.74 55.37
Paid Holidays
Percent of providers who offered benefit 35.00 38.75 38.75 45.00 52.50
(continued)
5-19

Wages, Fringe Benefits, and Turnover for Direct Care Workers Working for Long-Term Care Providers in Oregon
Table 5-2c. Fringe Benefits Offers and Enrollment/Use by Direct Care Workers at Residential Care APD Facilities, 2010-2014 (continued)
Year Provider in Operation
Residential Care Facility: Aged/Physical Disabilities
2010 2011 2012 2013 2014
Percent of direct care workers who enroll/use benefit 41.82 39.28 33.03 39.78 48.88
Pension or 401(k) or 403(b) Account
Percent of providers who offered benefit 23.75 22.50 26.25 27.50 31.25
Percent of direct care workers who enroll/use benefit 5.13 5.82 5.61 3.52 7.67
Employer-sponsored Life Insurance
Percent of providers who offered benefit 16.25 16.25 16.25 16.25 18.75
Percent of direct care workers who enroll/use benefit 10.48 9.02 7.32 6.74 10.95
Note: Unit of analysis is providers for offer of benefit and direct care workers for enrollment/use.
Source: RTI International analysis of the 2014 Oregon Wage and Fringe Benefit Survey of Long-Term Care (LTC) Providers.
5.2.5 Residential Care Facility: Developmental Disabilities
Health Insurance: Family Coverage and Employee Only
Table 5-2d shows that from 2010 to 2014, the proportion of residential care facilities:
developmental disabilities (RCFs-DD) providing family health insurance coverage and
employee only health insurance coverage increased. About half (45.93%) of RCFs-DD
offered health insurance with family coverage in 2010 compared to almost two thirds
(62.39%) in 2014. Few direct care workers at RCFs-DD enrolled in family health insurance
with family coverage in 2010 (4.32%) and there has only been a small increase to 7%
(7.24%) in 2014.
Employee-only health insurance is offered by more RCFs-DD than family health insurance
coverage. The proportion of RCFs-DD offering this employee-only health insurance
increased from 2010 to 2014. In 2010, about 60% (59.49%) of these facilities offered this
benefit to their direct care workers compared to 84% (83.91%) of RCFs-DD in 2014. A
higher percentage of RCF-DD direct care workers are using this benefit in 2014 compared to
2010. In 2010, 45% of RCF-DD direct care workers were enrolled in employee only health
insurance compared to 62% (61.75%) in 2014.
Paid Time Off: Personal Time off (Vacation and Sick) and Paid Holidays
Two-thirds (66.55%) of RCFs-DD offered personal time off to their direct care workers in
2010. The proportion of facilities offering this benefit increased over the 5 year period and
as of 2014, almost all RCFs-DD (95.45%) offered this benefit to their direct care workers.
The proportion of RCF-DD direct care workers using personal time increased from 2010 to
2014 (66.55% and 86.96%, respectively).
5-20

Section 5 — Provision of Fringe Benefits to Direct Care Workers
The proportion of RCFs-DD offering paid holidays to direct care workers increased from
2010 to 2014 (50.81% to 69.62%, respectively). The proportion of direct care workers
using paid holidays did not increase as much over time, with 42% using paid holidays in
2010 compared to about 50% in 2014.
Retirement Benefits: Pension, 401(k) or 403(b)
Less than half (43.76%) of RCFs-DD offered retirement benefits in 2010. However, by 2014,
two-thirds (66.18%) of RCFs-DD offered retirement benefits to their direct care workers.
Few RCF-DD direct care workers are enrolled in retirement benefits, although the proportion
increases over time. In 2010, just over 10% (11.77%) of RCF-DD direct care workers were
enrolled in retirement benefits which increases to just over a quarter (25.76%) of RCF-DD
direct care workers in 2014.
Life Insurance
About two fifths (43.50%) of RCFs-DD offered life insurance to their direct care workers in
2010 compared to almost two thirds (63.29%) in 2010 (43.40%). Likewise, more RCF-DD
direct care workers enrolled in life insurance from 2010-2014 (43.54% and 67.20%,
respectively).
Table 5-2d. Fringe Benefits Offers and Enrollment/Use by Direct Care Workers at Residential Care Facilities for Adults with Developmental Disabilities, 2010-2014
Year Provider in Operation
Residential Care: Adults/Developmental Disabilities
2010 2011 2012 2013 2014
Total Number of Direct Care Workers 6,603 7,073 8,238 10,035 7,679
Health Insurance with Family Coverage
Percent of providers who offered benefit 45.93 49.19 52.26 54.43 62.39
Percent of direct care workers who enroll/use benefit
4.32 6.16 5.59 4.81 7.24
Total Number of Direct Care Workers 6,603 7,073 8,238 10,035 7,679
Health Insurance for Employee Only
Percent of providers who offered benefit 59.49 62.75 66.00 71.97 83.91
Percent of direct care workers who enroll/use benefit
45.25 45.32 44.18 38.92 61.75
Paid Personal Time Off, Vacation Time, or Sick Leave
Percent of providers who offered benefit 66.55 69.08 73.42 81.19 95.48
Percent of direct care workers who enroll/use benefit
62.75 63.56 56.88 52.19 86.96
(continued)
5-21

Wages, Fringe Benefits, and Turnover for Direct Care Workers Working for Long-Term Care Providers in Oregon
Table 5-2d. Fringe Benefits Offers and Enrollment/Use by Direct Care Workers at Residential Care Facilities for Adults with Developmental Disabilities, 2010-2014 (continued)
Year Provider in Operation
Residential Care: Adults/Developmental Disabilities
2010 2011 2012 2013 2014
Paid Holidays
Percent of providers who offered benefit 50.81 51.90 54.97 61.30 69.62
Percent of direct care workers who enroll/use benefit 42.09 42.91 38.61 35.66 49.74
Pension or 401(k) or 403(b) Account
Percent of providers who offered benefit 43.76 46.47 48.82 52.26 66.18
Percent of direct care workers who enroll/use benefit
11.77 16.74 18.14 16.67 25.76
Employer-sponsored Life Insurance
Percent of providers who offered benefit 43.40 44.12 45.39 49.37 63.29
Percent of direct care workers who enroll/use benefit
43.54 44.03 46.67 39.70 67.20
Note: Unit of analysis is providers for offer of benefit and direct care workers for enrollment/use.
Source: RTI International analysis of the 2014 Oregon Wage and Fringe Benefit Survey of Long-Term Care (LTC) Providers.
5.2.6 Adult Foster Care: Aged/Physical Disabilities
Health Insurance: Family Coverage and Employee Only
Table 5-2e shows that very few adult foster care: aged/physical disabilities (AFCs-APD)
offered health insurance with family coverage or employee only family coverage and there
has been very little change over time. In 2010, less than 5% (3.61%) of AFCs-APD offered
health insurance with family coverage to their direct care workers compared to 5% (4.65%)
in 2014. Very few direct care workers used this benefit from 2010-2014. Less than 2%
(1.90%) of direct care workers used this benefit in 2010 compared to about 3% (3.31%) in
2014.
Similarly, less than 5% (4.12%) of AFCs-APD offered employee only health insurance to
their direct care workers in 2010 compared to about 6% (5.67%) in 2014. Very few AFCs-
APD direct care workers enrolled in the benefit in 2010 (2.85%) with only 5% (4.49%)
enrolled in 2014.
Paid Time Off: Personal Time off (Vacation and Sick) and Paid Holidays
About 14% (13.92%) of AFCs-APD offered personal time to their direct care workers in
2010 compared to just over 20% (22.16%) in 2014. In 2010, 14% (14.93%) of direct care
workers used this benefit with an increase to 19% (18.68%) in 2014.
5-22

Section 5 — Provision of Fringe Benefits to Direct Care Workers
Fewer AFCs-APD (10%) offered paid holidays to direct care workers in 2010 and just under
20% (18.68) offered it in 2014. Few AFC-APD direct care workers utilized paid holidays in
2010 (13.61%) or 2014 (16.78%).
Retirement Benefits: Pension, 401(k) or 403(b)
Almost no AFCs-APD offered retirement benefits to their direct care workers in 2010
(1.03%) or 2014 (1.55%). Similarly, almost no direct care workers are enrolled in
retirement benefits in 2010 (0.53%) or 2014 (1.65%).
Life Insurance
Similar to retirement benefits, almost no AFCs-APD offered life insurance to their direct care
workers in 2010 and there has been little change in 2014. Less than 1% of AFCs-DD offered
life insurance to their direct care workers in 2010 and just 1% (1.42%) offered it in 2014.
Table 5-2e. Fringe Benefits Offers and Enrollment/Use by Direct Care Workers at Foster Care Homes for Aged/Physical Disabilities, 2010-2014
Year Provider in Operation
Foster Care Homes for Aged/Physical Disabilities with Direct Care Workers
2010 2011 2012 2013 2014
Total Number of Direct Care Workers 1,608 1,857 2,046 2,269 4,727
Health Insurance with Family Coverage
Percent of providers who offered benefit 3.61 4.12 4.64 5.15 4.64
Percent of direct care workers who enroll/use benefit
1.90 1.92 2.24 3.14 3.31
Health Insurance for Employee Only
Percent of providers who offered benefit 4.12 4.64 5.15 5.15 5.67
Percent of direct care workers who enroll/use benefit
2.85 3.56 3.98 2.69 4.49
Paid Personal Time Off, Vacation Time, or Sick Leave
Percent of providers who offered benefit 13.92 13.92 17.53 21.13 22.16
Percent of direct care workers who enroll/use benefit
13.92 15.62 16.17 17.49 18.68
Paid Holidays
Percent of providers who offered benefit 7.73 9.28 10.82 11.86 12.89
Percent of direct care workers who enroll/use benefit
13.61 15.34 13.93 16.59 16.78
(continued)
5-23

Wages, Fringe Benefits, and Turnover for Direct Care Workers Working for Long-Term Care Providers in Oregon
Table 5-2e. Fringe Benefits Offers and Enrollment/Use by Direct Care Workers at Foster Care Homes for Aged/Physical Disabilities, 2010-2014 (continued)
Year Provider in Operation
Foster Care Homes for Aged/Physical Disabilities with Direct Care Workers
2010 2011 2012 2013 2014
Percent of providers who offered benefit 1.03 2.58 3.09 2.58 1.55
Percent of direct care workers who enroll/use benefit
0.63 1.64 2.49 1.79 1.65
Employer-sponsored Life Insurance
Percent of providers who offered benefit 0.52 1.03 1.03 1.03 1.55
Percent of direct care workers who enroll/use benefit
0.00 1.37 1.24 1.12 1.42
Note: Unit of analysis is providers for offer of benefit and direct care workers for enrollment/use.
Source: RTI International analysis of the 2014 Oregon Wage and Fringe Benefit Survey of Long-Term Care (LTC) Providers.
5.2.7 Adult Foster Care: Developmental Disabilities
Health Insurance: Family Coverage and Employee Only
Table 5-2f shows that few adult foster care: developmental disabilities (AFCs-DD)
providers offered health insurance with family coverage or employee only coverage to their
direct care staff. In 2010, 2% (1.99%) of AFCs-DD offered this benefit compared to about
4% (3.64%) in 2014. Similarly, few AFC-DD direct care workers were enrolled in this benefit
in 2010 (0.65%) with very little change in 2014 when 3% (3.32%) were enrolled.
Employee-only health insurance is offered by a slightly higher proportion of AFCs-DD but
still very few provide it. In 2010 4% (4.30%) of AFCs-DD provided employee only health
insurance to their direct care workers compared to only about 7% (6.62%) in 2014. A very
small proportion of direct care workers were enrolled in employee only health insurance in
2010 or 2014 (2.95% and 5.33%, respectively).
Paid Time Off: Personal Time off (Vacation and Sick) and Paid Holidays
Relatively few AFCs-DD offered personal time off to their direct care workers in 2010
(16.89%), although the proportion increased to over a quarter (28.48%) by 2014. A smaller
proportion (12.00%) of direct care workers used personal time off in 2010 compared to an
increase of almost 50% (48.24%) in 2014. There was also an increase in the proportion of
AFCs-DD offering paid holidays to direct care workers in 2010 compared to 2014 (9.60%
and 19.21% respectively). The proportion of AFC-DD direct care workers using paid holidays
increased substantially from 8% (7.78%) in 2010 to 39.90% in 2014.
5-24

Section 5 — Provision of Fringe Benefits to Direct Care Workers
Retirement Benefits: Pension, 401(k) or 403(b)
Very few (1.32%) AFCs-DD offered retirement benefits to their direct care workers in 2010.
Little change occurred by 2014, with only 3% (2.98%) of AFCs-DD offering retirement
benefits to their direct care workers. Not surprisingly, few (0.29%) AFC-DD direct care
workers enrolled in this benefit in 2010 while no significant change occurred across time.
Only 1% (1.11%) of AFC-DD direct care staff enrolled in retirement benefits in 2014.
Life Insurance
Similar to retirement benefits, very few AFCs-DD offered life insurance to their direct care
workers in 2010 or 2014 (0.66% and 2.32% respectively). Likewise, almost no AFC-DD
direct care workers were enrolled in this benefit in 2010 or 2014 (1.22% and 1.51%,
respectively).
Table 5-2f. Fringe Benefits Offers and Enrollment/Use by Direct Care Workers at Foster Care Homes for Adults/Developmental Disabilities, 2010-2014,
Year Provider in Operation
Foster Care Homes for Adults/ Developmental Disabilities with Direct
Care Workers
2010 2011 2012 2013 2014
Total Number of Direct Care Workers 1,991 836 972 1,155 1,426
Health Insurance with Family Coverage
Percent of providers who offered benefit 1.99 1.66 1.99 2.98 3.64
Percent of direct care workers who enroll/use benefit
0.65 0.86 1.92 2.48 3.32
Health Insurance for Employee Only
Percent of providers who offered benefit 4.30 4.30 4.64 6.95 6.62
Percent of direct care workers who enroll/use benefit
2.95 5.15 5.90 4.84 5.33
Paid Personal Time Off, Vacation Time, or Sick Leave
Percent of providers who offered benefit 16.89 18.87 22.19 27.15 28.48
Percent of direct care workers who enroll/use benefit
12.38 34.13 34.22 36.85 48.24
Paid Holidays
Percent of providers who offered benefit 9.60 11.59 14.57 17.88 19.21
Percent of direct care workers who enroll/use benefit
7.78 20.93 21.98 23.08 39.90
Pension or 401(k) or 403(b) Account
Percent of providers who offered benefit 1.32 1.32 1.32 2.98 2.98
(continued)
5-25

Wages, Fringe Benefits, and Turnover for Direct Care Workers Working for Long-Term Care Providers in Oregon
Table 5-2f. Fringe Benefits Offers and Enrollment/Use by Direct Care Workers at Foster Care Homes for Adults/Developmental Disabilities, 2010-2014 (continued)
Year Provider in Operation
Foster Care Homes for Adults/ Developmental Disabilities with Direct
Care Workers
2010 2011 2012 2013 2014
Percent of direct care workers who enroll/use benefit
0.29 0.86 0.29 1.12 1.11
Employer-sponsored Life Insurance
Percent of providers who offered benefit 0.66 0.66 0.33 2.32 2.32
Percent of direct care workers who enroll/use benefit
1.22 1.54 1.62 1.24 1.51
Note: Unit of analysis is providers for offer of benefit and direct care workers for enrollment/use.
Source: RTI International analysis of the 2014 Oregon Wage and Fringe Benefit Survey of Long-Term Care (LTC) Providers.
5.2.8 Assisted Living Facility: Aged/Physical Disabilities
Health Insurance: Family Coverage and Employee Only
Table 5-2g shows the proportion of ALFs-APD that offered health insurance with family
coverage and employee coverage increased from 2010 to 2014. Similar proportions of ALFs-
APD offered family coverage compared and employee coverage in 2010 (37.75% and
43.05%, respectively). In 2014, more ALFs-APD offered employee only coverage compared
to health insurance with family coverage (60.93% and 50.33%, respectively). The
proportion of direct care workers enrolled in health insurance with family coverage
increased slightly from 2010 to 2014 (8.96% to 13.85%). The proportion of ALF-APD direct
care workers enrolled in employee only health insurance also increased from 2010, 18%
(18.74%) in 2010 to 26% (25.51%) in 2014.
Paid Time Off: Personal Time off (Vacation and Sick) and Paid Holidays
Personal time off and paid time off are offered by more ALFs-DD in 2014 compared to 2010
while the percentage of direct care workers enrolled in these benefits also increased
overtime. In 2010, about half (53.64%) of ALFs-APD offered personal time off to their direct
care workers. By 2014, almost three quarters (75.50%) of ALFs-APD offered personal time
off to these same staff. The proportion of ALF-APD direct care workers using personal time
off increased from 57.92% in 2010 to 68.24% in 2014. A third of ALFs-APD (35.10%)
offered paid holidays to their direct care workers which increased to over half (55.63%) of
ALFs-APD in 2014. The proportion of ALF-APD direct care workers enrolled similarly
increased from 2010 to 2014 (39.46% and 55.49%, respectively).
5-26
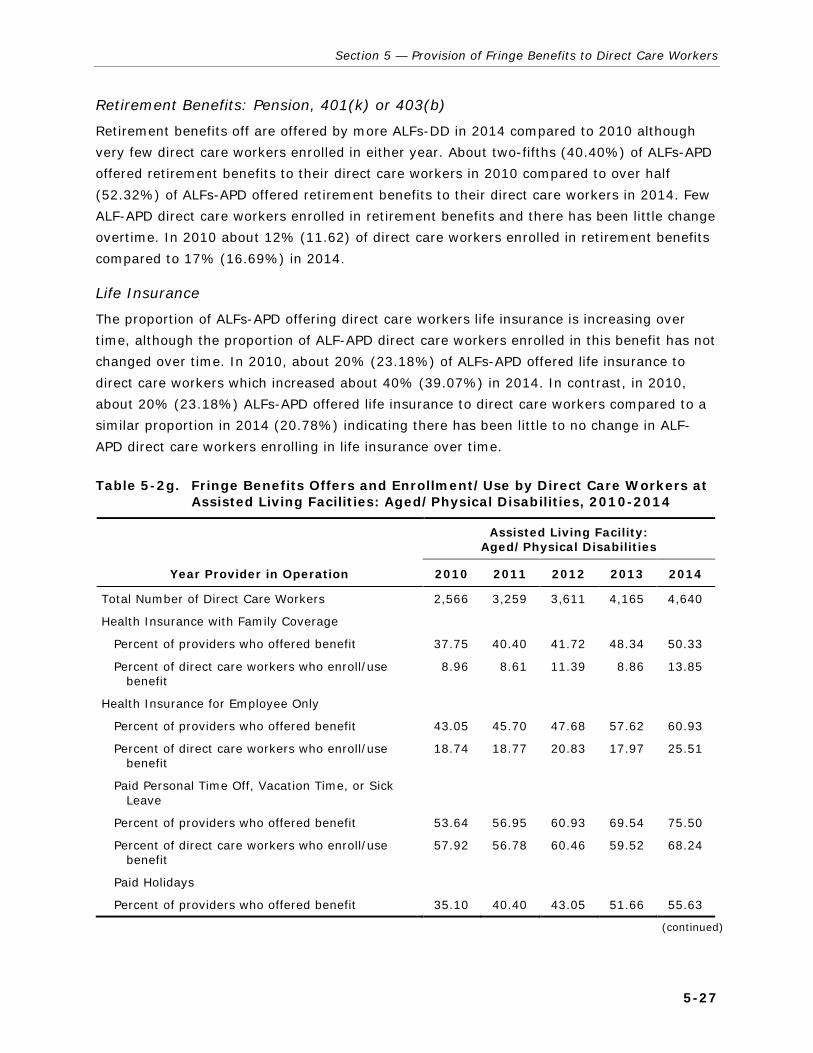
Section 5 — Provision of Fringe Benefits to Direct Care Workers
Retirement Benefits: Pension, 401(k) or 403(b)
Retirement benefits off are offered by more ALFs-DD in 2014 compared to 2010 although
very few direct care workers enrolled in either year. About two-fifths (40.40%) of ALFs-APD
offered retirement benefits to their direct care workers in 2010 compared to over half
(52.32%) of ALFs-APD offered retirement benefits to their direct care workers in 2014. Few
ALF-APD direct care workers enrolled in retirement benefits and there has been little change
overtime. In 2010 about 12% (11.62) of direct care workers enrolled in retirement benefits
compared to 17% (16.69%) in 2014.
Life Insurance
The proportion of ALFs-APD offering direct care workers life insurance is increasing over
time, although the proportion of ALF-APD direct care workers enrolled in this benefit has not
changed over time. In 2010, about 20% (23.18%) of ALFs-APD offered life insurance to
direct care workers which increased about 40% (39.07%) in 2014. In contrast, in 2010,
about 20% (23.18%) ALFs-APD offered life insurance to direct care workers compared to a
similar proportion in 2014 (20.78%) indicating there has been little to no change in ALF-
APD direct care workers enrolling in life insurance over time.
Table 5-2g. Fringe Benefits Offers and Enrollment/Use by Direct Care Workers at Assisted Living Facilities: Aged/Physical Disabilities, 2010-2014
Year Provider in Operation
Assisted Living Facility: Aged/Physical Disabilities
2010 2011 2012 2013 2014
Total Number of Direct Care Workers 2,566 3,259 3,611 4,165 4,640
Health Insurance with Family Coverage
Percent of providers who offered benefit 37.75 40.40 41.72 48.34 50.33
Percent of direct care workers who enroll/use benefit
8.96 8.61 11.39 8.86 13.85
Health Insurance for Employee Only
Percent of providers who offered benefit 43.05 45.70 47.68 57.62 60.93
Percent of direct care workers who enroll/use benefit
18.74 18.77 20.83 17.97 25.51
Paid Personal Time Off, Vacation Time, or Sick Leave
Percent of providers who offered benefit 53.64 56.95 60.93 69.54 75.50
Percent of direct care workers who enroll/use benefit
57.92 56.78 60.46 59.52 68.24
Paid Holidays
Percent of providers who offered benefit 35.10 40.40 43.05 51.66 55.63
(continued)
5-27

Wages, Fringe Benefits, and Turnover for Direct Care Workers Working for Long-Term Care Providers in Oregon
Table 5-2g. Fringe Benefits Offers and Enrollment/Use by Direct Care Workers at Assisted Living Facilities: Aged/Physical Disabilities, 2010-2014 (continued)
Year Provider in Operation
Assisted Living Facility: Aged/Physical Disabilities
2010 2011 2012 2013 2014
Percent of direct care workers who enroll/use benefit
39.46 42.75 48.45 48.32 55.49
Pension or 401(k) or 403(b) Account
Percent of providers who offered benefit 40.40 39.74 40.40 45.03 52.32
Percent of direct care workers who enroll/use benefit
11.62 12.51 14.63 11.60 16.69
Employer-sponsored Life Insurance
Percent of providers who offered benefit 23.18 25.83 27.15 31.13 39.07
Percent of direct care workers who enroll/use benefit
19.71 17.07 15.90 15.23 20.78
Note: Unit of analysis is providers for offer of benefit and direct care workers for enrollment/use.
Source: RTI International analysis of the 2014 Oregon Wage and Fringe Benefit Survey of Long-Term Care (LTC) Providers.
5.2.9 In-Home Care Agency
Health Insurance: Family Coverage and Employee Only
Tables 5-2h shows that few in-home care agencies offered insurance benefits to their
direct care staff and little change occurred from 2010 to 2014. In 2010, 17% (17.31%) of
these agencies offered health insurance with family coverage while 15% (15.38%) of these
facilities offered employee only insurance to their direct care workers. In 2014 only 19%
(19.23%) of these facilities offered family coverage insurance, which is similar to 21%
(21.15%) of in-home care agencies that offered employee only insurance to their direct care
workers. Very few direct care workers at in-home care agencies are enrolled in either health
insurance with family coverage or employee only coverage and there has been no change
over time. In 2010 and 2014, 2% (2.40% and 2.03%, respectively) of direct care workers
were enrolled in health insurance with family coverage. Similarly, the proportion of direct
care workers enrolled in employee only health insurance did not change from 2010 and
2014 (4.96% and 4.90% respectively).
Paid Time Off: Personal Time off (Vacation and Sick) and Paid Holidays
Between 2010 and 2014, personal time off and paid holidays were increasingly offered by
in-home care agencies to their direct care staff. For example, in 2010, one-fifth (19.23%)
in-home care agencies offered paid, personal time off to their direct care workers compared
to just over a third (36.54%) of in-home care agencies in 2014. About 18% (18.47%) of
5-28

Section 5 — Provision of Fringe Benefits to Direct Care Workers
direct care workers at in-home care agencies used personal time off in 2010 compared to
about 28% (28.29%) in 2014.
The proportion of in-home care agencies offering paid holidays to direct care workers also
increased from 2010 to 2014 (17.31% to 23.08%, respectively). Relatively few direct care
workers at in-home care agencies used paid holidays in 2010 and 2014 (12.71% and
16.41%, respectively.
Retirement Benefits: Pension, 401(k) or 403(b)
The proportion of In-home Care Agencies offering direct care workers retirement benefits
decreased from 2010 to 2014 by about 2%. This was the only provider type and the only
fringe benefit where the proportion of providers offering the benefit declined between 2010
and 2014. In 2010 17% (17.31%) of these agencies offered retirement benefits to their
direct care workers compared to 15% (15.38%) in 2014. Very few direct care workers
enrolled in retirement benefits across any year and no change occurred between 2010 and
2014. In 2010 and 2014 only 2% (2.15% and 2.39% respectively) of direct care workers at
in-home care agencies enrolled in retirement benefits.
Life Insurance
Very few in-home care agencies offered life insurance in any year from 2010 to 2014 to
their direct care workers. There also was no change in the proportion of in-home care
agencies that offered life insurance to direct care workers in 2010 and 2014 (5.77% in both
years). The percentage of direct care workers enrolled in this benefit has decreased over
time with 5% (4.96%) enrolled in 2010 compared to just 3% (2.93%) in 2014. This was the
only instance were fringe benefit use declined over the time period.
Table 5-2h. Fringe Benefits Offers and Enrollment/Use by Direct Care Workers at In-Home Care Agencies, 2010-2014, Weighted by Direct Care Workers
Year Provider in Operation
In-Home Care Agency
2010 2011 2012 2013 2014
Total Number of Direct Care Workers 2,880 3,715 4,341 5,131 4,719
Health Insurance with Family Coverage
Percent of providers who offered benefit 17.31 19.23 17.31 19.23 19.23
Percent of direct care workers who enroll/use benefit
2.40 1.79 1.09 1.30 2.03
Health Insurance for Employee Only
Percent of providers who offered benefit 15.38 17.31 17.31 19.23 21.15
Percent of direct care workers who enroll/use benefit
4.96 4.63 3.13 3.73 4.90
(continued)
5-29

Wages, Fringe Benefits, and Turnover for Direct Care Workers Working for Long-Term Care Providers in Oregon
Table 5-2h. Fringe Benefits Offers and Enrollment/Use by Direct Care Workers at In-Home Care Agencies, 2010-2014, Weighted by Direct Care Workers (continued)
Year Provider in Operation
In-Home Care Agency
2010 2011 2012 2013 2014
Paid Personal Time Off, Vacation Time, or Sick Leave
Percent of providers who offered benefit 19.23 19.23 21.15 21.15 36.54
Percent of direct care workers who enroll/use benefit 18.47 16.28 15.32 16.10 28.29
Paid Holidays
Percent of providers who offered benefit 17.31 17.31 19.23 19.23 23.08
Percent of direct care workers who enroll/use benefit
12.71 10.73 10.97 11.50 16.41
Pension or 401(k) or 403(b) Account
Percent of providers who offered benefit 17.31 15.38 15.38 15.38 15.38
Percent of direct care workers who enroll/use benefit
2.15 1.89 1.70 1.91 2.39
Employer-sponsored Life Insurance
Percent of providers who offered benefit 5.77 3.85 3.85 3.85 5.77
Percent of direct care workers who enroll/use benefit
4.96 3.59 3.32 3.94 2.93
Note: Unit of analysis is providers for offer of benefit and direct care workers for enrollment/use.
Source: RTI International analysis of the 2014 Oregon Wage and Fringe Benefit Survey of Long-Term Care (LTC) Providers.
5.3 Provision of Fringe Benefits by LTC Provider Characteristics
5.3.1 Introduction
Table 5-3 analyzes how the provision of selected fringe benefits is affected by specific
provider characteristics. The same fringe benefit categories are explored for this analysis as
in the previous section of the report: (1) health insurance with family coverage, (2) health
insurance for the employee only, (3) paid: personal time off (vacation time or sick leave),
(4) paid holidays, (5) retirement benefits such as a pension plan such as a 401(k) or
403(b), (6) life insurance. The characteristics explored include (1) facility characteristics,
such as type of ownership, location, primary payer source, provider size, and educational
requirements for direct care workers; (2) characteristics of the individuals served such as
race and ethnicity; and (3) the characteristics of the direct care workers such as,
demographic characteristics of direct care workers.
5-30
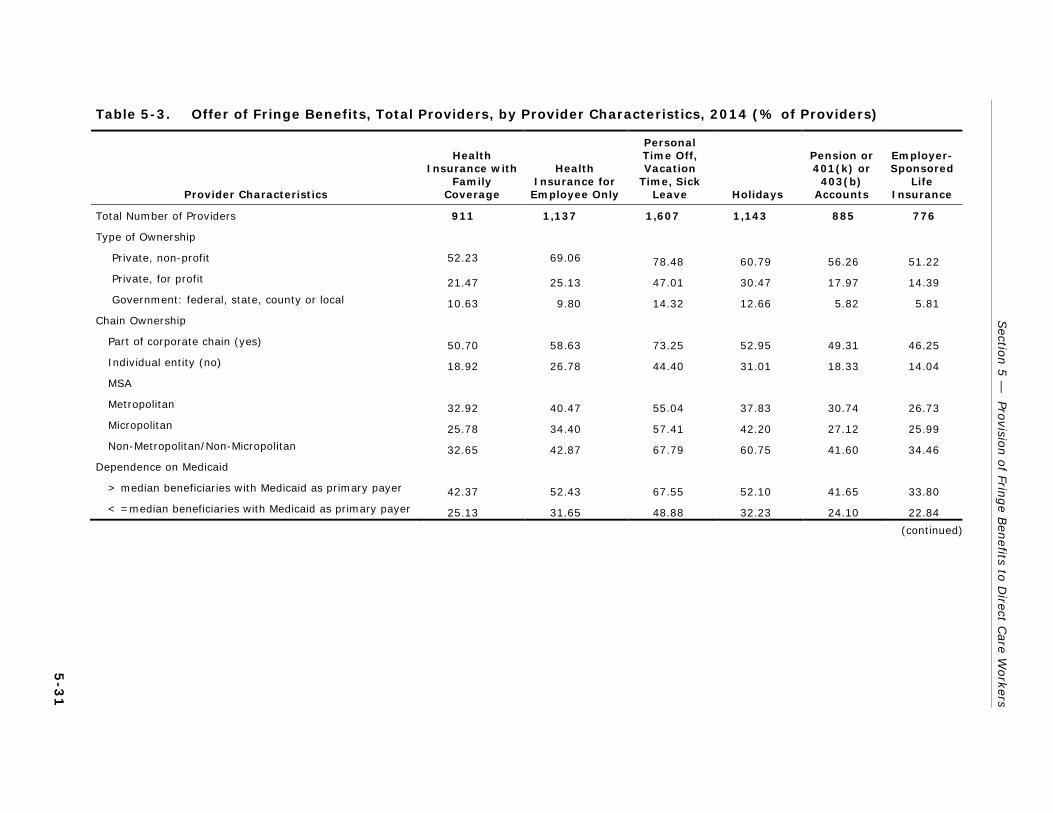
Sectio
n 5
— Pro
vision o
f Fringe B
enefits to
Direct C
are Workers
5-3
1
Table 5-3. Offer of Fringe Benefits, Total Providers, by Provider Characteristics, 2014 (% of Providers)
Provider Characteristics
Health Insurance with
Family Coverage
Health Insurance for
Employee Only
Personal Time Off, Vacation
Time, Sick Leave Holidays
Pension or 401(k) or
403(b) Accounts
Employer-Sponsored
Life Insurance
Total Number of Providers 911 1,137 1,607 1,143 885 776
Type of Ownership
Private, non-profit 52.23 69.06 78.48 60.79 56.26 51.22
Private, for profit 21.47 25.13 47.01 30.47 17.97 14.39
Government: federal, state, county or local 10.63 9.80 14.32 12.66 5.82 5.81
Chain Ownership
Part of corporate chain (yes) 50.70 58.63 73.25 52.95 49.31 46.25
Individual entity (no) 18.92 26.78 44.40 31.01 18.33 14.04
MSA
Metropolitan 32.92 40.47 55.04 37.83 30.74 26.73
Micropolitan 25.78 34.40 57.41 42.20 27.12 25.99
Non-Metropolitan/Non-Micropolitan 32.65 42.87 67.79 60.75 41.60 34.46
Dependence on Medicaid
> median beneficiaries with Medicaid as primary payer 42.37 52.43 67.55 52.10 41.65 33.80
< =median beneficiaries with Medicaid as primary payer 25.13 31.65 48.88 32.23 24.10 22.84
(continued)

5-3
2
Wag
es, Fringe B
enefits, an
d T
urn
over fo
r Direct C
are Workers W
orkin
g fo
r Lo
ng-T
erm C
are Provid
ers in O
regon
Table 5-3. Offer of Fringe Benefits, Total Providers, by Provider Characteristics, 2014 (% of Providers) (continued)
Provider Characteristics
Health Insurance with
Family Coverage
Health Insurance for
Employee Only
Personal Time Off, Vacation
Time, Sick Leave Holidays
Pension or 401(k) or
403(b) Accounts
Employer-Sponsored
Life Insurance
Most Common Disability Among Individuals Served
Frailty, dementia, and physical disabilities 23.46 26.17 43.59 31.29 20.19 16.11
Intellectual/ developmental disabilities 43.77 57.98 72.91 52.58 45.99 42.44
Severe mental illness 11.26 11.26 18.46 9.44 8.35 5.41
Traumatic brain injury 12.62 15.59 60.17 30.88 5.37 0.00
HIV 0.00 100.00 100.00 100.00 100.00 0.00
Ethnicity of Direct Care Workers
High Hispanic/Latino workers (> median) 44.16 52.21 68.83 49.67 42.59 36.72
Low Hispanic/Latino workers (<= median) 21.48 29.23 45.47 31.75 21.12 19.04
Race of Direct Care Workers
High minority workers (> median of all non-white race categories)
13.10 15.51 31.47 20.81 8.77 9.83
Low minority workers (< =median of all non-white race categories)
52.59 66.59 83.51 61.15 55.50 46.29
Ethnicity of Beneficiaries
High Hispanic/Latino beneficiaries (> median) 34.01 39.29 54.58 41.99 30.93 24.02
Low Hispanic/Latino beneficiaries (< =median) 30.97 39.78 56.59 39.13 30.83 28.13
(continued)

Sectio
n 5
— Pro
vision o
f Fringe B
enefits to
Direct C
are Workers
5-3
3
Table 5-3. Offer of Fringe Benefits, Total Providers, by Provider Characteristics, 2014 (% of Providers) (continued)
Provider Characteristics
Health Insurance with
Family Coverage
Health Insurance for
Employee Only
Personal Time Off, Vacation
Time, Sick Leave Holidays
Pension or 401(k) or
403(b) Accounts
Employer-Sponsored
Life Insurance
Race of Beneficiaries
High minority beneficiaries (> median of all non-white race categories)
26.20 32.69 48.48 33.18 25.51 23.70
Low minority beneficiaries (< =median of all non-white race categories)
39.49 49.32 66.60 49.17 38.28 31.72
Age of Target Population
Elderly (65 years or more) 25.66 29.61 45.66 31.27 22.04 18.07
Younger individuals with disabilities (Less than 65 years) 38.57 50.90 67.56 49.07 40.49 36.79
Employer Size
Large provider (more than 75 beneficiaries) 57.42 59.80 74.15 58.62 54.24 42.98
Small provider (75 beneficiaries or less) 30.80 38.95 55.51 39.19 29.97 26.45
Education of Direct Care Workers
High education (Associate’s degree or higher) 31.88 44.71 59.03 50.35 40.66 29.96
Low education (less than Associate’s degree) 33.12 40.30 57.66 39.17 30.20 27.54
(continued)

5-3
4
Wag
es, Fringe B
enefits, an
d T
urn
over fo
r Direct C
are Workers W
orkin
g fo
r Lo
ng-T
erm C
are Provid
ers in O
regon
Table 5-3. Offer of Fringe Benefits, Total Providers, by Provider Characteristics, 2014 (% of Providers) (continued)
Provider Characteristics
Health Insurance with
Family Coverage
Health Insurance for
Employee Only
Personal Time Off, Vacation
Time, Sick Leave Holidays
Pension or 401(k) or
403(b) Accounts
Employer-Sponsored
Life Insurance
Training of Direct Care Workers
Less than 75 hours 25.59 33.73 51.45 37.58 25.88 22.76
75 hours or more 51.55 59.50 73.58 48.12 46.82 40.42
Wage Rates
Less than $12.00 per hour 31.68 41.13 57.94 39.75 30.63 27.06
$12.00 to $16.00 per hour 38.04 45.38 65.55 50.73 36.99 31.14
More than $16.00 per hour 62.69 64.28 71.68 67.85 57.80 51.27
Note: The provider is the unit of analysis.
Source: RTI International analysis of the 2014 Oregon Wage and Fringe Benefit Survey of Long-Term Care (LTC) Providers.

Section 5 — Provision of Fringe Benefits to Direct Care Workers
Looking across all fringe benefit categories, private, non-profit providers are most likely to
provide fringe benefits and government operated providers are least likely. The largest
proportion of providers that offered most benefits are also part of a corporate chain and
larger (have more than 75 beneficiaries). Geographic location of providers appears to have
had little influence over the proportion of providers providing most benefits except for paid,
personal time off and paid holidays. Provider characteristics related to their direct care
workers, including education and training of direct care workers and their wages, do appear
to influence the proportions of providers offering fringe benefits although there is variation
across the different types of benefits. Age, Medicaid dependence, primary type of disability
served and race of beneficiaries appear to be related to the proportion of providers offering
these benefits. Ethnicity and race of direct care workers also shows a relationship to the
proportion of the providers that offered health insurance with family coverage, employee
only health insurance, paid personal time off (vacation/sick), paid holidays, retirement
benefits, and life insurance.
5.3.2 Health Insurance: Family Coverage
Characteristics of Providers
Those providers that are more likely to offered health insurance with family coverage can be
characterized as private, non-profit; part of a corporate chain, larger in size, had a higher
proportion of direct care workers with more than 75 hours of training, and offered more
than $16.00 per hour to direct care workers. Just over half (52.23%) of private, non-profit
providers offered health insurance with family coverage in 2014 to their direct care workers.
Fewer private, for profit and government (federal, state, county or local) providers offered
health insurance with family coverage to direct care workers (21.47% and 10.63%,
respectively). About half (50.70%) of providers owned by corporate chains provided health
insurance with family coverage to their direct care staff compared to about a fifth (18.92%)
of providers that operate as individual entities. A third of providers located in both
metropolitan and non-metropolitan/non-micropolitan offered health insurance with family
coverage to their direct care workers (32.92% and 32.65% respectively), compared to
about a quarter (25.778%) of those providers located in micropolitan areas. Provider size
appears to influence the offered of health insurance with family coverage. Almost 60%
(57.42%) of large providers (more than 75 beneficiaries) provided health insurance with
family coverage compared to only about 30% (30.80%) of small providers (75 beneficiaries
or less).
A similar proportion of providers that had a higher or lower proportion of direct care workers
with an Associate’s Degree or higher level of education (31.88% and 33.12%, respectively)
offered health insurance with family coverage. The amount of training that direct care
workers have appears to be related to the proportion of providers that offered health
insurance with family coverage. About a quarter (25.59%) of providers that had a higher
5-35

Wages, Fringe Benefits, and Turnover for Direct Care Workers Working for Long-Term Care Providers in Oregon
proportion of direct care workers with less than 75 hours of training offered health insurance
for family members. In contrast, over half (51.55%) of providers that had a higher
proportion of direct care workers with more than 75 hours of training offered health
insurance for family members. Providers that pay their direct care workers more are also
more likely to offered health insurance for family members. About two thirds (62.69%) of
providers that paid their direct care workers more than $16 per hour offered health
insurance with family coverage compared to those providers that paid $12-16 or less than
$12 per hour (38.04% and 31.68% respectively).
Characteristics of Individuals Served
Those providers that had a higher proportion of younger individuals with disabilities are and
a lower number of minority beneficiaries are more likely to have offered health insurance
with family coverage to their direct care workers. A larger proportion (42.37%) of providers
that had more than the median percentage of beneficiaries with Medicaid as their primary
payer offered health insurance with family coverage to direct care workers compared to
about a quarter (25.13%) of providers that had less than the median percentage of
beneficiaries with Medicaid as their primary payer. Providers that serve individuals with
intellectual/development disabilities (42.37%) are more likely to offered health insurance
with family coverage to their direct care workers than providers primarily serving other
populations. Just under a quarter (23.46%) of providers primary serving individuals with
frailty, dementia and physical disabilities, offered this benefit to their direct care workers.
Fewer providers primarily serving both individuals with severe mental illness and traumatic
brain injury offered this benefit to their direct care workers (11.26% and 12.62%
respectively) while no providers serving individuals with HIV offered health insurance with
family coverage. The proportion Hispanic/Latino beneficiaries does not influence the
proportion of providers that offered health insurance with family coverage. A larger
proportion of providers with a lower proportion of minority beneficiaries offered health
insurance with family coverage compared to providers that had a higher number of minority
beneficiaries (39.04% and 26.20% respectively). Only a quarter (25.66%) of providers
offered health insurance with family coverage if they primarily serve an older (65 and older)
population compared to almost 40% (38.57%) of providers who serve younger people with
disabilities.
Characteristics of Direct Care Workers
The race and ethnicity of direct care workers appears to influence if providers offered
insurance with family health insurance coverage. A larger proportion of providers with a
higher proportion of Hispanic/Latino direct care workers offered health insurance with family
coverage compared to those providers with a lower proportion of Hispanic/Latino workers
(44.16% and 21.48%, respectively). On the other hand, only about a tenth (13.10%) of
providers that had a high proportion of minority direct care workers offered health insurance
5-36

Section 5 — Provision of Fringe Benefits to Direct Care Workers
with family coverage to all direct care workers compared to over half (52.59%) of providers
that had a lower proportion of minority direct care workers.
5.3.3 Health Insurance: Employee Only
Characteristics of Providers
Those providers that are more likely to have offered employee only health insurance can be
characterized as private, non-profit; part of a corporate chain, larger in size, had a higher
proportion of direct care workers with more than 75 hours of training, and offered more
than $16.00 per hour to direct care workers. Almost 70% (69.06%) of private non-profit
providers offered employee-only health insurance to their direct care workers. In contrast, a
smaller proportion of private, for profit and government (federal, state, county, or local)
providers offered employee-only health insurance to direct care workers (25.13% and
9.80%, respectively). Close to three-fifths (58.63%) of providers owned by corporate chains
offered employee-only health insurance compared to just over a quarter (26.75%) of
providers that are individually owned. About the same proportion of providers in
metropolitan and non-metropolitan/micropolitan locations offered employee only insurance
(40.47% and 42.87% respectively) compared to about a third (34.40%) of providers in
micropolitan areas. About 60% (59.80%) of large providers (more than 75 beneficiaries)
provided employee-only insurance to their direct care workers compared with about 40% of
smaller providers (75 beneficiaries or less). Those providers that either had a higher
proportion of direct care workers with an Associate’s Degree or higher or less than an
Associate’s degree offered employee-only health insurance (44.71% and 40.30%,
respectively).
About 60% (59.50%) of providers that had a higher percentage of staff with 75 or more
hours of training offered employee-only insurance compared to a third (33.73%) of
providers that had a lower proportion of direct care workers with less training. Direct care
staff wages appear to influence the proportion of providers that offered employee-only
insurance to these staff. About two-thirds (64.28%) of providers that pay direct care
workers more than $16 per hour offered this benefit compared to over two-fifths of
providers that paid $12-16 per hour (45.38%) and less than $12 per hour (41.13%).
Characteristics of Individuals Served
Those providers that had a higher proportion of younger individuals with disabilities, a
higher proportion of Medicaid beneficiaries, more commonly served individuals with
intellectual/developmental disabilities or HIV, had fewer minority beneficiaries are more
likely to have offered employee only health insurance to their direct care workers. About
half (52.43%) of providers serving a higher proportion of beneficiaries with Medicaid as the
primary payer offered employee-only health insurance compared to about a third (31.65%)
of providers that had a lower proportion of beneficiaries with Medicaid as the primary payer.
5-37

Wages, Fringe Benefits, and Turnover for Direct Care Workers Working for Long-Term Care Providers in Oregon
Approximately a quarter (26.17%) of providers that primarily serve individuals with frailty,
dementia and physical disabilities offered employee-only health insurance to their direct
care workers, while over half (57.98%) of providers that primarily serve individuals with
intellectual/developmental disabilities provided employee insurance. There is no difference
in the proportion of providers with high and low percentage of Hispanic/Latino beneficiaries
that offered employee only insurance to their direct care workers (39.29% and 39.78%,
respectively). About half (49.32%) of providers that had a low proportion of minority
beneficiaries offered employee-only health insurance to their direct care workers, compared
to only about a third (32.69%) of providers that had a higher proportion of minority
beneficiaries. Only about 30% (29.61%) of providers serving primarily an elderly population
offered this benefit compared to about half (50.90%) of providers that primarily serve
younger individuals (less than 64) with disabilities.
Characteristics of Direct Care Workers
The race and ethnicity of direct care workers appears to influence if providers offered
employee only health insurance. A higher percentage of providers with a larger proportion
of Hispanic/Latino direct care workers offered employee-only health insurance compared to
providers with a lower proportion of Hispanic/Latino direct care workers (52.21% and
29.23%, respectively). Just over two-thirds (66.29%) of providers with a lower proportion
of minority direct care workers offered employee only insurance to their direct care workers
compared to only about 16% (15.51%) of providers that had a higher proportion of minority
direct care workers.
5.3.4 Paid Personal Time Off: Vacation and Sick Leave
Characteristics of Providers
Those providers that are more likely to have offered employee paid, personal time off to
their direct care workers can be characterized as private, non-profit; part of a corporate
chain, and larger in size. Over three-quarters (78.48%) of private, non-profit providers
offered personal time off to their direct care workers compared to just under half (47.01%)
of private, for profit providers. Only 14% (14.32%) of government-owned providers offered
paid time off to their direct care workers. About three-fourths (73.25%) of providers that
are part of a corporate chain provide this benefit while only 44% of individually owned
providers do so. Just over two-thirds (67.79%) of non-metropolitan/non-micropolitan
compared to just over half of both metropolitan and micropolitan providers (55.04% and
57.41%, respectively) offered personal time off to their direct care workers. About three-
fourths (74.15%) of larger providers (more than 75 beneficiaries) were more likely to
offered paid personal time off compared to just over half (55.51%) of smaller providers (75
beneficiaries or less). Similar proportions of providers offered personal time off to their
direct care workers regardless if the provider had a higher or lower percentage of workers
with an Associate’s degree or higher (59.03% and 57.66%, respectively).
5-38

Section 5 — Provision of Fringe Benefits to Direct Care Workers
Almost three-fourths (73.58%) of providers that had a higher percentage of staff with 75 or
more hours of training offered employee-only insurance compared to half (51.75%) of
providers that had a lower proportion of direct care workers with less training. As the
average direct care worker wage rate increases, the proportion of providers offering
personal time off to these same staff also increases. Just under 60% (57.94%) of providers
that offered less than $12 offered this benefit compared to two-thirds (65.55%) of providers
that offered $12-16 per hour, while about 70% (71.68%) of providers that offered more
than $16 per hour offered personal time off to their direct care workers.
Characteristics of Individuals Served
Providers that serve more individuals with Medicaid as their primary payer, most commonly
serve individuals with intellectual/development disabilities, HIV, or severe mental illness,
and primarily serve younger individuals with disabilities (less than age 65) and serve fewer
minority beneficiaries are more likely to have provided their direct care workers with
personal time off. Just over two-thirds (67.55%) of providers that had a higher percentage
of individuals with Medicaid as the primary payer offered personal time off to their direct
care workers compared to less than half (48.88%) of those providers that served a lower
percentage of beneficiaries without Medicaid as the primary payer. All providers that
primarily serve individuals with HIV offered personal time off to their direct care workers.
More than half of providers serving individuals with intellectual/development disabilities and
those providers serving individuals with TBI provide this benefit (72.91% and 60.17%,
respectively). About two-fifths (43.59%) of providers serving individuals that are frail, have
dementia and physical disabilities offered personal time off, while almost three-quarters
(79.91%) of providers that primarily serve people with intellectual or developmental
disabilities provide this benefit to direct care workers. The same proportion of providers,
about 55%, offered personal time off regardless if they had a high or low percentage of
Hispanic/Latino beneficiaries (54.58 and 56.59%, respectively). Two-thirds (66.60%) of
providers that had a lower percentage of minority beneficiaries provided personal time off to
direct care workers compared to just under 50% (48.48%) of all providers with a higher
percentage of minority beneficiaries. A greater proportion of providers that serve individuals
that are younger and physically offered personal time off to direct care staff compared to
those providers that primary serve older individuals (65 and older) (67.56% and 45.66%,
respectively).
Characteristics of Direct Care Workers
The race and ethnicity of direct care workers appears to influence if providers offered
insurance employee only health insurance. Over two-thirds (68.83%) of providers that had
a higher percentage of Hispanic/Latino direct care workers offered personal time off to all
direct care workers compared to 45% (45.47%) providers that had fewer Hispanic/Latino
direct care workers. A much higher proportion of those providers (83.51%) with low
5-39
Wages, Fringe Benefits, and Turnover for Direct Care Workers Working for Long-Term Care Providers in Oregon
proportion of minority direct care workers offered personal time off compared to those
providers with a higher proportion of minority direct care workers (31.47%).
5.3.5 Paid Time Off: Paid Holidays
Characteristics of Providers
Similar to providers that offered personal time off, providers that offered paid holidays are
larger providers located in non-metropolitan or micropolitan areas, that are chain-owned,
are private, non-profit, had a higher proportion of direct care workers with more than 75
hours of training, and offered higher direct care worker wages are more likely to offered
paid holidays to their direct care workers. A larger proportion of private, non-profit
providers (60.79%) offered this benefit to direct care workers compared to private, for-
profit providers and providers owned by the government (federal, state, county or local)
(30.47% and 12.66%, respectively). Just over half (52.95%) of the corporate-owned chain
providers offered paid holidays compared to about 30% (31.01%) of individually owned
providers. A larger proportion of providers (60.75%) located in a non-metropolitan or
micropolitan areas offered paid holidays compared to providers in metropolitan and
micropolitan areas (37.83% and 42.80% respectively).
Almost 60% (58.62%) of larger providers (more than 75 beneficiaries) provided paid time
off compared to less than 40% (39.19%) of smaller providers (75 beneficiaries or less). Half
of providers (50.35%) which had a higher percentage of direct care workers with an
Associate’s Degree or higher offered paid holidays compared to only about 40% (39.17%)
of providers that had a lower percentage of direct care workers with an Associate’s Degree
or more. Close to half (48.12%) of providers that had a higher percentage of direct care
workers with 75 or more hours of training offered employee-only insurance compared to
about two-fifth (37.58%) of providers that had a lower proportion of direct care workers
with less training. Provider direct care worker hourly wages influence if direct care staff are
offered paid holidays or not with the proportion of providers offering this benefit increasing
as the hourly wage does up. Almost 70% (67.85%) of providers that pay more than $16 per
hour offered paid holidays to their direct care workers compared to about half and two-fifths
of providers that pay $12-16 or less than $12 per hour (50.73% and 39.75% respectively).
Characteristics of Individuals Served
Providers that served a higher percentage of beneficiaries with Medicaid as the primary
payer, most commonly serve individuals with intellectual/development disabilities or HIV,
serve younger and disabled individuals, and serve fewer minority beneficiaries are more
likely to have provided their direct care workers with paid time off. Over half (52.10%) of
those providers with a higher percentage of Medicaid beneficiaries provided paid time off
compared to about a third (32.23%) of those providers with fewer primary Medicaid
beneficiaries. Over half (52.58%) of providers serving individuals with
5-40

Section 5 — Provision of Fringe Benefits to Direct Care Workers
intellectual/development disabilities also provide paid holidays compared to about a third of
providers serving people with frailty, dementia, and physical disabilities (31.29%). Similar
proportions of providers, about 40%, offered paid holidays regardless if they had a high or
low proportion of Hispanic/Latino beneficiaries (41.99% and 39.13%, respectively). About
half (49.17%) of providers with a low proportion of minority beneficiaries offered paid
holidays to direct care workers compared to only a third (33.13%) of those providers with a
high proportion of minority beneficiaries. Similarly, almost half of those providers targeting
younger individuals with disabilities provide paid holidays to direct care workers, while only
about a third (31.27%) of those providers who target older people (age 65 and older)
offered paid holidays to direct care workers.
Characteristics of Direct Care Workers
The race and ethnicity of direct care workers appears to influence if providers offered
insurance employee only health insurance. A higher proportion of providers with a higher
proportion of Hispanic/Latino direct care workers offered paid holidays to all direct care
workers compared to providers that had a low proportion of Hispanic/Latino workers
(49.67% and 31.75% respectively). About three-fifths (61.15%) of providers with a low
proportion of minority workers offered paid holidays compared to about a fifth (20.81%) of
providers with a high proportion of minority workers.
5.3.6 Retirement Benefits: Pension, 401(k) or 403(b)
Characteristics of Providers
Those providers that are more likely to offered retirement benefits to their direct care
workers can be characterized as private, non-profit; part of a corporate chain, larger in size,
located in a non-metropolitan/micropolitan area, had a large proportion of direct care
workers with their Associate’s Degree or higher as well as more training, and offered a
higher salary wage. About half (56.26%) of private, non-profit providers offered retirement
benefits to their direct care workers compared to about 18% (17.97%) of private, for profit
providers and 6% (5.82%) of government owned providers. About half (49.31%) of
corporate chain-owned providers offered retirement benefits compared to less than 20%
(18.33%) of providers that operate as individual entities. A higher percentage of providers
located in a non-metropolitan or micropolitan area offered retirement benefits (41.60%),
followed by a smaller proportion of those providers located in metropolitan and micropolitan
areas (30.74% and 27.12% respectively). More than half (54.24%) of large providers (more
than 75 beneficiaries) offered retirement benefits compared to only 30% (29.97%) of
smaller providers (75 beneficiaries or less).
Half (50.35%) of providers that had a higher percentage of direct care workers with an
Associate Degree or higher offered retirement benefits compared to about two-fifths
(39.17%) of providers that had a lower percentage of direct care workers with that level of
5-41

Wages, Fringe Benefits, and Turnover for Direct Care Workers Working for Long-Term Care Providers in Oregon
education. A greater percentage of providers of providers that had a higher percentage of
direct care workers with 75 or more hours of training offered retirement benefits compared
to providers that had fewer direct care workers with less training (46.82% and 25.88%
respectively). More than half of providers paying direct care workers $16 or more an hour
offered retirement benefits compared to about a third of providers offering $12-16 per hour
and less than $12 per hour (36.99% and 30.63% respectively).
Characteristics of Individuals Served
Providers that served a higher percentage of beneficiaries with Medicaid as the primary
payer, most commonly serve individuals with intellectual/development disabilities or HIV,
serve younger and disabled individuals, and serve fewer minority beneficiaries are more
likely to have provided their direct care workers with retirement benefits. A larger
proportion of providers (41.65%) that had a higher percentage of beneficiaries with
Medicaid as the primary payer offered retirement benefits compared to about a quarter
(24.10%) of providers with a lower percentage of Medicaid primary beneficiaries. About
46% of providers that primarily serve individuals with intellectual/developmental disabilities
offered retirement benefits, while about 20% of providers that primarily serve individuals
with frailty, dementia and physical disabilities offered retirement. The same proportion of
providers, 31%, offered paid holidays regardless if they had a high or low proportion of
Hispanic/Latino beneficiaries (30.93% and 30.83% respectively). A higher proportion of
providers that had a low proportion of minority beneficiaries offered retirement benefits
compared to providers that had a high proportion of minority beneficiaries (38.28% and
25.51%). A much higher proportion of providers that serve a younger, disabled population
offered retirement benefits to direct care workers compared to those providers with an
elderly population (40.49% and 22.04% respectively).
Characteristics of Direct Care Workers
The race and ethnicity of direct care workers appears to influence if providers offered
retirement benefits to their direct care workers. Higher proportions of providers offered
retirement benefits if they had a higher percentage of direct care workers that were
Hispanic/Latino, were not minority, had a higher proportion of direct care workers with an
Associate’s Degree or more, required 75 or more hours of training, and were paid $16 per
hour. More providers with a higher percentage of Hispanic/Latino workers offered retirement
benefits compared to providers with a low percentage of Hispanic/Latino workers (42.59%
and 21.12%, respectively). A much greater proportion (55.50%) of providers that had a low
percentage of minority workers offered retirement benefits to direct care workers compared
to facilities with a high proportion of minority direct care workers (8.77%).
5-42

Section 5 — Provision of Fringe Benefits to Direct Care Workers
5.3.7 Life Insurance
Characteristics of Providers
Those providers that are more likely to offered life insurance to their direct care workers can
be characterized as private, non-profit; part of a corporate chain, larger in size, had a large
proportion of direct care workers more training, and offered a higher salary wage. About
half (51.22%) of private, non-profit providers offered direct care workers life insurance. Far
fewer private, for profit providers (46.39%) offered this benefit to direct care workers
compared to even fewer providers owned by the government (5.81%). A larger proportion
of corporate chain providers compared to individual owned providers offered life insurance
to their direct care staff (46.25% and 14.04% respectively). Just over a third (34.46%) of
providers located in non-metropolitan and non-micropolitan areas offered life insurance to
direct care workers compared to both metropolitan and micropolitan areas in which a similar
proportion of providers in these areas offered life insurance to direct care workers (26.73%
and 25.99% respectively). A higher proportion of larger providers (more than 75
beneficiaries) offered life insurance to direct care workers compared to smaller providers
(75 beneficiaries or less) (42.98% and 26.45%, respectively). A similar proportion of
providers that had a higher proportion of direct care workers with an Associate’s Degree or
higher compared to providers that had a lower proportion of direct care workers with an
Associate’s Degree or higher (29.96% and 27.54%, respectively).
About a quarter (22.76%) of providers that required direct care workers to had less than 75
hours of training offered life insurance to these workers compared to 40% (40.42%) of
providers that required less training. Provider direct care worker hourly wages are
associated with whether providers offered life insurance with the proportion of providers
offering this benefit increasing as the hourly wage does up. About 50% (51.27%) of
providers that offered more than $16 per hour offered paid holidays to their direct care
workers compared to smaller proportions of those providers that offered $12-16 or less than
$12.00 per hour (31.14% and 27.06%, respectively).
Characteristics of Individuals Served
Providers that served a higher percentage of beneficiaries with Medicaid as the primary
payer, most commonly serve individuals with intellectual/development disabilities, serve
younger and disabled individuals, and serve fewer minority beneficiaries are more likely to
provide their direct care workers with life insurance. A third of providers (33.80%) with a
higher percentage of beneficiaries that had Medicaid as the primary payer offered
retirement benefits compared to just over a fifth (22.84%) of providers that had a lower
percentage of Medicaid beneficiaries. Providers that serve primarily individuals with
intellectual/development disabilities had the highest proportion (42.44%) of providers
offering life insurance to direct care workers. In contrast, only 16% (16.11%) of providers
primarily serving individuals that are frail, with dementia, and physical disabilities offered
5-43

Wages, Fringe Benefits, and Turnover for Direct Care Workers Working for Long-Term Care Providers in Oregon
life insurance to direct care workers. There is little difference in the proportion of providers
offering life insurance according to whether they had a high or low proportion of
Hispanic/Latino beneficiaries. Approximately 28% (28.13%) of providers with a low
percentage of Hispanic/Latino beneficiaries offered life insurance compared to 24%
(24.02%) of providers with a high number of beneficiaries that are Hispanic/Latino. A higher
proportion of providers that had a low proportion of minority beneficiaries offered life
insurance compared to providers that had a high number of minority beneficiaries (31.72%
and 23.70%). A larger percentage of providers that serve a younger, disabled population
offered life insurance to direct care workers compared to those providers serving an elderly
population (36.79% and 18.04%, respectively).
Characteristics of Direct Care Workers
The race and ethnicity of direct care workers appears to influence if providers offered life
insurance to their direct care workers. A higher proportion of providers with a higher
percentage of Hispanic/Latino direct care workers offered life insurance to direct care
workers compared to providers that had a low percentage of Hispanic/Latino workers
(36.72% and 19.04%, respectively). A greater percentage of providers with a low
percentage of minority workers offered life insurance compared to those providers with a
high percentage of minority workers (46.29% and 9.83%). Educational characteristics of
direct care workers are not associated with the proportion of direct care workers receiving
life insurance while training requirements do.
Table 5-4 analyzes how direct care workers use and enrollment of selected fringe benefits
varies by specific provider characteristics. The same fringe benefit categories are explored
for this analysis as in the previous section of the report (1) health insurance with family
coverage, (2) health insurance for the employee only, (3) paid: personal time off (vacation
time or sick leave), (4) paid holidays, (5) retirement benefits such as a pension plan such as
a 401(k) or 403(b), (6) life insurance. The characteristics explored include (1) facility
characteristics, such as type of ownership, location, primary payer source, provider size,
and educational requirements for direct care workers (2) characteristics of the individuals
served such as race and ethnicity, and (3) the demographic characteristics of the direct care
workers including race and ethnicity.
5-44

5-4
5
Sectio
n 5
— Pro
vision o
f Fringe B
enefits to
Direct C
are Workers
Table 5-4. Direct Care Workers Use/Enrollment in Fringe Benefits, by Provider Characteristics, 2014 (% of Direct Care Workers)
Provider Characteristics
Health Insurance
with Family Coverage
Health Insurance for
Employee Only
Personal Time Off, Vacation
Time, Sick Leave Holidays
Pension or 401(k) or
403(b) Accounts
Employer-Sponsored
Life Insurance
Total Number of Providers 911 1,137 1,607 1,143 885 776
Type of Ownership
Private, non-profit 7.65 55.39 77.74 56.38 23.74 52.61
Private, for profit 8.99 18.20 59.69 44.34 8.31 17.58
Government: federal, state, county or local 18.03 28.15 62.07 55.30 40.77 59.53
Chain Ownership
Part of corporate chain (yes) 10.51 32.98 67.31 53.06 17.43 35.84
Individual entity (no) 5.71 26.31 61.53 40.05 8.86 20.31
MSA
Metropolitan 8.16 31.77 64.55 46.66 15.01 31.38
Micropolitan 10.30 29.44 75.97 56.99 12.56 30.96
Non-Metropolitan/Non-Micropolitan 10.69 22.03 54.57 49.64 10.57 18.30
Dependence on Medicaid
> median beneficiaries with Medicaid as primary payer
9.26 26.69 64.71 51.12 12.19 24.30
< =median beneficiaries with Medicaid as primary payer
8.06 40.25 69.40 43.23 17.47 39.84
(continued)
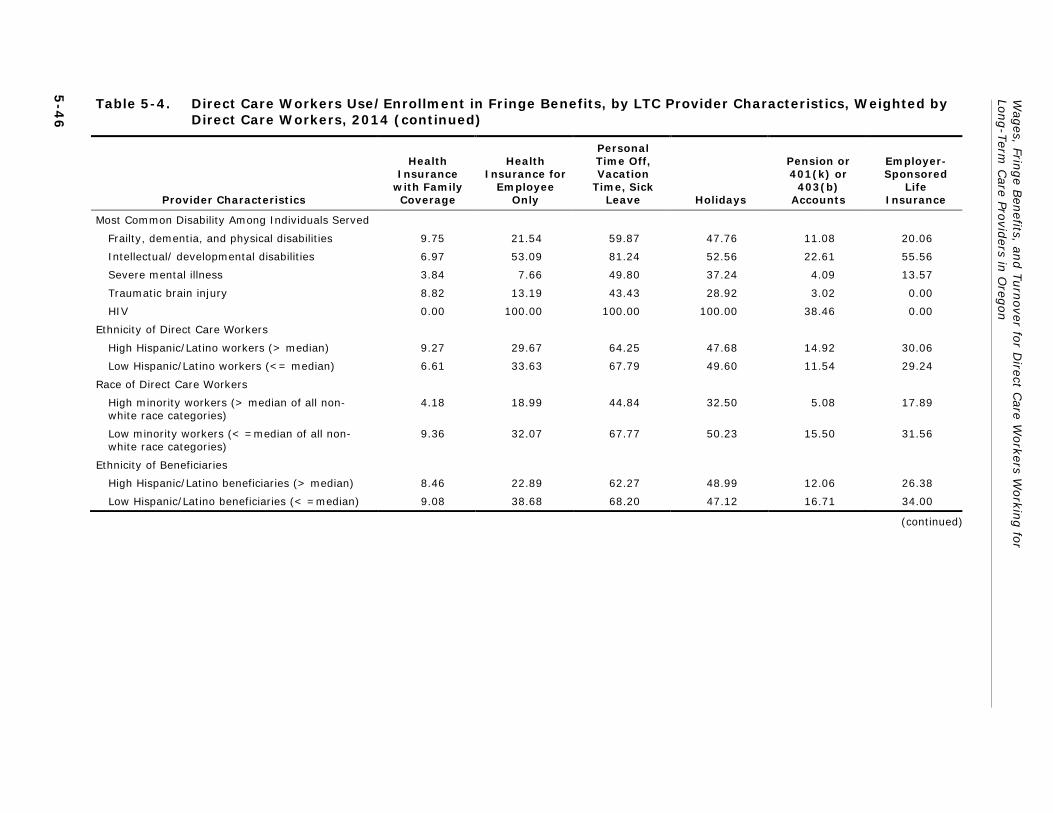
Wag
es, Fringe B
enefits, an
d T
urn
over fo
r Direct C
are Workers W
orkin
g fo
r Lo
ng-T
erm C
are Provid
ers in O
regon
5-4
6
Table 5-4. Direct Care Workers Use/Enrollment in Fringe Benefits, by LTC Provider Characteristics, Weighted by Direct Care Workers, 2014 (continued)
Provider Characteristics
Health Insurance
with Family Coverage
Health Insurance for
Employee Only
Personal Time Off, Vacation
Time, Sick Leave Holidays
Pension or 401(k) or
403(b) Accounts
Employer-Sponsored
Life Insurance
Most Common Disability Among Individuals Served
Frailty, dementia, and physical disabilities 9.75 21.54 59.87 47.76 11.08 20.06
Intellectual/ developmental disabilities 6.97 53.09 81.24 52.56 22.61 55.56
Severe mental illness 3.84 7.66 49.80 37.24 4.09 13.57
Traumatic brain injury 8.82 13.19 43.43 28.92 3.02 0.00
HIV 0.00 100.00 100.00 100.00 38.46 0.00
Ethnicity of Direct Care Workers
High Hispanic/Latino workers (> median) 9.27 29.67 64.25 47.68 14.92 30.06
Low Hispanic/Latino workers (<= median) 6.61 33.63 67.79 49.60 11.54 29.24
Race of Direct Care Workers
High minority workers (> median of all non-white race categories)
4.18 18.99 44.84 32.50 5.08 17.89
Low minority workers (< =median of all non-white race categories)
9.36 32.07 67.77 50.23 15.50 31.56
Ethnicity of Beneficiaries
High Hispanic/Latino beneficiaries (> median) 8.46 22.89 62.27 48.99 12.06 26.38
Low Hispanic/Latino beneficiaries (< =median) 9.08 38.68 68.20 47.12 16.71 34.00
(continued)

5-4
7
Sectio
n 5
— Pro
vision o
f Fringe B
enefits to
Direct C
are Workers
Table 5-4. Direct Care Workers Use/Enrollment in Fringe Benefits, by LTC Provider Characteristics, Weighted by Direct Care Workers, 2014 (continued)
Provider Characteristics
Health Insurance
with Family Coverage
Health Insurance for
Employee Only
Personal Time Off, Vacation
Time, Sick Leave Holidays
Pension or 401(k) or
403(b) Accounts
Employer-Sponsored
Life Insurance
Race of Beneficiaries
High minority beneficiaries (> median of all non-white race categories)
7.95 44.46 70.99 46.86 18.04 41.56
Low minority beneficiaries (< =median of all non-white race categories)
9.01 26.15 63.30 48.47 13.13 26.47
Age of Target Population
Elderly (65 years or more) 9.60 21.70 60.58 46.63 11.08 20.10
Younger individuals with disabilities (Less than 65 years)
6.84 50.24 76.08 51.22 21.56 52.21
Employer Size
Large provider (more than 75 beneficiaries) 6.84 21.04 58.27 39.67 12.12 25.35
Small provider (75 beneficiaries or less) 9.49 34.10 67.74 51.30 15.13 31.84
Education of Direct Care Workers
High education (Associate’s degree or higher) 7.17 29.09 49.55 43.13 8.38 20.22
Low education (less than Associate’s degree) 9.09 30.80 68.48 49.17 15.57 32.11
Training of Direct Care Workers
Less than 75 hours 8.27 27.23 59.06 44.73 15.26 25.54
75 hours or more 9.77 36.15 76.01 53.93 12.57 37.66
(continued)

Wag
es, Fringe B
enefits, an
d T
urn
over fo
r Direct C
are Workers W
orkin
g fo
r Lo
ng-T
erm C
are Provid
ers in O
regon
5-4
8
Table 5-4. Direct Care Workers Use/Enrollment in Fringe Benefits, by LTC Provider Characteristics, Weighted by Direct Care Workers, 2014 (continued)
Provider Characteristics
Health Insurance
with Family Coverage
Health Insurance for
Employee Only
Personal Time Off, Vacation
Time, Sick Leave Holidays
Pension or 401(k) or
403(b) Accounts
Employer-Sponsored
Life Insurance
Wage Rates
Less than $12.00 per hour 5.57 27.98 61.88 40.54 11.56 28.63
$12.00 to $16.00 per hour 11.31 37.51 68.85 51.18 16.19 23.75
More than $16.00 per hour 15.34 33.14 78.63 71.68 15.36 35.55
Note: Unit of analysis is provider
Note: Includes providers <30 responses (Adult day services, IC Specialized Living, and Specialized living services)
Source: RTI International analysis of the 2014 Oregon Wage and Fringe Benefit Survey of Long-Term Care (LTC) Providers.

Section 5 — Provision of Fringe Benefits to Direct Care Workers
Across all fringe benefit categories, few direct care workers were enrolled in health
insurance with family coverage overall and there was little variation among provider
characteristics. The largest share of direct care workers enrolled in employee only health
insurance and both categories of paid time off. Direct care workers employed by providers
that had private, non-profit ownership, that were chain owned, that employed direct care
works with less education but more training, and offered more than $16.00 per hour in
wages were more likely to be enrolled. In comparison, lower proportions of direct care
workers enrolled in retirement benefits and life insurance with some similarities and
differences across different provider characteristics. The highest proportion of direct care
workers enrolled in retirement benefits or life insurance were employed by the government
and chain-owned providers. In contrast, differences in direct care worker enrollment in
retirement benefits and life insurance can be seen among the type of individuals providers
primarily serve, including type of disability, age and race.
5.3.8 Health Insurance: Family Coverage
Characteristics of Providers
Few direct care workers enrolled in health insurance with family coverage in 2014. The
largest share of direct care workers enrolled in health insurance with family coverage were
employed by government-owned providers (18.03%) compared to under 10% of those
direct care workers employed by non-profit or for-profit providers (7.65% and 8.99%,
respectively). Just over 10% (10.51%) of direct care workers, employed by a chain,
enrolled in health insurance with family coverage compared to about 6% (5.71%) of those
direct care workers employed by non-chains. Similar, low proportions of direct care workers
are enrolled in health insurance with family coverage regardless of geographic location.
Micropolitan and rural providers had 10% (10.30%) and 11% (10.69%) of direct care
workers enrolled in family coverage while even fewer (8.16%) direct care workers employed
by metropolitan providers enrolled. Under 10% of direct care workers enrolled whether they
were employed by large or small providers (6.84% and 9.49%, respectively). While there
are also not large differences in the percentage of direct care workers enrolled in family
coverage by providers that employ direct care workers with more education and training,
there is a slight difference when looking at different wage amounts offered by providers. As
direct care workers’ wages increase, the proportion of direct care workers enrolled in family
coverage also increases slightly. About 6% (5.57%) of direct care workers enrolled in family
coverage insurance if they were paid less than $12.00 per hour compared to about 15%
(15.34%) of direct care workers enrolled if providers paid more than $16.00 per hour.
Characteristics of Individuals Served
The beneficiary characteristics that providers primarily serve that had little to no influence
on the percentage of direct care workers enrolled in health insurance with family coverage.
Less than 10% of direct care workers enrolled in family coverage insurance regardless of
5-49
Wages, Fringe Benefits, and Turnover for Direct Care Workers Working for Long-Term Care Providers in Oregon
any beneficiary characteristics including, proportion Medicaid, common disability served,
age, ethnicity and race.
Characteristics of Direct Care Workers
The ethnicity and race of direct care workers employed by providers also has little to no
influence on the percentage of direct care workers enrolled in health insurance with family
coverage. Less than 10% of direct care workers enrolled in family coverage insurance
despite a high or low proportion of Hispanic/Latino or minority workers.
5.3.9 Health Insurance: Employee-only
Characteristics of Providers
A larger proportion of direct care workers enrolled in employee-only health insurance.
Factors related to enrollment include employment by non-profit providers, providers owned
by a chain, smaller providers, providers that have a higher proportion of direct care workers
with more training, and providers that pay direct care workers more than $12.00 per hour.
Over half (55.39%) of direct care workers employed by nonprofit providers were enrolled in
employee- only health insurance compared to about 18% (18.20%) of for-profit providers
and 28% of government-owned providers. About a third (32.98%) of direct care workers,
employed by a chain enrolled in employee -only health insurance compared to about 26%
(26.31%) of direct care workers employed by non-chains. Over a third (34.10%) of direct
care workers, employed by small providers, enrolled in employee-only health insurance
compared to about a fifth (21.04%) of direct care workers employed by large providers.
There is a difference in enrollment by the wages offered by providers. The widest gap of
direct care workers enrolled in employee only health insurance exists between those
employed by providers that paid less than $12.00 per hour compared to those that paid
$12.00-16.00 per hour (27.98% and 37.51%, respectively). The proportion of direct care
workers enrolled in employee-only health insurance drops slightly when they were employed
by providers that paid more than $16.00 per hour to 33% (33.14%), which is unexpected.
Characteristics of Individuals Served
More direct care workers enrolled in employee-only health insurance among providers that
serve a lower proportion of Medicaid beneficiaries, served younger individuals with
intellectual/development disabilities or HIV, had a lower proportion of Hispanic/Latino
beneficiaries and had a higher proportion of minority beneficiaries. About 40% (40.25%) of
direct care workers were employed by providers with a lower proportion of Medicaid
beneficiaries enrolled in employee only insurance compared to 27% (26.69%) of direct care
workers employed by providers with a higher proportion of Medicaid beneficiaries. More
than half (53.09%) of direct care workers employed by providers that primarily served
individuals with intellectual/development disabilities were enrolled in employee-only health
insurance. Of those providers serving younger individuals with disabilities, 50% (50.25%) of
5-50

Section 5 — Provision of Fringe Benefits to Direct Care Workers
their direct care workers enrolled in employee only insurance compared to about 20%
(21.70%) of direct care workers employed by providers that served an elderly population.
Higher proportions of direct care workers employed by providers with a higher proportion of
non-ethnic beneficiaries and a higher proportion of minority beneficiaries (38.68% and
44.46%, respectively) were enrolled in employee only health insurance.
Characteristics of Direct Care Workers
The race of direct care workers employed by providers has some influence on the
percentage of direct care workers enrolled in employee-only health insurance while ethnicity
does not. About a third (33.63%) of direct care workers employed by providers that have a
lower proportion of minority workers are enrolled in employee-only health insurance
compared to about fifth (18.99%) of direct care workers employed by providers that have a
higher proportion of minority direct care workers.
5.3.10 Paid Personal Time Off: Vacation and Sick Leave
Characteristics of Providers
A larger proportion of direct care workers used paid, personal time off if they were
employed by providers that are private, non-profit, located in a micropolitan area, have a
larger proportion of direct care workers with less education, require more training, and pay
direct care workers more than $16.00 per hour. Over half of direct care workers used paid
time off regardless of the type of provider ownership they were employed by, although over
three-fourths (77.74%) of direct care workers employed by nonprofit providers used paid,
personal time off compared to lower proportions of direct care workers employed by for-
profit and government providers (59.69% and 62.07%, respectively). Over three-fourths
(75.97%) of direct care workers employed by providers in a micropolitan area used paid,
personal time off compared to two-thirds (64.55%) of direct care workers employed by
providers in a metropolitan location and just over half (54.57%) of direct care workers
employed by providers located in a rural area. Almost 70% (68.48%) of direct care workers,
employed by providers that have a higher proportion of direct care workers with less
education used the benefit of paid, personal time off compared to almost half (49.55%) of
direct care worker employed by providers with a higher proportion of direct care workers
that have more education. Over three-fourths (76.01%) of direct care workers, employed
by providers that have a larger proportion of workers with more training used paid personal
time off compared to those direct care workers employed by providers that require less
training (59.06%). As the wages that providers offer increase, the proportion of direct care
workers enrolled in paid, personal time off increases at the highest wage level. Almost two-
thirds of direct care workers, employed by providers that pay less than $12.00 per hour
used paid, personal time off compared to 69% (68.85%) of direct care workers paid
$12.00-$16.00 per hour and over 75% (78.68%) of direct care workers who were paid
more than $16.00 per hour.
5-51

Wages, Fringe Benefits, and Turnover for Direct Care Workers Working for Long-Term Care Providers in Oregon
Characteristics of Individuals Served
A large proportion, over half, of direct care workers employed by providers across all
beneficiary characteristics, used paid, personal time off, with the exception of providers that
primarily serve individuals with traumatic brain injury. Over two-thirds of direct care
workers used paid time off whether their employer had had a high or low proportion of
Medicaid beneficiaries (64.71% and 69.40%, respectively). The largest proportions of direct
care workers used paid time off if they were employed by providers that primarily served
individuals with HIV, severe mental illness, or frailty, dementia, and physical disabilities
(100%, 81.24% and 59.87%, respectively). A large difference in the proportion of direct
care workers exists by direct care workers employed by providers who primarily served an
elderly or younger disabled population (60.58% and 76.08%, respectively). There is little
difference in the proportion of direct care workers using paid, personal time off when by the
ethnicity or race of the beneficiary population.
Characteristics of Direct Care Workers
The race of direct care workers employed by providers has some influence on the
percentage of direct care that used paid, personal time off while ethnicity does not. Over
two- thirds (67.77%) of direct care workers, employed by providers that have a lower
proportion of minority workers, used paid, personal time off compared to 44% (44.84%), of
direct care workers employed by providers that have a higher proportion of minority direct
care workers.
5.3.11 Paid Time Off: Paid Holidays
Characteristics of Providers
A larger proportion of direct care workers were offered paid holidays if they were employed
by providers that are non-profit or government owned, chain-owned, located in a
micropolitan area, smaller in size, have a larger proportion of direct care workers with more
training, and pay direct care workers more than $16.00 per hour. Over half of direct care
workers used paid holidays if they were employed by a non-profit or a government entity
(56.38% and 55.30%, respectively). A somewhat lower proportion (44.34%) of direct care
workers used paid holidays if they worked for for-profit providers. More than half (53.06%)
of direct care workers that were employed by chains, used paid holidays compared to 40%
(40.05%) of direct care workers not employed by chains. Over half (56.99%) of direct care
workers employed by providers in a micropolitan area used paid holidays compared to lower
and similar proportions of direct care workers employed by providers located in a
metropolitan or rural areas (46.66% and 49.64%, respectively). Providers also reported
that about half of direct care workers (51.30%) employed by small providers used paid
holidays compared to almost 40% (39.67%) of direct care workers employed by large
providers. Over half (55.93%) of direct care workers, employed by providers that have a
larger proportion of direct care workers with more training used paid holidays off compared
5-52

Section 5 — Provision of Fringe Benefits to Direct Care Workers
to those direct care workers employed by providers that require less training (44.73%). As
the wages that providers offered increases, the proportion of direct care workers that used
paid holidays also increased. Forty percent (40.54%) of direct care workers that were
employed by providers that paid less than $12.00 per hour used paid holidays off compared
to about half (51.18%) of direct care workers paid $12.00-$16.00 per hour. When direct
care workers were paid more than $16.00 per hour there was a large increase to almost
80% (78.68%) of direct care workers using paid holidays.
Characteristics of Individuals Served
Over half of direct care workers employed by providers that had a higher proportion of
Medicaid beneficiaries, served more individuals that had HIV or intellectual/developmental
disabilities and were primarily younger people disabilities used paid holidays. Over half
(51.12%) of direct care workers, employed by providers with a larger proportion of Medicaid
beneficiaries, used paid holidays compared to 43% (43.23%) of direct care workers
employed by providers with a lower proportion of Medicaid beneficiaries. The largest
proportions of direct care workers used paid holidays if they were employed by providers
that primarily served individuals with HIV or severe mental illness, (100% and 52.56%,
respectively). There was a small difference in the proportion of direct care workers using
paid holidays between those employed by providers who primarily served an elderly and
that served primarily a younger disabled population (46.63% and 51.22%, respectively).
Characteristics of Direct Care Workers
The race of direct care workers employed by providers also has some influence on the
percentage of direct care that used paid, personal time off while ethnicity does not. About
half (50.23%) of direct care workers, employed by providers that have a lower proportion of
minority workers, used paid, personal time off compared to about a third (32.50%%) of
direct care workers employed by providers that have a higher proportion of minority direct
care workers.
5.3.12 Retirement Benefits: Pension, 401(k) or 403(b)
Characteristics of Providers
A larger proportion of direct care workers enrolled in retirement benefits were employed by
providers that are government owned compared to nonprofit and for-profit owned providers.
About 41% of direct care workers employed by government-owned providers enrolled in
retirement benefits compared to under about 20% of those direct care workers employed by
non-profit and less than 10% for-profit providers (23.74% and 8.31%, respectively). Under
20% (17.43%) of direct care workers, employed by chains enrolled in retirement benefits
compared to about 9% (8.86%) of those direct care workers employed by non-chains.
Similar, low proportions (11%-15%) of direct care workers were enrolled in retirement
benefits regardless of geographic location. Employment by large or small providers made
5-53
Wages, Fringe Benefits, and Turnover for Direct Care Workers Working for Long-Term Care Providers in Oregon
little difference in the percentage of direct care workers enrolled in retirement benefits
(12.12% and 15.13%, respectively). Less than 10% (8.38%) direct care workers, employed
by providers that have a higher proportion of direct care workers with more education
enrolled in retirement benefits compared to a slightly higher proportion (15.57%) of direct
care workers employed by providers that have a direct care workers with less education.
There is little difference in the percentages of direct care workers enrolled in retirement
benefits when comparing employees that offered more or less training and lower or higher
wages.
Characteristics of Individuals Served
The beneficiary characteristics that providers primarily served that had little to no influence
on the percentage of direct care workers enrolled in retirement benefits. Between 10 to
20% of direct care workers enrolled in retirement benefits regardless of the proportion of
Medicaid service user, beneficiary age (elderly or young), ethnicity and race. There was a
larger difference in the proportion of direct care workers enrolled in retirement benefits by
the most common disability their employer served. Almost 40% (38.46%) of direct care
workers, employed by providers primarily serving an HIV population, enrolled in retirement
benefits compared to about 20% (22.61%) of those direct care workers employed providers
serving individuals with intellectual/development disabilities. Far lower proportions of direct
care workers enrolled in retirement benefits if employed by the other provider types,
including providers serving primarily frailty, dementia and physical disabilities, severe
mental illness, and traumatic brain injury (11.08%, 4.09%, and 3.02%, respectively).
Characteristics of Direct Care Workers
The race of direct care workers employed by providers has some influence on the
percentage of direct care workers enrolled retirement benefits while ethnicity does not.
About 16% (15.50%) of direct care workers employed by providers that had a lower
proportion of minority workers enrolled in retirement benefits compared to about 5%
(5.08%) of direct care workers employed by providers that had a higher proportion of
minority direct care workers.
5.3.13 Life Insurance
Characteristics of Providers
A higher proportion of direct care workers enrolled in life insurance were employed by
providers that were government owned, nonprofit, chain owned, located in a metro or
micropolitan area, and had a higher proportion of direct care workers with more training.
The largest share of direct care workers enrolled in life insurance benefits were employed by
the government and nonprofit providers (59.53% and 52.61%, respectively) compared to
under 20% (17.58%) of those direct care workers employed by private, for-profit providers.
Over a third (35.43%) of direct care workers, employed by chain owned providers enrolled
5-54

Section 5 — Provision of Fringe Benefits to Direct Care Workers
in life insurance compared to about a fifth (20.31%) of direct care workers employed by
non-chains. About a third of direct care workers employed by providers located in
metropolitan or micropolitan areas (31.38% and 30.96%, respectively) enrolled in life
insurance compared to under 20% (18.30%) of direct care workers employed by rural
providers. A slightly higher proportion of direct care workers (32.11%) employed by
providers that had a higher proportion of direct care workers with less education enrolled in
life insurance compared to about a fifth (20.22%) of direct care workers employed by
providers that have a direct care workers with more education. A higher proportion of direct
care workers enrolled in life insurance if employed by providers that required more training
compared to providers requiring less training (37.66% and 25.54%, respectively).
Characteristics of Individuals Served
A larger proportion of direct care workers enrolled in life insurance when employed by
providers that had a lower percentage of Medicaid beneficiaries, served more individuals
with intellectual/developmental disabilities and were younger, and had a higher proportion
of minority beneficiaries. About 40% (39.84%) of direct care workers employed by
providers with a lower proportion of Medicaid beneficiaries enrolled in life insurance
compared to about quarter (24.30%) of direct care workers employed by providers with a
higher proportion of Medicaid beneficiaries. Over half (55.56%) direct care workers enrolled
in life insurance if they were employed by providers that primarily served individuals with
intellectual/developmental disabilities. No direct care workers, employed by provider’s
primarily serving individuals with traumatic brain injury or HIV, enrolled in life insurance.
There is a relatively large difference in the proportion of direct care workers enrolled in life
insurance if they were employed by providers who primarily serve an elderly or younger and
disabled population (20.10% and 52.21%, respectively). About two-fifths (41.56%) of
direct care workers employed by providers that had a higher proportion of minority
beneficiaries enrolled in life insurance compared to 26% (26.47%) of direct care workers
employed by providers with a lower proportion of minority beneficiaries.
Characteristics of Direct Care Workers
The race of direct care workers employed by providers has some influence on the
percentage of direct care workers enrolled in life insurance benefits while ethnicity does not.
Almost a third (31.56%) of direct care workers employed by providers that have a lower
proportion of minority workers enrolled in life insurance compared to about 18% (17.89%)
of direct care workers employed by providers that have a higher proportion of minority
direct care workers.
5-55

Wages, Fringe Benefits, and Turnover for Direct Care Workers Working for Long-Term Care Providers in Oregon
5.4 Predictors of Benefit Offerings for Long-Term Care Direct Care Workers
Table 5-5a and 5-5b present multivariate analyses of selected fringe benefit offerings—
employee-only health insurance and paid time off—to direct care workers. The analysis was
conducted pooling all long-term care providers. The table provides information on which
factors affect the offer of these two fringe benefits by providers to direct care workers in
Oregon holding other factors constant. The analyses focus on certain characteristics of long-
term care providers that may influence fringe benefit offerings, including the types of
providers as well as their ownership, size, location, and requirements around training for
direct care workers. Other factors that were accounted for include the ethnicity, race,
education levels, and pay of the direct care workers, as well as the service users’ age and
primary payer source for services received. The analyses considers the effect these factors
play in whether providers are more or less likely to Table 5-6a provides data on the odds
that a provider will offer employee only health insurance and Table 5-6b provides data on
the odds that a provider will offer paid time off, vacation time, or sick leave to full-time
direct care workers.
5.4.1 Employee-Only Health Insurance for Full-Time Direct Care Workers (Table 5-5a)
In general, the type of long-term care provider did not have a statistically significant effect
on whether they offered employee-only health insurance to their full-time direct care
workers. Long-term care providers who were private for-profit, part of corporate chain,
larger in size, located in metropolitan areas, and required more training for their direct care
workers were significantly more likely to offer their full-time direct care workers employee-
only health insurance. On the other hand, certain differences among direct care workers and
service users resulted in a significantly lower likelihood to offer this benefit. Providers with
higher proportions of Hispanic/Latino direct care workers and direct care workers with lower
pay, as well as higher proportions of service users who paid primarily with Medicaid were
significantly less likely to offer employee-only health insurance to their full-time direct care
workers.
Long-Term Care Provider Factors
The type of long-term care provider had very little effect on whether providers were likely to
offer employee-only health insurance to their full-time direct care worker. Non-profit
providers were over two times as likely to offer employee-only health insurance than were
providers that were government-owned (p=0.0005). On the other hand, the odds that
privately owned, for-profit providers would offer full-time direct care workers employee-only
health insurance are less than for government entities (p=0.0028). Providers that were part
of a corporate chain were almost three times more likely to offer employee-only health
insurance to their full-time direct care workers than those providers that were not part of a
5-56

Section 5 — Provision of Fringe Benefits to Direct Care Workers
corporate chain (p<0.0001). Larger providers (p=0.0086) and providers that required at
least 75 hours of training for their direct care workers (p=0.0066) were significantly more
likely to provide employee-only health insurance coverage to their full-time direct care
workers. And finally, providers that were located in metropolitan areas were almost three
times more likely to offer employee-only health insurance benefits to their full-time direct
care workers than providers in rural areas (p<0.0001). However, those providers located in
micropolitan areas were significantly less likely to offer employee-only health insurance to
their full-time direct care workers than providers located in more rural areas (p=0.0033).
Similarly, the odds that providers will offer employee-only health insurance is much higher
among providers located in metropolitan areas than for providers located in rural areas.
Providers who paid a higher proportion of their direct care workers less than $12.00 an hour
also were significantly less likely to offer their full-time direct care workers employee-only
health insurance than those providers who paid more of their employees at or above the
$12.00 an hour rate (p=0.0017).
Direct Care Worker Factors
Among the direct care worker factors analyzed, the factors that affected the odds that
providers will offer employee-only health insurance to their direct care workers included the
ethnicity of the direct care worker and their education level. Providers who reported higher
proportions of Hispanic/Latino direct care workers were significantly less likely to offer
employee-only health insurance to their full-time direct care workers (p=0.0018). Providers
who reported higher proportions of direct care workers who had more than high school
levels of education were more likely to offer employee-only health insurance to their full-
time direct care workers (p=0.0397).
Service User Factors
The service user factor that had a significant effect on whether providers offered employee-
only health insurance to their full-time direct care worker was the proportion of service
users who paid with Medicaid for the services received. Providers with a higher proportion of
Medicaid beneficiaries were less likely to offer their full-time direct care workers employee-
only health insurance than providers with lower proportions of Medicaid beneficiaries
(p=0.0215).
5-57

Wages, Fringe Benefits, and Turnover for Direct Care Workers Working for Long-Term Care Providers in Oregon
Table 5-5a. Logistic Regression of Employee-only Health Insurance Offered to Full-time Direct Care Workers
Variables Coefficient Odds Ratio P-Value
Type of Provider
Nursing Facility -1.8888 1.2980 0.9958
Residential Care APD -3.5966 0.2350 0.9921
Residential Care DD Adult -1.6370 1.6700 0.9964
Adult APD -5.7896 0.0260 0.9872
Adult DD -5.5294 0.0340 0.9878
Assisted Living Facility APD -1.8266 1.3820 0.9960
In Home Care Agency -5.6632 0.0300 0.9875
Adult Day Services APD -5.3336 0.0410 0.9882
IC Specialized Living 12.2662 >999.999 0.9968
Specialized Living Services 11.6308 >999.999 0.9970
Type of Ownership
Private, nonprofit organization 0.6173 2.1700 0.0005
Private, for profit organization -0.4599 0.7390 0.0028
Government - federal, state, county, or local 0.0000 1.0000 .
Part of Corporate Chain Ownership
Yes 0.5168 2.8110 <.0001
No 0.0000 1.0000 .
Proportion of Direct Care Workers Who are Hispanic/Latino
-0.0115 0.9890 0.0018
Proportion of Direct Care Workers Who are Nonwhite
-0.0034 0.9970 0.1723
Proportion of Beneficiaries Who Have Their Care Paid by Medicaid
-0.0050 0.9950 0.0215
Proportion of Beneficiaries Who Are Over Age 65
0.0016 1.0020 0.6305
Number of Beneficiaries 0.0092 1.0090 0.0086
Proportion of Direct Care Workers With More Than a High School Education
0.0119 1.0120 0.0397
Whether the Provider Requires 75 or More Hours of Training
Yes 0.2587 1.6780 0.0066
No 0.0000 1.0000 .
(continued)
5-58

Section 5 — Provision of Fringe Benefits to Direct Care Workers
Table 5-5a. Logistic Regression of Employee-only Health Insurance Offered to Full-time Direct Care Workers (continued)
Variables Coefficient Odds Ratio P-Value
Whether the Provider is Rural
Metropolitan 0.7603 2.9140 <.0001
Micropolitan -0.4512 0.8680 0.0033
Non-Metropolitan/Non-Micropolitan 0.0000 1.0000 .
Proportion of Direct Care Workers Who Make Less Than $12.00 per hour
-0.0068 0.9930 0.0071
Note: Unit of analysis is providers
Note: Include providers <30 (Adult day services, IC Specialized Living, and Specialized living services.
Source: RTI International analysis of the 2014 Oregon Wage and Fringe Benefit Survey of Long-Term Care (LTC) Providers.
5.4.2 Paid Time Off for Full-Time Direct Care Workers (Table 5-5b)
Similar to the offering of employee-only health insurance, a number of factors affected the
odds that long-term care providers in Oregon offered paid personal time off, vacation time,
or sick leave to their full-time direct care workers. Long-term care providers who were
privately owned, part of corporate chain, larger in size, and required more training for their
direct care workers were significantly more likely to offer their full-time direct care workers
employee-only health insurance. On the other hand, certain differences among direct care
workers and service users resulted in result significantly less likely to offer this benefit.
Providers with higher proportions of minority direct care workers and direct care workers
with lower pay were significantly less likely to offer paid time off benefits to their full-time
direct care workers.
Long-Term Care Provider Factors
Similar to the offering of the employee-only health insurance benefit, the type of long-term
care provider had very little effect on whether they were more or less likely to offer paid
personal time off, vacation time, or sick leave to their full-time direct care workers.
However, the type of ownership did have a significant effect on which providers offered paid
time off to their direct care workers. Privately owned, for-profit were almost five times more
likely to offer paid time off than providers who were government owned (p=<0.0001).
Likewise, providers who were private, non-profit entities were almost four times more likely
to offer paid time off to their full-time direct care staff than government-owned providers
(p=0.0413). Providers that were part of a corporate chain were about two times more likely
to offer paid time off to their full-time direct care workers than those providers that were
not part of a corporate chain (p<0.0001). Providers that served more long-term care
service users (p=0.0124) were more likely to offer paid time off, and those providers that
required at least 75 hours of training for their direct care workers were two times more
likely to offer their full-time direct care workers paid time off benefits than those providers
5-59
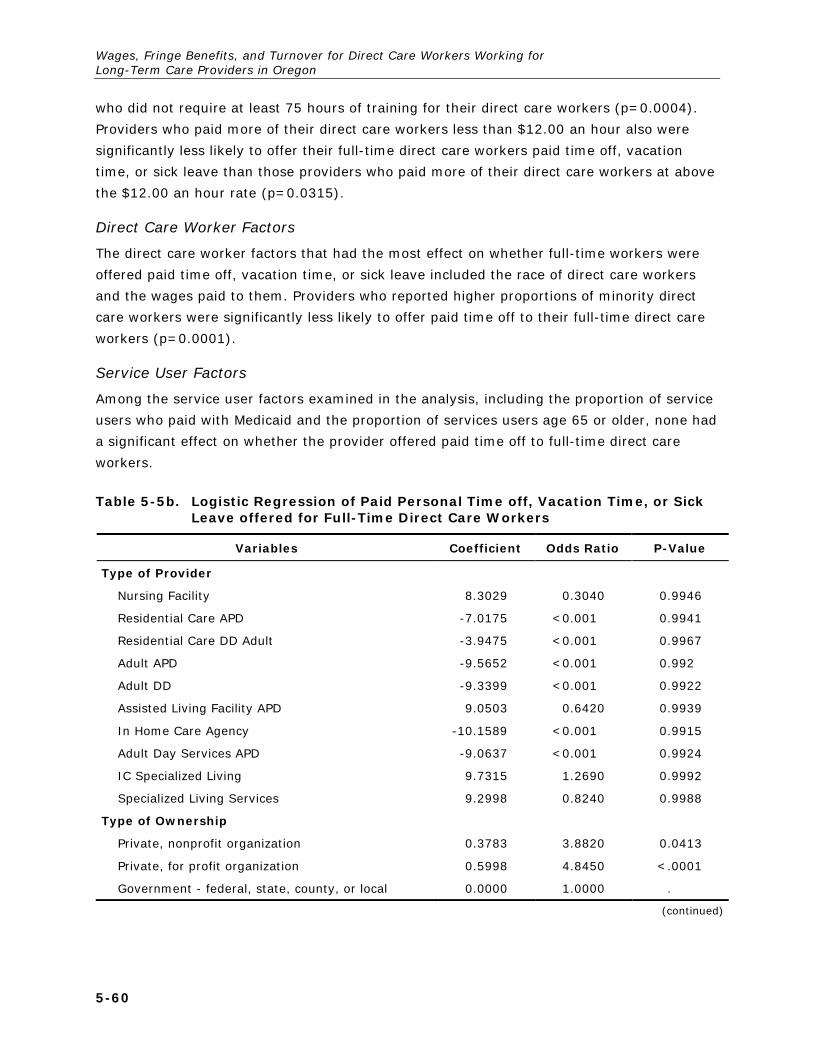
Wages, Fringe Benefits, and Turnover for Direct Care Workers Working for Long-Term Care Providers in Oregon
who did not require at least 75 hours of training for their direct care workers (p=0.0004).
Providers who paid more of their direct care workers less than $12.00 an hour also were
significantly less likely to offer their full-time direct care workers paid time off, vacation
time, or sick leave than those providers who paid more of their direct care workers at above
the $12.00 an hour rate (p=0.0315).
Direct Care Worker Factors
The direct care worker factors that had the most effect on whether full-time workers were
offered paid time off, vacation time, or sick leave included the race of direct care workers
and the wages paid to them. Providers who reported higher proportions of minority direct
care workers were significantly less likely to offer paid time off to their full-time direct care
workers (p=0.0001).
Service User Factors
Among the service user factors examined in the analysis, including the proportion of service
users who paid with Medicaid and the proportion of services users age 65 or older, none had
a significant effect on whether the provider offered paid time off to full-time direct care
workers.
Table 5-5b. Logistic Regression of Paid Personal Time off, Vacation Time, or Sick Leave offered for Full-Time Direct Care Workers
Variables Coefficient Odds Ratio P-Value
Type of Provider
Nursing Facility 8.3029 0.3040 0.9946
Residential Care APD -7.0175 <0.001 0.9941
Residential Care DD Adult -3.9475 <0.001 0.9967
Adult APD -9.5652 <0.001 0.992
Adult DD -9.3399 <0.001 0.9922
Assisted Living Facility APD 9.0503 0.6420 0.9939
In Home Care Agency -10.1589 <0.001 0.9915
Adult Day Services APD -9.0637 <0.001 0.9924
IC Specialized Living 9.7315 1.2690 0.9992
Specialized Living Services 9.2998 0.8240 0.9988
Type of Ownership
Private, nonprofit organization 0.3783 3.8820 0.0413
Private, for profit organization 0.5998 4.8450 <.0001
Government - federal, state, county, or local 0.0000 1.0000 .
(continued)
5-60

Section 5 — Provision of Fringe Benefits to Direct Care Workers
Table 5-5b. Logistic Regression of Paid Personal Time off, Vacation Time, or Sick Leave offered for Full-Time Direct Care Workers (continued)
Variables Coefficient Odds Ratio P-Value
Part of Corporate Chain Ownership
Yes 0.3659 2.0790 <.0001
No 0.0000 1.0000 .
Proportion of Direct Care Workers Who are Hispanic/Latino
0.00192 1.0020 0.4943
Proportion of Direct Care Workers Who are Nonwhite
-0.0078 0.9920 0.0001
Proportion of Beneficiaries Who Have Their Care Paid by Medicaid
-0.00134 0.9990 0.5176
Proportion of Beneficiaries Who Are Over Age 65 -0.00328 0.9970 0.2083
Number of Beneficiaries 0.014 1.0140 0.0124
Proportion of Direct Care Workers With More Than a High School Education
-0.00395 0.9960 0.2809
Whether the Provider Requires 75 or More Hours of Training
Yes 0.355 2.0340 0.0004
No 0.0000 1.0000 .
Whether the Provider is Rural
Metropolitan 0.2967 2.0930 0.0594
Micropolitan 0.1454 1.8000 0.4246
Non-Metropolitan/Non-Micropolitan 0.0000 1.0000 .
Proportion of Direct Care Workers Who Make Less Than $12.00 per hour
-0.0042 0.9960 0.0315
Note: Unit of analysis is providers
Note: Include providers <30 (Adult day services, IC Specialized Living, and Specialized living services
Source: RTI International analysis of the 2014 Oregon Wage and Fringe Benefit Survey of Long-Term Care (LTC) Providers.
5-61


6. TURNOVER
6.1 Introduction
Chapter 6 provides data on turnover among direct care workers employed by long-term
care providers participating in the Medicaid program in Oregon. Highlight Box 4
summarizes the findings of this chapter. Annual turnover rate was calculated as the
estimated total number of direct care workers in 2014 (Q18) divided by the number of
current direct care workers (Q12) and then was adjusted by the proportion of year for which
the data were collected. Figure 6-1 describes the average annual turnover rate of OR direct
care workers in 2014 by provider type. Table 6-2 analyzes how turnover varies by
provider, client, and direct care worker characteristics.
Highlights Box 4: Turnover Among Direct Care Workers Employed by Long-Term Care Providers Participating in the Medicaid Program in Oregon
• Average annual turnover among direct care workers was 64% a year, with wide variation across provider types. Residential care facilities for adults with developmental disabilities had the highest turnover rates at 90% per year, while adult foster care homes for people with developmental disabilities had the lowest turnover rate at 30%. Nursing facilities had turnover rates of 54%.
• Provider, service user, and direct care worker characteristics were associated with different turnover rates. Nonprofit ownership, chain ownership, micropolitan and rural location, providers focusing on people with developmental disabilities and severe mental illness, a low proportion of minority workers, and a high proportion of minority service users were associated with high turnover rates. Turnover rates did not differ by whether the provider served a high or low proportion of Medicaid beneficiaries.
• A multivariate analysis of turnover rates found that, controlling for other factors, the following variables were statistically significantly associated with higher turnover rates: residential care facilities for adults with developmental disabilities, for-profit and chain ownership, requiring direct care workers to have 75 or more hours of training, and lower wages paid to direct care workers. Variables statistically significantly associated with lower turnover rates include: proportion of long-term care workers who are nonwhite location in a metropolitan areas and proportion of service users who use Medicaid as their primary method of payment for services.
Oregon long-term care providers had high turnover rates of direct care workers in 2014.
RCFs-APD had the highest turnover rates while AFCs-APD had the lowest. Certain, provider
characteristics that are related to higher turnover rates in OR. The characteristics of those
providers include those that are part of a corporate chain, micropolitan and non-
metropolitan/non-micropolitan, and those with a higher proportion of direct care workers
with more than 75 hours of training. There are slight differences in the proportion of
6-1

Wages, Fringe Benefits, and Turnover for Direct Care Workers Working for Long-Term Care Providers in Oregon
provider turnover rates when looking at beneficiary characteristics including race and
ethnicity. Providers with a larger proportion of low minority direct care workers, however,
had a higher turnover rate compared to those providers with a larger proportion of high
minority direct care workers.
6.1.1 Overall Turnover Rates (Figure 6-1) (Table 6-1)
Figure 6-1 and Table 6-1 show overall turnover in 2014 was 64% a year. AFCs-DD had
the lowest turnover rate and are the only provider to have less than a 70% turnover of their
direct care workers (67%). RCFs-DD had the highest turnover over rate of direct care
workers, over 100% (106%). In-home Care Agencies and ALFs-APD had the second highest
direct care worker turnover rates at 89% and 91% respectively. AFCs-DD, Nursing Facilities,
and RCFs-APD had lower, but still high, rates of direct care worker turnover from 76% to
86% (77%, 82%, and 86% respectively).
6-2

Section 6 — Turnovers
Figure 6-1. Average Turnover Rate of Direct Care Workers, by Provider Type, 2014
Note: Turnover calculated as estimated total number of direct care workers in 2014 divided by the number of current direct care workers. Unit of analysis is providers. No columns for Adult Day Services and Specialized Living Facilities because there were <30 responses. Data on Residential Care Facilities with Contract Rates Residential Care Facilities for Children with Developmental Disabilities, and Supportive Living Services for Individuals with Developmental Disabilities are included in Appendix D.
Source: RTI International analysis of the 2014 Oregon Wage and Fringe Benefit Survey of Long-Term Care (LTC) Providers.
7265
72
54
69
50
31
90
76
0
10
20
30
40
50
60
70
80
90
100Av
erag
e An
nual
Tur
nove
r Rat
e
6-3

Wages, Fringe Benefits, and Turnover for Direct Care Workers Working for Long-Term Care Providers in Oregon
Table 6-1. Average Turnover Rate of Direct Care Workers, by LTC Provider Type, 2014
LTC Provider Type Average Annual Turnover
Total Number of Providers 2,867
Total LTC Providers 0.64
Assisted Living Facilities: Aged/Physical Disabilities 0.72
Residential Care Facilities: Aged/Physical Disabilities 0.65
Residential Care Contract 0.72
Nursing Facility 0.54
In-Home Care Agency 0.69
Adult Foster Care Home: Aged/Physical Disabilities 0.50
Adult Foster Care Home: Adults/Developmental Disabilities 0.31
Residential Care: Adults/Developmental Disabilities 0.90
Residential Care: Children/Developmental Disabilities 0.76
Note: Turnover calculated as estimated total number of direct care workers in 2014 divided by the number of current direct care workers. Unit of analysis is providers.
Source: RTI International analysis of the 2014 Oregon Wage and Fringe Benefit Survey of Long-Term Care (LTC) Providers.
6.1.1 Provider Characteristics
Table 6-2 shows that almost all types of providers, regardless of their characteristics or the
characteristics of their beneficiaries had high turnover rates of direct care workers in 2014.
Private, non-profit facilities had over a 68% turnover of their direct care workers in 2014
compared to a 61% turnover of these workers in private, for-profit providers. In contrast,
government providers experienced a lower turnover rate of their direct care workers (28%).
Providers owned by a corporate chain had a 50% higher direct care worker turnover rate
compared to those providers that were individually owned providers (75% compared to
50%). Providers located in non-metropolitan/micropolitan areas had a 100% turnover of
their direct care workers compared to those providers located in metropolitan and
micropolitan areas (54% and 84%, respectively). Turnover rates in large or small providers
are equally high (63% and 61%, respectively).
Providers that had a higher proportion of direct care workers with a higher education (more
than an Associate’s Degree) compared to those that did not had a seven percentage point
lower turnover rate of their direct care workers in 2014 (57% and 63% respectively). In
contrast to education levels, training requirements of direct care workers appears to be
associated with turnover rates, although not in the expected direction. Providers that
required 75 or more hours of training had a higher turnover of these staff compared to
providers that required less training (less than 75 hours) (68% and 59% respectively).
Turnover rate of direct care workers and the wages appear to be somewhat inversely
related. Providers that paid less than $12.00 per hour had a 66% turnover rate compared
6-4

Section 6 — Turnovers
with 54% for providers that paid $12.00 to $16.00 per hour and 75% for providers that paid
more than $16.00 per hour.
Table 6-2. Average Turnover Rate of Direct Care Workers, by Provider Characteristics, 2014
Provider Characteristics Average Annual Turnover
Total Number of Providers 2,867
Type of Ownership
Private, non-profit 0.68
Private, for profit 0.61
Government: federal, state, county or local 0.28
Chain Ownership
Part of corporate chain (yes) 0.75
Individual entity (no) 0.50
MSA
Metropolitan 0.54
Micropolitan 0.84
Non-Metropolitan/Non-Micropolitan 2.00
Dependence on Medicaid
> median beneficiaries with Medicaid as primary payer 0.63
< =median beneficiaries with Medicaid as primary payer 0.64
Most Common Disability Among Individuals Served
Frailty, dementia, and physical disabilities 0.56
Intellectual/ developmental disabilities 0.68
Severe mental illness 0.74
Traumatic brain injury 0.32
HIV 0.31
Ethnicity of Direct Care Workers
High Hispanic/Latino workers (> median) 0.63
Low Hispanic/Latino workers (< =median) 0.60
Race of Direct Care Workers
High minority workers (> median of all non-white race categories) 0.49
Low minority workers (< =median of all non-white race categories) 0.75
(continued)
6-5

Wages, Fringe Benefits, and Turnover for Direct Care Workers Working for Long-Term Care Providers in Oregon
Table 6-2. Average Turnover Rate of Direct Care Workers, by Provider Characteristics, 2014 (continued)
Provider Characteristics Average Annual Turnover
Ethnicity of Beneficiaries
High Hispanic/Latino beneficiaries (> median) 0.53
Low Hispanic/Latino beneficiaries (< =median) 0.64
Race of Beneficiaries
High minority beneficiaries (> median of all non-white race categories) 0.63
Low minority beneficiaries (< =median of all non-white race categories) 0.59
Age of Target Population
Elderly (65 years or more) 0.58
Younger individuals with disabilities (Less than 65 years) 0.65
Employer Size
Large provider (more than 75 beneficiaries) 0.63
Small provider (75 beneficiaries or less) 0.61
Education of Direct Care Workers
Higher than median education 0.57
Lower than median education 0.64
Training of Direct Care Workers
Less than 75 hours 0.59
75 hours or more 0.68
Fringe Benefits Offered in 2014
Health insurance with family coverage 0.52
Health insurance for employee only 0.79
Paid personal time off, vacation time, or sick leave 0.50
Paid holidays 0.76
Pension or 401(k) or 403(b) accounts 0.42
Employer-sponsored life insurance 0.73
Wage Rates 0.57
Less than $12.00 per hour 0.66
$12.00 to $16.00 per hour 0.54
More than $16.00 per hour 0.75
Note: Turnover calculated as estimated total number of direct care workers in 2014 divided by the number of current direct care workers. Unit of analysis is providers.
Source: RTI International analysis of the 2014 Oregon Wage and Fringe Benefit Survey of Long-Term Care (LTC) Providers.
6-6

Section 6 — Turnovers
The ethnicity and race of direct care workers appears to have some influence over turnover
rates of direct care workers. Providers with a higher proportion of Hispanic/Latino direct
care workers had a slightly higher turnover rate (88%) of these staff compared to providers
with a lower proportion of Hispanic/Latino direct care workers (84%). The race of direct care
workers had a bigger impact on turnover rates compared to ethnicity. Providers with a lower
proportion of minority workers had a much larger turnover rate compared to those
providers with a higher proportion of minority workers (94% and 78%, respectively).
6.2 Predictors of the Annual Turnover Rate for Long-Term Care Direct Care Workers
Table 6-3 presents the results of a multivariate analysis of annual turnover rates for direct
care workers. The analysis was conducted pooling all long-term care providers. The table
provides information on which factors affect the turnover rate for direct care workers in
Oregon holding other factors constant. The analysis focuses on certain characteristics of
long-term care providers that may influence the turnover rates of direct care workers,
including the types of providers as well as their ownership, size, location, and requirements
around training for direct care workers. Other factors that were accounted for in the
regression include the ethnicity, race, and education levels of the direct care workers, as
well as the service users’ age and primary payer source for services received.
Table 6-3. OLS Regression of Direct Care Worker Turnover Rate, 2014
Variables Coefficient P-Value
Type of Provider
Nursing Facility 0.0553 0.8080
Residential Care APD 0.0457 0.8422
Residential Care DD Adult 0.4484 0.0144
Adult APD 0.1438 0.4658
Adult DD -0.0148 0.9398
Assisted Living Facility APD 0.0994 0.6554
In Home Care Agency 0.1837 0.4983
Adult Day Services APD 0.0883 0.8184
IC Specialized Living 0.5226 0.6494
Specialized Living Services 0.0663 0.9361
Type of Ownership
Private, nonprofit organization 0.0702 0.5749
Private, for profit organization 0.2506 0.0252
Government - federal, state, county, or local 0.0000 .
(continued)
6-7

Wages, Fringe Benefits, and Turnover for Direct Care Workers Working for Long-Term Care Providers in Oregon
Table 6-3. OLS Regression of Direct Care Worker Turnover Rate, 2014 (continued)
Variables Coefficient P-Value
Part of Corporate Chain Ownership
Yes 0.2134 0.0002
No 0.0000 .
Proportion of Direct Care Workers Who are Hispanic/Latino
-0.0002 0.8532
Proportion of Direct Care Workers Who are Nonwhite -0.0017 0.0277
Proportion of Beneficiaries Who Have Their Care Paid by Medicaid
-0.0016 0.0188
Proportion of Beneficiaries Who Are Over Age 65 -0.0007 0.5032
Number of Beneficiaries -0.0006 0.5012
Proportion of Direct Care Workers With More Than a High School Education
0.0013 0.4168
Whether the Provider Requires 75 or More Hours of Training
Yes 0.1283 0.0333
No 0.0000 .
Whether the Provider is Rural
Metropolitan -0.3278 0.0012
Micropolitan -0.1439 0.2159
Non-Metropolitan/Non-Micropolitan 0.0000 .
Proportion of Direct Care Workers Who Make Less Than $12.00 per hour
0.1933 0.0164
Note: Unit of analysis is providers.
Source: RTI International analysis of the 2014 Oregon Wage and Fringe Benefit Survey of Long-Term Care (LTC) Providers.
6.2.1 Long-Term Care Provider Factors
In general, most long-term care provider types did not affect the turnover rate of direct
care workers, although the type of ownership, the hours required for direct care worker
training, and the pay of direct care workers had significant effects on the turnover rate of
direct care workers. Among provider types, only residential care facilities for aged/physical
disabilities were significantly more likely to have higher turnover rates (p=0.0144).
Private for-profit providers had significantly higher turnover rates of direct care workers
compared to government-owned providers (p=0.0252). Being part of a corporate chain also
significantly increased the turnover rates of direct care workers compared to providers that
were individual entities (p=0.0002). Unexpectedly, providers that required at least 75 hours
of training for direct care workers had higher turnover rates than providers with lower
training requirements (p=0.0333). However, providers located in metropolitan areas had
6-8

Section 6 — Turnovers
lower turnover rates of their direct care workers when compared to providers located in
more rural areas (p=0.0012). Providers that had a higher proportion of low wage direct care
workers (less than $12.00 an hour) high higher turnover rates than providers who had a
lower proportion of low wage direct care workers.
6.2.2 Direct Care Worker Factors
Among the direct care worker factors accounted for, the race and pay of the direct care
workers significantly affected their turnover rates overall. Those providers who had higher
proportions of minority direct care workers were significantly more likely to have lower
turnover rates than those providers with less minority direct care workers (p=0.0277). The
proportion of direct care workers with higher levels of education had no significant effect on
their turnover rates.
6.2.3 Service User Factors
Primary payer source for the services received was a significant predictor of turnover.
Unexpectedly, providers that had higher proportion of service users who used Medicaid as
their primary payer for services had statistically significantly lower turnover rates than those
providers with lower proportions of Medicaid service users, although the size of the effect is
small (p=0.0188). The proportion of service users who were age 65 or older did not have a
significant effect on the turnover rates of direct care workers.
6-9


7. DISCUSSION
Low wages and the lack of fringe benefits among direct care workers employed in the long-
term care industry are long-standing concerns by policymakers, both nationally and in
Oregon. Direct care workers are agency or facility employees who provide direct hands-on
personal care services to persons with disabilities or the elderly requiring long-term services
and supports in the provider’s facility, client’s home or other setting. Common examples of
direct care workers are certified nursing assistants (CNAs), nursing assistants (NAs),
certified medication aides (CMAs), restorative aides (RAs), home health aides, and personal
care assistants.
Aside from the direct negative impact that low wages and lack of fringe benefits have on
direct care workers and their families, these employment characteristics arguably make it
more difficult for long-term care providers to recruit and retain workers. Advocates for
higher wages and fringe benefits also argue that these conditions are associated with higher
turnover and lower quality of care.
This report provides the information required by the budget note included in the Budget
Report for HB5029. The report presents data on wages, fringe benefits, and turnover of
direct care workers collected in summer/fall 2014 from Oregon long-term care providers
who participated in Medicaid. Data were not collected from independent providers in the
consumer-directed home care option of the Oregon Medicaid program. RTI International, a
large nonprofit research institute, with a regional office in Portland, designed and fielded the
survey and conducted the analyses.
This chapter summarizes the report and discusses several explicit policy issues related to
wages, fringe benefits and turnover among long-term care providers in Oregon that
participate in the Medicaid program.
7.1 Characteristics of Direct Care Workers
In 2014, 36,685 direct care workers were employed by long-term care providers
participating in Medicaid, with the largest employers being nursing facilities, assisted living
facilities for aged/physical disabilities, and in-home care agencies. The typical direct care
worker was white, non-Hispanic, female, aged 18 to 44, and had a high school education.
About two-thirds of direct care workers are employed full time.
7.2 Wages of Direct Care Workers
Providers reported that the most important factors that they considered when setting wages
for direct care workers were: the legally required minimum wage, the education and
experience of individual workers, and the wages of other long-term care providers.
Somewhat surprisingly, although the Medicaid rate was cited as a factor by about a third of
7-1

Wages, Fringe Benefits, and Turnover for Direct Care Workers Working for Long-Term Care Providers in Oregon
long-term care providers, and was especially important for nursing facilities and in-home
care agencies, it was not one of the top rated factors. Although analysts often make
comparisons are often make comparisons with the wages of fast-food workers, hardly any
providers (less than 5%) said that they take fast-food worker wages into account when
setting the wages for direct care workers.
Direct care workers are, indeed, low-wage workers. In 2014, the median wage among all
providers was $10.51 per hour; the mean (average) wage was $11.10 per hour. If the
median and mean wage is calculated weighting by the number of direct care workers that
each provider employed, the median and mean wages are slightly higher—the median wage
is $11.15 and the mean wage is $12.38. The minimum wage in Oregon is $9.10 per hour.
Nursing facilities pay substantially more than other types of providers and pull up the
median and mean; there is very little variation in wages across other provider types, which
typically pay $10-11 an hour.
Among providers in operation in 2014 and also during the period 2003-2014, wages
increased over the time period, although not as much as inflation or Medicaid rate
increases. For example, weighted by the number of direct care workers, average wages
increased from $9.21 in 2003 to $11.20 in 2014; inflation-adjusted 2003 wages would be
have been $12.07 in 2014, about a dollar an hour less.
Although there is variation across provider types, Medicaid payment rates to providers
serving older people and younger persons with physical disabilities generally increased
faster than direct care payment rates. For example, the Medicaid payment rate for nursing
facilities increased by 88% increase between 2003 and 2014, which was over three times
faster than the reported direct care worker wage increase. Overall, Medicaid payment rates
increased at a slower rate from 2009 to 2014 and were more comparable to increases in
wages by direct care workers, which probably reflects the Great Recession in terms of rate
increases and wage increases. Data is not available to conduct a comparable analysis of
payment rates for providers of services to people with developmental disabilities.
7.3 Fringe Benefits
Provision of fringe benefits varies greatly among long-term care providers. The offer of
fringe benefits is much more common to full-time employees than to part-time workers. The
most commonly offered fringe benefit is paid personal time off (60.21%), followed by paid
holidays (45.60%), and employee-only health insurance (41.90%). Nursing facilities,
assisted living facilities, and residential care facilities for adults with developmental
disabilities offer benefits to a substantial portion of direct care workers; in home care
agencies and adult foster care facilities offer few benefits. For providers in operation in
2014, a greater proportion of long-term care providers offered various fringe benefits in
2014 than they did in 2010.
7-2

Section 7 — Discussion
Direct care worker participation in fringe benefits varies greatly by the type of fringe
benefit. Fringe benefits that typically require an employee financial contribution, such as
health insurance, retirement benefits, and life insurance, have low participation rates. For
example, while about 31% (30.85%) of long-term care providers offer some type of
retirement benefits, only about 15% (14.25%) of direct care workers participate.
Conversely, participation rates for “free” benefits are much higher. For example, about 56%
(56.06%) of providers offered personal time off and almost two-thirds of (65.17%) direct
care workers used the benefit.
7.3.1 Direct Care Worker Turnover
Turnover rates are often used as an indicator of quality of care. Providers with high turnover
rates are likely to have periods where they operate short-staffed and new workers need
time to learn the needs and preferences of consumers. Like long-term care providers
nationally (American Health Care Association, 2014), Oregon has a high turnover rate
among direct care workers. Average annual turnover among direct care workers was 64%
per year, with wide variation across provider types. Residential care facilities for adults with
developmental disabilities had the highest turnover rates at 90% per year, while adult foster
care homes for people with developmental disabilities had the lowest turnover rate at 30%.
Nursing facilities had turnover rates of 54%, in line with national averages.
The relationship between wages and turnover rates is U-shaped, with high higher turnover
rates among providers paying low wages, then declining turnover rates as wages increase,
and then increasing turnover as wages increase to high levels. In a multivariate analysis,
holding other factors constant, lower wages were strongly related to increased turnover.
Although the reason for this relationship is not clear, workers at high-wage providers may
have skills that make them able to leave their high paying provider for other, even better,
payment. The relationship between fringe benefits and turnover seems to vary widely by the
type of fringe benefit offered.
7.3.2 Policy Variables of Interest: Dependence on Medicaid Payments
Providers often argue that they cannot afford to raise wages and provide fringe benefits
because the Medicaid rates are too low to allow these changes to be affordable. If this is
true, then, providers with the highest dependence on Medicaid reimbursement should have
the lowest average wages, should be least likely to offer fringe benefits, and should have
the highest turnover rates. The data suggest a more complicated process.
In terms of wages, there was little difference in payment rates between providers which had
more than the median percentage of service users who used Medicaid to pay for their
services and providers which had less than the mean percentage of service users to pay for
their services. Among all providers, the average wage (weighted by the number of
providers) was $11.10 per hour compared to $10.88 per hour for low-Medicaid providers
7-3

Wages, Fringe Benefits, and Turnover for Direct Care Workers Working for Long-Term Care Providers in Oregon
and $11.41 per hour for high-Medicaid facilities.1 In a multivariate analysis, however, high
Medicaid providers did have lower wages, but the magnitude was small. Each percentage
point increase in the percent Medicaid reduced average wages by $0.01. Thus a 20
percentage point increase in the provider’s percent Medicaid would result in a reduction in
average wages by about $0.20.
7.3.3 Policy Variable of Interest: Aged/Physical Disability vs. Developmental Disability
Although there is overlap in terms of populations served, most long-term care providers
target either an aged/physically disabled population or a population with developmental
disabilities. In Oregon, providers are just about evenly split between the two populations.
In a slightly different perspective, about a quarter of service users are under age 65, with
three quarters age 65 and older.
The outcomes of wages, fringe benefits and turnover vary somewhat according to the target
population and age of the population served. When weighted by providers, there is virtually
no difference in average wages between providers that target people with frailty, dementia
and physical disabilities vs. developmental disabilities or by age (roughly $11.10). On the
other hand, when weighted by the number of direct care workers, direct care workers that
are employed by providers that target people with frailty, dementia and physical disabilities
make almost $2 more an hour compared to direct care workers employed by providers that
target people with developmental disabilities ($12.96 and $11.09, respectively). When
weighted by the number of direct care workers, similar differences exist by service user age.
On the other hand, on all but one fringe benefit (family coverage health insurance),
providers serving people with developmental disabilities were more likely to offer fringe
benefits than were providers serving people with frailty, dementia and physical disabilities.
For example, twice the percentage of providers serving people with developmental
disabilities as providers serving people with frailty, dementia and physical disabilities offered
benefits. The same pattern exists by age, with providers serving younger people with
disabilities more likely to offer fringe benefits.
Finally, providers targeting people with developmental disabilities or younger people had
higher turnover rates than providers serving people with frailty, dementia and physical
problems or older people. For example, providers serving people with developmental
disabilities had a 68% turnover rate compared to a 56% turnover rate for providers that
served people with frailty, dementia and physical problems.
1 Among all providers, the average wage (weighted by the number of direct care workers) was $12.38 per hour compared to $12.03 per hour for low-Medicaid providers and $12.51 per hour for high-Medicaid facilities.
7-4

Section 7 — Discussion
7.3.4 Policy Variable of Interest: Training
With the exception of nursing facilities, where federal regulations require that direct care
workers receive at least 75 hours of training before they begin caring for residents, most l
long-term care providers require little training of their direct care workers. Nearly 80% of
providers require less than 75 hours of training (the federal minimum for certified nurse
assistants in nursing homes and home health aides working in home health agencies),
including 14% of providers that require no training.
Providers that required more training paid direct care workers higher wages. Weighted by
the number of direct care workers, providers that require 75 or more hours of training pay
an average of $13.72 compared to $11.73 for providers that require less training. Nursing
homes dominate the 75 hours or more training category. Similarly, providers that require
75 hours or more of training (again, mostly nursing homes) were more likely to offer fringe
benefits to their direct care workers.
Surprisingly, providers that required higher levels of training had higher turnover rates.
Providers that required 75 hours or more of training had an annual turnover rate of 68%
compared to 59% for providers that required less training. This higher turnover rate may
reflect the more demanding work conditions or it may mean that these providers attract
staff who have skills in demand by other employers that are able to offer these workers
more attractive jobs.
7.3.5 Strategies to Increase Direct Care Workforce Wages through Medicaid Rate Increases
There are four potential strategies for states to increase the wages of direct care workers in
long-term care. First, states can increase the minimum wage. Since average wages for
direct care workers in Oregon are only about $2 more than the state minimum wage, this
approach would likely raise wages for a significant portion of direct care workers, depending
on how high the minimum wage level is. On the other hand, the minimum wage applies to
broad categories of workers beyond direct care workers in long-term care and may have
other employment effects. Opponents of increases in the minimum wage argue that it
would make workers more expensive and employers will hire fewer of them if they are
forced to pay higher wages. In addition, these wage increases would likely be reflected in
higher Medicaid costs and higher costs for other services purchased by the state. Analyzing
the macroeconomic and state budgetary impact of a higher minimum wage is beyond the
scope of this report.
Second, as part of the Medicaid contract with providers, states could specify that all
participating providers must pay direct care workers a minimum specified wage. This
approach has the advantage of targeting Medicaid-participating providers. While this
7-5

Wages, Fringe Benefits, and Turnover for Direct Care Workers Working for Long-Term Care Providers in Oregon
strategy is theoretically possible, to our knowledge, no state has this type of requirement,
except to the extent that providers may be required to pay the state minimum wage.
Third, states can increase Medicaid payment rates and hope that providers will increase
wages. However, without specific requirements that providers increase wages, many
providers will chose not to do so.
Fourth, states can enact wage-pass through legislation which combines increasing the
Medicaid payment rates with the requirement that providers increase wage levels as a
condition of participating in Medicaid. Wage pass-through legislation has been a widely used
method to increase direct care workers’ wages with about half of all states (n=23)
implementing wage pass-through programs from 1999-2004 (Miller et al., 2012), although
it has been less popular in more recent years. Wage pass-through legislation increases the
state’s Medicaid payment rate with the intention of increasing direct care workers’
compensation via increased wages or fringe benefits. The Institute of Medicine Committee
on the Future Health Care Workforce for Older Americans (2008) endorsed wage pass-
throughs as a way to increase wages and benefits of direct care workers. Wage pass-
through legislation attempts to ensure that the increased payment rate be passed on to
direct care workers by (1) requiring a set daily dollar amount to be allocated to direct care
workers’ hourly wages, or (2) requiring a proportion of the Medicaid payment increase to be
used for increased wages or benefits (North Carolina Division of Facility Services, 2000).
Some states made their initiatives optional while other states have made them mandatory.
The earlier research evidence on the effectiveness of wage pass-through programs is mixed.
A review by Paraprofessional Health Institute (2003) assessed individual state evaluations
and one larger 13 state evaluation to understand the impact of wage pass through
initiatives on turnover and retention of direct care workers. The larger evaluation found
there were varying results for effects of wage pass through programs on turnover rates and
retention with some states making determinations of a positive impact, some not, and
others had inconclusive findings (North Carolina Division of Facility Services 2000).
Although most of the investigations to assess the impact of wage pass-through programs
are of small programs and are from the early 2000s, there have been a few more recent
evaluations. Feng et al. (2010) found moderate gains (3%-4%) for nursing home certified
nurse assistant hours per resident day in 21 of 23 states analyzed with wage pass-through
policies in place from 1996-2004. This study also found a significant increase, among 21
states, in CNA staffing immediately following wage pass-through adoption, although when
wage pass-through states are compared with non-adopter states this relationship fades
(Feng et. al 2010). Feng et al. (2010) caution that the positive effects on increased staffing
occur mostly in the first 2 years of wage pass-through adoption and are not sustained over
time.
7-6

Section 7 — Discussion
Two studies, Baughman and Smith (2007, 2010), found a direct relationship between wage
pass-through initiatives and increased wages for direct care workers2 (7% and 12%
increases, respectively) as a result wage pass-through policies in 20-233 states. After
controlling for various levels of state implementation and provider participation, only states
with optional wage pass-through policies had significantly higher wage increases compared
to other states.
States that have implemented wage pass-through initiatives offer some lessons for
implementation. For example, to ensure that wage pass-through programs increase wages,
policy makers and researchers have concluded that enforcing accountability of providers via
monitoring and auditing are essential to ensure the Medicaid rate increase is being used as
it was intended. Paraprofessional Healthcare Institute (PHI; 2003) provides as list of ways in
which some states with WPT programs have built their accountability systems. These steps
include:
▪ Requiring providers to submit a plan describing how they intent to institute the increase
▪ Conducting a survey of providers post wage pass-through implementation to determine whether and how they participated
▪ Requiring providers to submit detailed cost reports and conducting a full, annual state audit to assess provider expenditures.
While supportive of higher Medicaid reimbursement rates, providers have not been
enthusiastic about wage pass-through legislation. First, providers argue that they are
underpaid relative to their costs. Thus, rate increases should reduce the level of that
underpayment for existing services. Second, they oppose Medicaid’s detailed involvement in
how providers spend the money that they receive, seeing that as an infringement of
management prerogatives. Third, Medicaid only pays rate increases for service users who
are Medicaid eligible, but not all service users are Medicaid-eligible. Thus, under wage pass-
through legislation providers argue that they are forced to raise prices for private-pay and
other payers to pay for the wage increases for staff whose time is not reimbursed by
Medicaid.
7.4 Conclusion
Direct care workers are the backbone of the long-term services and supports industry.
These workers provide residents, clients, and patients (depending on provider type) with
day-to-day basic care to ensure that their daily care needs are being met. Nationally, the
2 Baughman and Smith (2007) define direct care workers broadly including those working in hospitals, nursing homes, other health settings and community care. In their 2010 analysis they used the same definition but dropped hospital aides from their analysis because they are not eligible for wage pass-through payments.
3 Baughman and Smith included 23 states with wage pass-through programs in their 2007 analysis and 20 in their 2010 analysis.
7-7

Wages, Fringe Benefits, and Turnover for Direct Care Workers Working for Long-Term Care Providers in Oregon
U.S. Bureau of Labor Statistics (2013b) estimates the need for an additional 1.3 million
direct care worker positions between 2012 and 2022. The nation, including Oregon, will
have difficulty recruiting and retaining these workers unless working conditions—including
wages and fringe benefits—are improved.
7-8

References
American Health Care Association (2014). American Health Care Association 2012 Staffing Report. Washington, DC. Available at: http://www.ahcancal.org/research_data/staffing/Documents/2012_Staffing_Report.pdf. Accessed December 11, 2014.
Baughman, R. A. & Smith, K. (2007). The Labor Market for Direct Care Workers. Federal Reserve Bank of Boston. New England Public Policy Center.
Baughman, R. A., & Smith, K. (2010). The Effect of Medicaid Wage Pass-through Programs on the Wages of Direct Care Workers. Medical Care, 48(5), 426-432. doi: 10.1097/MLR.0b013e3181d6888a
Butler, S.S., Brenan-Ing, M., Wardamasky, S. & Ashley, A. (2014). Determinants of longer job tenure among home care aides: What makes some stay on the job while others leave? (2013). Journal of Applied Gerontology, 33: 164-188.
Feng, Z., Lee, Y. S., Kuo, S., Intrator, O., Foster, A. & Mor, V. (2010). Do Medicaid wage pass-through payments increase nursing home staffing? Health Services Research, 45(3), 728–747.
Holzer, H. (2001). Long-term care workers and the low-wage labor market: Current characteristics and future trends. Washington, DC: The Urban Institute and the Institute for the Future of Aging Services.
Howes, C. (2005). Living wages and retention of homecare workers in San Francisco. Industrial Relations, 44: 139-63.
Institute of Medicine. (2008). Retooling for an aging America: Building the health care workforce: National Academies Press Washington, DC
Khatutsky, G., Wiener, J.M., Anderson, W.L., Akhmerova, V., Jessup, A. & Squillace, M. (2011). Understanding direct care workers: A snapshot of two of America’s most important jobs: Certified nursing assistants and home health aides. Report prepared for the Office of the Assistant Secretary for Planning and Evaluation. Waltham, MA: RTI International. Available at: http://aspe.hhs.gov/daltcp/reports/2011/CNAchart.pdf.
Miller, E. A., Wang, L., Feng, Z., & Mor, V. (2012). Improving direct-care compensation in nursing homes: Medicaid wage pass-through adoption, 1999-2004. Journal of Health Politics, Policy and Law, 37(3), 469-512. doi: 10.1215/03616878-1573094
North Carolina Division of Facility Services. 2000. Results of a Follow-up Survey to States on Wage Supplements for Medicaid and Other Public Funding to Address Aide Recruitment and Retention in Long-Term Care Settings. Raleigh, NC: North Carolina Division of Facility Services.
Paraprofessional Healthcare Institute. 2003. State Wage Pass-Through Legislation: An Analysis. Workforce Strategies: No. 1. Prepared for the Office of Disability, Aging and Long-Term Care Policy and Office of the Assistant Secretary for Planning and Evaluation, U.S. Department of Health and Human Services.
R-1

Wages, Fringe Benefits, and Turnover for Direct Care Workers Working for Long-Term Care Providers in Oregon
PHI (2013). Wage trend for personal care aides, 2002-2012. New York City. Available at: http://www.phinational.org/wage-trend-for-personal-care-aides-2002-2012.
Squillace, M. R. Bercovitz, A. Rosenoff, E. & Remsberg, R. (2008). An exploratory study of certified nursing assistants’ intent to leave. Washington, DC: Office of the Assistant Secretary for Planning and Evaluation/U.S. Department of Health and Human Services. Available at: http://aspe.hhs.gov/daltcp/reports/2008/intent.pdf.
Stone, R. I. & Wiener, J. M. (2001). Who will care for us? Addressing the long-term care workforce crisis. Washington, DC: Urban Institute and American Association of Homes and Services for the Aging. Available at: http://www.urban.org/UploadedPDF/Who_will_Care_for_Us.pdf.
U.S. Bureau of Labor Statistics (2013a). May 2012 State occupational employment and wage estimates. Washington, DC: U.S. Department of Labor. Available at: http://www.bls.gov/oes/2012/may/oes_or.htm.
U.S. Bureau of Labor Statistics. (2013b). Economic and Employment Projections, 2012-2020. Washington, DC: U.S. Department of Labor. Available at: http://www.bls.gov/news.release/ecopro.toc.htm. Accessed December 11, 2014.
U.S. Bureau of Labor Statistics. (2014). May 2013 State Occupational Employment and Wage Estimates. Washington, DC: U.S. Department of Labor. Available at: http://www.bls.gov/oes/current/oes_or.htm#31-0000.
Wiener, J. M., Squillace, M. R., Anderson, W. L., & Khatutsky, G. L. (2009). Why do they stay? Job tenure among certified nursing assistants in nursing homes. The Gerontologist, 49(2), 198–210.
Wiener, J.M., Anderson, W.L., & Khatutsky, G. (2011). Would addressing workforce factors in nursing homes improve quality of care? Report prepared for the Retirement Research Foundation. Washington, DC: RTI International.
Williams, C. & Gault, B. (2014). Paid sick days access in the United States: Differences by race/ethnicity, occupation, earnings, and work schedule. Washington, DC: Institute for Women’s Policy Research. Available at: http://www.iwpr.org/publications/pubs/paid-sick-days-access-in-the-united-states-differences-by-race-ethnicity-occupation-earnings-and-work-schedule/.
R-2

Appendix A Quality Control Steps on Questionnaire Data
RTI International used a quality control process to assure that survey data was accurate and
of high quality. Those procedures are described below.
1. Sample Preparation Stage
1.1. All providers provided by DHS were listed together to eliminate duplicate records. Duplicates were defined as 2 or more providers with same street address and same home office name and same corporate name and same provider specialty. Within each set of “twins,” one was removed and one was kept.
1.2. From the frame of 2,581 adult foster care homes, a systematic sample was selected of 1667 APDs and 914 DDs. These were included in the survey.
1.3. All of the other providers in the list provided by DHS were included in the survey (with the exception of duplicates).
2. Questionnaire Receipting Stage
2.1. Clerk visually viewed hardcopy questionnaire viewed to see if there is evidence that provider is out of scope (e.g., states no Medicaid contract, states out of business) or a non-complete (e.g., minimum questions in section 1 are blank).
2.2. Clerk scanned Questionnaire ID barcode and assigned appropriate status code Questionnaire Received - Full Questionnaire Received Blank Questionnaire Received But Out of Business Questionnaire Received – Claims No Medicaid Contract
2.3. Clerk scanned questionnaire into Teleform system; Teleform extracted answers to coded questions and all write-in numeric questions.
2.4. On 100% of questionnaires, clerk compared digital image of all write-in numeric questions to hardcopy. Clerk made any corrections to data files.
2.5. Clerk data entered verbatim information on page 12.
3. Data Collection Stage
3.1. 100% of mailout cases were reviewed before mailout. 3.2. A supervisor performed audio monitoring of prompters as they were on the phone
with providers 3.3. During the course of the survey some providers explained to us that they did not
have a Medicaid contract, were out of Business, or had received duplicate questionnaires. These explanations came either when they called us at the Toll Free Inquiry Line, or when the prompter called them. There were many cases we had not realized were duplicates in our sample review due to the nature of the provider’s set-up (e.g., cases existed for both their old name as well as their new name, two providers had merged). We statused these cases as Duplicate or No Medicaid Contract or Out Of Business as we learned of them from the provider.
4. Data Review Stage
4.1. Completeness Review among cases with the status of “Full Questionnaire Received.” Examined cases with large amounts of missing data. Some cases had to be restatused as “Questionnaire Received but Out Of Business” if the comments
A-1

Wages, Fringe Benefits, and Turnover for Direct Care Workers Working for Long-Term Care Providers in Oregon
indicated that they were not in business or not serving clients/residents. Some cases had to be restatused as “Questionnaire Received Blank” if they seemed to be in business and eligible but had not answered enough questions.
4.2. Address Analysis. Identified all cases with common addresses. Classified each set of twins as Duplicate or Co-Located. Duplicate: Name, address, and provider specialty type the same. These are essentially the exact same case. Many of these had already been identified during the survey (see 3.3) and were coded out at that time, but there were others duplicates of which we were unaware. Co-Located: Name and address the same, provider specialty type different. These were 2 or occasionally 3 licenses (often complementary licenses such as Residential Care Contract Rates and Assisted Living APD) at the same location, generally a large facility. The survey was designed to consider unique licenses as unique cases, and the questionnaire instructed providers to answer separately according to the license printed on the questionnaire. However, providers often did not realize that the different questionnaires they received were targeted to different licenses, and they responded a single time reflecting on all units and licenses in their facility. Data Reconciliation among Duplicates and Co-located
4.2.1. The Noncomplete twin of an Ineligible/Out of Business or Ineligible/No Medicaid Contract case was restatused to the same Out of Business or No Medicaid Contract code. This rule was used for duplicates, but not for co-located.
4.2.2. The Noncomplete twin of an Eligible/Non Complete case restatused as Duplicate. This rule was used for duplicates but not for co-located.
4.2.3. The Noncomplete twin of an Eligible/Complete case was treated differently depending on whether the set was co-located or duplicate. 4.2.3.1. Among duplicates twins, the Noncomplete twin was restatused
as a Duplicate 4.2.3.2. Among co-located twins, we realized the question at hand was
“which license/specialty type is this provider actually reporting for.” Handwritten notes on the questionnaires and discussions with providers made it clear that many providers reflected on their entire operation (for example, their assisted living license as well as the residential care contract rates license which housed their memory unit within their assisted living facility) and did not focus their answers on the particular license indicated on the questionnaire label. Many providers with co-located licenses told prompters that they had completed their questionnaires and had in fact, done so, yet they had only completed one, not realizing that they were being surveyed twice. Therefore we adopted the following rules: First, if the twin of the complete cases was Out of Business or No Medicaid Contract, we assumed that the complete case would not reflect on that one, and would reflect on the specialty type indicated by their questionnaire label. Therefore we left the original specialty type unchanged and did not change any case statuses. Second, if the twin of the complete case was Not Complete, we imputed the provider specialty type by first considering the provider’s response to Question 2 on the survey. If a single choice was selected and this mapped directly to a specialty type on the frame (e.g., nursing facility) we used this response as their specialty type. If multiple choices were selected or if their response did not map directly, we choose the specialty type among this provider’s
A-2

Section 7 — Discussion
licenses which was the most prevalent on the sample frame (for example, if they had licenses for Assisted Living Facility and Residential Care Contract Rates, we imputed their specialty type to be Assisted Living Facility because this was more prevalent on the frame).
4.2.4. If both twins completed, we compared their questionnaire data. 4.2.4.1. If the two questionnaires were different, we kept both because
the differences in their answers signaled that they were responding about two distinct operations.
4.2.4.2. If the two questionnaires were equivalent, we discarded one and restatused it as duplicate. Regarding the one that was kept, among collocates (not among duplicates) it was necessary to impute the provider specialty; we used the imputation rules described in 4.2.3.2.
A-3


Appendix B Data Weights
In order to make the survey responses descriptive of the total population, the response
questionnaires were weighted to make them descriptive of the total population of long-term
care providers, service users, and direct care workers. The provider-level analysis weights
were calculated in three steps: (1) calculate the sample weights, (2) calculate the non-
response adjustment factor and, (3) apply the non-response adjustment factor to the
sample weights to create the provider-level analysis weights. After the provider-level
analysis weights were calculated, we created direct care worker-level analysis weights and
beneficiary-level analysis weights using a similar methodology.
Provider-Level Analysis Weights
The first step in creating the provider-level analysis weights was to calculate the sample
weights. The sample weights reflect the design of the sample. As described in the Sampling
Section the final sample design was a mix of sampling and census taking. For the provider
types where a census was selected the sample weights are equal to 1. For the one provider
type—adult foster homes—where a sample was selected the sample weights are equal to
the inverse of the probability of selection. The probability of selection is the number of
providers selected divided by the total number of providers for the given provider type. For
the adult foster homes the Adult APD population total (after de-duping the file) was 1,667.
We selected 394 of the 1,667 providers resulting in a probability of selection equal to
394/1,667 = 0.236. The inverse of this probability is equal to 4.231, thus the sample weight
for all Adult APD providers is 4.231. Similarly for the Adult DD providers the probability of
selection was 720/914 = 0.788 thus the sample weight for Adult DD providers is 1.269.
The next step was to calculate the non-response adjustment factor. For all providers, by
provider specialty, the number of responding providers and the number of eligible but non-
responding providers was calculated. Using these results, by provider specialty, the non-
response adjustment factor was calculated as eligible non-responders + eligible responders
divided by eligible responders. The final step in calculating the provider-level weights was to
multiply the non-response adjustment factor by the sampling weight.
Direct Care-Level and Beneficiary-Level Analysis Weights
In addition to the provider-level analysis weights we created direct care and beneficiary
weights. These weights were used in the analyses where we a given facilities’ influence
needed to be proportional to the number of direct care workers or the number of
beneficiaries associated with the facility. To calculate the direct care-level weights, for each
provider, we multiplied the provider-level analysis weight by the number of direct care
works. We created separate direct care worker weights for 2003, 2005, 2007, 2009, 2010,
B-1

Wages, Fringe Benefits, and Turnover for Direct Care Workers Working for Long-Term Care Providers in Oregon
2011, 2012 and 2013. For the beneficiary-level weights, for each provider, we multiplied the
provider-level analysis weight by the number of beneficiaries. The direct care worker
weights are the provider weights inflated by the number of direct care workers. The
beneficiary weights are the provider weights inflated by the number of beneficiaries.
B-2

Appendix C Data Recodes
Prior to conducting any analyses or creating estimates we thoroughly reviewed the survey
data for any reporting inconsistencies. As a result of our review we implemented a series of
data recodes. In determining the rules for the data recodes we followed the data recoding
conventions used on the National Study of Long Term Care Facilities funded by NCHS. The
data recodes we performed were
1. For all the resident-level demographic variables (questions 7, 8, 9, 10 and 11),
indicating the total number served by the responding facility, we forced the total
served equal to the respondent’s answer for question 6—this question asks how
many individuals are served by the facility.
For example, question 7 asks the how many Hispanic individuals, Non-Hispanic individuals
and the total individuals served by the facility. To be consistent with question 6, we set the
total number of individuals served equal to the number of individuals indicated in question
6. We checked the sum of the number of Hispanic individuals and Non-Hispanic individuals
the respondent answered. If the sum did not equal the value indicated in question 6 we
adjusted the respondent’s number of Hispanic and Non-Hispanic individuals proportionally
using ratios such that the sum equaled the value for question 6.
2. Question 12 asks how may direct care workers are currently employed. This question
is split by the number of full-time and part-time workers. We also asked for the total
number of direct care workers. We forced the total number to be equal to the sum of
the partial and full time workers. If either the number of full-time or part-time
workers was missing and the respondent indicated the total we retained the
respondent’s answer. If the respondent did not indicate the total number of direct
care workers and either the full-time or part-time number was missing we set the
total equal to the non-missing value (either part-time or full-time). If all values were
missing we left the result as missing and flagged this provider as having no direct
care workers.
3. For all the direct care worker-level demographic variables (questions 13, 14, 15, 16,
17 and 25), indicating the total number of direct care workers employed by the
responding facility, we forced the total employed equal to the respondent’s answer
for question 12—this question asks how many direct care workers are employed by
the provider (see #2 above).
C-1

Wages, Fringe Benefits, and Turnover for Direct Care Workers Working for Long-Term Care Providers in Oregon
We used the same approach for this series of questions as was used for the resident
demographics (see #1 above).
4. Question 18 asks how many direct care workers have even been employed between
January 1, 2014 and the time the respondent answered the survey. Similar to
question 12 this question is split by full-time, part-time and total number of direct
care workers. To force the total number of direct care workers equal to the sum of
the full-time and part-time number of direct care workers we followed the same
approach as described for question 12 (see #2 above).
5. Question 27 asks if a provider was not in business for a given year (2003 – 2013)
and the total number of direct care workers employed during that year. If a
respondent indicated at least one employed direct care worker we forced the variable
indicating the provider was not in business to equal no.
6. Question 28 asks if part-time direct care workers are offered various benefits. If the
respondent indicated no then we forced the follow-up question, asking the minimum
number of hours needed to receive the benefit, equal to missing.
7. Question Q29 asks how many direct care workers are enrolled in various benefits.
We capped the number enrolled at the total number of direct care workers employed
by the provider. Furthermore if the respondent indicated that at least one direct care
worker was enrolled in a benefit we forced the variable that indicates if the benefit
was offered to equal yes.
C-2

Appendix D: Supplemental Tables
Table D-1. Provider Characteristics, by Provider Type, 2014
Characteristics of Providers
Residential Care Supportive
Living: Developmental
Disabilities Contract
Children/ Developmental
Disabilities
Total % (Number of Providers) 89 40 56
Type of Ownership
Private, non-profit 9.09 92.00 83.72
Private, for profit 90.91 8.00 13.95
Government: federal, state, county or local
0.00 0.00 2.33
Chain Ownership
Part of corporate chain (yes) 77.33 84.62 28.57
Individual entity (no) 22.67 15.38 71.43
MSA
Metropolitan 75.32 96.43 69.77
Micropolitan 7.79 3.57 13.95
Non-Metropolitan/Non-Micropolitan 16.88 0.00 16.28
Most Common Disability Among Individuals Served
Frailty, dementia, and physical disabilities 92.11 0.00 0.00
Intellectual/ developmental disabilities 1.32 100.00 100.00
Severe mental illness 3.95 0.00 0.00
Traumatic brain injury 1.32 0.00 0.00
HIV 1.32 0.00 0.00
Number of Individuals Served
0-25 42.86 100.00 76.74
26-50 33.77 0.00 9.30
51-75 18.18 0.00 4.65
76-100 2.60 0.00 4.65
100+ 2.60 0.00 4.65
(continued)
D-1

Wages, Fringe Benefits, and Turnover for Direct Care Workers Working for Long-Term Care Providers in Oregon
Table D-1. Provider Characteristics, by Provider Type, 2014 (continued)
Characteristics of Providers
Residential Care Supportive
Living: Developmental
Disabilities Contract
Children/ Developmental
Disabilities
Training Required for Direct Care Workers
No formal training 11.84 0.00 0.00
Less than 75 hours of training 75.00 42.31 78.05
75 hours of training 5.26 57.69 12.20
More than 75 hours of training 7.89 0.00 9.76
Uses Contract Workers to Provide Direct Care
Yes 11.84 7.14 9.76
No 88.16 92.86 90.24
Owner, Administrator/Director or Other Administrative Staff Provides Direct Care
Yes 51.32 16.00 50.00
No 48.68 84.00 50.00
Note: Unit of analysis is provider. Calculated percentages exclude missing data so percentages within each variable sum to 100%.
Source: RTI International analysis of the 2014 Oregon Wage and Fringe Benefit Survey of Long-Term Care (LTC) Providers.
D-2

Appendix D — Supplemental Tables
Table D-2. Service User Characteristics, by Provider Type, 2014
Characteristics of Service Users
Residential Care
Supportive Living: Developmental
Disabilities Contract
Children/ Developmental
Disabilities
Total % (Number of Service Users) 3,123 148 1,728
Ethnicity
Hispanic/Latino 10.27 7.01 5.54
Not Hispanic/Latino 89.73 92.99 94.46
Race
American Indian or Alaska Native 2.79 7.32 1.14
Asian 2.98 2.65 2.84
Black or African American 3.17 10.72 2.62
Native Hawaiian or Other Pacific Islander
2.23 3.50 1.08
White 84.93 69.32 89.78
Other 3.91 6.48 2.53
Sex
Male 33.56 84.71 55.21
Female 66.44 15.29 44.79
Age of Individuals Served
17 Years or Younger 0.13 94.90 22.72
18-65 6.52 5.10 71.69
65-74 13.66 0.00 4.90
75-84 37.79 0.00 0.68
85+ 41.91 0.00 0.00
Primary Payer for Services Received by Provider
Medicaid 50.11 91.13 88.48
Private Pay 41.79 0.00 0.18
Other Payer 8.10 8.87 11.34
Note: Unit of analysis is service users. Calculated percentages exclude missing data so percentages within each variable sum to 100%.
Source: RTI International analysis of the 2014 Oregon Wage and Fringe Benefit Survey of Long-Term Care (LTC) Providers.
D-3

Wages, Fringe Benefits, and Turnover for Direct Care Workers Working for Long-Term Care Providers in Oregon
Table D-3. Characteristics of Direct Care Workers, by Provider Type, 2014
Characteristics of Direct Care Workers
Residential Care
Supportive Living: Developmental
Disabilities Contract
Children/ Developmental
Disabilities
Total Number of Direct Care Workers 2,284 443 814
Ethnicity
Hispanic/Latino 19.76 15.05 9.10
Not Hispanic/Latino 80.24 84.95 90.90
Race
American Indian or Alaska Native 2.19 0.20 2.31
Asian 2.14 1.91 1.89
Black or African American 4.61 13.42 7.68
Native Hawaiian or Other Pacific Islander
4.63 0.67 2.08
White 74.84 66.27 76.22
Other 11.59 17.53 9.82
Sex
Male 15.26 48.77 28.60
Female 84.74 51.23 71.40
Age of Direct Care Workers
17 years or younger 1.66 0.00 1.75
18-44 years 77.26 92.57 62.89
45-64 18.55 6.56 29.30
65 years or older 2.53 0.87 6.07
Education of Direct Care Workers
Less than high school graduate 7.36 7.28 2.66
High school graduate or GED 56.03 28.74 31.46
Some college 20.17 32.53 28.44
Associate’s degree 5.76 9.93 9.76
Bachelor’s degree 8.04 13.12 23.43
Post graduate degree 2.65 8.39 4.23
Full-Time vs Part-Time Status Currently
Full-time 73.84 55.45 64.64
Part-time 26.16 44.55 35.36
(continued)
D-4

Appendix D — Supplemental Tables
Table D-3. Characteristics of Direct Care Workers, by Provider Type, 2014 (continued)
Characteristics of Direct Care Workers
Residential Care
Supportive Living: Developmental
Disabilities Contract
Children/ Developmental
Disabilities
Full-Time vs Part-Time Status Ever Employed Between January 1, 2014 and Survey Completion
Full-time 67.93 59.65 57.38
Part-time 32.07 40.35 42.62
Note: Unit of analysis is direct care worker. Calculated percentages exclude missing data so percentages within each variable sum to 100%.
Source: RTI International analysis of the 2014 Oregon Wage and Fringe Benefit Survey of Long-Term Care (LTC) Providers.
D-5
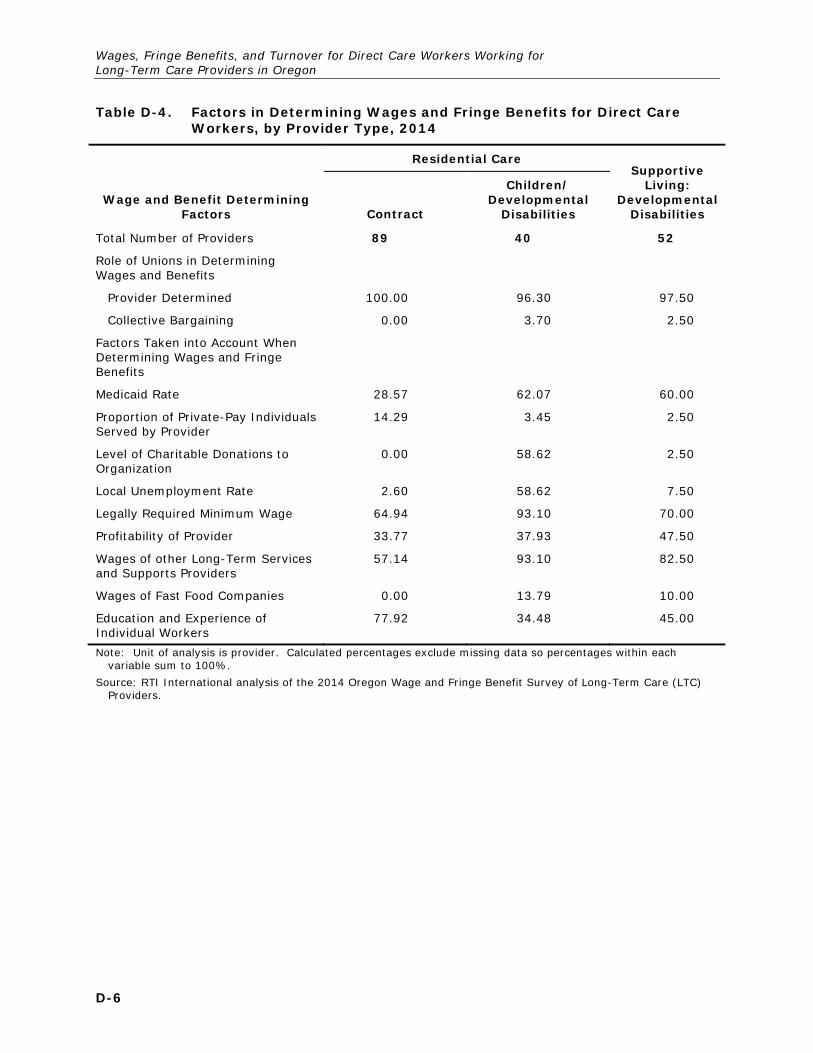
Wages, Fringe Benefits, and Turnover for Direct Care Workers Working for Long-Term Care Providers in Oregon
Table D-4. Factors in Determining Wages and Fringe Benefits for Direct Care Workers, by Provider Type, 2014
Wage and Benefit Determining Factors
Residential Care Supportive
Living: Developmental
Disabilities Contract
Children/ Developmental
Disabilities
Total Number of Providers 89 40 52
Role of Unions in Determining Wages and Benefits
Provider Determined 100.00 96.30 97.50
Collective Bargaining 0.00 3.70 2.50
Factors Taken into Account When Determining Wages and Fringe Benefits
Medicaid Rate 28.57 62.07 60.00
Proportion of Private-Pay Individuals Served by Provider
14.29 3.45 2.50
Level of Charitable Donations to Organization
0.00 58.62 2.50
Local Unemployment Rate 2.60 58.62 7.50
Legally Required Minimum Wage 64.94 93.10 70.00
Profitability of Provider 33.77 37.93 47.50
Wages of other Long-Term Services and Supports Providers
57.14 93.10 82.50
Wages of Fast Food Companies 0.00 13.79 10.00
Education and Experience of Individual Workers
77.92 34.48 45.00
Note: Unit of analysis is provider. Calculated percentages exclude missing data so percentages within each variable sum to 100%.
Source: RTI International analysis of the 2014 Oregon Wage and Fringe Benefit Survey of Long-Term Care (LTC) Providers.
D-6

Appendix D — Supplemental Tables
Table D-5. Direct Care Worker Wages for Direct Care Workers, by Provider Type, 2014
Wages for Direct Care Workers
Residential Care Supportive
Living: Developmental
Disabilities Contract
Children/ Developmental
Disabilities
Total Number of Direct Care Workers 2,284 443 814
Current Average Hourly Rate for Direct Care Workers (weighted by the number of direct care workers by provider)
Median Rate 10.66 11.13 10.98
Mean Rate 11.03 10.99 11.00
Distribution of Direct Care Worker Wages (Rate per Hour)
Less than $9.10 0.43 0.00 4.88
$9.10 - $9.99 27.41 16.19 24.31
$10.00 - $10.99 26.56 35.31 32.14
$11.00 - $11.99 17.20 34.14 23.82
$12.00 - $12.99 9.22 10.47 5.12
$13.00 - $13.99 5.43 1.66 1.69
$14.00 - $14.99 3.47 0.97 2.47
$15.00 - $15.99 1.54 0.67 1.57
$16.00 - $16.99 1.76 0.59 2.11
$17.00 and more 6.96 0.00 1.90
Average Wage per Hour for Most Recently Hired Direct Care Worker
10.02 10.40 10.27
Current Average Hourly Rate for Direct Care Worker Who Has Worked for Provider for 5 or More Years
12.08 12.02 11.52
Note: Unit of analysis is direct care worker.
Source: RTI International analysis of the 2014 Oregon Wage and Fringe Benefit Survey of Long-Term Care (LTC) Providers.
D-7

Wages, Fringe Benefits, and Turnover for Direct Care Workers Working for Long-Term Care Providers in Oregon
Table D-6. Wages for Direct Care Workers, by Provider Type, 2014 (Weighted by Providers)
Wages for Direct Care Workers
Residential Care Supportive
Living: Developmental
Disabilities Contract
Children/ Developmental
Disabilities
Total Number of Direct Care Workers 89 40 52
Current Average Hourly Rate for Direct Care Workers (weighted by the number of direct care workers by provider)
Median Rate 10.50 11.26 10.75
Mean Rate 10.66 11.03 10.89
Distribution of Direct Care Worker Wages (Rate per Hour)
Less than $9.10 0.63 0.00 3.44
$9.10 - $9.99 31.42 16.20 19.10
$10.00 - $10.99 31.83 35.51 35.34
$11.00 - $11.99 14.69 33.33 22.46
$12.00 - $12.99 7.64 10.59 7.10
$13.00 - $13.99 4.12 1.87 4.08
$14.00 - $14.99 2.46 1.25 2.48
$15.00 - $15.99 1.56 0.62 1.68
$16.00 - $16.99 1.24 0.62 1.84
$17.00 and more 4.40 0.00 2.48
Average Wage per Hour for Most Recently Hired Direct Care Worker
9.96 10.39 10.57
Current Average Hourly Rate for Direct Care Worker Who Has Worked for Provider for 5 or More Years
11.83 12.12 12.18
Source: RTI International analysis of the 2014 Oregon Wage and Fringe Benefit Survey of Long-Term Care (LTC) Providers.
D-8

Appen
dix D
— S
upplem
ental T
ables
D-9
Table D-7. Wages for Direct Care Workers at Residential Care Facilities for Children with Developmental Disabilities, 2003-2014
Year Provider in Operation
Residential Care: Children/Developmental Disabilities
2003 2005 2007 2009 2010 2011 2012 2013 2014
Total Number of Providers 22 25 29 36 36 36 36 37 40
Number of Direct Care Workers 163 279 422 657 783 697 731 811 443
Average Wages for Direct Care Workers
Reported average hourly wage (weighted by number of direct care workers)
$9.41 $9.52 $9.95 $10.13 $10.44 $10.54 $10.68 $10.95 $11.03
2003 wage rate adjusted for inflation $9.41 $9.99 $10.60 $10.97 $11.15 $11.50 $11.74 $11.91 $12.11
BLS estimate (personal care aides) $9.67 $10.08 $10.49 $10.80 $10.77 $10.70 $10.78 $11.07
Note: Unit of analysis is direct care worker. BLS is U.S. Bureau of labor Statistics. BLS estimate for wages not available for 2014
Source: RTI International analysis of the 2014 Oregon Wage and Fringe Benefit Survey of Long-Term Care (LTC) Providers.
D-9
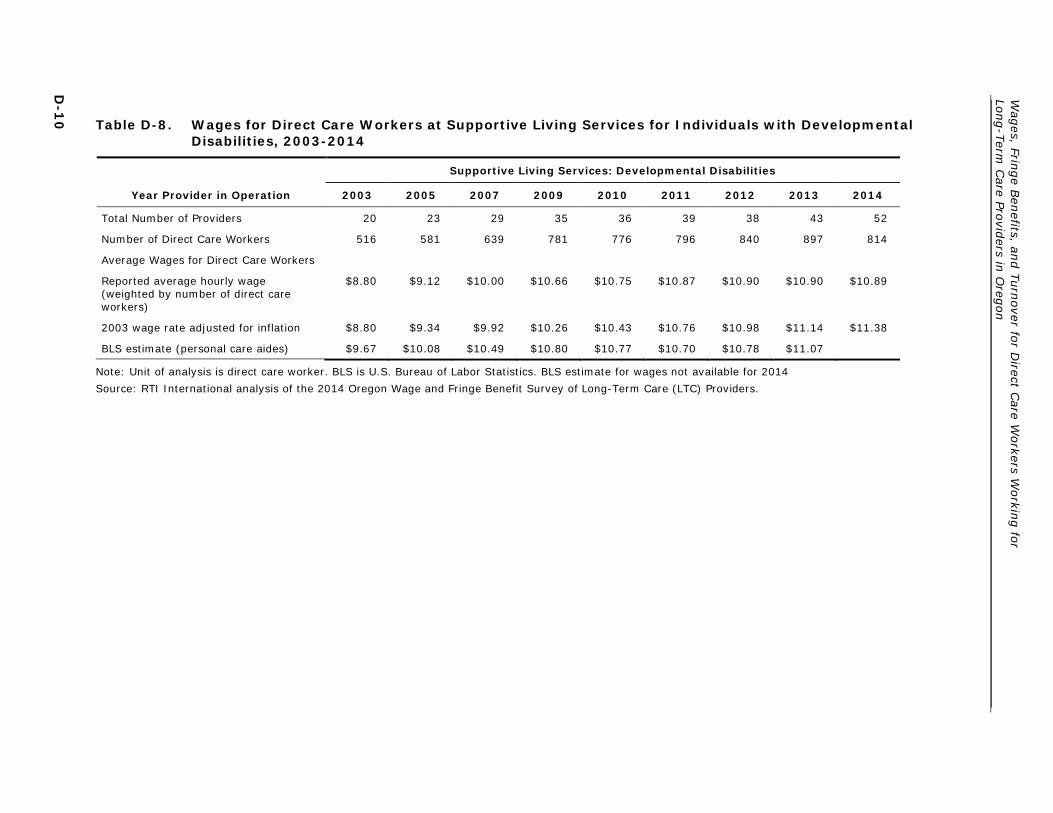
Wag
es, Fringe B
enefits, an
d T
urn
over fo
r Direct C
are Workers W
orkin
g fo
r Lo
ng-T
erm C
are Provid
ers in O
regon
D-1
0 Table D-8. Wages for Direct Care Workers at Supportive Living Services for Individuals with Developmental
Disabilities, 2003-2014
Year Provider in Operation
Supportive Living Services: Developmental Disabilities
2003 2005 2007 2009 2010 2011 2012 2013 2014
Total Number of Providers 20 23 29 35 36 39 38 43 52
Number of Direct Care Workers 516 581 639 781 776 796 840 897 814
Average Wages for Direct Care Workers
Reported average hourly wage (weighted by number of direct care workers)
$8.80 $9.12 $10.00 $10.66 $10.75 $10.87 $10.90 $10.90 $10.89
2003 wage rate adjusted for inflation $8.80 $9.34 $9.92 $10.26 $10.43 $10.76 $10.98 $11.14 $11.38
BLS estimate (personal care aides) $9.67 $10.08 $10.49 $10.80 $10.77 $10.70 $10.78 $11.07
Note: Unit of analysis is direct care worker. BLS is U.S. Bureau of Labor Statistics. BLS estimate for wages not available for 2014
Source: RTI International analysis of the 2014 Oregon Wage and Fringe Benefit Survey of Long-Term Care (LTC) Providers.

Appendix D — Supplemental Tables
Table D-9. Fringe Benefits for Direct Care Workers at Residential Care Facilities for Children with Developmental Disabilities, 2003-2014
Year Provider in Operation
Residential Care: Children/ Developmental Disabilities
2010 2011 2012 2013 2014
Total Number of Direct Care Workers 783 697 731 811 443
Health Insurance with Family Coverage
Percent of providers who offered benefit 82.76 82.76 82.76 86.21 89.66
Percent of direct care workers who enroll/use benefit
0.88 1.78 1.13 0.85 1.25
Health Insurance for Employee Only
Percent of providers who offered benefit 86.21 86.21 86.21 89.66 93.10
Percent of direct care workers who enroll/use benefit
34.33 37.62 35.47 35.37 54.52
Paid Personal Time Off, Vacation Time, or Sick Leave
Percent of providers who offered benefit 89.66 89.66 89.66 93.10 96.55
Percent of direct care workers who enroll/use benefit
61.44 65.15 62.26 63.61 87.23
Paid Holidays
Percent of providers who offered benefit 75.86 75.86 75.86 79.31 82.76
Percent of direct care workers who enroll/use benefit
49.12 52.87 52.08 55.10 73.21
Pension or 401(k) or 403(b) Account
Percent of providers who offered benefit 65.52 72.41 68.97 75.86 86.21
Percent of direct care workers who enroll/use benefit
0.70 0.79 0.75 0.85 2.18
Employer-sponsored Life Insurance
Percent of providers who offered benefit 79.31 79.31 79.31 75.86 79.31
Percent of direct care workers who enroll/use benefit
38.91 40.59 39.06 35.71 50.47
Note: Unit of analysis is provider for offered benefits and direct care worker for enrollment/use of benefit.
Source: RTI International analysis of the 2014 Oregon Wage and Fringe Benefit Survey of Long-Term Care (LTC) Providers.
D-11

Wages, Fringe Benefits, and Turnover for Direct Care Workers Working for Long-Term Care Providers in Oregon
Table D-10. Fringe Benefits for Direct Care Workers at Supportive Living Services for Individuals with Developmental Disabilities, 2003-2014
Year Provider in Operation
Supportive Living: Developmental Disabilities
2010 2011 2012 2013 2014
Total Number of Direct Care Workers 776 796 840 897 814
Health Insurance with Family Coverage
Percent of providers who offered benefit 40.00 45.00 40.00 45.00 47.50
Percent of direct care workers who enroll/use benefit
7.55 8.51 7.13 5.95 5.60
Health Insurance for Employee Only
Percent of providers who offered benefit 52.50 57.50 57.50 57.50 62.50
Percent of direct care workers who enroll/use benefit
29.36 28.97 27.29 28.74 34.24
Paid Personal Time Off, Vacation Time, or Sick Leave
Percent of providers who offered benefit 67.50 72.50 67.50 75.00 87.50
Percent of direct care workers who enroll/use benefit
56.04 56.79 54.11 52.10 64.48
Paid Holidays
Percent of providers who offered benefit 52.50 52.50 52.50 57.50 62.50
Percent of direct care workers who enroll/use benefit
72.48 70.05 70.54 67.05 74.72
Pension or 401(k) or 403(b) Account
Percent of providers who offered benefit 45.00 50.00 50.00 57.50 62.50
Percent of direct care workers who enroll/use benefit
18.79 9.82 12.40 14.37 17.60
Employer-sponsored Life Insurance
Percent of providers who offered benefit 30.00 30.00 30.00 32.50 40.00
Percent of direct care workers who enroll/use benefit
18.79 18.17 17.52 16.84 20.32
Note: Unit of analysis is direct care worker. Calculated percentages exclude missing data so percentages within each variable sum to 100%.
Source: RTI International analysis of the 2014 Oregon Wage and Fringe Benefit Survey of Long-Term Care (LTC) Providers.
D-12

Appendix D — Supplemental Tables
Table D-11. Fringe Benefits for Direct Care Workers, by Provider Type, 2014
Direct Care Worker Benefits
Residential Care Supportive
Living: Developmental
Disabilities Contract
Children/ Developmental
Disabilities
Total Number of Providers 89 40 52
Health Insurance with Family Coverage
Percent offer to full-time direct care workers
55.84 89.66 57.50
Percent offer to part-time direct care workers
15.58 58.62 22.50
Average minimum required hours per month to receive benefit for part-time employees (mean minimum hours required)
69.60 129.00 84.00
Health Insurance for Employee Only
Percent offer to full-time direct care worker
67.53 86.21 75.00
Percent offer to part-time direct care workers
18.18 58.62 17.50
Average minimum required hours per month to receive benefit for part-time employees (mean minimum hours required)
73.62 129.00 65.00
Paid Personal Time Off, Vacation Time, or Sick Leave
Percent offer to full-time direct care workers
96.10 96.55 100.00
Percent offer to part-time direct care workers
54.55 79.31 70.00
Average minimum required hours per month to receive benefit for part-time employees (mean minimum hours required)
58.24 72.04 49.81
Paid Holidays
Percent offer to full-time direct care workers
72.73 82.76 77.50
Percent offer to part-time direct care workers
57.14 65.52 47.50
Average minimum required hours per month to receive benefit for part-time employees (mean minimum hours required)
36.76 72.58 36.00
(continued)
D-13

Wages, Fringe Benefits, and Turnover for Direct Care Workers Working for Long-Term Care Providers in Oregon
Table D-11. Fringe Benefits for Direct Care Workers, by Provider Type, 2014 (continued)
Direct Care Worker Benefits
Residential Care Supportive
Living: Developmental
Disabilities Contract
Children/ Developmental
Disabilities
Pension, or a 401(k) or 403(b)
Percent offer to full-time direct care workers
49.35 86.21 70.00
Percent offer to part-time direct care workers
29.87 72.41 47.50
Average minimum required hours per month to receive benefit for part-time employees (mean minimum hours required)
52.44 0.15 48.44
Life Insurance
Percent offer to full-time direct care workers
42.86 79.31 60.00
Percent offer to part-time direct care workers
24.68 55.17 22.50
Average minimum required hours per month to receive benefit for part-time employees (mean minimum hours required)
66.00 129.00 78.44
Note: Unit of analysis is provider for offered benefits and direct care worker for enrollment/use of benefit.
Source: RTI International analysis of the 2014 Oregon Wage and Fringe Benefit Survey of Long-Term Care (LTC) Providers.
D-14

Appendix D — Supplemental Tables
Table D-12. Fringe Benefits for Direct Care Workers at Foster Care Homes for Aged/Physical Disabilities in Oregon, 2003-2014
Year Provider in Operation
Foster Care Homes for Aged/Physical Disabilities with Direct Care Workers
2010 2011 2012 2013 2014
Total Number of Direct Care Workers 1,608 1,857 2,046 2,269 4,727
Health Insurance with Family Coverage
Percent of providers who offered benefit 3.61 4.12 4.64 5.15 4.64
Percent of direct care workers who enroll/use benefit
1.90 1.92 2.24 3.14 3.31
Health Insurance for Employee Only
Percent of providers who offered benefit 4.12 4.64 5.15 5.15 5.67
Percent of direct care workers who enroll/use benefit
2.85 3.56 3.98 2.69 4.49
Paid Personal Time Off, Vacation Time, or Sick Leave
Percent of providers who offered benefit 13.92 13.92 17.53 21.13 22.16
Percent of direct care workers who enroll/use benefit
13.92 15.62 16.17 17.49 18.68
Paid Holidays
Percent of providers who offered benefit 7.73 9.28 10.82 11.86 12.89
Percent of direct care workers who enroll/use benefit
13.61 15.34 13.93 16.59 16.78
Pension or 401(k) or 403(b) Account
Percent of providers who offered benefit 1.03 2.58 3.09 2.58 1.55
Percent of direct care workers who enroll/use benefit
0.63 1.64 2.49 1.79 1.65
Employer-sponsored Life Insurance
Percent of providers who offered benefit 0.52 1.03 1.03 1.03 1.55
Percent of direct care workers who enroll/use benefit
0.00 1.37 1.24 1.12 1.42
Note: Unit of analysis is provider for offered benefits and direct care worker for enrollment/use of benefit.
Source: RTI International analysis of the 2014 Oregon Wage and Fringe Benefit Survey of Long-Term Care (LTC) Providers.
D-15

Wages, Fringe Benefits, and Turnover for Direct Care Workers Working for Long-Term Care Providers in Oregon
Table D-13. Fringe Benefits for Direct Care Workers at Residential Care Facilities for Children with Developmental Disabilities, 2003-2014
Year Provider in Operation
Residential Care: Children/Developmental Disabilities
2010 2011 2012 2013 2014
Total Number of Direct Care Workers 783 697 731 811 443
Health Insurance with Family Coverage
Percent of providers who offered benefit 82.76 82.76 82.76 86.21 89.66
Percent of direct care workers who enroll/use benefit
0.88 1.78 1.13 0.85 1.25
Health Insurance for Employee Only
Percent of providers who offered benefit 86.21 86.21 86.21 89.66 93.10
Percent of direct care workers who enroll/use benefit 34.33 37.62 35.47 35.37 54.52
Paid Personal Time Off, Vacation Time, or Sick Leave
Percent of providers who offered benefit 89.66 89.66 89.66 93.10 96.55
Percent of direct care workers who enroll/use benefit
61.44 65.15 62.26 63.61 87.23
Paid Holidays
Percent of providers who offered benefit 75.86 75.86 75.86 79.31 82.76
Percent of direct care workers who enroll/use benefit 49.12 52.87 52.08 55.10 73.21
Pension or 401(k) or 403(b) Account
Percent of providers who offered benefit 65.52 72.41 68.97 75.86 86.21
Percent of direct care workers who enroll/use benefit
0.70 0.79 0.75 0.85 2.18
Employer-sponsored Life Insurance
Percent of providers who offered benefit 79.31 79.31 79.31 75.86 79.31
Percent of direct care workers who enroll/use benefit 38.91 40.59 39.06 35.71 50.47
Note: Unit of analysis is provider for offered benefits and direct care worker for enrollment/use of benefit.
Source: RTI International analysis of the 2014 Oregon Wage and Fringe Benefit Survey of Long-Term Care (LTC) Providers.
D-16

Appendix D — Supplemental Tables
Table D-14. Fringe Benefits for Direct Care Workers at Supportive Living Services for Individuals with Developmental Disabilities, 2003-2014
Year Provider in Operation
Supportive Living: Developmental Disabilities
2010 2011 2012 2013 2014
Total Number of Direct Care Workers 776 796 840 897 814
Health Insurance with Family Coverage
Percent of providers who offered benefit 40.00 45.00 40.00 45.00 47.50
Percent of direct care workers who enroll/use benefit
7.55 8.51 7.13 5.95 5.60
Health Insurance for Employee Only
Percent of providers who offered benefit 52.50 57.50 57.50 57.50 62.50
Percent of direct care workers who enroll/use benefit
29.36 28.97 27.29 28.74 34.24
Paid Personal Time Off, Vacation Time, or Sick Leave
Percent of providers who offered benefit 67.50 72.50 67.50 75.00 87.50
Percent of direct care workers who enroll/use benefit
56.04 56.79 54.11 52.10 64.48
Paid Holidays
Percent of providers who offered benefit 52.50 52.50 52.50 57.50 62.50
Percent of direct care workers who enroll/use benefit
72.48 70.05 70.54 67.05 74.72
Pension or 401(k) or 403(b) Account
Percent of providers who offered benefit 45.00 50.00 50.00 57.50 62.50
Percent of direct care workers who enroll/use benefit
18.79 9.82 12.40 14.37 17.60
Employer-sponsored Life Insurance
Percent of providers who offered benefit 30.00 30.00 30.00 32.50 40.00
Percent of direct care workers who enroll/use benefit
18.79 18.17 17.52 16.84 20.32
Note: Unit of analysis is provider for offered benefits and direct care worker for enrollment/use of benefit.
Source: RTI International analysis of the 2014 Oregon Wage and Fringe Benefit Survey of Long-Term Care (LTC) Providers.
D-17


Appendix E: Oregon Wage and Fringe Benefit Survey of
Long-term Care (LTC) Providers
E-1


Appendix E — Oregon Wage and Fringe Benefit Survey of Long-term Care (LTC) Providers
E-1

Wages, Fringe Benefits, and Turnover for Direct Care Workers Working for Long-Term Care Providers in Oregon
E-2

Appendix E — Oregon Wage and Fringe Benefit Survey of Long-term Care (LTC) Providers
E-3

Wages, Fringe Benefits, and Turnover for Direct Care Workers Working for Long-Term Care Providers in Oregon
E-4

Appendix E — Oregon Wage and Fringe Benefit Survey of Long-term Care (LTC) Providers
E-5

Wages, Fringe Benefits, and Turnover for Direct Care Workers Working for Long-Term Care Providers in Oregon
E-6

Appendix E — Oregon Wage and Fringe Benefit Survey of Long-term Care (LTC) Providers
E-7

Wages, Fringe Benefits, and Turnover for Direct Care Workers Working for Long-Term Care Providers in Oregon
E-8

Appendix E — Oregon Wage and Fringe Benefit Survey of Long-term Care (LTC) Providers
E-9

Wages, Fringe Benefits, and Turnover for Direct Care Workers Working for Long-Term Care Providers in Oregon
E-10

Appendix E — Oregon Wage and Fringe Benefit Survey of Long-term Care (LTC) Providers
E-11

Wages, Fringe Benefits, and Turnover for Direct Care Workers Working for Long-Term Care Providers in Oregon
E-12


