Embed Size (px)
Citation preview

Ekati WRSA Closure Ecological Risk Assessment Technical Session January 24, 2017, Yellowknife, Explorer Hotel – Kat C
Purpose TheoverallintentofthetechnicalsessionistoprovideanopportunitytohaveDDEC’stechnicalconsultantsavailabletoansweranyquestionsorprovideclarificationsforstakeholderssuchthatanefficientreviewoftheclosureriskassessmentframeworkcanbecompleted. Agenda In order to facilitate questions and discussions from stakeholders a total of fivepresentationsarescheduled.Timehasbeenallottedwithineachpresentationblockforquestionsanddiscussionwithstakeholders. Item Time Start Time End Round Table Introductions and Opening Comments 9:00 9:15
Closure Risk Assessment Framework Presentation (DDEC) 9:15 10:00
BREAK (coffee and snacks provided) 10:00 10:15
Thermal Modeling Presentation (Tetra Tech) 10:15 11:15
Water Balance Modeling Presentation (Golder) 11:15 12:00
LUNCH (not provided) 12:00 1:15
Water Quality Modeling Presentation (Golder) 1:15 2:15
BREAK (coffee and snacks provided) 2:15 2:30
Risk Assessment Presentation (ERM) 2:30 3:45
Final Technical Discussions and Wrap Up 3:45 4:30

Dominion Diamond Ekati CorporationWaste Rock Storage Areas Seepage Technical SessionJanuary 24, 2017

2
1. Ekati WRSA Seepage Background Information
2. Operational Risk Assessment and Thermal Modeling
3. Closure Risk Assessment Framework
4. Technical Session
Presentation Outline

3
WRSA SummaryPanda/Koala/Beartooth WRSA
Coarse Kimberlite Storage Area (CKRSA)
Fox WRSA
Pigeon WRSA
Misery WRSA
Lynx WRSA
Future Jay WRSA
Future Sable WRSA

4
• WRSA closure and reclamation activities are outlined Ekati’s Interim Closure and Reclamation Plan (ICRP) and through proposed updates in annual closure and reclamation progress reports.
• Selection of closure cover objectives are primarily based on the reactivity of waste materials and their potential for environmental impact.
• Misery: 5 m granite cover for encapsulating metasediment
• Pigeon : 3 m till + 1 m granite for encapsulating metasediment
• Panda/Koala: 5 m granite for land farm + 2 m granite for inert landfill
• Sable and Lynx: no cover for required for clean waste granite
• Fox & CKRSA: 5 m encapsulation cover for kimberlite (ICRP)1 m stabilization cover for kimberlite (DDEC proposed)
WRSA Closure and Reclamation

5
Seepage Monitoring
• Since 1999 WRSA seepage water quality has been monitored on a annual basis. At a minimum samples are collected twice a year once during freshet and once during fall season
• If required DDEC collects specific samples at a greater frequency such as after high rainfall events
• Findings of these monitoring programs are reported annually in the Waste Rock and Waste Rock Storage Area Seepage Survey reports.
Thermal Monitoring
• WRSA temperature readings in installed instrumentation are measured annually and reported as part of the WRSA Seepage Survey reports.
Annual Seepage and Thermal Monitoring

6
• On March 13, 2014 as part of its Approval of the 2012 WRSA Seepage Surveyand Thermal Monitoring Report the WLWB identified various operational andclosure items which required addressing by DDEC.
• Closure items were primarily centered around thermal monitoring andperformance of the WRSAs and what are the long-term water quality implicationsfor closure based on observed changes in seepage water quality.
• On September 30, 2014 DDEC provided its responses to the Board Directives.As part of it’s responses DDEC indicated that in order to address any waterquality implications from WRSA seepage in operations and for closure thedevelopment of an overall risk framework is required.
2012 Seepage Survey WLWB Directives

7
• On March 31, 2015 DDEC submitted a WRSA Screening Level Risk Assessment(ERA). The screening level risk assessment was completed by ERM ConsultantsCanada Ltd.
• Provided the Board and stakeholders an opportunity to review and commentprior to the development of the more complex WRSA Seepage Risk Assessmentfor closure conditions.
• The overall results of the screening level risk assessment indicated that currentlyduring Ekati operations there are no unacceptable health risks to aquatic life andterrestrial wildlife as a result of exposure to seepage from WRSA seepage.
• On September 9, 2015 the WLWB determined the ERA of WRSA seepage foroperational conditions at Ekati, when considered together with the additionaldirections provided by the Board, to be an appropriate framework fordevelopment of the Closure ERA for WRSA seepage conditions at Ekati.
WRSA Operational Risk Assessment

8
Operational Risk Assessment Framework
Risk Assessment
Ekati Monitoring
Data
9
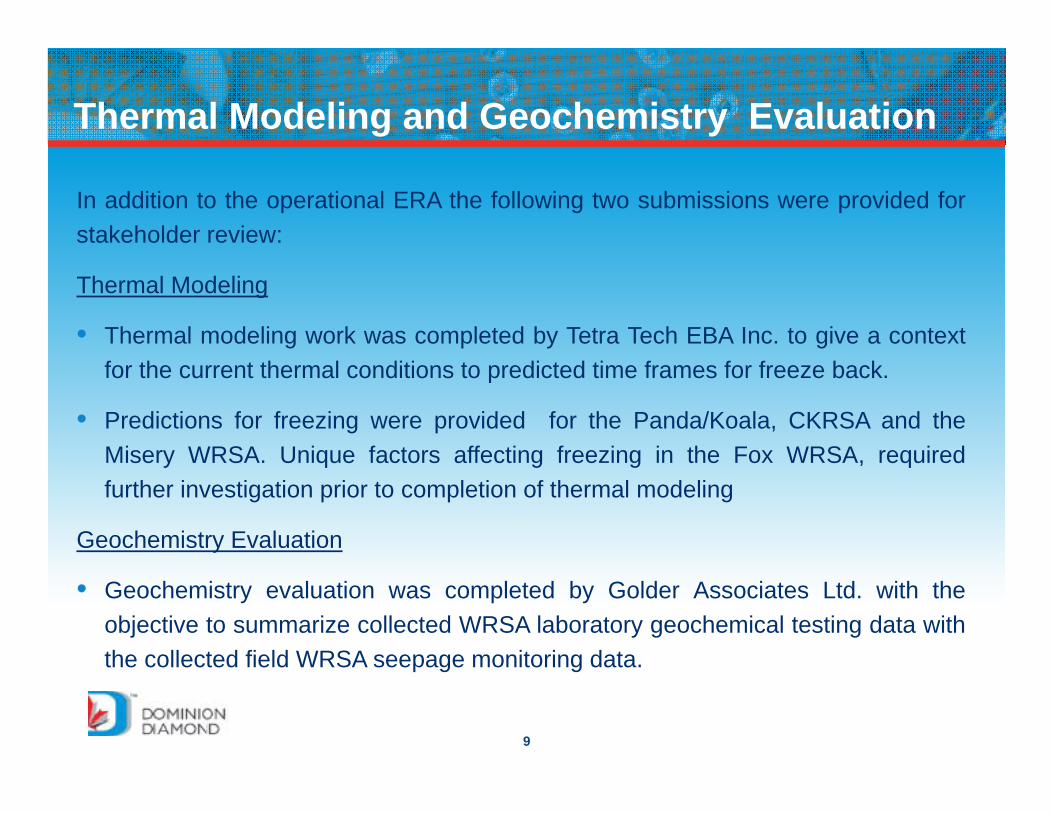
In addition to the operational ERA the following two submissions were provided forstakeholder review:
Thermal Modeling
• Thermal modeling work was completed by Tetra Tech EBA Inc. to give a contextfor the current thermal conditions to predicted time frames for freeze back.
• Predictions for freezing were provided for the Panda/Koala, CKRSA and theMisery WRSA. Unique factors affecting freezing in the Fox WRSA, requiredfurther investigation prior to completion of thermal modeling
Geochemistry Evaluation
• Geochemistry evaluation was completed by Golder Associates Ltd. with theobjective to summarize collected WRSA laboratory geochemical testing data withthe collected field WRSA seepage monitoring data.
Thermal Modeling and Geochemistry Evaluation

10
On October 31, 2015 DDEC provided three submissions in the development of theclosure risk assessment framework.
Thermal Modeling
• Thermal modeling work was completed by Tetra Tech EBA Inc. to give a contextfor the current thermal conditions to predicted time frames for freeze back
Water Quality Modeling
• Calibrated water quality models were developed by Golder Associates Ltd. foreach waste storage area to estimate seepage water quality during the remainingyears of operation and into closure.
Risk Assessment
• An ecological risk assessment (ERA) for the closure period was completed byERM Consultants Canada Ltd . The thermal and water quality modeling resultsfed into the completion of this component.
WRSA Closure Risk Assessment Framework

11
Closure Risk Assessment Framework
Risk Assessment
Thermal Modeling
Water Quality Modeling
On October 31, 2015 DDEC provided three submissions in thedevelopment of the closure risk assessment framework.

12
• The thermal model results indicate that all the WRSA’s are expected to freezeback over time. The results further indicate that the WRSA’s will undergopermafrost development and freezing.
• Based on the calculated hazard quotients (HQ’s) for aquatic life, the Closure ERApredicted closure conditions do not pose risk to aquatic life at the Ekati mine site.
• Sulphate concentrations in CKRSA indicate risk to wildlife based on thecalculated HQ for sulphate. Limited data available on sulphate toxicity do notsuggest that effects on growth, reproduction, or survival will occur.
Summary of Key Results
13
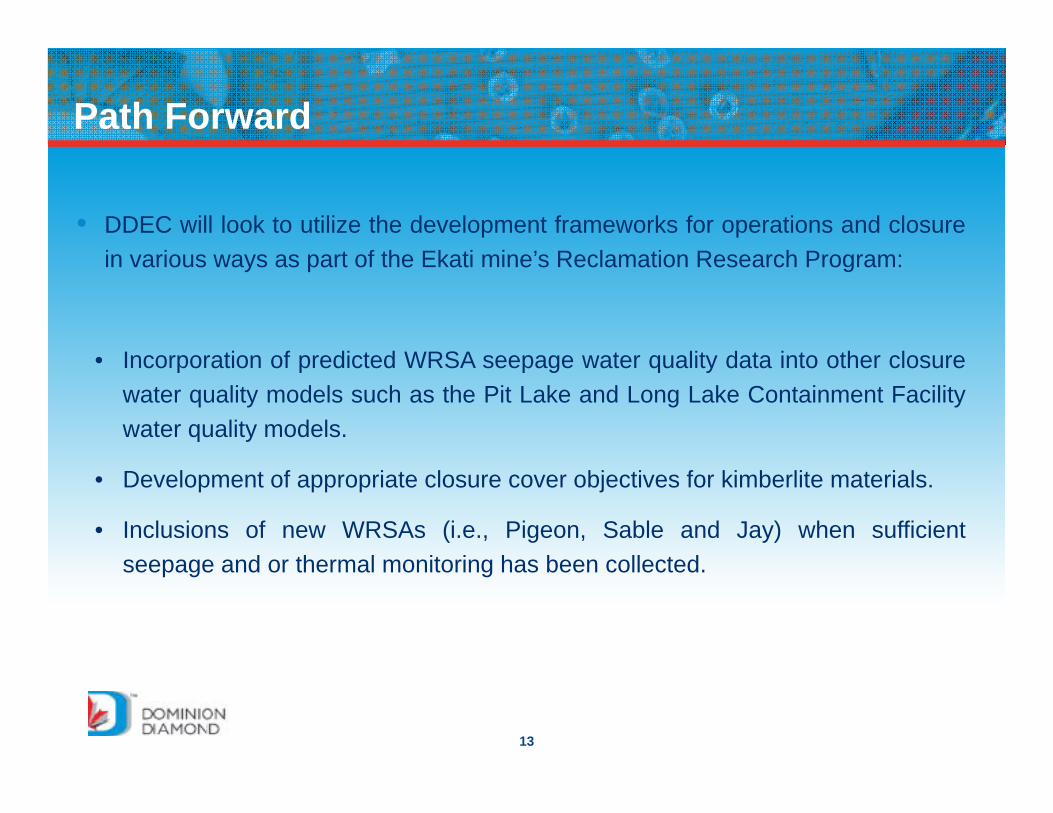
• DDEC will look to utilize the development frameworks for operations and closurein various ways as part of the Ekati mine’s Reclamation Research Program:
• Incorporation of predicted WRSA seepage water quality data into other closurewater quality models such as the Pit Lake and Long Lake Containment Facilitywater quality models.
• Development of appropriate closure cover objectives for kimberlite materials.
• Inclusions of new WRSAs (i.e., Pigeon, Sable and Jay) when sufficientseepage and or thermal monitoring has been collected.
Path Forward

14
• DDEC believes that it has provided high quality reclamation research work forstakeholder review and eventual acceptance from the Board. The work wasdeveloped based on the best information available and overall effort to adopt areasonable conservative approach.
• The overall intent of the technical session is to optimize the review process byhaving DDEC’s technical consultants available to answer any questions orprovide clarifications for stakeholders prior to the deadline of submitting technicalcomments.
• Some technical items will be resolved at the technical session.• For items that can’t be resolved our technical team develops an understanding
and has time to prepare suitable answers to formal stakeholder comments.
• DDEC encourages all parties to keep their questions and discussions in contextto its significance on the research results and also to the information that wasavailable to our technical team during the time of development.
Technical Session

THERMAL EVALUATION OF MISERY, PANDA/KOALA, COARSE PK, AND FOX WASTE ROCK STORAGE AREAS EKATI DIAMOND MINE, NT

INTRODUCTION
• Tetra Tech was retained by DDEC to evaluate the thermal performance and provide long-term predictions of the thermal conditions in the waste rock storage areas (WRSAs) at Ekati. These include: Misery WRSA
Panda/Koala WRSA
Coarse Processed Kimberlite (Coarse PK) WRSA
Fox WRSA

BACKROUND INFORMATION
• The thermal performance of the WRSAs forms part of DDEC’s response to the Wek‘èezhìi Land and Water Board’s review of the 2012 Annual Waste Rock Seepage Survey.
• WRSA thermal items raised by the Board include: Timelines for freeze back of the WRSAs
Impact of potential heat accumulation in bedrock of the WRSAs
Potentially reactive waste rock in WRSAs
Unfrozen state at Fox WRSA

PROJECT SCOPE
• Review of site relevant data for each WRSA
• Model Construction
• Thermal Calibration
• Long-term thermal behavior under climate change

METHODOLOGY
• A series of one-dimensional thermal models were developed for the thermal analysis at the WRSAs Central areas within large footprints
Far from pile slopes and water bodies
• GEOTHERM software Finite element analysis program developed to model heat conduction
in the freezing/thawing of soils
Accounts for many physical processes involved in energy transfer at the ground surface that other programs do not
CLIMATE CHANGE SCENARIOS
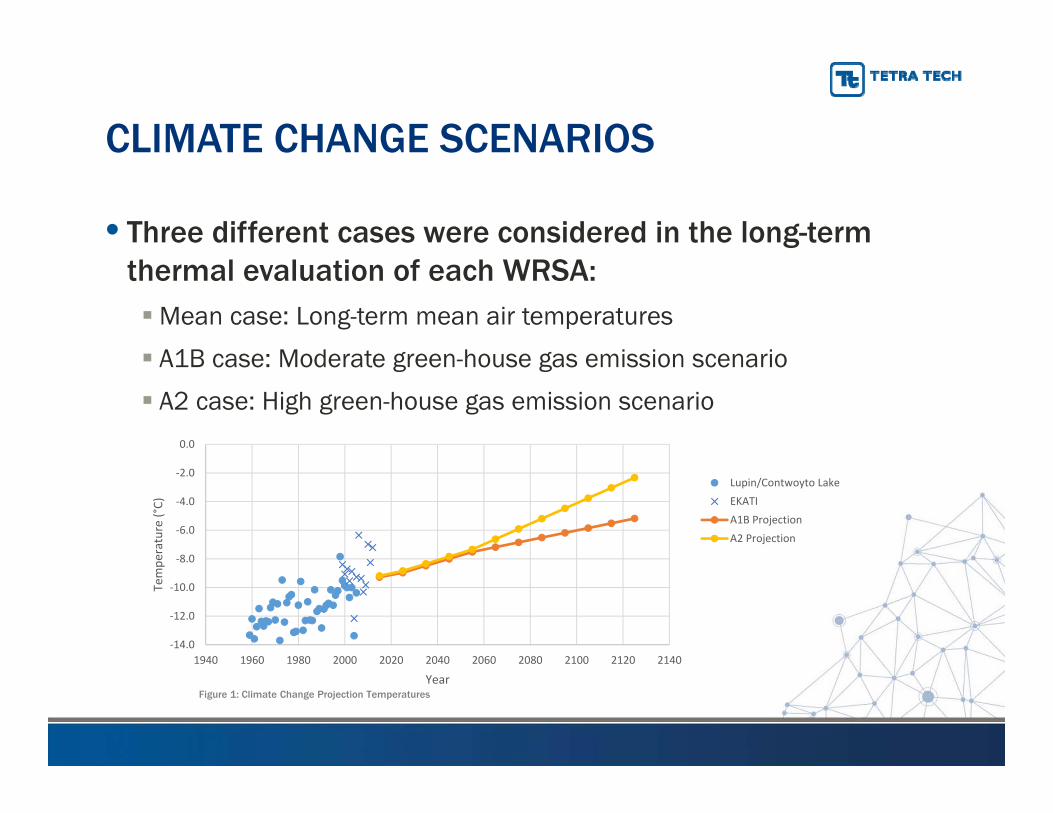
• Three different cases were considered in the long-term thermal evaluation of each WRSA:Mean case: Long-term mean air temperatures
A1B case: Moderate green-house gas emission scenario
A2 case: High green-house gas emission scenario
‐14.0
‐12.0
‐10.0
‐8.0
‐6.0
‐4.0
‐2.0
0.0
1940 1960 1980 2000 2020 2040 2060 2080 2100 2120 2140
Tempe
rature (°C)
Year
Lupin/Contwoyto LakeEKATIA1B ProjectionA2 Projection
Figure 1: Climate Change Projection Temperatures

MISERY WASTE ROCK STROAGE AREA
Figure 2: Plan View of Misery WRSA

1. GENERAL INFORMATION
• The Misery pit was developed from 2002 to 2006 and then again from 2011 to present.
• The Misery WRSA is located adjacent (North-East direction) to the pit.
• Layering of schist (metasediment) and granite capped with a 5 m thick granite rock cover.

2. CURRENT PERMAFROST CONDITION
• A large portion of Misery WRSA is in a frozen condition Granite lift placed in summer 2015 currently in unfrozen condition
• Thermal analyses focus on the area around GTC 1466/1541 Warmest temperature profile in the pile
Central area of WRSA

3. MODEL ASSUMPTIONS
• Updated 2006 model Simulated construction history
Incorporated recent temperature readings to directly consider waste rock construction history
Added new lift of granite (from El. 485 m to 500 m)
• Snow accumulation and drifting on pile benches and pile crests was considered during and after construction
• Conduction

4. LONG-TERM RESULTS
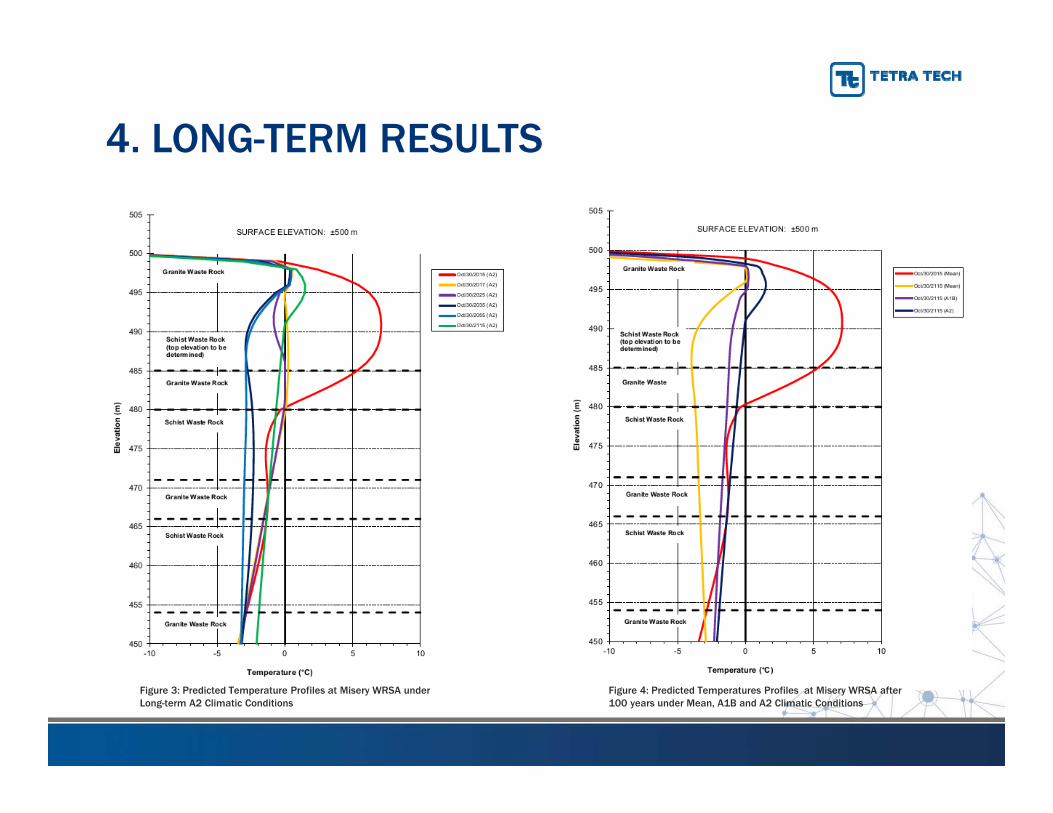
• Newly placed granite below the active layer is predicted to gradually freeze back and become completely frozen approximately 12 years after placement (Year 2027).
• Waste rock below the active layer will reach predicted temperatures of approximately 0°C to -2.1°C after 100 years under A2 climate conditions.
• Waste rock below the active layer is predicted to remain frozen under mean, A1B and A2 conditions after 100 years.
• Bedrock will remain in a frozen state even under the long-term A2 climate change scenario.
4. LONG-TERM RESULTS
Figure 4: Predicted Temperatures Profiles at Misery WRSA after 100 years under Mean, A1B and A2 Climatic Conditions
Figure 3: Predicted Temperature Profiles at Misery WRSA under Long-term A2 Climatic Conditions

PANDA/KOALA WASTE ROCK STORAGE AREA
Figure 5: Plan View of Panda/Koala WRSA

1. GENERAL INFORMATION
• The Panda/Koala and Bearclaw pits were developed from 1998 to 2006.
• The Panda/Koala WRSA is located on the west side of the Panda/Koala and Bearclaw pits.
• Primarily composed of granite, but also has traces of till and waste kimberlite stored at certain locations.

2. CURRENT PERMAFROST CONDITION
• The Panda/Koala WRSA is currently in a frozen condition
• Thermal analyses focus on the area around GTC 1534 Central area of WRSA
Warmest temperature profile in the pile

3. MODEL ASSUMPTIONS
• Updated 2006 model Simulated construction history
Incorporated recent temperature readings to directly consider waste rock construction history
• Snow accumulation and drifting on pile benches and pile crests was considered during and after construction
• Conduction

4. LONG-TERM RESULTS
• Panda/Koala WRSA is already in a frozen condition.
• Long-term predicted ground temperatures were generally within the range of 0°C to -2.0°C after 100 years under A2 climate conditions
• Waste rock below the active layer is predicted to remain frozen under mean, A1B and A2 conditions after 100 years.
• Bedrock will remain in a frozen state even under the long-term A2 climate change scenario.

4. LONG-TERM RESULTS
Figure 7: Predicted Temperatures Profiles at Panda/Koala WRSA after 100 years under Mean, A1B and A2 Climatic Conditions
Figure 6: Predicted Temperature Profiles at Panda/Koala WRSA under Long-term A2 Climatic Conditions

COARSE PK WASTE ROCK STROAGE AREA
Figure 8: Plan View of Coarse PK WRSA

1. GENERAL INFORMATION
• The Coarse PK WRSA is adjacent to the Panda/Koala WRSA
• Composed of coarse processed kimberlite
• Active deposition zone

2. CURRENT PERMAFROST CONDITION
• The Coarse PK WRSA is currently in an unfrozen condition Release of large latent heat and the on-going placement of wet, warm
Coarse PK may be cause of delayed freeze back
• Thermal analyses focus on the area around GTC 1469 Central area of WRSA
GTC 1468 no longer operational (since 2005)
Ground temperatures have been approximately 0°C for 10 years

3. MODEL ASSUMPTIONS
• Updated 2006 model Simulated construction history
Incorporated recent temperature readings to directly consider waste rock construction history
Incorporated new lift of coarse PK (from El. 489.8 m to 501.8 m)
• Snow accumulation and drifting on pile benches and pile crests was considered during and after construction
• Conduction

4. LONG-TERM RESULTS
• Coarse PK waste rock above El. 485 m would remain unfrozen for years from the deposition of warm, wet PK in the summer/fall of 2014.
• The warmest area of the waste rock pile will freeze approximately 17 years after placement under mean, A1B and A2 conditions (Year 2031).
• Coarse PK below the active layer will reach temperatures of approximately 0°C to -0.6°C after 100 years under A2 conditions.
• Waste rock below the active layer is predicted to remain frozen under mean, A1B and A2 conditions after 100 years.
• Bedrock will remain in a frozen state even under the long-term A2 climate change scenario.

4. LONG-TERM RESULTS
Figure 10: Predicted Temperatures Profiles at Coarse PK WRSA after 100 years under Mean, A1B and A2 Climatic Conditions
Figure 9: Predicted Temperature Profiles at Coarse PK WRSA under Long-term A2 Climatic Conditions

4. LONG-TERM RESULTS
Figure 11: Long-term Ground Temperature Predictions at the Warmest Recorded Data Point for GTC 1469 at Coarse PK Storage Area
FOX WASTE ROCK STROAGE AREA
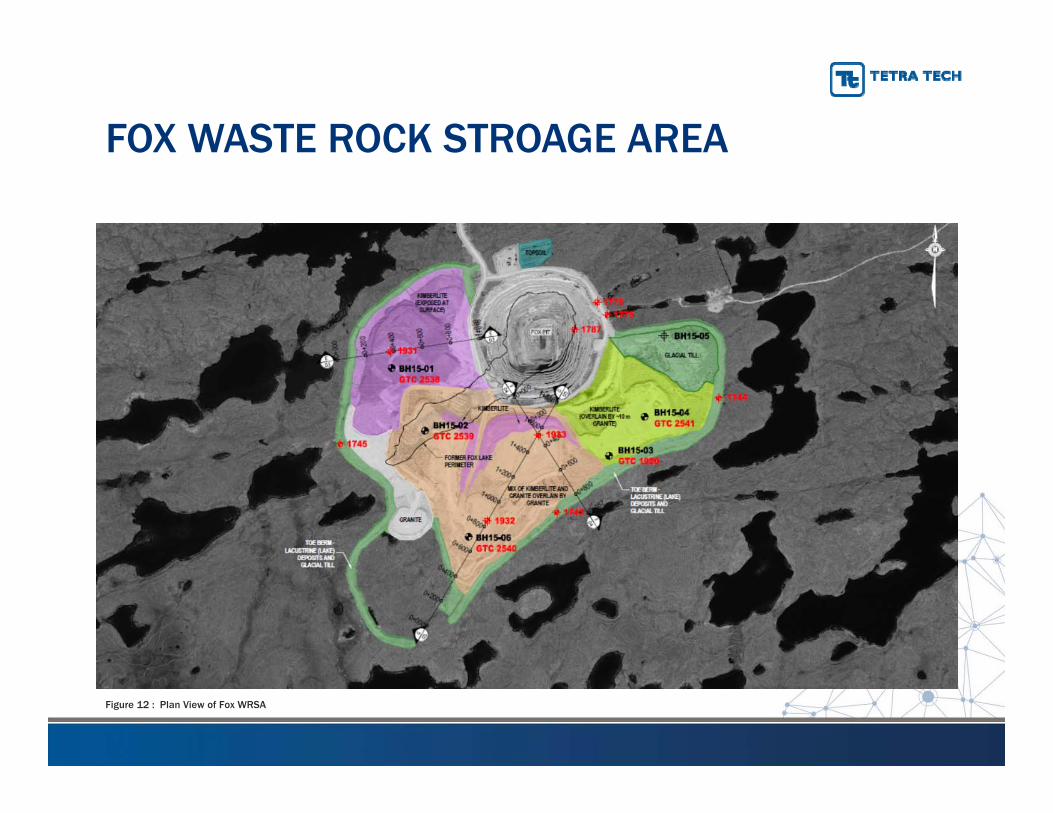
Figure 12 : Plan View of Fox WRSA

1. GENERAL INFORMATION
• The Fox pit was developed from 2002 until 2014
• Fox WRSA is located on the south, west, and east sides of the Fox pit
• Drilling investigation program (2015): Layers of kimberlite and granite overlying a granite pad over tundra
Deeper kimberlite layers demonstrate higher water retention than the upper kimberlite layers
Installation of additional GTCs to better understand unfrozen state

2. SITE INVESTIGATION
Figure 13: Fox WRSA
Figure 14: Major Drilling Rig Set-up
3. CURRENT PERMAFROST CONDITION
• The majority of the Fox WRSA is in an unfrozen state: Toe berm = frozen state
Central WRSA =unfrozen state
• Thermal analyses focus on locations of GTCs 1931, 1932, and 1933 Central area of WRSA
GTC 1931: top 20 m of the waste rock pile demonstrated a warming trend meanwhile a cooling trend was observed below a depth of 20 m
GTC 1932: cooling trend since 2009
GTC 1933: cooling trend since 2009

4. MODEL ASSUMPTIONS
• Construction timing based on final geometry survey information
• Material thickness based on final geometry survey information
• Initial rock temperature selected to best match temperature data
• Moisture content adjusted with time to consider trapping of snow and ice, spring freshet runoff infiltration into WRSA
• Freezing point depression (-0.2°C)
• Snow accumulation and drifting on pile benches and pile crests was considered during and after construction
• Conduction

5. THERMAL CALIBRATION – GTC 1932
460
465
470
475
480
485
490
495
500
505
510
515
-25 -20 -15 -10 -5 0 5 10 15
Elev
atio
n (m
)
Temperature (°C)
Jun/5/2008 MeasuredMay/6/2012 MeasuredOct/2/2013 MeasuredNov/21/2014 MeasuredSep/30/2015 MeasuredJun/5/2008 PredictedMay/6/2012 PredictedOct/2/2013 PredictedNov/21/2014 PredictedSep/30/2015 Predicted
SURFACE ELEVATION: ±510 m
Granite Waste Rock
Kimberlite Waste Rock
Granite Waste Rock
Kimberlite Waste Rock
Granite Waste Rock
Glacial Till
Bedrock
Figure 15: Comparison of Measured and Predicted Temperature for GTC 1932 at Fox WRSA

6. GENERAL LONG-TERM RESULTS
• Ground temperature will slowly cool to a frozen condition. This is primarily due to the material properties (high moisture content and clay content) present within the kimberlite layers of the WRSA.
• Waste rock below the active layer will remain frozen under the A2 scenario after 100 years at each of the GTC locations.
• Bedrock will remain in a frozen state even under the long-term A2 climate change scenario.

6. GENERAL LONG-TERM RESULTS
GTC Identification Number Approximate Freeze Back Time Under Mean to A2 Conditions (Year)
Approximate Duration from Placement Until Freeze Back (Years)
1931 2053 to 2056 37 to 40
1932 2074 to 2081 58 to 65
1933 2046 to 2048 30 to 32
Table 1: Freeze Back Durations at Fox WRSA

6. LONG-TERM RESULTS – GTC 1932
• Freeze back of warmest area will attain a frozen condition in approximately 58 to 65 years under mean to A2 climatic condition
Figure 16: Long-term Ground Temperature Predictions at the Warmest Recorded Data Point for GTC 1932 at Fox WRSA

6. LONG-TERM RESULTS – GTC 1932
• Predicted temperature ranges expected under A2 conditions over 100 years
• Range of approximately -0.2°C to -0.5°C
Figure 17: Predicted Temperature Profiles at Selected Dates for GTC 1932 at Fox WRSA under Long-Term Climate Change (A2)

CONCLUSION
• All WRSAs are all expected to freeze back over time
• Permafrost development and freezing at varying rates due to differing waste rock compositions
• All WRSAs (waste rock and bedrock) will remain frozen under mean, A1B and A2 conditions after 100 years (with exception of active layer)

Goldsim Water Balance Modeling of Waste Storage Areas at the Ekati Mine -Northwest Territories
January 24, 2016

Water Balance-Outline
Study Objectives
Waste Rock Hydrology
Model Approach and Assessment Methods
Model Results
January 23, 2017 2
Water Balance-Study Objectives
The objectives of the WRSA water balance model are;
Model the physical processes of water (seepage and runoff) in the WRSA
Project future changes in water quantity
Input to the Water Quality modeling of the WRSAs.
January 23, 2017 3

Water Balance-WRSA Hydrology in the North
Located within continuous permafrost
Water infiltrating the WRSAs is trapped in the waste rock material as ice
Rock grain size heterogeneity within the WRSAs results in a complex system of flow paths
Flow paths in the outer surfaces of the WRSAs (active layer) are affected by seasonal melt and thaw
Thermal conditions of active layer and within the core
January 23, 2017 4
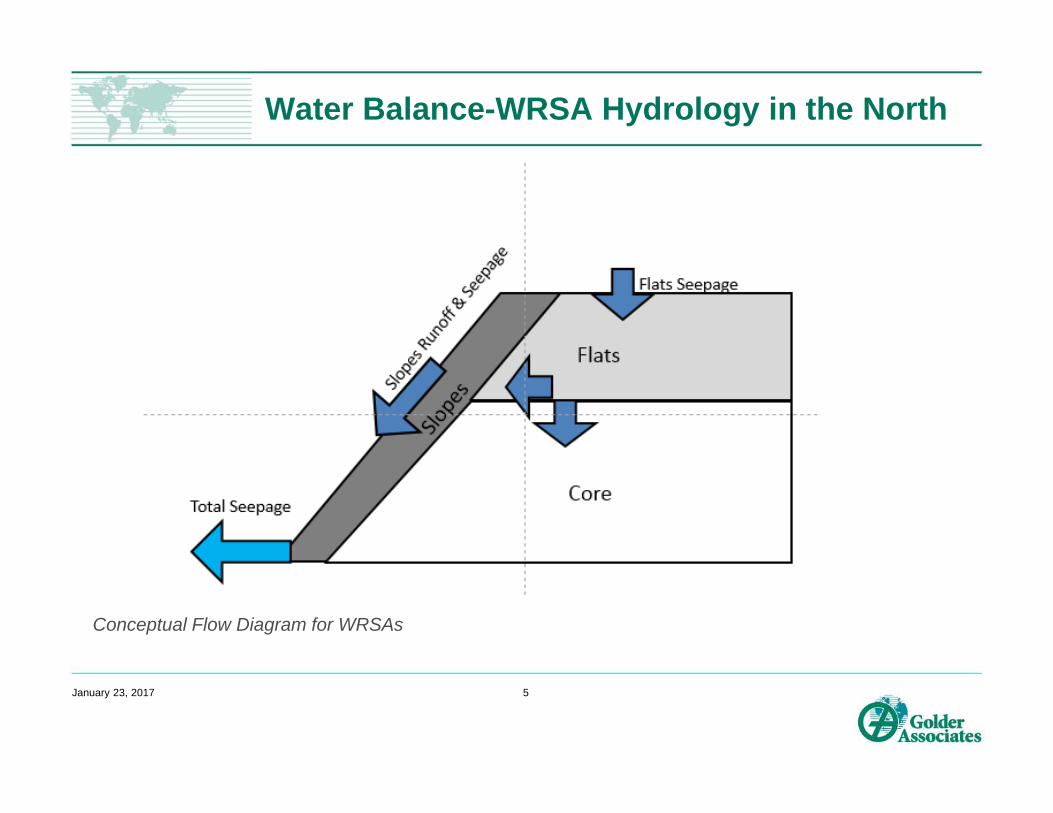
Water Balance-WRSA Hydrology in the North
January 23, 2017 5
Conceptual Flow Diagram for WRSAs
Water Balance-Model Approach and Assessment Methods
Modelled Flow Paths
Active layer Flow paths
Water that falls on the outer slopes of the WRSAs and travels along the surface of the outer slope to the toe, as runoff
Water that falls on the outer slopes and flats of the WRSAs and travels along the impermeable layers and appears as seepage at the toe
Core Water that infiltrates through the core of the pile is assumed to be
retained as ice January 23, 2017 6

Water Balance-Model Platform
The model was developed using GoldSim™ Version 11.1 (GoldSim 2010).
GoldSim is a graphical, object-oriented mathematical modelling program
All input parameters and functions are defined by the user
Widely used in the mining industry for water balance modeling
Simulating dynamic systems that evolve with time
Integration with Water Quality models
January 23, 2017 7
Water Balance-Model Approach and Assessment Methods
Water Infiltration Scenarios
“Higher seepage scenario” represents the highest recorded rainfall infiltration rate from the Diavik test pile data (58%) recorded from 2007 to 2013
“Lower seepage scenario” represents the average of the rainfall infiltration rates (37%) from the Diavik test pile data recorded from 2007 to 2013
For both scenarios snowmelt infiltration represents the maximum of the snowmelt infiltration rates (22%) from the Diavik test pile data estimated from 2010 to 2013
Krentz 2014, Hydrologic Processes in Waste Rock Piles in the Canadian Artic: Snowmelt Infiltration and the Onset of Long Term Freezing in Test piles, M.Sc. Thesis: University of British Columbia, Canada.
January 23, 2017 8
Water Balance-Model Approach and Assessment Methods
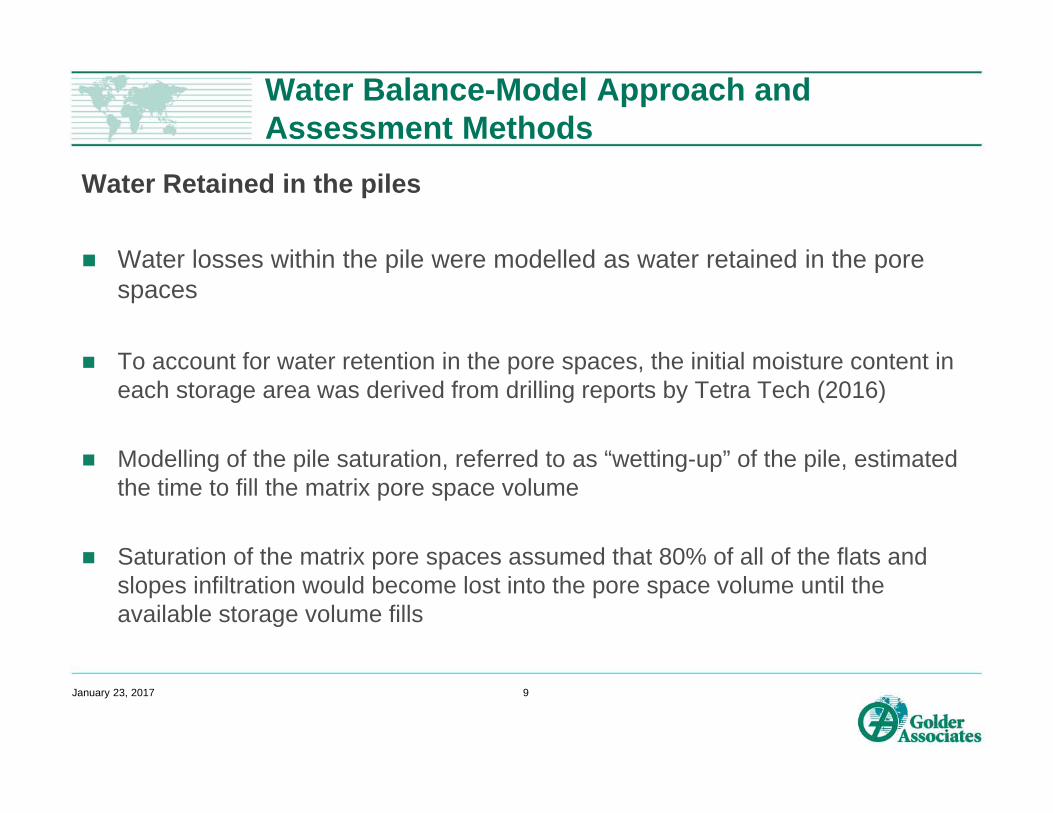
Water Retained in the piles
Water losses within the pile were modelled as water retained in the pore spaces
To account for water retention in the pore spaces, the initial moisture content in each storage area was derived from drilling reports by Tetra Tech (2016)
Modelling of the pile saturation, referred to as “wetting-up” of the pile, estimated the time to fill the matrix pore space volume
Saturation of the matrix pore spaces assumed that 80% of all of the flats and slopes infiltration would become lost into the pore space volume until the available storage volume fills
January 23, 2017 9

Water Balance-Model Approach and Assessment Methods
Water Retained in the piles Con’t
Misery, Panda/Koala/Beartooth, and CKRSA piles assumed the initial moisture contents from Tetra Tech (2016) represent the final (long-term) moisture contents of the piles.
Fox drilling revealed a higher moisture content in the lower layer of the pile (30%) than the upper layers (23%). initial moisture content of the Fox WRSA was assumed to be 23%, and
water was retained within the pile until a final moisture content of 30% was achieved
January 23, 2017 10
PM4

Slide 10
PM4 The Fox WRSA pile was drilled by the other piles were not. So we might need to rework to say that the initial moisture conditions were based on those assumed in the thermal modeling (Tetra Tech 2016)Paget, Mike, 1/22/2017

Water Balance-Model Approach and Assessment Methods
January 23, 2017 11
To delay runoff and seepage over a period of days or weeks following precipitation events, lag time and rate of decay was used
Erlang function refers to a two-parameter Gaussian distribution lag decay
Yields seepage results spread over all the summer months

Water Balance-Model Approach and Assessment Methods
January 23, 2017 12

Water Balance-Model Inputs
Input data to the model include:
WRSA characteristics (i.e. facility construction, material placement and facility size)
Aite specific climate and hydrology characteristics Measured data until 2014; average climate characteristics 2014-2114
A literature review of mines in the north to determine water yield
January 23, 2017 13

Water Balance-Model Results
Seepage from the flats is the slowest released (over several weeks)
Seepage from the slopes is released over several days
Runoff from the slopes is the fastest flow path and is released over a day
Total discharge is an almost constant low outflow at the toe with small increases due to precipitation and freshet
January 23, 2017 14

Model Results
January 23, 2017 15
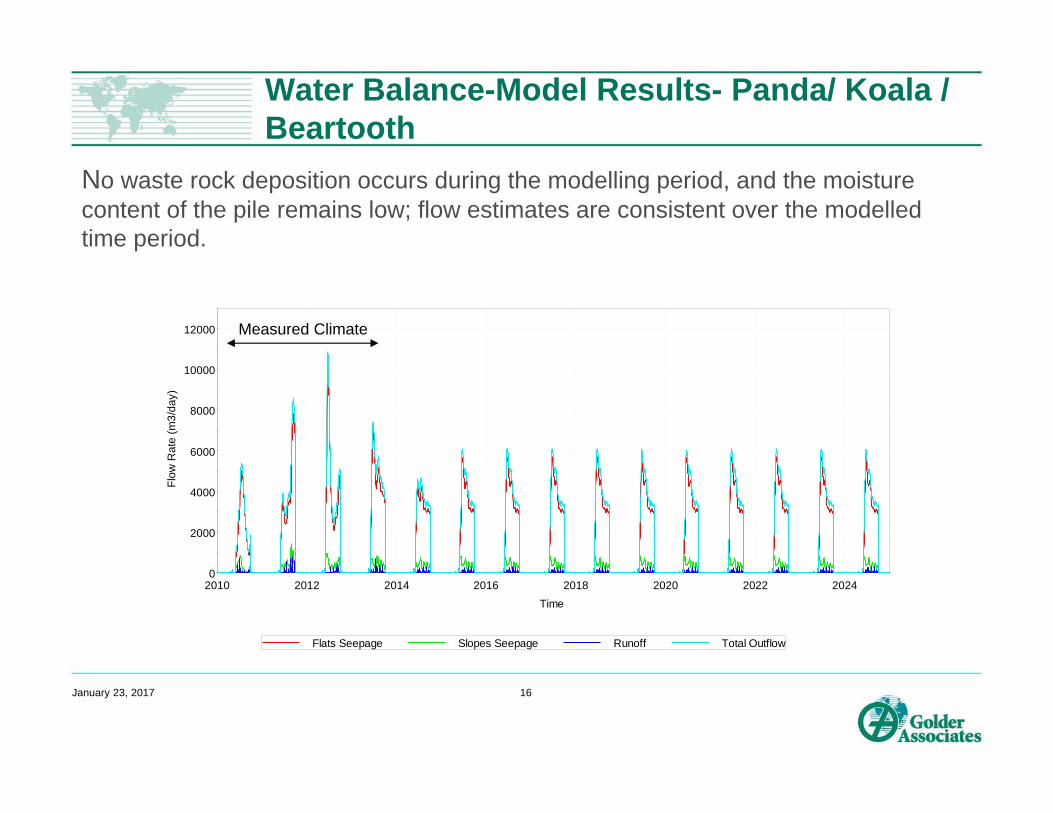
Water Balance-Model Results- Panda/ Koala / Beartooth
No waste rock deposition occurs during the modelling period, and the moisture content of the pile remains low; flow estimates are consistent over the modelled time period.
January 23, 2017 16
0
2000
4000
6000
8000
10000
12000
2010 2012 2014 2016 2018 2020 2022 2024
Flow
Rat
e (m
3/da
y)
Time
Flats Seepage Slopes Seepage Runoff Total Outflow
Measured Climate

Water Balance-Model Results- CKRSA
January 23, 2017 17
0
500
1000
1500
2000
2500
2010 2012 2014 2016 2018 2020 2022 2024
Flow
Rat
e (m
3/da
y)
Time
Flats Seepage Slopes Seepage Runoff Total Outflow
Measured Climate Wetting up

Water Balance-Model Results- Fox
January 23, 2017 18
0.6 million tonnes of waste rock deposition occurred between 2009 and 2013.
Based on the final estimated moisture content of the Fox WRSA, additional water storage capacity exists within the pore spaces of the pile.
It is estimated that the pile will finish wetting-up by 2021 in the high seepage scenario

Water Balance-Model Results-Fox
January 23, 2017 19
0
1000
2000
3000
4000
5000
2010 2012 2014 2016 2018 2020 2022 2024
Flow
Rat
e(m
3/da
y)
Time
Flats Seepage Slopes Seepage Runoff Total Outflow
Measured Climate Wetting up

Water Balance-Model Results- Misery
Due to ongoing waste rock deposition between 2009 and 2018, the moisture content of the pile remains low. Flow estimates show an increase when the pile wets up in 2022 for the higher seepage scenario.
January 23, 2017 20
0
200
400
600
800
1000
1200
1400
1600
2010 2012 2014 2016 2018 2020 2022 2024
Flow
Rat
e (m
3/da
y)
Time
Flats Seepage Slopes Seepage Runoff Total Outflow
Measured Climate Wetting up

Water Balance-Summary
Represents physical processes that influence seepage and runoff water quantity from the WRSA at the Ekati mine during operations and closure;
Provides flexible, modular tool for Water Quality modelling of the WRSAs flow paths in Goldsim.
January 23, 2017 21

Closure
Questions?
January 23, 2017 22

Water Quality Modeling of Seepage from Waste Rock and Coarse Kimberlite Reject Storage Areas

Objectives
Develop a water quality model for the Panda/ Koala/Beartooth, Fox and Misery WRSAs and the CKRSA for the purpose of understanding the physical and geochemical processes that may influence seepage water quality;
Project future change in seepage water quality from the Misery, Fox, and Panda/Koala/Beartooth WRSAs, and the CKRSA through closure;
Evaluate the effect of cover thickness on seepage chemistry; Evaluate the effect of high and low seepage rates on seepage
chemistry; and Provide model outputs for use in the risk assessment.
January 23, 2017 2

Dry PermafrostCore
Flats
Flats Seepage
Total Seepage
Conceptual Model

Model Approach
January 23, 2017 4
Thermal Model Results
Thermal Model Results
Storage Area CharacteristicsStorage Area
Characteristics
Geochemistry Testwork DataGeochemistry Testwork DataCalculate Loading Rates
Calibrate Loading Rates(2009-2013)
Solubility ControlsSolubility Controls Monitored Seepage data
Monitored Seepage data
Model Seepage Water Quality(2014-2115)
Water BalanceWater Balance Thermal Model Results
Thermal Model Results
Risk Assessment (ERM)
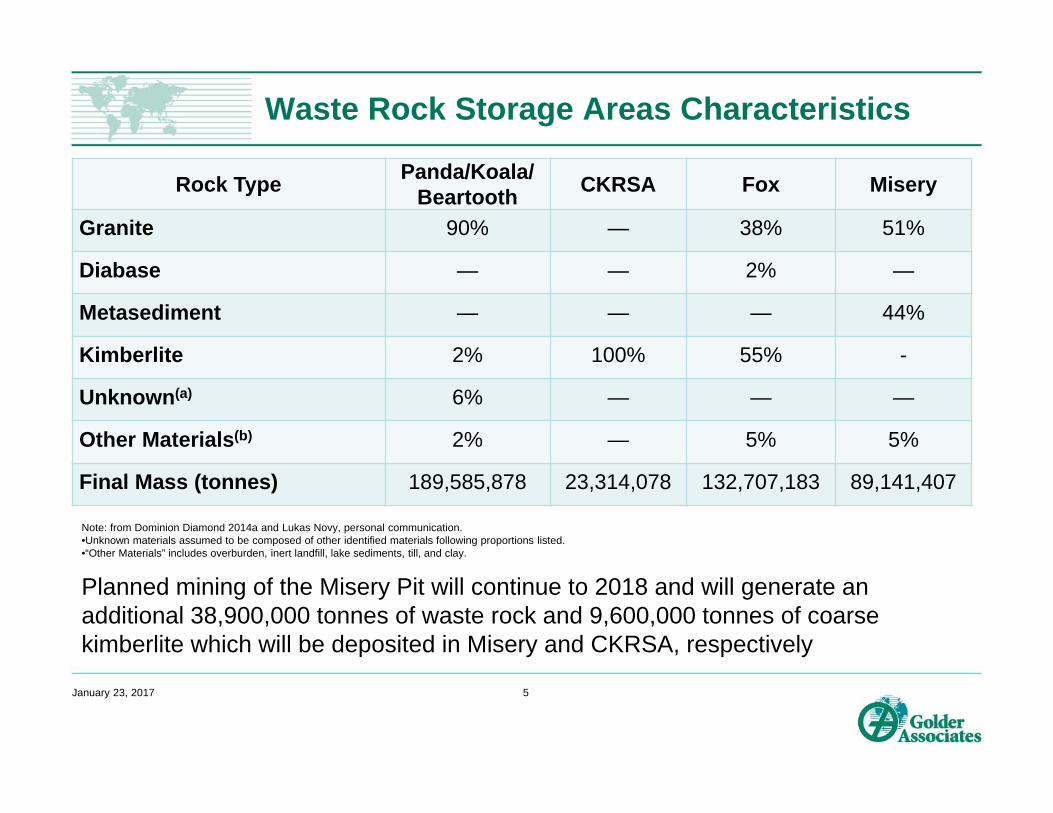
Waste Rock Storage Areas Characteristics
Rock Type Panda/Koala/Beartooth CKRSA Fox Misery
Granite 90% — 38% 51%
Diabase — — 2% —
Metasediment — — — 44%
Kimberlite 2% 100% 55% -
Unknown(a) 6% — — —
Other Materials(b) 2% — 5% 5%
Final Mass (tonnes) 189,585,878 23,314,078 132,707,183 89,141,407
January 23, 2017 5
Note: from Dominion Diamond 2014a and Lukas Novy, personal communication.•Unknown materials assumed to be composed of other identified materials following proportions listed.•“Other Materials” includes overburden, inert landfill, lake sediments, till, and clay.
Planned mining of the Misery Pit will continue to 2018 and will generate an additional 38,900,000 tonnes of waste rock and 9,600,000 tonnes of coarse kimberlite which will be deposited in Misery and CKRSA, respectively

Core Temperatures
Inputs from TetraTech’s thermal modeling, Climate Change Scenario A2 Panda/Koala/Beartooth WRSA: frozen over modelled period CKRSA: frozen core in 2025 Misery WRSA: frozen core in 2025 Fox WRSA: frozen core in 2081
January 23, 2017 6

Baseline Water Quality
Baseline water quality was represented by the median concentrations observed in water quality monitoring results from Lac du Sauvage, Duchess Lake, Paul Lake, and small lakes and streams in the Lac du Sauvage watershed from 1994 and 2013
Materials assigned baseline water quality: Lake bed sediments Inert landfill Clay Till Overburden material
January 23, 2017 7

Total Metal Concentration
Total metal concentration factors were developed for each storage area: The seepage monitoring data was screened to identify data in which
both total and dissolved metal concentrations were measured, and were above the detection limit
An average total metal concentration and an average dissolved metal concentration was calculated for each metal
Total metal concentration factors = (averaged total metal concentration)/(averaged dissolved metal concentration).
Factors were screened to remove differences that may be a function of analytical error. Total metal concentration factors were only provided when factor exceeded 1.2.
January 23, 2017 8

Loading Rates
Loading rates were derived from humidity cell test (HCT) results (Norecol et al. 1997, SRK 2013a): 13 HCTs for granite; 12 HCTs for metasediments; 7 HCTs for diabase; and 11 HCTs for kimberlite.
Loading rates were calculated based on the last five cycles of analysis from HCTs with more than 20 weeks of analysis.
Seepage water quality monitoring data from 1998 to 2013 was used to derive input concentrations for chloride, fluoride and nitrate.
Loads were accumulated in the active layer from October to May of each year when this layer is frozen and released upon melting, starting in June, using the same delay applied to the seepage flows in the water balance.
January 23, 2017 9

Scaling Factors
Scaling factors were as follows: Temperature correction (SFtemp): accounts for the difference in
temperature between the lab and the field. The temperature correction factor was derived using the Q10 approach (Elberling2005) where the reaction rate is assumed to increase by a factor of two for every 10°C above -2°C, and decrease by a factor of ten for every 10°C below -2°C.
Lab-to-field correction (SFLTF): Grain size Channelization or unsaturated flow Weathering processes not represented in the laboratory testing (e.g.
mineral precipitation). Core load release (SFcore): When the core of the storage areas are
above 0°C (-0.2°C in Fox) load is released from the core. ∗ ∗ ∗
January 23, 2017 10

Model Calibration: Seepage Loading Rates
Seepage loading rates were derived using seeps that had both water quality and corresponding flow data. Seepage loading rates were calculated as follow:
January 23, 2017 11
Seepage Loading Rates Σ Seepage Observed Load Flow Ratio Waste Rock Ratio
agivensamplingevent
ModeledFlowSeepageObservedFlow
WRTimeSeriesInputWasteRockTonnage Because only a fraction of the total seepage
flow is measured in a given sampling event (Date X), the sum of the measured flows were compared to the total seepage modelled flows

Model Calibration: Calibration Factors
January 23, 2017 12
Constituent-specific calibration factors were applied to those parameters that exhibit geochemical controls, and constituents that have loading rates that were significantly different (i.e., higher or lower) than the storage area seepage loading rates.
Calibration Factors Logic

Model Calibration: Calibration Factors
January 23, 2017 13
No

Notes on Calibration Factors
Mercury concentrations were measured but not detected in geochemical testwork or seepage water quality and therefore was set equal to the detection limit of 0.000005 mg/L.
Beryllium was measured but only detected in the metasedimentary geochemical testwork, and was measured but not detected in the waste rock seep data. Therefore, beryllium predictions for all storage areas, with the exception of Misery which contains metasedimentary waste, were set to the detection limit of 0.00005 mg/L.
January 23, 2017 14

Sensitivity Analysis
All scenarios:
Storage area closure covers are designed to: Isolate the reactive waste rock types (i.e., metasediments and
kimberlite) in the colder areas of the pile, thereby limiting mass release.
Promote permafrost development within the piles. Cover thickness sensitivity analysis was conducted on the Fox and
Misery WRSAs, and the CKRSA; the Panda/Koala/Beartooth WRSA will not be covered in closure
January 23, 2017 15
High Seepage Low Seepage
1 m 5 m 1 m 5 m
Climate Scenario:
Cover Thickness:

Model Assumptions
Water balance and thermal modeling assumptions apply to WQ Pile homogeneity, except where explicit details are available (e.g., pile
capped with granite). Covers: Placement in 2018; the same scaling and calibration factors
applied to the storage area was also applied to its granite covers Core load release: No load released from the core when the
temperature is below 0°C (-0.2°C in Fox WRSA). Above those temperatures, 5% of the load prior to pile saturation and 10% of the load following pile saturation reports to the toe of the storage area.
Loading rates and seepage scenarios: The loading rates were the same under both the high and low seepage scenarios (conservative).
Nitrate predictions: Decay of nitrate was not accounted for in the model, the long-term predictions for nitrate are likely over-estimated.
January 23, 2017 16

Results
January 23, 2017 17

Panda/Koala/Beartooth WRSA
Sulphate (SO4)
January 23, 2017 18
0
50
100
150
200
250
300
350
400
2014
2016
2018
2020
2022
2024
2027
2029
2031
2033
2035
2038
2040
2042
2044
2046
2049
2051
2053
2055
2057
2059
2062
2064
2066
2068
2070
2073
2075
2077
2079
2081
2084
2086
2088
2090
2092
2095
2097
2099
2101
2103
2105
2108
2110
2112
2114
Sulpha
te (m
g/L)
Low Seepage High SeepageOperations Post ‐ Closure

Panda/Koala/Beartooth WRSA
Chromium (Cr)
January 23, 2017 19

Coarse Kimberlite Rejects Storage Area
Sulphate (SO4)
January 23, 2017 20
0
1000
2000
3000
4000
5000
6000
7000
2014
2015
2016
2017
2018
2019
2020
2021
2022
2023
2024
2025
2026
2027
2028
2029
2030
2031
2032
2033
Sulpha
te (m
g/L)
Low Seepage 1m High Seepage 1m Low Seepage 5m High Seepage 5m
Operations Post ‐ Closure

Coarse Kimberlite Rejects Storage Area
Chromium (Cr)
January 23, 2017 21
0
0.002
0.004
0.006
0.008
0.01
0.012
0.014
2014
2015
2016
2017
2018
2019
2020
2021
2022
2023
2024
2025
2026
2027
2028
2029
2030
2031
2032
2033
Cr (m
g/L)
Low Seepage 1m High Seepage 1m Low Seepage 5m High Seepage 5m
Operations Post ‐ Closure

Molybdenum
Coarse Kimberlite Rejects Storage Area
January 23, 2017 22

Misery WRSA
Sulphate (SO4)
January 23, 2017 23
0
50
100
150
200
250
300
3502014
2015
2016
2017
2018
2019
2020
2021
2022
2023
2024
2025
2026
2027
2028
2029
2030
2031
2032
2033
Sulpha
te (m
g/L)
Low Seepage 1m High Seepage 1m Low Seepage 5m High Seepage 5mOperations Post ‐ Closure

Misery WRSA
Chromium (Cr)
January 23, 2017 24
0
0.0002
0.0004
0.0006
0.0008
0.001
0.0012
0.00142014
2015
2016
2017
2018
2019
2020
2021
2022
2023
2024
2025
2026
2027
2028
2029
2030
2031
2032
2033
Cr (m
g/L)
Low Seepage 1m High Seepage 1m Low Seepage 5m High Seepage 5mOperations Post ‐ Closure

Fox WRSA
January 23, 2017 25
Sulphate (SO4)
0
100
200
300
400
500
60020
1420
1620
1820
2020
2220
2420
2720
2920
3120
3320
3520
3820
4020
4220
4420
4620
4920
5120
5320
5520
5720
5920
6220
6420
6620
6820
7020
7320
7520
7720
7920
8120
84
Sulpha
te (m
g/L)
Low Seepage 1m High Seepage 1m Low Seepage 5m High Seepage 5m

Fox WRSA
January 23, 2017 26
Chromium (Cr)
0
0.002
0.004
0.006
0.008
0.01
0.012
0.014
0.0162014
2016
2018
2020
2022
2024
2027
2029
2031
2033
2035
2038
2040
2042
2044
2046
2049
2051
2053
2055
2057
2059
2062
2064
2066
2068
2070
2073
2075
2077
2079
2081
2084
Cr (m
g/L)
Low Seepage 1m High Seepage 1m Low Seepage 5m High Seepage 5mOperations Post ‐ Closure

Fox WRSA
January 23, 2017 27
Cadmium (Cd)
0
0.00002
0.00004
0.00006
0.00008
0.0001
0.00012
0.000142014
2016
2018
2020
2022
2024
2027
2029
2031
2033
2035
2038
2040
2042
2044
2046
2049
2051
2053
2055
2057
2059
2062
2064
2066
2068
2070
2073
2075
2077
2079
2081
2084
Cd (m
g/L)
Low Seepage 1m High Seepage 1m Low Seepage 5m High Seepage 5m

Conclusions
Predictions are sensitive to placement of the cover, changing flows in response to pile saturation, and development of a frozen core. The relative importance of these factors is different for each storage area.
The 5m cover was more effective at reducing seepage concentrations, but relative effect of cover thickness was different for each storage area and parameter.
Concentrations were higher in the low seepage scenario. During the operations and closure periods, the predicted range of
seepage concentration water quality is generally similar between storage areas with a few exceptions.
In the post-closure period, concentrations of most parameters are highest in seepage from the Panda/Koala/Beartooth WRSA, largely owing to the mass of waste in this WRSA. Exceptions are sulphate, nitrate, molybdenum, and uranium which are highest in seepage from the CKRSA.
January 23, 2017 28

“Insert” then choose “Picture” – select your picture.Right click your picture and “Send to back”.
The business of sustainability
Ekati Diamond MineWaste Rock Storage Area Closure Risk AssessmentWek’eezhii Land and Water Board MeetingJanuary 24, 2017
The business of sustainability
© Copyright 2016 by ERM Worldwide Limited and/or its affiliates (‘ERM’). All Rights Reserved. No part of this work may be reproduced or transmitted in any form or by any means, without prior written permission of ERM.

The business of sustainability
Overview■ Introduction and Context
■ Problem Formulation■ Site Overview■ Contaminants of Potential Concern (COPCs)■ Receptors■ Exposure Pathways■ Conceptual Site Model
■ Exposure Assessment■ Predicted Water Quality■ Calculations
■ Toxicity Assessment■ Aquatic Receptors■ Wildlife Receptors
■ Risk Characterization■ Aquatic Receptors■ Wildlife Receptors

The business of sustainability
Introduction and Context
3
An ecological risk assessment of seepage from Waste Rock Storage Areas (WRSA) during Closure at the Ekati Mine Site was submitted in October 2016
This Closure phase ecological risk assessment built on a similar assessment of Operations phase that was submitted in March 2015
■ The WLWB determined that this framework was appropriate for evaluating risk due to seepage in Closure (September 9, 2015 directive and Reasons for Decision)
The Closure WRSA ecological risk assessment incorporated directives from the Water Board, based on evaluation of the Operations WRSA ecological risk assessment

The business of sustainability
Problem Formulation: Site Overview
4
Four waste rock storage areas:■ Fox■ Misery■ Panda/Koala/Beartooth■ Coarse Kimberlite Rock Storage Area (CKRSA)
■ Primarily concerned with metals, nutrients, and anions (Section 2.1)

The business of sustainability
Fox WRSA Seepage Receiving Water Bodies
• South Fox 2 Lake• Martine Lake• Nema Lake• Nora Lake• Lake C• Pond D• Lake E• One Hump Lake• Three Hump Lake
5

The business of sustainability
Misery WRSA Seepage Receiving Water Bodies• Carrie Pond• Cujo Lake ****Not Assessed• Lac de Gras ****Not Assessed
6

The business of sustainability
Panda Koala Beartooth WRSA Seepage Receiving Water Bodies - Northwest
• Bearclaw Lake• Pelzer Pond
7

The business of sustainability
CKRSA WRSA Seepage Receiving Water Bodies
• Koala Pit Lake****Not Assessed• Long Lake Containment Facility
Cell C ****Not Assessed

The business of sustainability
Problem Formulation: COPC Selection
9
No
Is predicted concentration in receiving environment >
water quality guideline for wildlife or aquatic life? Yes
Is predicted concentration in
receiving environment > background
concentrations? Yes
No
Parameter is not a COPC
Parameter is not a COPC
Parameter is a COPC and is retained for
evaluation
Receiving Environment
Is predicted concentration in seep >
CCME water quality guideline for wildlife? Yes
Is predicted concentration in
receiving environment > background
concentrations? Yes
No
Parameter is not a COPC
Parameter is not a COPC
Parameter is a COPC and is retained for
evaluation
Seep
No

The business of sustainability
Problem Formulation: COPCs
10
Aquatic Life
Wildlife (no COPCs in receiving environment water)COPC in Seepage WRSA
Chromium Fox, Panda/Koala/Beartooth, CKRSAMolybdenum CKRSA
Sulphate CKRSA
COPC in Water Receiving EnvironmentBeryllium South Fox Lake 2; Martine Lake;
Nema Lake; Nora Lake; Lake C; Pond D; Lake E; One Hump Lake; Three Hump Lake; Bearclaw Lake; Pelzer Pond
Cadmium Martine Lake; Nema LakeCopper South Fox 2 Lake; Pond D; Pelzer
Pond

The business of sustainability
Problem Formulation: Receptors
11
Receptor selection was consistent with methodology recommended by Environment Canada for ecological risk assessments
Receptor selection also considered:■ Ecological relevance for the Ekati Diamond Mine area■ Potential for COPC exposure■ Availability of toxicology and life history data■ Conservation relevance■ Social, economic, or cultural relevance
Receptors selected and rationale are detailed in Table 2.2-1

The business of sustainability
Problem Formulation: Exposure Pathways
12
For aquatic life receptors, primary exposure is through the water column in the receiving environment.
For wildlife receptors, primary exposure is through drinking water (seepage or receiving environment)
No bioaccumulative COPCs were identified in the receiving environment therefore food chain (dietary) exposures were not considered, consistent with Board Directive #8 from September 9, 2015 directives and Reasons for Decision

The business of sustainability
Problem Formulation: Conceptual Site Model
13

The business of sustainability14
Seepage quality and quantity was predicted by Golder (2016)■ Report titled “Water Quality Modelling of Seepage from Waste Rock Storage
Areas”■ High Seepage scenarios:
■ Fox WRSA: 1 m granite cover;■ Misery WRSA: 5 m granite cover; and■ Panda Koala WRSA: no cover
Receiving environment water quality was predicted by ERM, using a GoldSim model that incorporated:
■ Watershed model for hydrology (flows)■ Seepage quality and quantity estimates from Golder (2016)■ Flow paths for seepage to receiving environments■ Baseline or existing water quality
Receiving Environment Water Quality Modeling

The business of sustainability
Exposure Assessment: Calculations
15
For aquatic life, predicted concentrations of COPCs in the receiving environment were compared directly to toxicity thresholds for aquatic life
For wildlife, the daily dose of chromium and molybdenum was calculated:
■ DD = daily dose (mg COPC/kg BW day)■ IRW = water ingestion rate (L water/kg BW day)■ AF = absorption factor (unitless, assumed to be 1)■ EPC = exposure point concentration (mg COPC/L water)■ FE = fraction of year exposure (unitless)
For wildlife, predicted concentrations of sulphate in seepage were compared directly to toxicity thresholds for wildlife

The business of sustainability
Toxicity Assessment: Aquatic Receptors
16
Selection of a toxicity threshold considered:■ Data used to derive the CCME water quality guideline;■ Data reported in the US EPA EcoTox database; and■ Primary literature
The lowest effect concentration for sublethal effects in aquatic life were selected as the toxicity benchmark■ Selection considered primary producers, benthic and pelagic
invertebrates, and fish receptors
The business of sustainability
Toxicity Assessment: Wildlife Receptors
17
Selection of a toxicity threshold considered:■ US EPA’s Ecological Soil Screening Level documents;■ Oakridge National Laboratory “Toxicological Benchmarks for Wildlife,
1996 Revision”; and■ Data included in the CCME water quality guidelines and primary
literature for sulphate
Toxicity thresholds were identified for mammalian and avian receptors separately

The business of sustainability
Risk Characterization: Aquatic Receptors
18
Risk to aquatic life receptors was characterized by calculating hazard quotients:
■ HQ = hazard quotient (unitless)■ Cw = concentration of COPC in the receiving environment (mg/L)■ TRV = lowest toxicity threshold for aquatic life (mg/L)
Hazard quotients for all COPCs in all receiving environments were below 1.0; no unacceptable risks were identified for aquatic life
■ HQs based on maximum predicted concentrations ranged from 0.03 to 0.64■ HQs based on median predicted concentrations ranged from 0.02 to 0.52

The business of sustainability
Risk Characterization: Wildlife Receptors
19
Risk to wildlife receptors was characterized by calculating hazard quotients:
■ HQ = hazard quotient (unitless)■ DD = concentration of COPC in seepage (mg COPC/kg BW day or mg/L)■ TRV = toxicity reference value for mammals or birds (mg COPC/kg BW day or mg/L)
HQs for wildlife for chromium and molybdenum were below 1.0; no unacceptable risks were identified for wildlife
HQs for sulphate for wildlife from CKRSA seepage were 1.41 and required additional evaluation to characterize risk

The business of sustainability
Risk Characterization: Sulphate for Wildlife
20
Maximum predicted concentration of sulphate in seepage from the CKRSA is 1,410 mg/L
Highest concentrations predicted to occur in June and July
There is limited scientific evidence to suggest that sulphate can cause adverse effects in wildlife
■ The CCME guideline for livestock watering was derived in 1987 is outdated■ New studies with more robust methodologies suggest that the toxicity
threshold for effects on sublethal endpoints is > 2000 mg/L■ Available data suggests that livestock can acclimate to higher sulphate
concentrations over the long term
Conservative assumptions used in modelling and risk assessment make it likely that the potential for risk to wildlife from sulphate is overestimated