Embed Size (px)
Citation preview
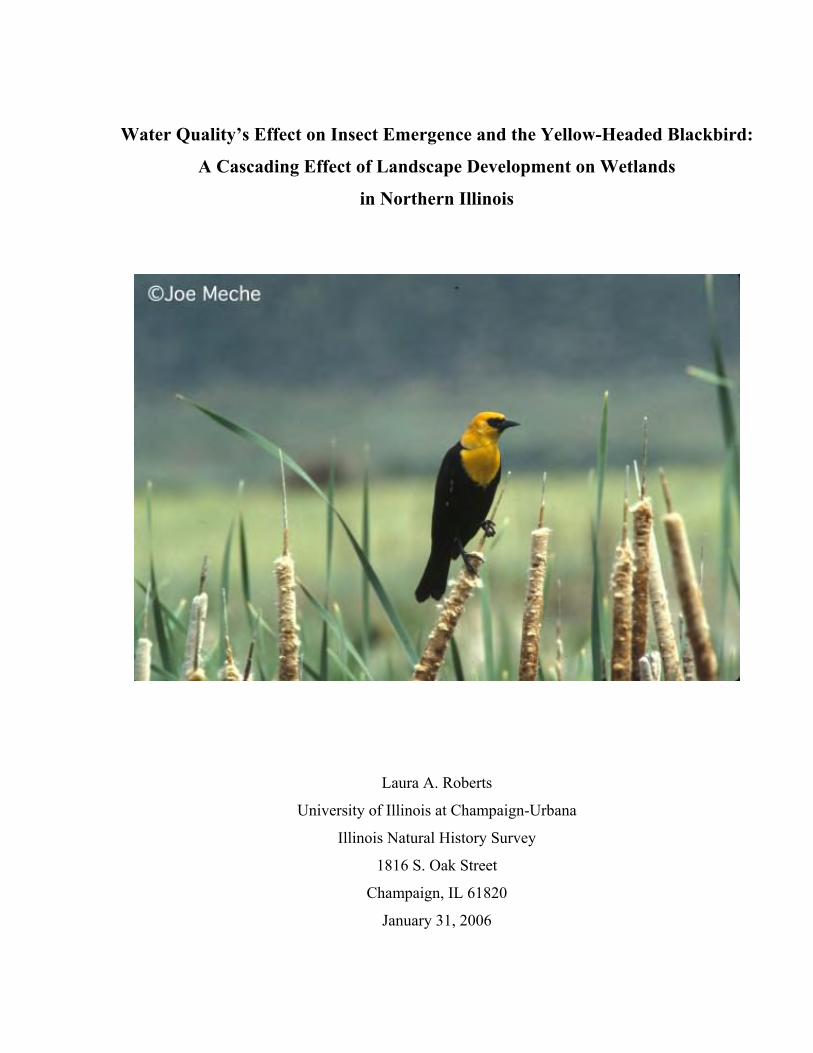
Water Quality’s Effect on Insect Emergence and the Yellow-Headed Blackbird:
A Cascading Effect of Landscape Development on Wetlands
in Northern Illinois
Laura A. Roberts
University of Illinois at Champaign-Urbana
Illinois Natural History Survey
1816 S. Oak Street
Champaign, IL 61820
January 31, 2006
Grant # 05-027W 2
Abstract
Wetlands play an essential role in the breeding ecology of the yellow-headed blackbird
(Xanthocephalus xanthocephalus) in Northeastern Illinois. However, yellow-headed blackbirds are
endangered and their nesting grounds are in need of protection. In this study, I examined water
quality, insect emergence, and surrounding landscape in site quality for nest success. Data were
collected in 2004, a wet year, and 2005, a dry year. The variability in years made it difficult to
determine the driving forces behind site quality; however, the surrounding landscape played a
significant role. Wetlands surrounded by grasslands or agriculture contributed to site quality
because these habitats provide a supplemental food source.
Introduction
Wetlands have high biological productivity and a rich biota making it a valuable aspect of any
landscape (Gibbs, 2000). However, wetlands have a history of loss, especially in Illinois.
Historically, Illinois contained 8.2 million acres of wetlands (Weller, 1994). Currently, there are
1.2 million acres of wetlands left, which accounts for only 3.2 percent of the state, a 90 percent
loss (IDNR, 2001). The driving force behind wetland loss is the economic value of wetlands as
potential land for farming and urban development (Douglas and Johnson, 1994). Holland et al.
(1995) found that the predominant cause of wetland loss in a rapidly urbanizing area was urban
development. In Illinois, most wetlands are being lost to agriculture, but in Northern Illinois
wetlands are being threatened by urban development.
In addition to wetland loss, wetlands are also threatened by degradation, which is detrimental to
the wetland environment and to organisms that rely on wetlands. Some causes of wetland
degradation are fragmentation, siltation, run-off, altered hydrology, and introduction of invasive
species (IDNR, 2001). Degradation leads to a reduction in wetland functions and a decrease in
water quality (USEPA, 1990). The need for good water quality is necessary for a wetland to
maintain many of its primary functions. The importance of water quality to wetlands is reflected in
the Clean Water Act of 1972 and in the water quality standards for wetlands set by the United
States EPA.
Grant # 05-027W 3
Rapid urban development can cause alterations in the natural functions of a wetland that can lead
to changes in the water quality of the wetland (Gosselink and Mitsch, 2000). Some natural
functions of a wetland that could be altered include chemical transformations and nutrient cycling.
These changes in the water quality can impact the fauna utilizing the wetland (e.g., insect
emergence). Urban development can lead to increases in pollution due to run-off from roads and
lawns, which can also affect the water quality of the wetlands. Poor water quality due to pollution
can decrease the amount of insects, such as dragonflies present in a wetland (Watson et al., 1982).
If water quality is altered it can result in low emergence of insects that can strongly influence the
breeding success of wetland bird, such as the yellow-headed blackbird (Xanthocephalus
xanthocephalus).
Yellow-headed blackbird is a polygynous species that relies on wetlands for breeding (Weller,
1999). This species needs high quality habitats in order to have successful breeding. A high quality
site for this species is one that is larger than 1 ha, has a large area of open water, has a water level
greater than 0.7m, and contains emergent vegetation that is strong enough to support nests (Ward,
2005a). The density of prey available for feeding fledglings is an important aspect of a good
nesting ground (Brodmann and Reyer, 1999). Yellow-headed blackbirds feed their young
emerging aquatic insects. According to Voigts (1976), the most productive wetlands for insects are
ones which have large open areas combined with areas of dense emergent vegetation.
In Illinois, the yellow-headed blackbird is an endangered species (Heidorn et al., 1991) because of
reduced immigration and small populations (Ward, 2005a). This species is currently restricted to
Cook, DuPage, McHenry, and Lake Counties of Illinois, an area experiencing rapid urban
development which threatens many wetland habitats. It is important to maintain the current
population of this species by preserving healthy wetlands because few new immigrants come to
Illinois but the current breeding population is very successful (Ward, 2005a). Since insect
emergence is important to breeding success and will influence whether or not the birds will return
to the area to nest again (Greenwood and Harvey, 1982), it is important to understand how insect
emergence is affected by changes in water quality.
Grant # 05-027W 4
In the case of the yellow-headed blackbird, Odonata is the primary insect order preferred as a food
source for the young (Orians and Wittenberger 1991). Food availability is directly correlated with
nest production (Ward, 2005b). Therefore, the availability of Odonata plays a significant role in
nest success. In addition to being a primary food source of yellow-headed blackbirds, Odonates
contribute to the biodiversity of wetlands by being both a predator and a prey for many organisms
(Hornung and Rice, 2003). Due to their role in many trophic interactions occurring in wetlands
Odonates are sensitive to wetland degradation (Stewart and Samways, 1998), making this group a
good bio-indicator of wetland health.
The main goal of this study was to examine how landscape use, water quality, insect emergence,
and nest production in the yellow-headed blackbird relate and how they contribute to the decline of
the yellow-headed blackbird in Illinois.
Methods
The 13 study sites are located in Cook, McHenry, Lake, and DuPage counties (Fig. 1). All of these
counties are within the breeding population of the yellow-headed blackbird. The study sites have
been placed into four different groups based on yellow-headed blackbird nest productivity for both
years. Each year the sites were ranked based on nest productivity. The rankings for both years
were used to create the groupings. Sites ranked 1 or 2 were high quality, sites ranked 3 thru 5 were
medium quality, sites ranked 7 thru 8 were low quality, and sites where nesting did not occur were
listed as none.
Grant # 05-027W 5
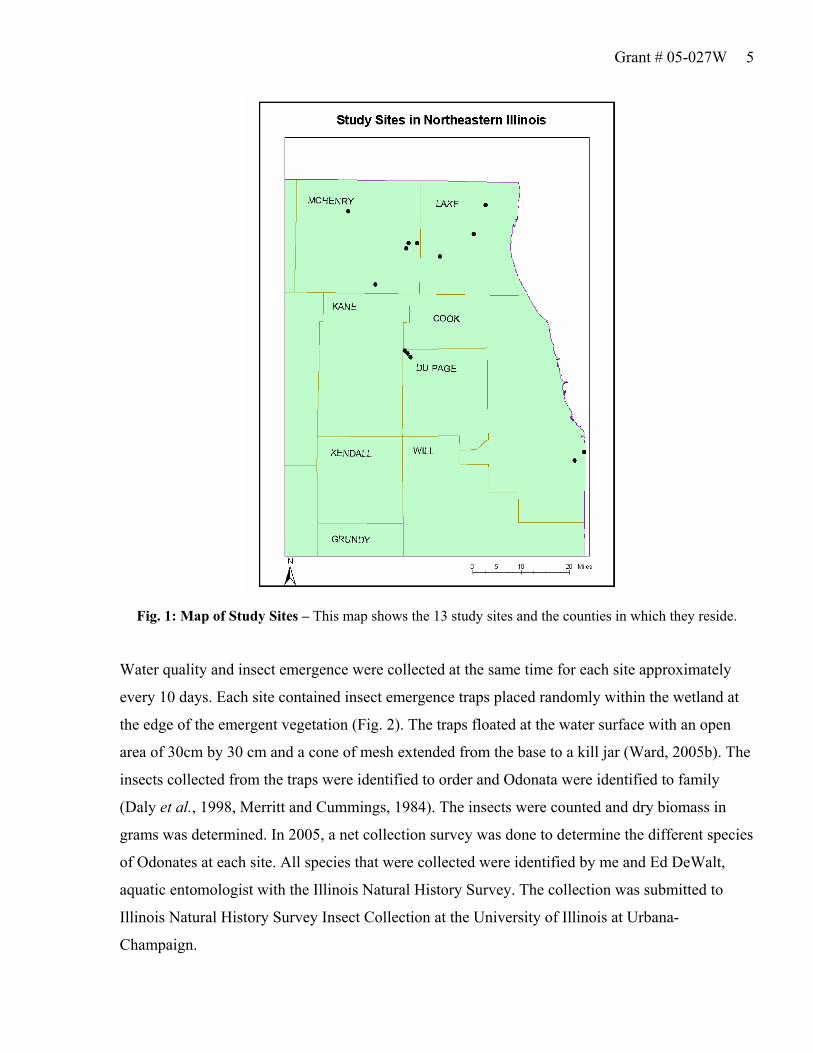
Fig. 1: Map of Study Sites – This map shows the 13 study sites and the counties in which they reside.
Water quality and insect emergence were collected at the same time for each site approximately
every 10 days. Each site contained insect emergence traps placed randomly within the wetland at
the edge of the emergent vegetation (Fig. 2). The traps floated at the water surface with an open
area of 30cm by 30 cm and a cone of mesh extended from the base to a kill jar (Ward, 2005b). The
insects collected from the traps were identified to order and Odonata were identified to family
(Daly et al., 1998, Merritt and Cummings, 1984). The insects were counted and dry biomass in
grams was determined. In 2005, a net collection survey was done to determine the different species
of Odonates at each site. All species that were collected were identified by me and Ed DeWalt,
aquatic entomologist with the Illinois Natural History Survey. The collection was submitted to
Illinois Natural History Survey Insect Collection at the University of Illinois at Urbana-
Champaign.

Grant # 05-027W 6
Fig. 2: Insect Emergence Trap – An example of an
insect emergence trap used during this study. This
trap was located at Wadsworth and the picture was
taken in 2005 after the wetland had dried out.
The following variables were tested to evaluate water quality: pH, temperature, dissolved oxygen,
conductivity, total suspended solids, alkalinity, hardness, chlorophyll a, nitrate, ammonia, and total
phosphate. Dissolved oxygen, pH, and temperature were measured in situ and at three different
levels; the surface, the middle, and the bottom of the water column using handheld meters. A
250mL water bottle was used to collect water to analyze the remaining variables at a later time
(Fig. 3).
Fig. 3:
Collecting a
Water Sample
– Cassandra
Allsup collects
water for later
analysis at
Broberg marsh
in 2004.
Grant # 05-027W 7
Conductivity was determined using a conductivity meter. Total suspended solids were determined
by filtering approximately 100 mL of water onto a pre-weighed and dried glass microfiber filter,
type 934-AH. The filtered sample was then dried at 103°C for one hour and weighed. Alkalinity
and hardness were determined by titration of sulfuric acid for alkalinity and EDTA titrant for
hardness. Chlorophyll a was determined by a color spectrophotometer (Marker and Jinks, 1982).
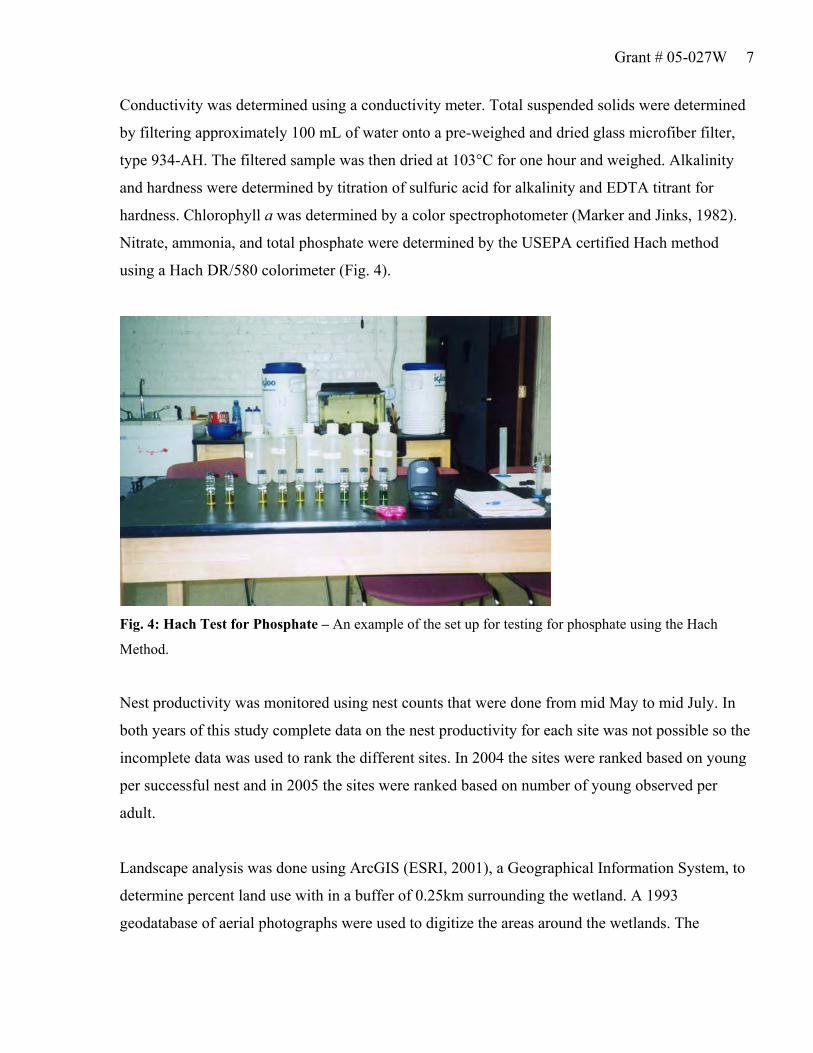
Nitrate, ammonia, and total phosphate were determined by the USEPA certified Hach method
using a Hach DR/580 colorimeter (Fig. 4).
Fig. 4: Hach Test for Phosphate – An example of the set up for testing for phosphate using the Hach
Method.
Nest productivity was monitored using nest counts that were done from mid May to mid July. In
both years of this study complete data on the nest productivity for each site was not possible so the
incomplete data was used to rank the different sites. In 2004 the sites were ranked based on young
per successful nest and in 2005 the sites were ranked based on number of young observed per
adult.
Landscape analysis was done using ArcGIS (ESRI, 2001), a Geographical Information System, to
determine percent land use with in a buffer of 0.25km surrounding the wetland. A 1993
geodatabase of aerial photographs were used to digitize the areas around the wetlands. The
Grant # 05-027W 8
digitized areas were placed into seven categories as a percentage of the total area. The 7 categories
are open water, forest, meadow, agriculture, developed, roads, and wetlands. Once each year a
vegetation survey was conducted to identify the dominant flora for each wetland.
Statistical analysis was not conducted on the data presented here. However, further analysis of the
data is currently being undertaken.
Results
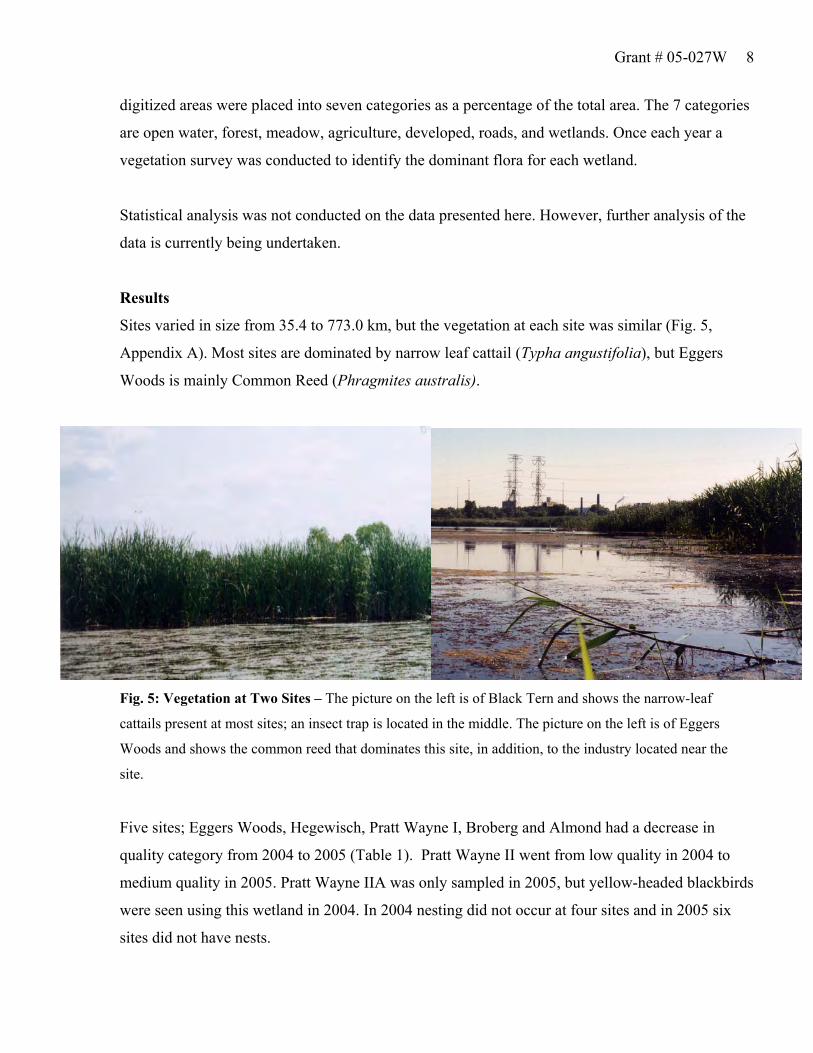
Sites varied in size from 35.4 to 773.0 km, but the vegetation at each site was similar (Fig. 5,
Appendix A). Most sites are dominated by narrow leaf cattail (Typha angustifolia), but Eggers
Woods is mainly Common Reed (Phragmites australis).
Fig. 5: Vegetation at Two Sites – The picture on the left is of Black Tern and shows the narrow-leaf
cattails present at most sites; an insect trap is located in the middle. The picture on the left is of Eggers
Woods and shows the common reed that dominates this site, in addition, to the industry located near the
site.
Five sites; Eggers Woods, Hegewisch, Pratt Wayne I, Broberg and Almond had a decrease in
quality category from 2004 to 2005 (Table 1). Pratt Wayne II went from low quality in 2004 to
medium quality in 2005. Pratt Wayne IIA was only sampled in 2005, but yellow-headed blackbirds
were seen using this wetland in 2004. In 2004 nesting did not occur at four sites and in 2005 six
sites did not have nests.
Grant # 05-027W 9
Site Year Quality Rank Site Year Quality RankEggers Woods 2004 High 2 Black Tern 2004 Medium 3 2005 Medium 4 2005 Medium 5 Hegewisch 2004 Medium 5 Broberg 2004 Medium 4 2005 Low 6 2005 Low 7 Pratt Wayne I 2004 Low 7 Tony 2004 High 1 2005 None 0 2005 High 1 Pratt Wayne II 2004 Low 6 Almond 2004 Low 8 2005 Medium 3 2005 None 0 Pratt Wayne IIA 2005 High 2 Wadsworth 2004 None 0 Black Crown 2004 None 0 2005 None 0 2005 None 0 Exner 2004 None 0 Stickney Run 2004 None 0 2005 None 0 2005 None 0 Table 1: Site Quality – The chart shows the nest productivity rankings and quality for each site and year.
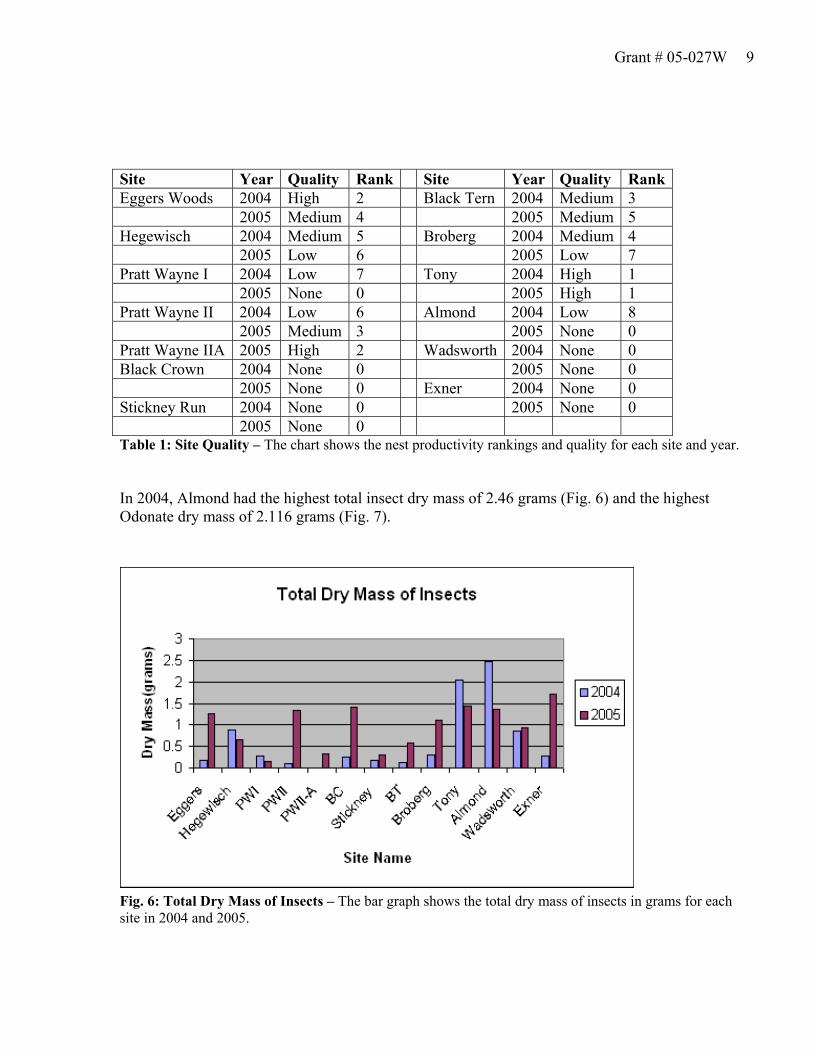
In 2004, Almond had the highest total insect dry mass of 2.46 grams (Fig. 6) and the highest Odonate dry mass of 2.116 grams (Fig. 7). Fig. 6: Total Dry Mass of Insects – The bar graph shows the total dry mass of insects in grams for each site in 2004 and 2005.

Grant # 05-027W 10
Fig. 7: Total Dry Mass of Odonates – The bar graph shows the total dry mass of Odonates in grams for each site in 2004 and 2005. In 2005, Exner had the highest total insect dry mass of 1.179 grams and Eggers Woods had the
highest Odonate dry mass of 0.89 grams. Damselflies were the dominant Odonate type collected
from the insect emergence traps (Table 2) and species of the Family Coenagrionidae were the
dominant damselfly (Table 3).
Table 2: Total Number of Damselflies and Dragonflies – The table shows the distribution of Odonates into damselflies and dragonflies for each site in 2004 and 2005.
Site Damselfly 2004 2005 Dragonfly 2004 2005Eggers Woods 1 35 0 17Hegewisch 44 32 8 0Pratt Wayne I 9 0 0 0Pratt Wayne II 4 77 0 0Pratt Wayne IIA - 24 - 0Black Crown 15 176 0 0Stickney Run 9 7 0 0Black Tern 4 8 2 1Broberg 11 18 5 0Tony’s Pond 55 115 10 0Almond 145 83 7 3Wadsworth 25 18 0 1Exner 4 29 0 0
Grant # 05-027W 11
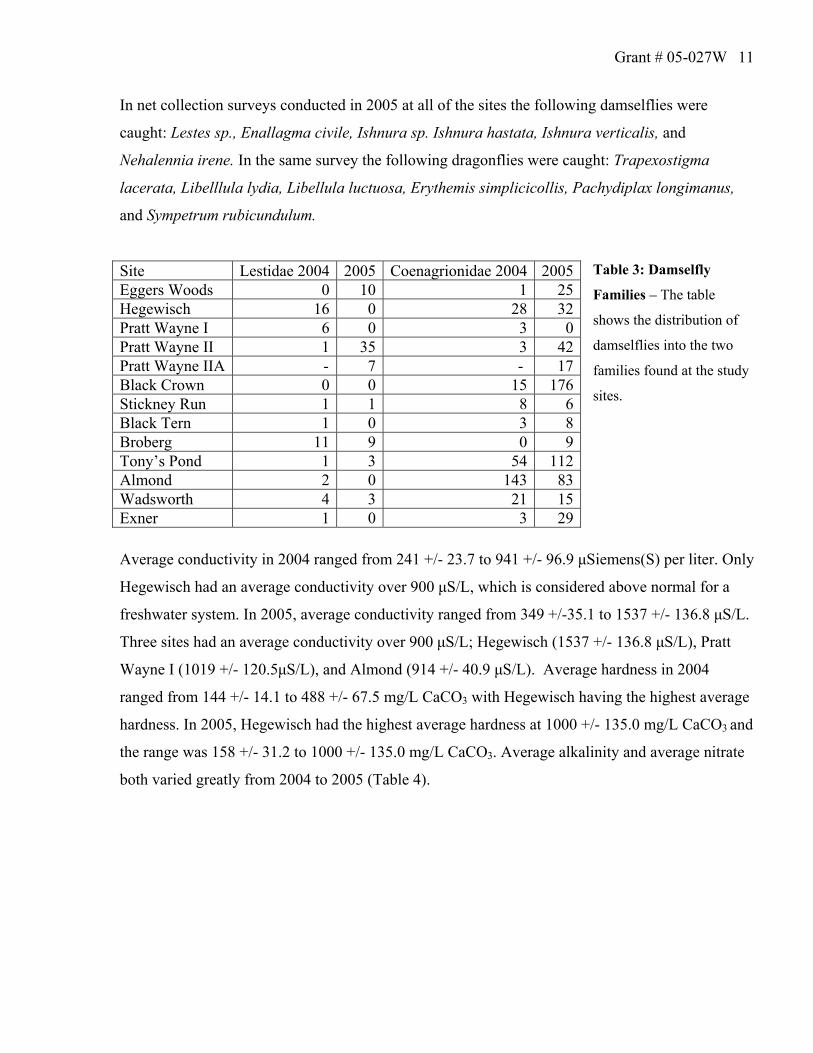
In net collection surveys conducted in 2005 at all of the sites the following damselflies were
caught: Lestes sp., Enallagma civile, Ishnura sp. Ishnura hastata, Ishnura verticalis, and
Nehalennia irene. In the same survey the following dragonflies were caught: Trapexostigma
lacerata, Libelllula lydia, Libellula luctuosa, Erythemis simplicicollis, Pachydiplax longimanus,
and Sympetrum rubicundulum.
Table 3: Damselfly
Families – The table
shows the distribution of
damselflies into the two
families found at the study
sites.
Site Lestidae 2004 2005 Coenagrionidae 2004 2005 Eggers Woods 0 10 1 25 Hegewisch 16 0 28 32 Pratt Wayne I 6 0 3 0 Pratt Wayne II 1 35 3 42 Pratt Wayne IIA - 7 - 17 Black Crown 0 0 15 176 Stickney Run 1 1 8 6 Black Tern 1 0 3 8 Broberg 11 9 0 9 Tony’s Pond 1 3 54 112 Almond 2 0 143 83 Wadsworth 4 3 21 15 Exner 1 0 3 29
Average conductivity in 2004 ranged from 241 +/- 23.7 to 941 +/- 96.9 μSiemens(S) per liter. Only
Hegewisch had an average conductivity over 900 μS/L, which is considered above normal for a
freshwater system. In 2005, average conductivity ranged from 349 +/-35.1 to 1537 +/- 136.8 μS/L.
Three sites had an average conductivity over 900 μS/L; Hegewisch (1537 +/- 136.8 μS/L), Pratt
Wayne I (1019 +/- 120.5μS/L), and Almond (914 +/- 40.9 μS/L). Average hardness in 2004
ranged from 144 +/- 14.1 to 488 +/- 67.5 mg/L CaCO3 with Hegewisch having the highest average
hardness. In 2005, Hegewisch had the highest average hardness at 1000 +/- 135.0 mg/L CaCO3 and
the range was 158 +/- 31.2 to 1000 +/- 135.0 mg/L CaCO3. Average alkalinity and average nitrate
both varied greatly from 2004 to 2005 (Table 4).
Grant # 05-027W 12
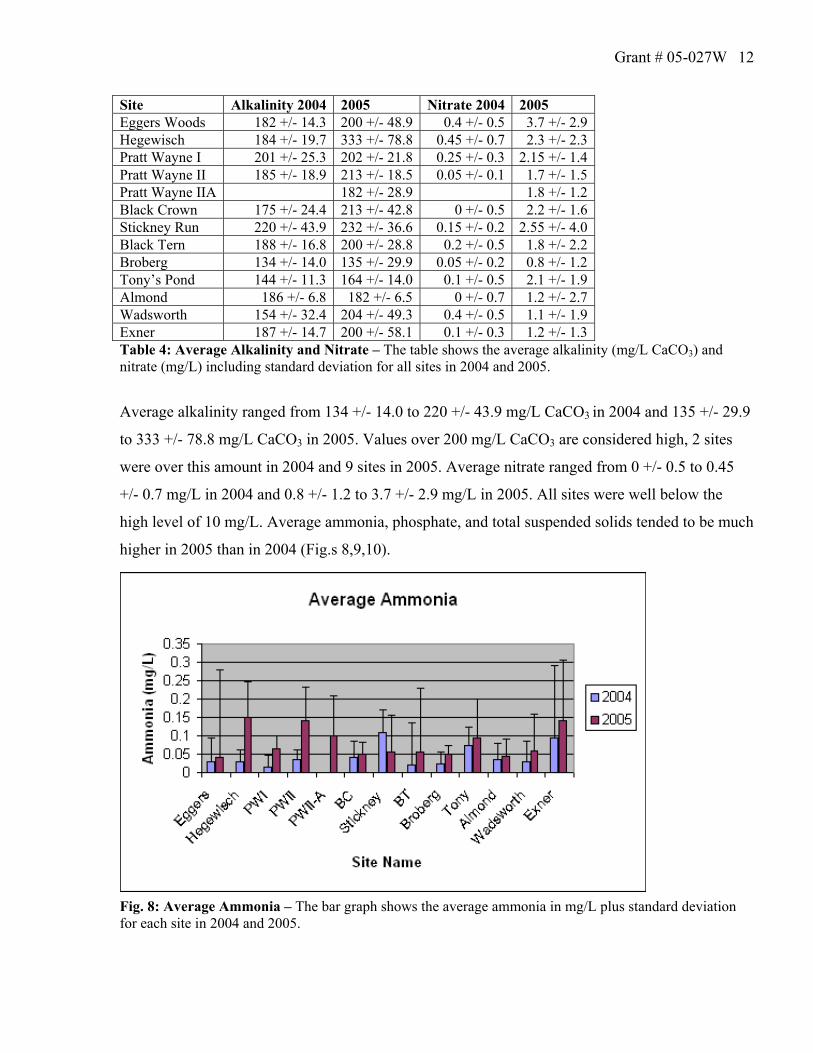
Site Alkalinity 2004 2005 Nitrate 2004 2005 Eggers Woods 182 +/- 14.3 200 +/- 48.9 0.4 +/- 0.5 3.7 +/- 2.9 Hegewisch 184 +/- 19.7 333 +/- 78.8 0.45 +/- 0.7 2.3 +/- 2.3 Pratt Wayne I 201 +/- 25.3 202 +/- 21.8 0.25 +/- 0.3 2.15 +/- 1.4 Pratt Wayne II 185 +/- 18.9 213 +/- 18.5 0.05 +/- 0.1 1.7 +/- 1.5 Pratt Wayne IIA 182 +/- 28.9 1.8 +/- 1.2 Black Crown 175 +/- 24.4 213 +/- 42.8 0 +/- 0.5 2.2 +/- 1.6 Stickney Run 220 +/- 43.9 232 +/- 36.6 0.15 +/- 0.2 2.55 +/- 4.0 Black Tern 188 +/- 16.8 200 +/- 28.8 0.2 +/- 0.5 1.8 +/- 2.2 Broberg 134 +/- 14.0 135 +/- 29.9 0.05 +/- 0.2 0.8 +/- 1.2 Tony’s Pond 144 +/- 11.3 164 +/- 14.0 0.1 +/- 0.5 2.1 +/- 1.9 Almond 186 +/- 6.8 182 +/- 6.5 0 +/- 0.7 1.2 +/- 2.7 Wadsworth 154 +/- 32.4 204 +/- 49.3 0.4 +/- 0.5 1.1 +/- 1.9 Exner 187 +/- 14.7 200 +/- 58.1 0.1 +/- 0.3 1.2 +/- 1.3 Table 4: Average Alkalinity and Nitrate – The table shows the average alkalinity (mg/L CaCO3) and nitrate (mg/L) including standard deviation for all sites in 2004 and 2005.
Average alkalinity ranged from 134 +/- 14.0 to 220 +/- 43.9 mg/L CaCO3 in 2004 and 135 +/- 29.9
to 333 +/- 78.8 mg/L CaCO3 in 2005. Values over 200 mg/L CaCO3 are considered high, 2 sites
were over this amount in 2004 and 9 sites in 2005. Average nitrate ranged from 0 +/- 0.5 to 0.45
+/- 0.7 mg/L in 2004 and 0.8 +/- 1.2 to 3.7 +/- 2.9 mg/L in 2005. All sites were well below the
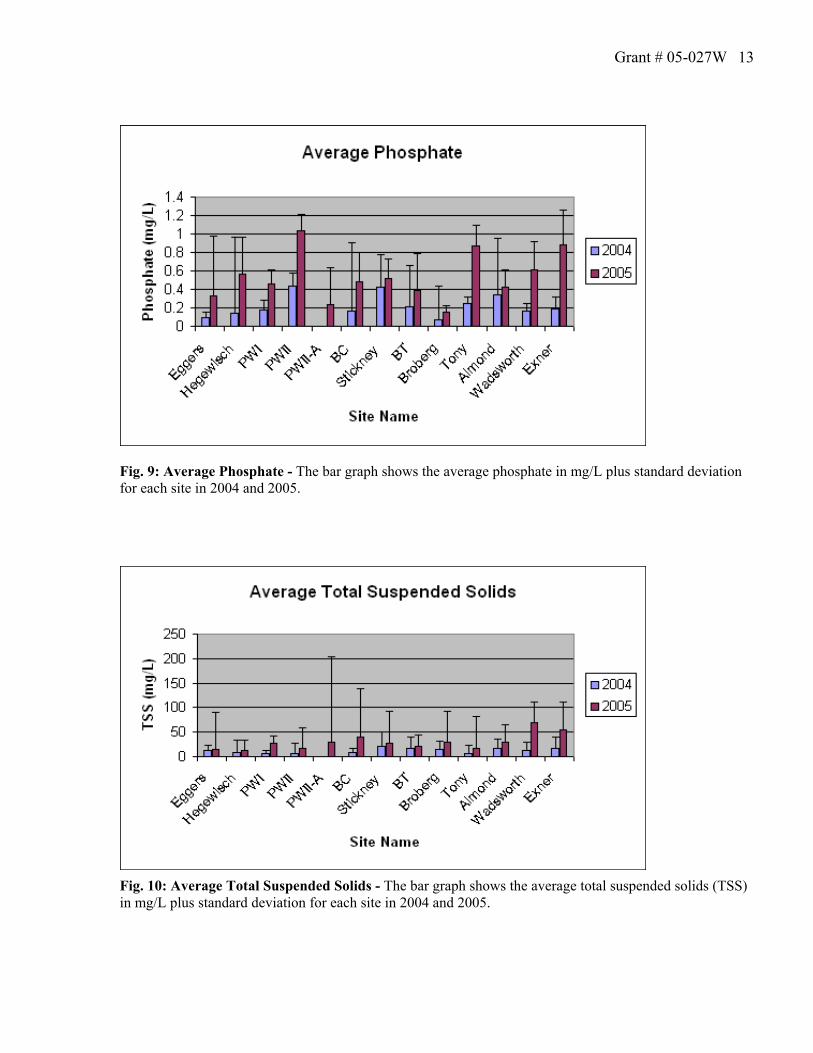
high level of 10 mg/L. Average ammonia, phosphate, and total suspended solids tended to be much
higher in 2005 than in 2004 (Fig.s 8,9,10).
Fig. 8: Average Ammonia – The bar graph shows the average ammonia in mg/L plus standard deviation for each site in 2004 and 2005.
Grant # 05-027W 13
Fig. 9: Average Phosphate - The bar graph shows the average phosphate in mg/L plus standard deviation for each site in 2004 and 2005. Fig. 10: Average Total Suspended Solids - The bar graph shows the average total suspended solids (TSS) in mg/L plus standard deviation for each site in 2004 and 2005.
Grant # 05-027W 14
Chlorophyll a were extremely low for both years (under 1 μg/L), but in 2005 two sites had
chlorophyll a over 1 μg/L. In 2005, Black Crown contained 2.84 +/- 1.5 μg/L of chlorophyll a and
Exner contained 1.53 +/- 1.2 μg/L of chlorophyll a; however, most rivers in Illinois contain over 3
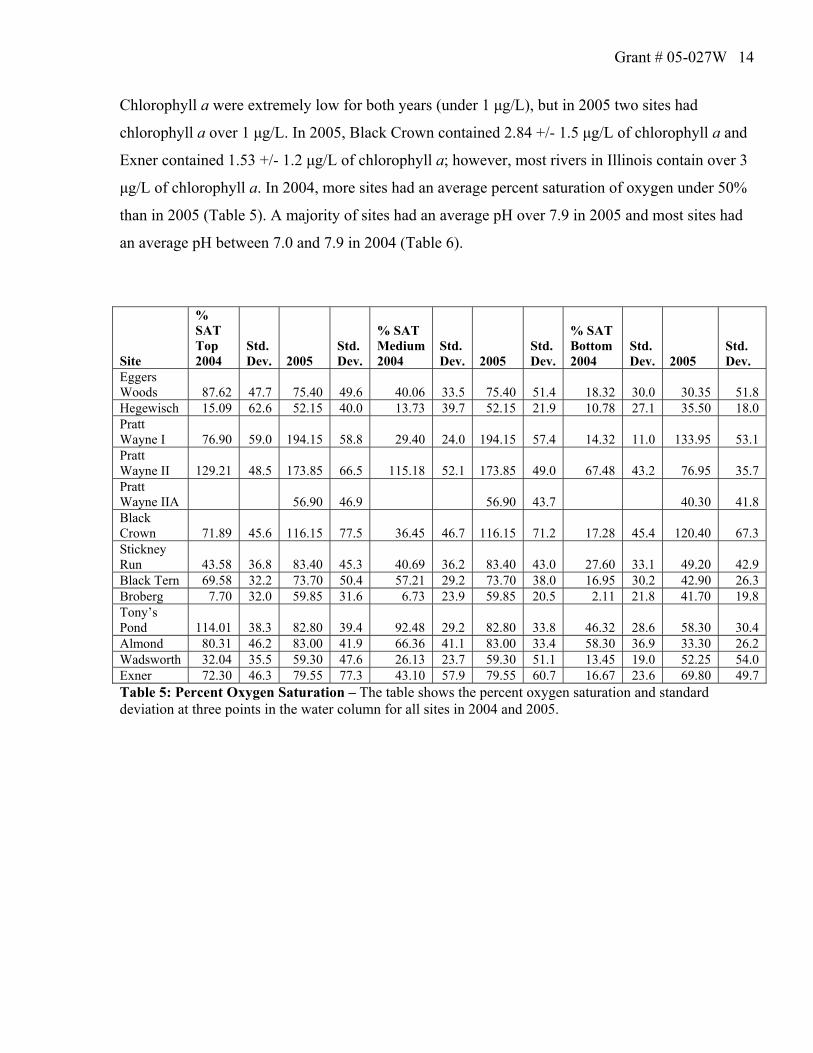
μg/L of chlorophyll a. In 2004, more sites had an average percent saturation of oxygen under 50%
than in 2005 (Table 5). A majority of sites had an average pH over 7.9 in 2005 and most sites had
an average pH between 7.0 and 7.9 in 2004 (Table 6).
Site
% SAT Top 2004
Std. Dev. 2005
Std. Dev.
% SAT Medium 2004
Std. Dev. 2005
Std. Dev.
% SAT Bottom 2004
Std. Dev.
2005
Std. Dev.
Eggers Woods 87.62 47.7 75.40 49.6 40.06 33.5 75.40 51.4 18.32 30.0 30.35 51.8 Hegewisch 15.09 62.6 52.15 40.0 13.73 39.7 52.15 21.9 10.78 27.1 35.50 18.0 Pratt Wayne I 76.90 59.0 194.15 58.8 29.40 24.0 194.15 57.4 14.32 11.0 133.95 53.1 Pratt Wayne II 129.21 48.5 173.85 66.5 115.18 52.1 173.85 49.0 67.48 43.2 76.95 35.7 Pratt Wayne IIA 56.90 46.9 56.90 43.7 40.30 41.8 Black Crown 71.89 45.6 116.15 77.5 36.45 46.7 116.15 71.2 17.28 45.4 120.40 67.3 Stickney Run 43.58 36.8 83.40 45.3 40.69 36.2 83.40 43.0 27.60 33.1 49.20 42.9 Black Tern 69.58 32.2 73.70 50.4 57.21 29.2 73.70 38.0 16.95 30.2 42.90 26.3 Broberg 7.70 32.0 59.85 31.6 6.73 23.9 59.85 20.5 2.11 21.8 41.70 19.8 Tony’s Pond 114.01 38.3 82.80 39.4 92.48 29.2 82.80 33.8 46.32 28.6 58.30 30.4 Almond 80.31 46.2 83.00 41.9 66.36 41.1 83.00 33.4 58.30 36.9 33.30 26.2 Wadsworth 32.04 35.5 59.30 47.6 26.13 23.7 59.30 51.1 13.45 19.0 52.25 54.0 Exner 72.30 46.3 79.55 77.3 43.10 57.9 79.55 60.7 16.67 23.6 69.80 49.7 Table 5: Percent Oxygen Saturation – The table shows the percent oxygen saturation and standard deviation at three points in the water column for all sites in 2004 and 2005.

Grant # 05-027W 15
Site pH Top 2004
Std. Dev.
2005 Std. Dev.
pH Medium 2004
Std. Dev.
2005 Std. Dev.
pH Top 2004
Std. Dev.
2005 Std. Dev.
Eggers Woods 7.65 0.6 7.45 0.7 7.6 0.4 7.5 0.8 7.2 0.3 7.2 0.7Hegewisch 7.35 3.4 7.7 0.5 7.25 2.5 7.65 0.3 7.2 2.0 7.6 0.3Pratt Wayne I 7.6 2.2 9 0.7 7.45 1.9 8.75 0.6 7.35 2.0 7.9 0.8Pratt Wayne II 9.8 2.1 9.85 0.8 9.5 1.8 9.4 0.7 9.45 1.8 8.9 0.7Pratt Wayne IIA 7.4 0.6 7.4 0.4 7.25 0.4Black Crown 7.9 3.8 8.65 0.7 7.7 3.4 8.7 0.6 7.55 2.9 8.4 0.6Stickney Run 7.4 1.7 7.6 0.3 7.3 1.5 7.5 0.3 7.2 1.5 7.5 0.3Black Tern 7.2 2.9 8.1 0.6 7.05 2.7 8.05 0.4 6.9 2.4 7.7 0.3Broberg 7 4.1 7.65 0.2 7 3.7 7.5 0.2 6.8 3.6 7.45 0.2Tony’s Pond 9.2 2.7 9.3 0.6 9.2 2.1 9.3 0.6 8.9 1.7 9.1 0.8Almond 8.2 1.7 7.9 0.5 8.1 1.5 7.5 0.4 8.1 1.6 7.3 0.5Wadsworth 7.5 2.6 8 0.6 7.4 2.1 7.85 0.7 7.1 2.3 7.55 0.8Exner 7.6 2.0 8.15 0.7 7.5 1.9 8.4 0.5 7.3 1.7 7.8 0.7Table 6: Water Column pH - The table shows the pH and standard deviation at three points in the water column for all sites in 2004 and 2005.
Stickney Run has the greatest percent wetland area among the thirteen study sites (Table 7).
Hegewisch has the greatest percent forest and open water areas and Pratt Wayne I has the greatest
percent meadow and barren area. Black Tern has the greatest area of open water, Tony’s Pond has
the greatest area of agricultural land, and Wadsworth has the greatest area of road.

Grant # 05-027W 16
Site Name Wetland Open Water Forest Meadow Agriculture Developed Road Barren
Eggers Woods 4.58 2.38 22.29 54.47 0.00 11.62 4.66 0.00Hegewisch 6.06 9.04 27.31 11.62 0.00 41.12 4.85 0.00Pratt Wayne I 14.61 7.03 11.81 184.44 46.08 1.97 0.00 18.13Pratt Wayne II 13.46 0.82 3.66 11.15 66.78 3.12 0.00 1.03Pratt Wayne IIA 8.84 0.45 0.00 54.45 33.08 0.00 2.09 1.09Black Crown 12.37 14.50 5.47 26.83 15.34 15.82 0.77 8.89Stickney Run 27.34 1.45 13.06 34.09 6.52 9.92 0.00 7.62Black Tern 20.69 16.66 1.07 48.96 0.61 12.01 0.00 0.00Broberg 15.45 7.25 5.52 10.05 32.23 24.36 3.66 1.48Tony's Pond 2.80 1.39 0.00 9.56 71.28 7.00 1.56 6.41Almond 21.40 1.10 14.65 31.58 12.83 16.75 1.69 0.00Wadsworth 14.29 10.48 27.03 27.59 4.63 7.89 7.62 0.48Exner 22.05 3.71 2.53 17.65 10.97 39.33 3.40 0.37Table 7: Percent Landcover – The table shows the percent landcovers for all of the study sites.
Discussion
The data show a lot of variability from one year to the next, especially in the water quality of the
sites. This is most likely due to the differences in precipitation for each year; 12.7 inches in 2004
and 4.7 inches in 2005 at Chicago O’Hare Airport (Illinois State Water Survey, 2006). All of the
study sites had lower water levels in 2005 with most sites having no water present by the end of
July (Fig.11). The dramatic difference in precipitation and therefore water levels at each site
influenced the water quality, insect emergence, and nest success.

Grant # 05-027W 17
Fig. 11: Broberg Marsh in 2005
– The picture shows Brenda
Molano-Flores trying to walk
through the knee deep mud at
Broberg marsh in July of 2005.
The lack of precipitation seems to explain the yearly differences seen in site quality. For example,
Pratt Wayne I was nearly dry by mid-May in 2005 and many of the yellow-headed blackbirds that
used the site in 2004 were seen prospecting at the other two Pratt Wayne sites at the end of the
breeding season in 2004. Tony’s Pond was a high quality site for both years and had standing
water throughout 2005. The success of this site can be explained by the extra food source available
to the breeding birds. Tony’s Pond is located on an animal farm, making hay and grain available
for scavenging. Yellow-headed blackbirds will use nearby grasslands as supplementary feeding
grounds; therefore, the conditions at Tony’s Pond make it that much easier for nests to succeed
(Orians, 1966).
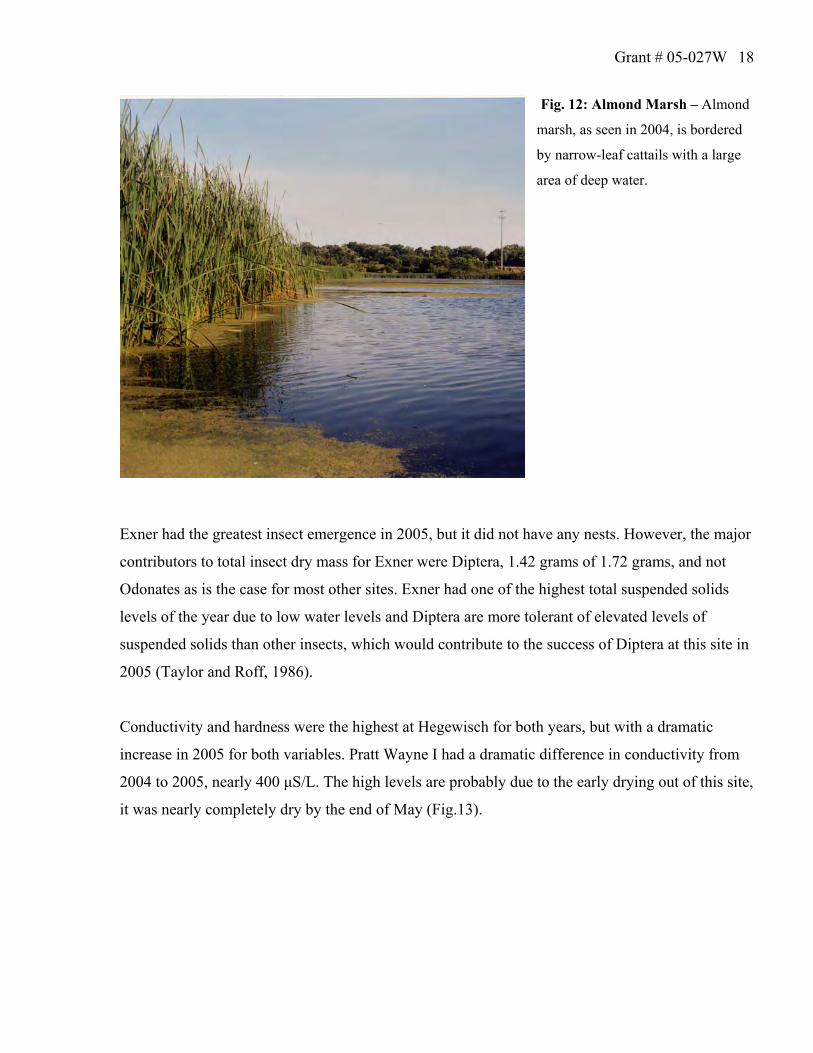
Although, Almond had the greatest insect emergence in 2004 nest success was low (Fig. 12). This
may reflect variability in yearly insect availability. Insect emergence in 2005 was considerably
lower and this site did not have a drastic change in water level because it is a deep water site, also
water quality was with in moderate levels. Therefore, factors beside water quality and precipitation
are influencing insect availability at Almond.
Grant # 05-027W 18
Fig. 12: Almond Marsh – Almond
marsh, as seen in 2004, is bordered
by narrow-leaf cattails with a large
area of deep water.
Exner had the greatest insect emergence in 2005, but it did not have any nests. However, the major
contributors to total insect dry mass for Exner were Diptera, 1.42 grams of 1.72 grams, and not
Odonates as is the case for most other sites. Exner had one of the highest total suspended solids
levels of the year due to low water levels and Diptera are more tolerant of elevated levels of
suspended solids than other insects, which would contribute to the success of Diptera at this site in
2005 (Taylor and Roff, 1986).
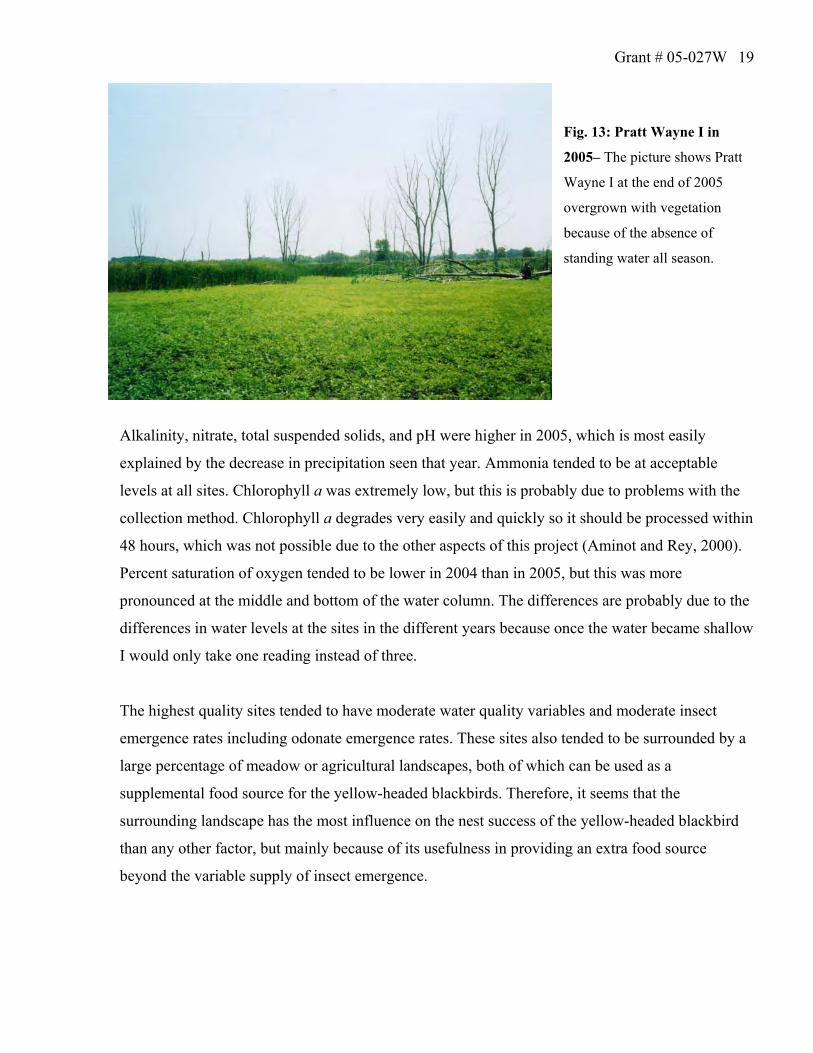
Conductivity and hardness were the highest at Hegewisch for both years, but with a dramatic
increase in 2005 for both variables. Pratt Wayne I had a dramatic difference in conductivity from
2004 to 2005, nearly 400 μS/L. The high levels are probably due to the early drying out of this site,
it was nearly completely dry by the end of May (Fig.13).
Grant # 05-027W 19
Fig. 13: Pratt Wayne I in
2005– The picture shows Pratt
Wayne I at the end of 2005
overgrown with vegetation
because of the absence of
standing water all season.
Alkalinity, nitrate, total suspended solids, and pH were higher in 2005, which is most easily
explained by the decrease in precipitation seen that year. Ammonia tended to be at acceptable
levels at all sites. Chlorophyll a was extremely low, but this is probably due to problems with the
collection method. Chlorophyll a degrades very easily and quickly so it should be processed within
48 hours, which was not possible due to the other aspects of this project (Aminot and Rey, 2000).
Percent saturation of oxygen tended to be lower in 2004 than in 2005, but this was more
pronounced at the middle and bottom of the water column. The differences are probably due to the
differences in water levels at the sites in the different years because once the water became shallow
I would only take one reading instead of three.
The highest quality sites tended to have moderate water quality variables and moderate insect
emergence rates including odonate emergence rates. These sites also tended to be surrounded by a
large percentage of meadow or agricultural landscapes, both of which can be used as a
supplemental food source for the yellow-headed blackbirds. Therefore, it seems that the
surrounding landscape has the most influence on the nest success of the yellow-headed blackbird
than any other factor, but mainly because of its usefulness in providing an extra food source
beyond the variable supply of insect emergence.
Grant # 05-027W 20
This study was conducted during two years of extremes, so no definite conclusions can be made.
Further research should be done to determine the complete role of the extreme weather conditions
in the water quality and insect emergence. Based on the data that were gathered the following
recommendation can be made, that all wetland sites, in this study and any other wetlands in the
area, should be managed to include more grasslands in the vicinity of each wetland. The added
potential food source could attract more yellow-headed blackbirds to the wetland because this
would make food availability more stable for the breeding season instead of relaying on insect
emergence alone.

Grant # 05-027W 21
References
Aminot, A. and F. Rey. 2000. Standard Procedure for Determination of Chlorophyll a by
Spectroscopic Methods. ICES, Denmark (2000).
Brodmann, P. A. and H. U. Reyer. 1999. Nestling provisioning in water pipit (Anthus spinoletta):
do parents go for specific nutrients or profitable prey? Oecologia 120: 506-514.
Daly, H. V., J. T. Doyen and A. H. Purcell III. 1998. Introduction to Insect Biology and Diversity.
Second edition. Oxford University Press, Oxford, New York, USA.
Douglas, A. J. and R. L. Johnson. 1994. Drainage investment and wetland loss: an analysis of the
national resources inventory data. Journal of Environmental Management. 40: 341-355.
Gibbs, J. P. 2000. Wetland loss and biodiversity conservation. Conservation Biology. 14(1): 314-
317.
Gosselink, J. G. and W. J. Mitsch. 2000. Wetlands. New York: John Wiley & Sons.
Greenwood, P. and P. Harvey. 1982. The natal and breeding dispersal of birds. Annual
Review of Ecology and Systematics. 13:1-21.
Heidorn, R. R., W. D. Glass, D.R. Ludwig, and M.A.R. Cole. 1991. Northeastern Illinois
Wetland Survey for Endangered and Threatened Birds. Illinois Department of
Conservation.
Holland, C. C., J. Honea, S. E. Gwin, and M. E. Kentula. 1995. Wetland degradation and loss in
the rapidly urbanizing area of Portland, Oregon. Wetlands. 15(4): 336-345.
Hornung, J. P. and C.L. Rice. 2003. Odonata and wetland quality in Southern Alberta, Canada: a
preliminary study. Odonatologica. 32: 199-129.
Illinois Department of Natural Resources. 2001. Critical Trends in Illinois Ecosystems.
Springfield, Illinois, USA.
Illinois State Water Survey. 2006. Illinois state climatologist data. www.sws.uiuc.edu. Last
accessed on January 30, 2006.
Grant # 05-027W 22
Marker, A. F. H., and S. Jinks. 1982. The spectophotometric analysis of chlorophyll a and
phaeopigments in acetone, ethanol and methanol. Arch. Hydrobiol. Beih. Ergebn. Limnol.
16: 3-7.
Merritt, R. W. and K. W. Cummings, editors. 1984. Introduction to Aquatic Insects of North
America. Second edition. Kendall/Hunt Publishing Company, Dubuque, Iowa, USA.
Orains, G. H. 1966. Food of nestling yellow-headed blackbirds, Cariboo Parklands, British
Columbia. Condor. 68: 321-337.
Orians, G. H. and J. F. Wittenberger. 1991. Spatial and temporal scales in habitat
selection. The American Naturalist. 137: 29 – 49.
Stewart, D. A. B. and M. J. Samways. 1998. Conserving dragonfly (Odonata) assemblages relative
to river dynamics in an African savanna game reserve. Conservation Biology. 12: 683-692.
Taylor, B. R. and J. C. Roff. 1986. Long-term effects of highway construction on the ecology of a
southern Ontario stream. Environmental Pollution. 40:317-344.
United States Environmental Protection Agency. 1990. Water Quality Standards for Wetlands.
Washington, District of Columbia, USA.
Voigts, D. 1976. Aquatic invertebrate abundance in relation to changing marsh vegetation. The
American Midland Naturalist. 95: 313-322.
Ward, M. P. 2005a. The role of immigration in the decline of an isolated migratory bird
population. Conservation Biology. 19(5): 1528-1536.
_____. 2005b. Habitat selection by dispersing yellow-headed blackbirds: evidence of prospecting
and the use of public information. Oecologia. 145: 650-657.
Watson, J. A. L., A. H. Arthington, and D. L. Conrick. 1982. Effect of sewage effluent on
dragonflies (Odonata) of Bulimba Creek, Brisbane. Australian Journal of Marine
Freshwater Resources. 33: 517-28.
Weller, M. W. 1999. Wetland Birds: Habitat Resources and Conservation Implications. Cambridge
University Press, Cambridge, Massachusetts, USA.
__________. 1994. Freshwater Marshes. University of Minnesota Press, Minneapolis, Minnesota,
USA.
Grant # 05-027W 23
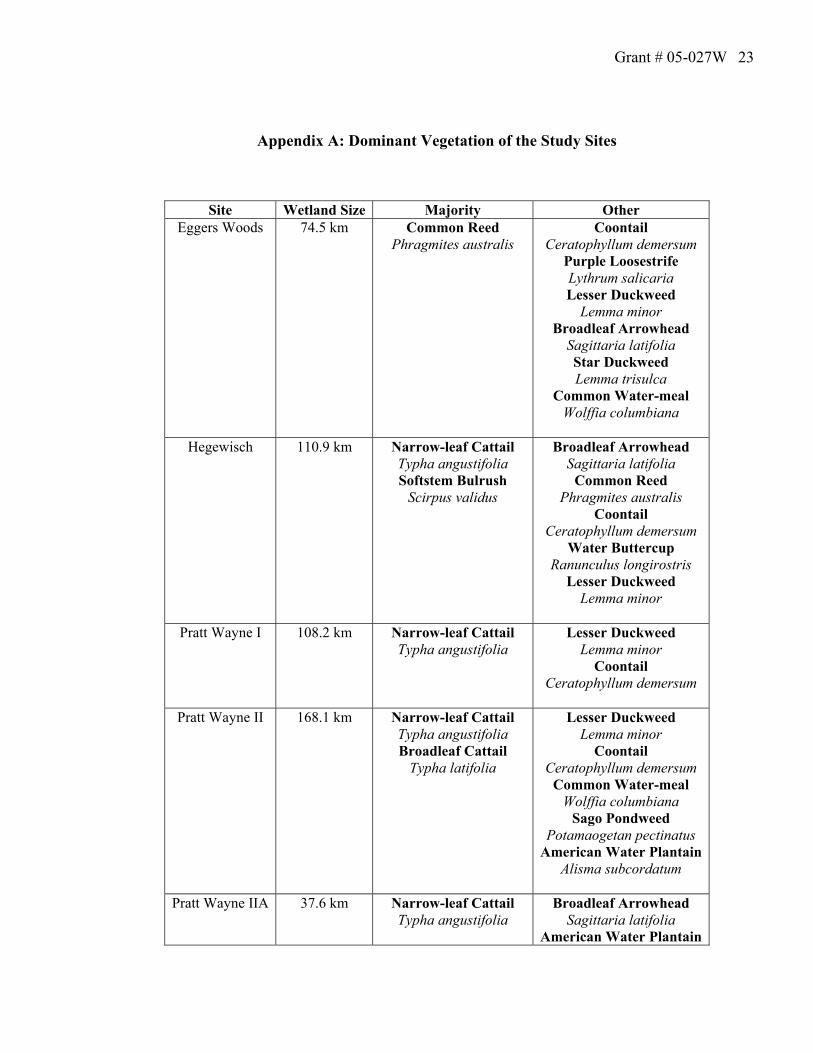
Appendix A: Dominant Vegetation of the Study Sites
Site Wetland Size Majority Other Eggers Woods 74.5 km Common Reed
Phragmites australis
Coontail Ceratophyllum demersum
Purple Loosestrife Lythrum salicaria Lesser Duckweed
Lemma minor Broadleaf Arrowhead
Sagittaria latifolia Star Duckweed Lemma trisulca
Common Water-meal Wolffia columbiana
Hegewisch 110.9 km Narrow-leaf Cattail
Typha angustifolia Softstem Bulrush
Scirpus validus
Broadleaf Arrowhead Sagittaria latifolia
Common Reed Phragmites australis
Coontail Ceratophyllum demersum
Water Buttercup Ranunculus longirostris
Lesser Duckweed Lemma minor
Pratt Wayne I 108.2 km Narrow-leaf Cattail
Typha angustifolia
Lesser Duckweed Lemma minor
Coontail Ceratophyllum demersum
Pratt Wayne II 168.1 km Narrow-leaf Cattail
Typha angustifolia Broadleaf Cattail
Typha latifolia
Lesser Duckweed Lemma minor
Coontail Ceratophyllum demersum
Common Water-meal Wolffia columbiana
Sago Pondweed Potamaogetan pectinatus
American Water PlantainAlisma subcordatum
Pratt Wayne IIA 37.6 km Narrow-leaf Cattail
Typha angustifolia Broadleaf Arrowhead
Sagittaria latifolia American Water Plantain
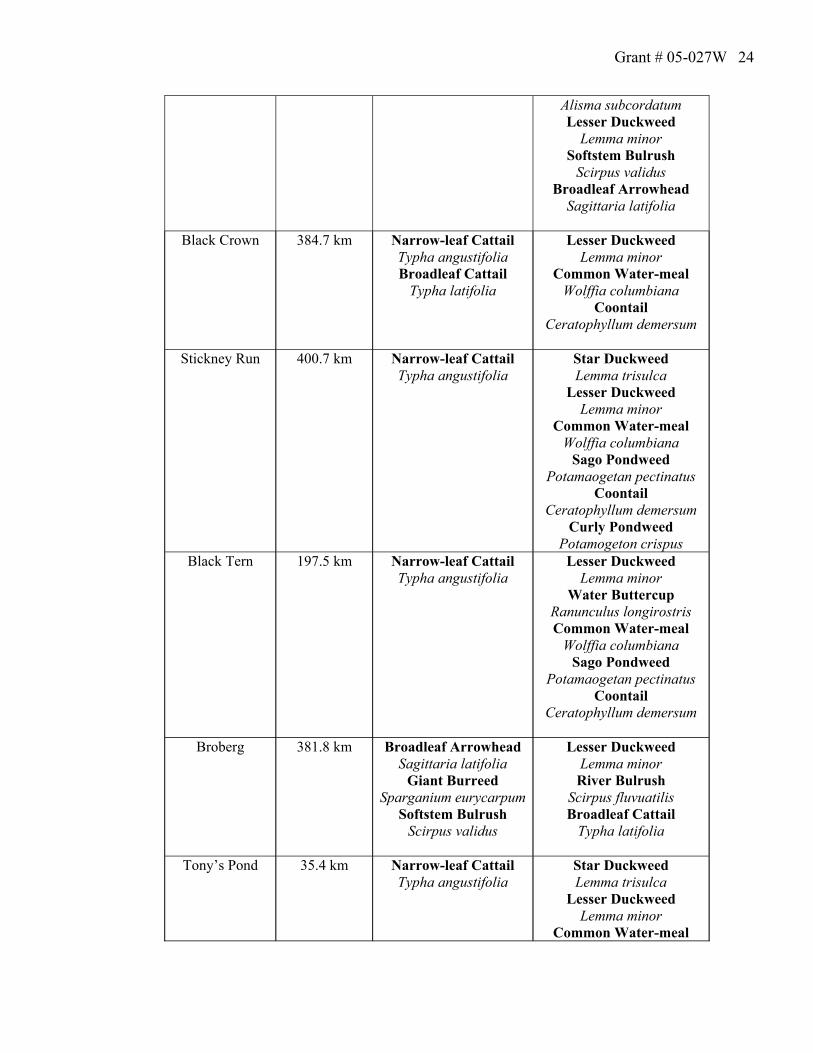
Grant # 05-027W 24
Alisma subcordatum Lesser Duckweed
Lemma minor Softstem Bulrush
Scirpus validus Broadleaf Arrowhead
Sagittaria latifolia
Black Crown 384.7 km Narrow-leaf Cattail Typha angustifolia Broadleaf Cattail
Typha latifolia
Lesser Duckweed Lemma minor
Common Water-meal Wolffia columbiana
Coontail Ceratophyllum demersum
Stickney Run 400.7 km Narrow-leaf Cattail
Typha angustifolia Star Duckweed Lemma trisulca
Lesser Duckweed Lemma minor
Common Water-meal Wolffia columbiana
Sago Pondweed Potamaogetan pectinatus
Coontail Ceratophyllum demersum
Curly Pondweed Potamogeton crispus
Black Tern 197.5 km Narrow-leaf Cattail Typha angustifolia
Lesser Duckweed Lemma minor
Water Buttercup Ranunculus longirostris Common Water-meal
Wolffia columbiana Sago Pondweed
Potamaogetan pectinatus Coontail
Ceratophyllum demersum
Broberg 381.8 km Broadleaf Arrowhead Sagittaria latifolia
Giant Burreed Sparganium eurycarpum
Softstem Bulrush Scirpus validus
Lesser Duckweed Lemma minor
River Bulrush Scirpus fluvuatilis Broadleaf Cattail
Typha latifolia
Tony’s Pond 35.4 km Narrow-leaf Cattail Typha angustifolia
Star Duckweed Lemma trisulca
Lesser Duckweed Lemma minor
Common Water-meal

Grant # 05-027W 25
Wolffia columbiana Sago Pondweed
Potamaogetan pectinatus Coontail
Ceratophyllum demersum
Almond 125.8 km Narrow-leaf Cattail Typha angustifolia
Star Duckweed Lemma trisulca
Lesser Duckweed Lemma minor
Coontail Ceratophyllum demersum
Common Water-meal Wolffia columbiana
Wadsworth 373.9 km Narrow-leaf Cattail
Typha angustifolia White Water Lily Nympaea odorata Star Duckweed Lemma trisulca
Lesser Duckweed Lemma minor
Coontail Ceratophyllum demersum
Common Water-meal Wolffia columbiana
Exner 773.0 km Narrow-leaf Cattail
Typha angustifolia Broadleaf Cattail
Typha latifolia
Lesser Duckweed Lemma minor
Coontail Ceratophyllum demersum
Common Water-meal Wolffia columbiana
Sago Pondweed Potamaogetan pectinatus
Grant # 05-027W 26
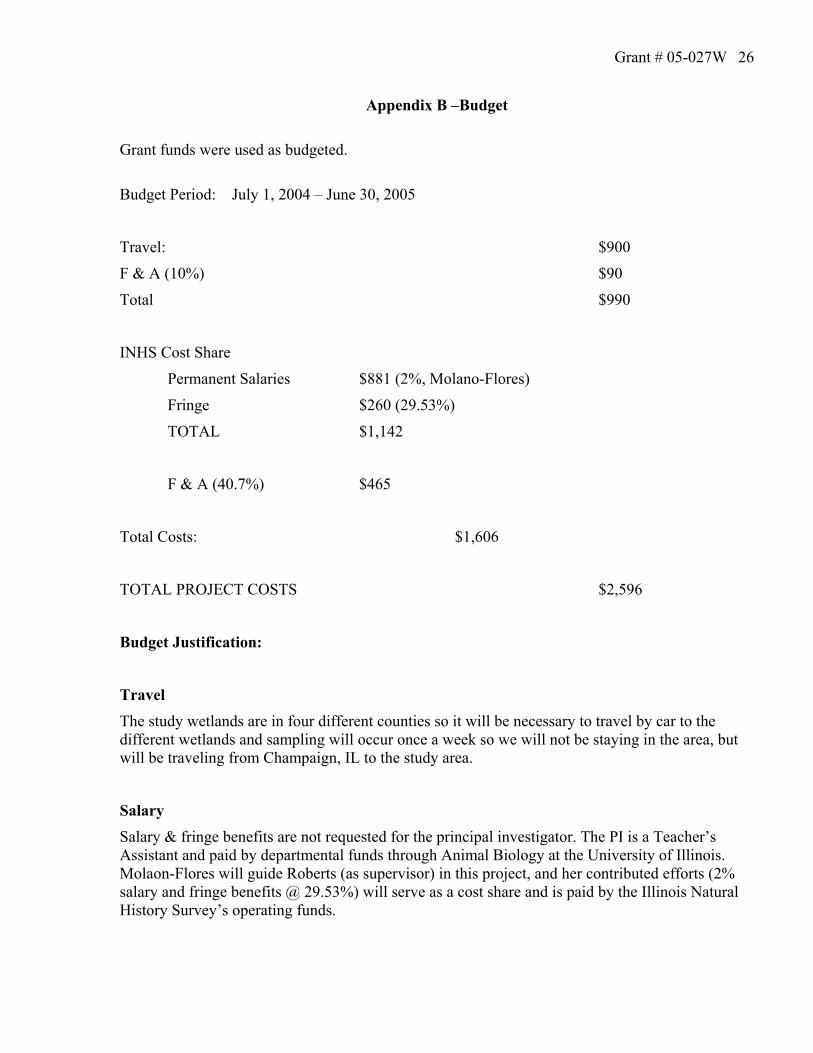
Appendix B –Budget
Grant funds were used as budgeted.
Budget Period: July 1, 2004 – June 30, 2005
Travel: $900
F & A (10%) $90
Total $990
INHS Cost Share
Permanent Salaries $881 (2%, Molano-Flores)
Fringe $260 (29.53%)
TOTAL $1,142
F & A (40.7%) $465
Total Costs: $1,606
TOTAL PROJECT COSTS $2,596
Budget Justification: Travel The study wetlands are in four different counties so it will be necessary to travel by car to the different wetlands and sampling will occur once a week so we will not be staying in the area, but will be traveling from Champaign, IL to the study area.
Salary Salary & fringe benefits are not requested for the principal investigator. The PI is a Teacher’s Assistant and paid by departmental funds through Animal Biology at the University of Illinois. Molaon-Flores will guide Roberts (as supervisor) in this project, and her contributed efforts (2% salary and fringe benefits @ 29.53%) will serve as a cost share and is paid by the Illinois Natural History Survey’s operating funds.
![Bab 1. Sistem Pendukung Manajemendini3asa.staff.gunadarma.ac.id/Downloads/files/66329/MATERI+1+SPM.pdf · 0dqdmhugdq3hqjdpelodq.hsxwxvdq 0hqxuxw 0lqw]ehuj dgd shudq xwdpd pdqdmhu](https://img.dokumen.tips/doc/110x75/5d0c7ecd88c993cc498b5cad/bab-1-sistem-pendukung-1spmpdf-0dqdmhugdq3hqjdpelodqhsxwxvdq-0hqxuxw-0lqwehuj.jpg)


![UHX]EHUJ 7HPSHOKRI - ZLB · PDF file3uhq]odxhu %huj:hgglqj 1hxn¸ooq.uhx]ehuj 0lwwh)ulhgulfkvkdlq 7hpshokri](https://img.dokumen.tips/doc/110x75/5a7052127f8b9aa2538bedd0/uhxehuj-7hpshokri-zlb-pdf-file3uhqodxhu-hujhgglqj-1hxnooquhxehuj.jpg)
![[XLS]s446aec1b0de51350.jimcontent.coms446aec1b0de51350.jimcontent.com/download/version/... · Web viewCQ 0765 RT CQ 0965 RT CQ 1265 RT CQ 1465 RT CQ 1565 RT CVA 2411 ORI CX 065 CX](https://img.dokumen.tips/doc/110x75/5af8be3d7f8b9ae92b8b7689/xls-viewcq-0765-rt-cq-0965-rt-cq-1265-rt-cq-1465-rt-cq-1565-rt-cva-2411-ori-cx.jpg)


![-¯nsâ kw£n]vX cq]w](https://img.dokumen.tips/doc/110x75/62970f6a15433c010d2d9ed6/ns-kwnvx-cqw.jpg)


![· w E j`p itu x]o tUhNligih;mntu[cq](https://img.dokumen.tips/doc/110x75/5e0f1abdf66f71740a3f2c3e/-w-e-jp-itu-xo-tuhnligihmntucq-.jpg)