Embed Size (px)
Citation preview
W-Path
First, let's find out how to identify elementary particles. Next, you can actually work with real ATLAS
data from the Large Hadron Collider (LHC) at CERN. In the process you have to do a bit of detective
work because at a proton-proton collision – a so-called "event" – a lot of particles are generated. The key
task is to search the results for specific elementary particles and to assign them to physical processes. In
doing so you get to know the challenges physicists have to face.
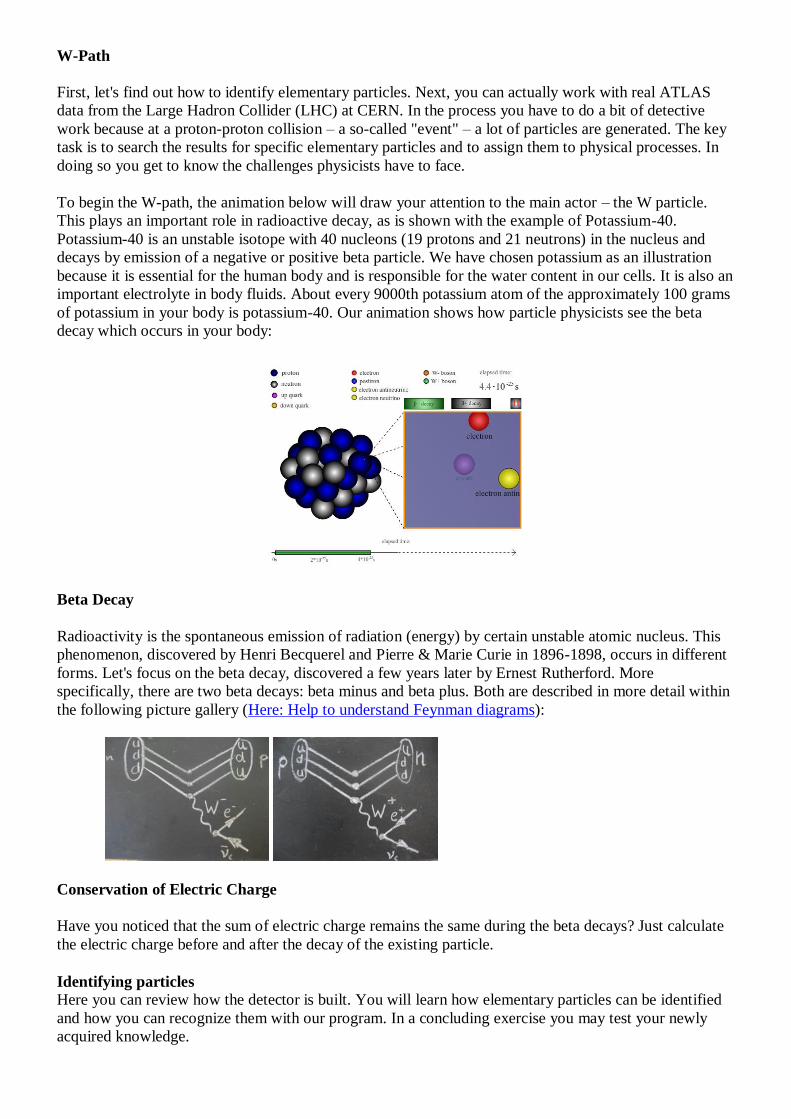
To begin the W-path, the animation below will draw your attention to the main actor – the W particle.
This plays an important role in radioactive decay, as is shown with the example of Potassium-40.
Potassium-40 is an unstable isotope with 40 nucleons (19 protons and 21 neutrons) in the nucleus and
decays by emission of a negative or positive beta particle. We have chosen potassium as an illustration
because it is essential for the human body and is responsible for the water content in our cells. It is also an
important electrolyte in body fluids. About every 9000th potassium atom of the approximately 100 grams
of potassium in your body is potassium-40. Our animation shows how particle physicists see the beta
decay which occurs in your body:
Beta Decay
Radioactivity is the spontaneous emission of radiation (energy) by certain unstable atomic nucleus. This
phenomenon, discovered by Henri Becquerel and Pierre & Marie Curie in 1896-1898, occurs in different
forms. Let's focus on the beta decay, discovered a few years later by Ernest Rutherford. More
specifically, there are two beta decays: beta minus and beta plus. Both are described in more detail within
the following picture gallery (Here: Help to understand Feynman diagrams):
Conservation of Electric Charge
Have you noticed that the sum of electric charge remains the same during the beta decays? Just calculate
the electric charge before and after the decay of the existing particle.
Identifying particles
Here you can review how the detector is built. You will learn how elementary particles can be identified
and how you can recognize them with our program. In a concluding exercise you may test your newly
acquired knowledge.

Time for active playing! Discover the signals left in the detector by elementary particles with the help of
the following interactive animation of ATLAS. Choose the name of a specific particle in the upper menu
and follow its way through the detector. Keep in mind that a dotted line represents the path of a neutral
particle, which is not seen by the detector until it showers in a calorimeter, if at all.
The program that we will use and that is elucidated on the next page illustrates events of proton-proton
collisions in cross-sectional similarly.
If you do not yet understand the structure of the ATLAS detector, you can find more information under
the menu item ATLAS detector.
Structure and Function of the ATLAS Detector
Here, you'll learn the structure of the ATLAS detector and how particles interact with the detector
material in order to be detected at all. You can decide whether you want to learn this with the help of
videos or texts.
Products of proton-proton collisions are detected by the ATLAS detector (ATLAS stands for A Toroidal
LHC ApparatuS). In the middle of ATLAS, two particle bunches (each with 100 billion protons) collide
with each other after they have been accelerated in opposite directions in the LHC. Thereby it is neither
possible to predict which parts of one proton will collide with which parts of another nor which protons
collide at all. In the collisions, scattering (deviation of protons) and collisions may occur. In the latter
case, new particles are formed. From the data, physicists are able to say which physical processes took
place during the collisions. They can only do this when they have understood the detector and its
function. So let's look at those points, now.
ATLAS via Text and Picture
In the following picture gallery, you'll find a short description of the structure and function of each part of
the detector.

The event display MINERVA
The electronic signals that are recorded by the detectors during a collision can be transformed into event
displays. To visualize these, we use the program MINERVA. Before you can work with this program you
should learn which possibilities and functions it has that are important for our analysis.
First, start the program MINERVA (If you are a participant of the International Masterclasses you can
start the program directly from DVD. Otherwise you should firstly download the program here, unzip it
secondly and finally start it.
Anyway, the program should look much like the first picture in the picture gallery. Use the following
gallery to get some insight into the functions of the MINERVA program! Try these settings inside the
program parallel.

Now, find out how you can identify particles with the help of MINERVA.
Identifying particles
To analyse the proton-proton collisions that the program displays, you should know how you can identify
electrons (as well as positrons), muons (and anti-muons), neutrinos, and hadronic particles and jets in the
event display. You will find elucidation of this topic on this page in form as a photo gallery again.

Exercise 1
One can often see tracks of a few different particles in each event. You will be a detective during the first
exercise. Select all electrons, positrons, muons, anti-muons, neutrinos, and jets from an event (pictured in
several event displays). In doing so, assign the described patterns of particles to their names.
You can check your decisions by using the form below one's picture. There you can choose the particle or
object that is displayed inside the event display in your's opinion. After choosing the particle(s) you can
check your decision by clicking on 'Check'. In order to show the correct answer click on 'Correct'. The
'Hint' button will provide a hint.
Answer: antimuon

Identifying Events
In this chapter you learn how to identify events (proton-proton collisions). Thus you can associate event
displays with physical processes.
On the following pages you can find information about the W particle, its production processes during
collisions at the LHC, its detection in events with the event display MINERVA, and a concluding
exercise. Afterwards you are ready for the measurements.
This is how the ATLAS-detector sees proton-proton collisions.
Research at the LHC
The LHC is the biggest and most powerful particle accelerator in the world. It was built to enter unknown
terrain beyond the standard model. The reason is that there are still gaps in that same standard model,
even with its great success in explaining the building blocks and forces of our universe and its strong
experimental confirmation. The experiments at the LHC will provide answers to some open questions like
how particles get their masses or why the universe has more matter than antimatter.
In order to get those answers bunches of protons are shot at bunches of protons. But which objects
interact during a proton-proton-collision? These are the components of the protons (gluons and/or
quarks). You can get the picture of what is going on during a collision from the graphic below:
During the initial phase of LHC operations physicists keep their eyes on every elementary particle of the
standard model. All of them were successfully rediscovered within a few weeks only, e.g. bounded
systems of quarks and antiquarks (Charmonium and Bottonium, originally discovered in 1974 and 1977),
unbounded heavy Top Quarks (first discovered in 1995) and W and Z Bosons (discovered at CERN in
1983). In order to reliably discover new particles in proton-proton collisions, it is necessary to assign
known particles to LHC events unambigously. This not only confirms previous results but also shows
what already-known physics looks like in the new environment of the LHC detectors.

Thus the focus is on particles like the W-boson. Let's elaborate on what this exchange particle of the weak
interaction is telling us about itself and how it appears in the ATLAS detector.
W particle
The exchange particles responsible for the weak interaction are the three carrier particles W+, W
- and Z
0.
W particles are produced in different ways during proton-proton collisions in the LHC. The following
picture gallery introduces them. Feynman diagrams are used for better illustration. Get to know the
diagrams here.
Production of different W particles
Decay of W particles
The W particle is heavy (80,4 GeV/c2) and decays immediately after its production. In two-thirds of its
decays, a quark-antiquark pair is produced, which appears as jets in the detector. In one third of the W-
decays, a lepton and a neutrino are produced. In this case, the leptons could be an electron, a muon, or a
tau with equal probability. Before the tau can be detected in the detector , it decays as well. In our events,
we look only at decays of W particles into electrons (or positrons) or muons (or antimuons). Thus we get
the following Feynman diagrams:

Events with such a signature in the detector as illustrated by the last four diagrams will be seen as a signal
event in our data samples. Each is an unambigious indicator of a W particle which has existed for a very
short time. All other events have to be categorized as background. Let's have a look at possible
background events in this last picture gallery:
Background events
If protons collide not only can W particles be created but, for example, Z0 particles as well. These
particles also decay promptly after production:
With this information we should be able to identify all W events in MINERVA.
Identifying events with MINERVA
Here, you'll learn how the events mentioned before look in the event display MINERVA. You will get to
use your knowledge about identifying elementary particles. You'll learn to choose events with a W
particle as signal events and to distinguish them from the background events. Again, you'll find
explanations about this in the form of a picture gallery.
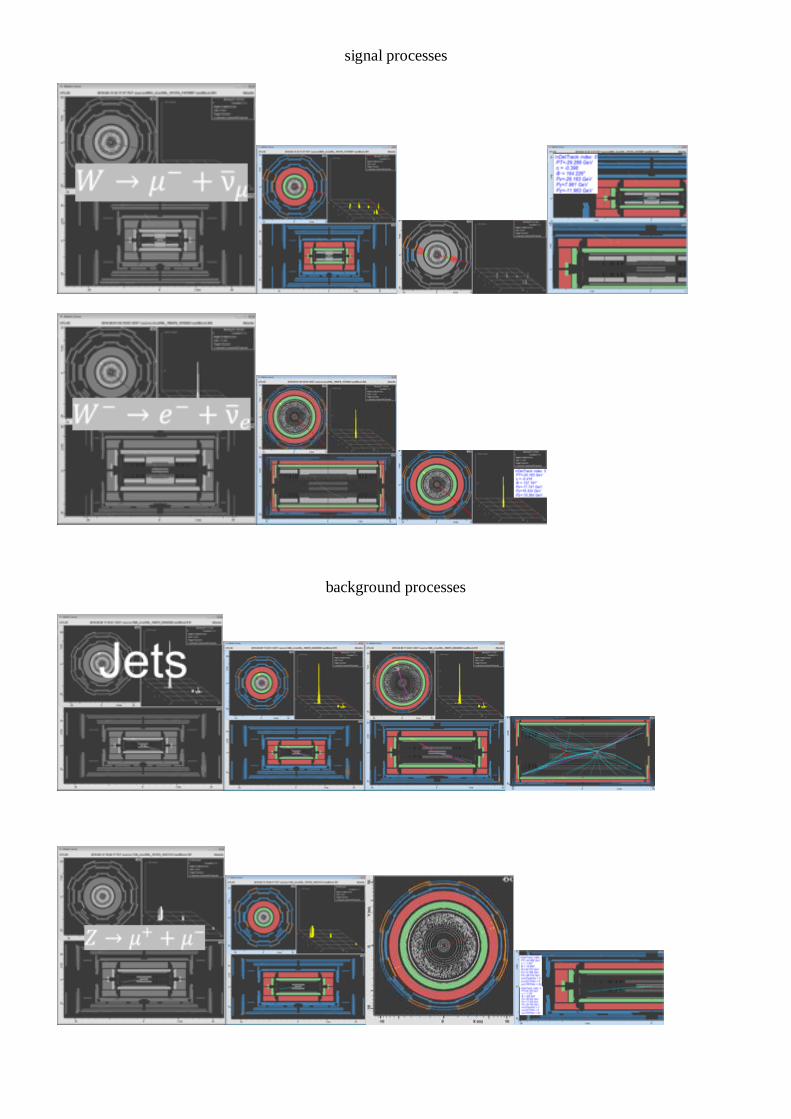
signal processes
background processes

Exercise 2
With the following exercise, you can test how good your command of event identification is. Therefore
we have chosen ten examples. They are stored here in electronic form for you to download. You can
download the necessary MINERVA program here. At the International Masterclasses, they are already
stored on your computer desktop. They have to be read in the program MINERVA (with “Read Event
Locally”).
Your task is to distinguish between signal and background events. Signal events are only events, which
produce exactly one W particle. In signal events you also determine whether the W particle has decayed
into an electron or positron or into a muon or antimuon, and the associated (anti-)neutrino. Events with
jets, Z particles, and top-quark pairs are background events.
You can check your results using the table below. For each event, choose which process you think is
underlying the event. By clicking “Confirm Task”, you can find out the number of events identified
correctly. By clicking “Correct Answers”, you can see the correct answers.
Event Classification
01 W+→μ
++νμ
02 W+→e
++νe
03 Background
04 Background
05 W-→e
-+νe
06 W+→μ
++νμ
07 W-→e
-+νe
08 WW-→l
-+νl+l
++νl
09 W-→μ
-+νμ
10 Background
Higgs particle
This short chapter tries to give you some insight into the search for this new particle at the LHC and its
recently reported results.
While LHC is searching for many new particles the Higgs particle is the most famous candidate. Its
discovery would proof a theory that was put up in the mid-1960's describing a mechanism that gives mass
to all particles of the standard model. One can derive from symmetries that all elementary particles were
massless immediately after the big bang. The theory suspects that a viscous medium called the Higgs
field spread out through our universe a trillionth of a second after the big bang. Since that time particles
have masses different from zero: The more they interact with this medium, i.e the larger their masses are,
the more force is needed in order to accelerate them inside this medium. To proof the higgs field it has to
be excited in some way, like creating little curls in a fluid or gas. These curls are the quanta of the Higgs
field excitations and called Higgs particles. They are massive and extremely short-lived. Before they can
reach the detectors they decay into other particles so that they can only be found on the basis of their
decay products. Into which other particles a Higgs particle decays, predictably depends on its mass. But
this value is as yet unknown. That is why physicists are looking for various signals that belong to all
possible decay modes of the Higgs particle. In the diagram below that is based on theoretical calculations
and contains recent experimental results from ATLAS and CMS, the fractions (y axis) of the most
important decay processes of the Higgs particle are shown. Additionally, you can see shaded areas inside
the diagram. These areas of theoretically possible Higgs masses have been either recently excluded after
the analyses from ATLAS and CMS at the LHC (with 95% confidence) or were excluded by LHC's

predecessor, the LEP experiment, 10 years ago. The influence of the Higgs mass (x axis) on these
fractions becomes clear as well.
Pay attention to the blue, dashed line (indicated with WW). Since it is impossible to proof the existence
of the Higgs particle by observing excesses in events with pairs of bottom and anti-bottom quarks (due to
the vast background), this line tells us: The decay of the Higgs particle into two W particles is the most
provable decay mode in the complete and still allowed mass range. These W's have opposite electric
charges since the Higgs particle is electric neutral.
Here is the problem: If a Higgs particle decays into two W's it will look like the production of two
oppositely electric charged W's. This production process is allowed by the Standard Model and has
nothing to do with the Higgs production (see right Feynman graph below). It is even worse: The latter
process (production of two W's without participation of the Higgs) is far more frequent (depending on the
mass 4-10 times). But how can you then distinguish between these two processes? Well, just by looking
at event displays only you cannot! But with the help of additional physics quantities (that you have to
learn in order to understand how it works) we can better distinguish between those processes. Particle
physicists call this process: increasing of the signal to background ratio.
We even want to specialize in the search for the Higgs in the WW decay mode. Both W particles decay
independently from each other following the laws of the Standard Model. A single W particle can decay
into a pair of either quark and anti-quark or lepton and anti-lepton. We want to have a look at this decay
mode, where both W particles will decay into a pair of lepton and anti-lepton, excluding tau leptons due
to their complicated identification. Physicists are calling this decay mode H→WW→lνlν or WW→lνlν
short, where l stands for an electron, muon, positron or anti-muon and ν for neutrinos.
To increase the signal to background ratio in the chosen decay mode we will concentrate on the angle
between our two detectable leptons in the plane at right angle to the beam pipe. This angle is called
opening angle. By taking spin relations of the produced particles into account we expect to find the Higgs
events mainly at angles less than 90 degrees while Standard Model WW events appear in the whole angle
range in which they prefer to appear at angles greater than 90 degrees. This can be shown in histograms
very well.

Signal vs Background
Here are two more Feynman diagrams showing the production and decay of the Higgs particle and one
background event (in this case: production of a heavy top quark pair).
WW events
And now, you can find this particle – let's go to the measurements!

Measurement
In this part you are going to analyze original data from the ATLAS experiment that was taken in 2011 in
order to draw your own conclusion about the structure of the proton on the one side and to understand
how the yet undiscovered Higgs particle can be found on the other side.
For the measurement, you will need the following tools:
1. An event display program: MINERVA - Download starts here.
2. A Data sample - All in all there are 6000 events. You will only analyze 50 out of them. All the
other events will be analyzed by your student mates from either your venue or other venues where
Masterclasses are also taking place today. How can you find your specific data sample? Each
small data sample (containing 50 events) carries a signature. It is comprised of a number and a
single letter from A to T. A number between 1 and 6 has been assigned to your venue. This is the
leading number of your data sample. It is followed by the letter (see 3.) that is written on your
tally sheet. All data samples can be found on the DVD that was sent to your venue and should be
now in your hands. Start MINERVA and load your particular data sample into the program, e.g.
3F.
3. The tally sheet, which should be in paper form in front of you (PDF ZIP), will help you in
counting your events. On it you will easily recognize the data sample to be analyzed since the
single letter is printed as group name. Together with the number of your venue the signature is
now exactly defined and thus you should be able to pick your data sample out of the 120 available
ones.
You are almost ready to start. On the next two pages, you will find the tasks for the measurement. Have
fun!
Structure of the proton
Protons are produced to collide in the LHC. At high enough energies, protons do not react as a whole, so
that only their constituent parts interact with each other. This gives you the possibility to draw a
conclusion about the inner structure of the proton by analysing the products of the collisions. The
measurement task is to find and count all events in which a W particle was produced. The W particle
decays into a lepton (electron or positron, or muon or antimuon) and the accompanying neutrino already
within the proton. We call these events signal events. In addition you'll see a lot of background processes.
Task 1
Discover the structure of the proton!
Select all the signal events (events producing a W particle) from the 50 events of your data package. For
these, you determine the electric charge of the W particle. After combining the results you determine the
ratio of the number of positively charged W particles to the number of negatively charged W particles.
We call this R±.
The following outline gives you a better overview of all possible signal and background events:

In order to identify an event as a signal event you should notice the following criteria. It is realy a signal
event, if
there is EXACTLY ONE Lepton (either an electron or a positron or a muon or an anti-muon),
which appear isolated (meaning it DOES NOT appear inside a JET) and
has a transverse momentum (Pt) greater than 20 GeV. Furthermore
a missing transverse momentum (MET) of AT LEAST 25 GeV is required in the event and
Only if an event fulfils all these criteria a W particle was created in this event and thus we call it a signal
event.
Search for the Higgs
Task 2
Among other things, the LHC was built to find evidence of the Higgs field in our universe by discovering
the Higgs particle for which physicists have been searching for a while. Theoretical predictions tell us
that heavy particles, e.g. top quarks, produced in collisions within the LHC might produce such Higgs
particles. But this has not yet been observed. In order to give you an impression how the Higgs particle
could be identified simulated WW events are mixed between the real data events. Pick them out and
measure the angle between the two leptons (that arise from the W’s) in the transversal plane, ΔΦ ll. Fill
your tally sheet and write down the angle.
You also need to know criteria, which will enable you to identify a possible WW candidate. These events
must:

contain EXACTLY TWO OPPOSITE electric charged leptons, which
are isolated and
the leading lepton (the one with higher transverse momentum) needs to have a transverse
momentum of at least 25 GeV while the sub-leading lepton (the one with lower transverse
momentum) only needs to have at least 15 GeV. Furthermore
a missing transverse momentum is required depending on the kind of leptons involved:
o of at least 40 GeV if both leptons are coming from the same family
o of at least 25 GeV in the other case.
Only if an event fulfills all these criteria it can be called a WW candidate event.
Analysis
Combining results
After the measurement all the data will be combined. Therefore, you'll enter your measurement results
into this ONLINE Spread Sheet.
Instructions for the analysis
The histogram of the angular distribution from your venue can be obtained by choosing your venue from
the drop down menu at the side menu of this website.
A Video Conference is taking place as closing event at the end of the day. There you'll come together
with student groups from other cities and countries, which have also analyzed ATLAS data. Your results
can be compared by using the Online Spread Sheet. Especially the measured angles of all WW candidate
events are supposed to be combined in one single histogram. It will be discussed during the Video
Conference.