Embed Size (px)
Citation preview

Weighting for Recognition: Accountingfor Advanced Placement and HonorsCourses When Calculating HighSchool Grade Point Average
Philip M. Sadler and Robert H. Tai
Honors and advanced placement (AP) courses are commonly viewed asmore demanding than standard high school offerings. Schools employ arange of methods to account for such differences when calculating gradepoint average and the associated rank in class for graduating students. Inturn, these statistics have a sizeable impact on college admission and accessto financial aid. The authors establish the relationship between the gradeearned and type of high school science course taken for 7,613 students bymodeling their later performance in an introductory college course. The sam-ple is drawn from more than 100 introductory science courses at 55 ran-domly chosen college and universities. Accounting for variations in collegegrading systems, strong evidence is found in favor of the practice of addingbonus points to students’ high school course grades in the sciences, namely,on a 4-point scale, 1 point for AP courses and .5 for honors courses.
Keywords: science; advanced placement; grade point average; grade weight-ing; college grades
IntroductionHigh school grades and standardized test scores have risen in importance for
students and their parents. After socioeconomic status (SES), one’s access to highereducation, especially highly selective colleges, is impacted by these measures of per-formance (Vickers, 2000). High school grades are typically aggregated into a singlemeasure, grade point average (GPA), by school administrators and then used todetermine rank in class (RIC) of graduating seniors (Hawkins & Clinedinst, 2006).Advanced courses typically complicate the calculation of GPA. There is little in theway of scholarly research that informs policy makers on the validity of the many dif-ferent systems advocated for weighting GPA.
5
NASSP Bulletin, Vol. 91, No. 1, March 2007 5-32DOI: 10.1177/0192636506298726© 2007 by the National Association of Secondary School Principalshttp://bul.sagepub.com hosted at http://online.sagepub.com
unauthorized distribution.© 2007 National Association of Secondary School Principals. All rights reserved. Not for commercial use or
by guest on February 27, 2007 http://bul.sagepub.comDownloaded from

Honors and advanced placement (AP) courses represent common avenues bywhich students are exposed to advanced work while in high school. The AP programhas expanded in the past five decades to involve 1,200,000 students taking 2,100,000AP exams in more than 32 different subjects (Camara, Dorans, Morgan, & Myford,2000; College Entrance Examination Board [CEEB], 2005a; Hershey, 1990;Rothschild, 1999). Advanced placement was originally conceived of as a program forelite private school students to take college-level courses while still in high school sothat exceptional students could start in college with credit for introductory courses,potentially earning their degree in a shorter time (Phillips Academy, 1952). When theprogram was conceived, no mention was made of the impact on admission to collegeor how taking advanced courses should impact GPA or honors in high school.
Advanced courses have become a part of political mandates, with several states(e.g., Florida, Louisiana, and Utah) offering incentives to high schools to teach APcourses, whereas others (e.g., South Carolina) require all high schools to participate(Hershey, 1990; Willingham & Morris, 1986). Federal subsidies of AP programs forlow-income students were initiated by U.S. Department of Education’s HigherEducation Act of 1998 and are continuing to increase yearly.
When students select advanced coursework in high school, they (and theirparents) expect that such courses will better prepare them for college (Adelman,1999; Schneider, 2003). Conventional wisdom suggests that such courses shouldresult in greater learning and their attendant benefits: higher standardized test scores,greater probability of being accepted into the college of their choice, better perfor-mance in college (Klopfenstein, 2004; National Research Council, 2002; Thompson& Joshua-Shearer, 2002), and more access to merit-based financial aid (Herr, 1991b;Hout, 2005). If a student earns high scores on enough AP exams, he or she may be
6 NASSP Bulletin Vol. 91 No. 1 March 2007
The authors acknowledge the people who helped make this large research project possible: Janice M. Earle,Finbarr C. Sloane, and Larry E. Suter of the National Science Foundation for their insight and support; JamesH. Wandersee, Joel J. Mintzes, Lillian C. McDermott, Eric Mazur, Dudley R. Herschbach, Brian Alters, andJason Wiles of the FICCS Advisory Board for their guidance; and Nancy Cianchetta, Susan Matthews, DanRecord, and Tim Reed of our High School Advisory Board for their time and wisdom. This research hasresulted from the tireless efforts of many on our research team: Michael Filisky, Hal Coyle, Cynthia Crockett,Bruce Ward, Judith Peritz, Annette Trenga, Freeman Deutsch, Zahra Hazari, Marc Schwartz, and GerhardSonnert. Matthew H. Schneps, Nancy Finkelstein, Alex Griswold, Tobias McElheny, Yael Bowman, andAlexia Prichard of our Science Media Group constructed our dissemination Web site (www.ficss.org). Wealso appreciate advice and interest from several colleagues in the field: Michael Neuschatz of the AmericanInstitute of Physics, William Lichten of Yale University, Trevor Packer of the College Entrance ExaminationBoard, William Fitzsimmons and Rory Browne of Harvard University, and Kristen Klopfenstein of TexasChristian University. We are indebted to the professors at universities and colleges nationwide who felt thatthis project was worth giving over a piece of their valuable class to have administered our surveys and theirstudents’ willingness to answer our questions. This work has been carried out under a grant form theInteragency Educational Research Initiative (NSF-REC 0115649). Any opinions, findings, and conclusionsor recommendations expressed in this material are those of the authors and do not necessarily reflect theviews of the National Science Foundation, U.S. Department of Education, or National Institutes of Health.Correspondence concerning this article may be sent to: Philip M. Sadler at [email protected].
unauthorized distribution.© 2007 National Association of Secondary School Principals. All rights reserved. Not for commercial use or
by guest on February 27, 2007 http://bul.sagepub.comDownloaded from
awarded “advanced standing” and enter a college with course credits or even as asophomore, saving a year’s tuition (Dillon, 1986; MacVicar, 1988; Pushkin, 1995).However, enrolling in an AP or honors-level course can result in students earning alower grade than they would in a standard-level course because more will beexpected and higher performing students will be classmates (Attewell, 2001). Lowergrades can adversely impact their GPA and lower their RIC. Many high schooladministrators and teachers are concerned that such a disincentive can adverselyimpact enrollment in honors and AP courses (Capasso, 1995). High school GPA(HSGPA) and RIC are also commonly used to decide high school graduation honorsand can affect “automatic” acceptances at many state universities (e.g., Texas,Maine), eligibility for financial aid credits, and admissions at selective colleges anduniversities. Even a small disparity in GPA between candidates can mean the differ-ence between acceptance and rejection by a college (Vickers, 2000).
In view of these issues, the majority of high schools in the nation modify or“weight” their calculation of HSGPA (Hawkins & Clinedinst, 2006). However, no stan-dard scheme exists (Cognard, 1996; Dillon, 1986; Jones, 1975; National ResearchCouncil, 2002). The majority of high schools average together grades for every coursetaken (CEEB, 1998), whereas some limit inclusion to courses only in academic subjects(i.e., math, science, English, history, foreign language), excluding ancillary courses(e.g., typing, physical education). Although when tested by Goldman and Sexton(1974), there was no improvement in prediction of college grades when using this morerestricted set of courses. The scale used is commonly based on 4 points (A = 4, B = 3,C = 2, D = 1, F = 0), although pluses and minuses awarded may expand the scaleupward (e.g., A+ = 4.33). Honors or advanced placement courses are often accountedfor by grading on a higher scale (A = 5, B = 4, C = 3, D = 2, F = 1), or more simply,“bonus” points are added to the grade appearing on the transcript (from .5 to a fullpoint). Thus, the seemingly simple process of averaging student high school gradestogether has many variants. In addition, anomalies exist, which different schemesattempt to remedy; it is possible to attain higher grades by taking remedial courses,fewer courses, or repeating a course for a higher grade (Downs, 2000; Vickers, 2000).
The intention of this study was to investigate the validity of weighting of highschool grade point average based on evidence of later performance in college. Ratherthan accepting those procedures that are prevalent, we sought evidence-based valida-tion with which high school administrators could possibly establish, modify, or defendtheir policies. For example, Alder (1984) reported that in 1982 the University ofCalifornia system decided that as an inducement for applicants to take the mostdemanding high school courses, 1 point should be added to a student’s high schoolgrade for each honors or AP course taken (e.g., earning an A in biology would normallyresult in a score of 4; an A in an honors or AP biology course would be worth a 5). Thefact that several states now require such uniform calculations for entry to state collegesand universities did not strike us as evidence that such calculations are warranted.
NASSP Bulletin Vol. 91 No. 1 March 2007 7 unauthorized distribution.
© 2007 National Association of Secondary School Principals. All rights reserved. Not for commercial use or by guest on February 27, 2007 http://bul.sagepub.comDownloaded from
Legislators and bureaucrats have long supported policies that have little to supportthem. Perhaps the oddest example is an attempt to pass into law a rational value for theirrational number pi. A bill to legislate the value as 3.2 was filed in 1897 in the IndianaHouse of Representatives (Beckman, 1971). Educators prefer the kind of evidence pro-vided by rigorous studies to make decisions that best serve their constituents.
BackgroundThe College Entrance Examination Board (which administers the AP program;
CEEB) has the arguably conservative position that the value of AP courses for studentscan only be certified when they take the AP exam, maintaining that colleges will grantcredit for AP exam scores above a certain level. The CEEB holds no official position onthe weighting of high school grade point averages on the basis of enrollment in APcourses. The CEEB does not support the use of AP enrollment in college admissionsdecisions, and it is not proactive in making available the results of AP exams by admis-sions officers. One simple reason is timing. In our study, we find that 66% of studentstake their AP science courses in their senior year. Hence, the majority of AP exams aretaken in May well after college admissions decisions are made. Moreover, it is esti-mated that 30% to 40% of students in AP courses nationally do not take the associatedAP exam (National Research Council, 2002). Left without guidance, not content to letcredit for college courses be the sole benefit of taking an AP course, and worried thatadvanced courses might “hurt” students’ HSGPA, high schools and colleges respond topressures from parents, students, and teachers in adopting their own schemes to dealwith the issue of accounting for the value of taking AP or honors courses.
Without the standardization of an AP exam score, what can high schools do toreward students who choose these advanced courses? High schools have few options tomeasure the intrinsic merit of these courses. AP or honors enrollment and the gradesstudents earn could mean a great deal or nothing at all. Many high schools recognizethat the knowledge and experience of a teacher determines the quality of AP or honorscourses (Dillon, 1986). Although the curriculum may be rigorous in AP and honorscourses, high schools also vary in their selectivity policies for determining whichstudents may qualify to enroll. Some accept all students into these advanced courses;others require certain prerequisite classes or exam performance (Nyberg, 1993). Hence,enrollment in such courses without considering the grade received or the AP exam per-formance may not reflect student achievement. Indeed, the correlation between grade inAP courses and AP exam scores is only .336 for the 964 students in our study. There aremany students who earn an A in their AP course and perform quite poorly on their APexam (Hershey, 1990). William Lichten (2000) of Yale University found evidence for adrop in standards as the AP program has expanded nationally.
Students who enroll in AP courses are arguably the most academically gifted inhigh school and later do well in college. Educators should keep in mind that there isa difference between enrollment in AP courses as an indicator of college preparationversus the degree to which these courses contribute to college preparation. As an
8 NASSP Bulletin Vol. 91 No. 1 March 2007 unauthorized distribution.© 2007 National Association of Secondary School Principals. All rights reserved. Not for commercial use or
by guest on February 27, 2007 http://bul.sagepub.comDownloaded from
example, the National Merit Scholar program selects 8,200 high school seniors eachyear for recognition from a field of 1.3 million entrants. No one would argue thatthese students are not among the best high school scholars, but being selected by theprogram does nothing to improve their academic preparation per se. So too with AP;the impact of taking an AP course on these highly motivated and intelligent studentscannot be assessed by simply comparing students who take AP with those who donot. Careful selection of controls is essential in measuring impact. However, manystudies simply compare AP participants and nonparticipants, including studiestouted by the CEEB, which is responsible for the quality of the program. This con-cern was best summarized by Dougherty, Mellor, and Jian (2006):
Much of those [AP] students’ later success in college may be due not to theAP classes themselves, but to the personal characteristics that led them toparticipate in the classes in the first place—better academic preparation,stronger motivation, better family advantages, and so on. These selectioneffects will affect any comparison of AP and non-AP students. (p. 3)
Another issue for educators stems from the frequency in which AP courses areoffered in different high schools. Some argue that the difference in offerings amongschools perpetuates a “two-tiered educational system” (Dupuis, 1999, p. 1) wherebystudents of higher socioeconomic status have more access to advanced courses and earnmuch higher HSGPAs as a result (Burdinan, 2000). As an example, the average HSGPAof applicants to the University of California at Los Angeles was 4.19 in 1998, indicatingthat those high schools that do not offer students the opportunity to earn As in advancedcourses may be at a disadvantage in competing at selective colleges (Dupuis, 1999).
Prior ResearchIdeally, an experiment whereby students can be randomly assigned to regular, AP,
honors, or no course at all in a subject could resolve questions about the impact of APand honors courses. However, such a draconian research design is neigh impossible ineducation. Students must be free to choose their courses. Yet, there are many studies thatattempt to control for background factors through statistical means or by subject match-ing. Such studies have come to differing conclusions, either finding that AP and honorscourses make a big difference later on or that they make no difference at all.
On the side of calculating a weighted HSGPA to account for AP and honorscourses, studies have found the following:
• College GPA is higher for AP students (Burton & Ramist, 2001; Chamberlain, Pugh,& Shellhammer, 1978; Morgan & Ramist, 1998).
• For math and science majors, the weighted HSGPA is a better predictor of first-yearcollege GPA than a nonweighted HSGPA (Bridgeman, McCamley-Jenkins, & Ervin,2000; Dillon, 1986).
NASSP Bulletin Vol. 91 No. 1 March 2007 9 unauthorized distribution.© 2007 National Association of Secondary School Principals. All rights reserved. Not for commercial use or
by guest on February 27, 2007 http://bul.sagepub.comDownloaded from
• Accounting for the difficulty of a student’s academic program in high schoolincreases the variance explained for college freshman GPA (Bassiri & Schultz, 2003;Lang, 1997).
• AP students are more likely to continue with the subject in college and take higherlevel courses (Chamberlain et al., 1978; Ruch, 1968) even when matched by sex andSAT score (Cahow et al., 1979).
• Those who teach advanced high school courses find more intellectual stimulation andenjoy greater collegiality with peers who teach AP courses (Herr, 1991a).
• Honors and AP courses more closely match the type and pace of courses students willface in college, bestowing an advantage on students (and their parents) who generallyhave little idea of the standards, course requirements, and placement tests they wouldface in college (Venezia & Kirst, 2005).
• Standardized exam scores tend to underpredict female student performance in col-lege. Adding in HSGPA ameliorates this bias in college admissions decisions(Bridgeman & Lewis, 1996; Bridgeman & Wendler, 1991; Gallager & Kaufman,2005; Wainer & Steinberg, 1992).
• The preference for weighted HSGPAs among directors of admissions at 4-year col-leges has grown from 52% in 1971 to 68% in 1989 (Seyfert, 1981; Talley, 1989). Themajority of their colleges had official policies to show no preference between candi-dates with a weighted HSGPA and a nonweighted HSGPA. Yet in a blind rating ofcandidates, 76% gave preference to those with a weighted HSGPA (Talley, 1989).
Several studies have found little or no evidence that weighting HSGPA foradvanced high school courses predicted better college performance or persistence:
• No difference was found between matched pairs of AP and non-AP students on col-lege grade in their introductory course or overall freshman GPA (Ruch, 1968).
• The combined number of AP and honors courses taken in high school was not a sig-nificant predictor for freshman college GPA or significant in predicting persistence incollege (Geiser & Santelices, 2004). For a response to this article, see Camara andMichaelides (2005).
• A study of 28,000 high school graduates in Texas measuring persistence to a secondyear of college study and first-year college GPA (Klopfenstein & Thomas, 2005) foundthat AP courses provide little or no additional postsecondary benefit in college GPA orpersistence when controlling for the balance of a student’s high school curriculum.
Although honors and AP courses often are treated the same in weighted calcu-lations, Herr (1992) studied the difference between these two types of courses bysurveying 847 teachers in New York State. He found that honors courses were char-acterized by greater curricular freedom in choosing texts, topics, and teachingmethods. They were less stressful to teach, allowed more time to be spent in the
10 NASSP Bulletin Vol. 91 No. 1 March 2007 unauthorized distribution.
© 2007 National Association of Secondary School Principals. All rights reserved. Not for commercial use or by guest on February 27, 2007 http://bul.sagepub.comDownloaded from
laboratory, and were viewed by their teachers as better at developing students’“thinking skills.” AP courses were seen as more satisfying for teachers and covereda greater breadth of topics in greater depth and at a faster pace. Honors and APcourses served different needs. Typically an honors course is taken by students as aprerequisite for AP (Herr, 1993). Among our participants, an earlier high schoolcourse in the same science subject was taken by 94% of those who enrolled in APbiology, 92% of those in AP chemistry, and 47% of those in AP physics.
Colleges and universities rely on student transcripts in their admissions process.Half recast GPAs based on their own standards. Ignoring a high school’s calculation,the rest use the reported HSGPA unchanged (Hawkins & Clinedinst, 2006).Although college admission offices have flexibility in how they can recalculateHSGPA, this opportunity does not exist for a student’s RIC. Rank sums up where astudent stands with regard to his or her graduating class, usually converted to a per-centile. For RIC, high schools use their own GPA calculation in their determination.Colleges cannot recalculate this rank, so they must accept reported RIC as is or notuse it in the admission decision. Rutledge (1991) and Lockhart (1990) reported thecost to applying students when college admissions officers give emphasis on RICbased on an unweighted HSGPA. In a review of college and university admissionspolicies, HSGPA (or RIC) was the most important factor in college admissions. APcourse enrollment ranked above SAT II scores in importance (Breeland, Maxey,Gernand, Cumming, & Trapani, 2002).
While the debate rages, no prior research has attempted to measure the impactof AP or honors courses with the intent of setting a defensible number of “bonus”points for each course type. This is our goal. If large differences in college perfor-mance exist based on taking advanced courses, then weighted HSGPAs make sense.If the differences are small, unweighted HSGPAs will do.
MethodsWe have chosen to study the relationship between high school grades in science
and the level of the high school course (regular, honors, advanced placement) in anattempt to find validation for the award of “bonus” points when calculating a weightedHSGPA. To do this, we used data from 7,613 college students enrolled in introductoryscience courses in 55 randomly chosen colleges and universities. Several statisticalmodels were built in our attempt to account for the variation in college science gradesof these students. High school course type and high school course grade are significantpredictors of college science grade. A comparison between these two variables alloweda calculation of the value of “bonus points” for honors and AP courses to be used whenfiguring HSGPA. Three regression models accounting for increasing degrees of varia-tion in the backgrounds of students buttress the robustness of the findings. Importantissues in this analysis are the selection of outcome variables, construction of the surveyinstrument, sample selection, and the rigorous approach to analysis.
NASSP Bulletin Vol. 91 No. 1 March 2007 11 unauthorized distribution.
© 2007 National Association of Secondary School Principals. All rights reserved. Not for commercial use or by guest on February 27, 2007 http://bul.sagepub.comDownloaded from
Outcome VariableThe issue for the authors was how to equate high school course rigor and grade
through association with one of many possible common metrics. Suggested candi-dates for this parametric relationship are:
• standardized test scores (e.g., ACT, SAT I, or SAT II),• performance in college coursework, or • persistence to the next year of college or to graduation.
Our decision was to carry out this analysis using as a common metric thegrade that students earn in their introductory college science course. How wellstudents perform in their college course is the most logical measure of how mucha student has learned in his or her high school course in the subject. Presumably,the knowledge gained in a student’s high school course endures through their col-lege course, with the best prepared earning the highest grades. In our analysis,both the level of high school science course and the grade earned in high schoolwere employed to calculate the appropriate adjustment to the high school grade.We could carry out this analysis because there are many students who repeat ratherthan “place out” of the introductory science course even if they have taken an APcourse in the subject in high school and performed well on the AP exam(Willingham & Morris, 1986). These students did not take advantage of the oppor-tunity for advanced placement promoted by the CEEB. Why? Students in ourstudy volunteered these reasons:
• I was required by my university. . . . I could not skip major classes.• I was told that many graduate schools didn’t like to see students placing out of classes
that were a core part of their major.• My college certainly allowed people to test out of the first introductory course, but . . .
they encouraged people to take the course regardless.• Though I had done well on the AP exam [an AP exam score of 3] . . . I wanted to
make sure I had basic concepts down well.• [My] university did not accept a score of 4 to receive credit for the course. • I did not score high enough on the AP test [a score of 5 needed] to take the [univer-
sity placement] test.• I missed a passing score [on the university placement exam] by one question [student
earned a 5 on his AP exam].• Although I got a 5 on the AP exam, my university did not give me credit for the intro-
ductory course unless I had laboratory documents, which I did not have.
Because all but the grade awarded in the college course was self-reported, ques-tions arise as to reliability and validity. With regard to reliability, we consulted
12 NASSP Bulletin Vol. 91 No. 1 March 2007 unauthorized distribution.
© 2007 National Association of Secondary School Principals. All rights reserved. Not for commercial use or by guest on February 27, 2007 http://bul.sagepub.comDownloaded from
research on the accuracy of self-report in designing our study (Bradburn, Rips, &Shevell, 1987; Groves, 1989; Niemi & Smith, 2003). In addition, the review ofKuncel, Credé, and Thomas (2005) of self-report measures counted college studentsamong those whose self-reports were reasonably accurate. The courses that studentstook in high school make up a proportionally large part of their relatively short life,and the grades they earned were fairly recent and fresh as most students had appliedto college the previous year. Given that the surveys were administered by collegescience instructors while students were present in their college science courses, itwould be doubtful if the students did not reflect on the courses they took in highschool and the grades that they earned. To gauge reliability, we conducted a separatestudy in which 113 college chemistry students took the survey twice, 2 weeks apart.Our analysis found that for groups of 100, only a .07% chance of reversal existed(Thorndike, 1997). As to validity, the outcome used in this analysis, final collegescience course grades, is well understood by students as an indicator of their perfor-mance that will be entered into a permanent record. The method in which these gradesare earned is also well articulated to the students in widely distributed course syllabi.Therefore, given the weight and clarity of final course grades as measures of achieve-ment, we believe that it is a viable and clearly relevant though not flawless measure ofstudent performance.
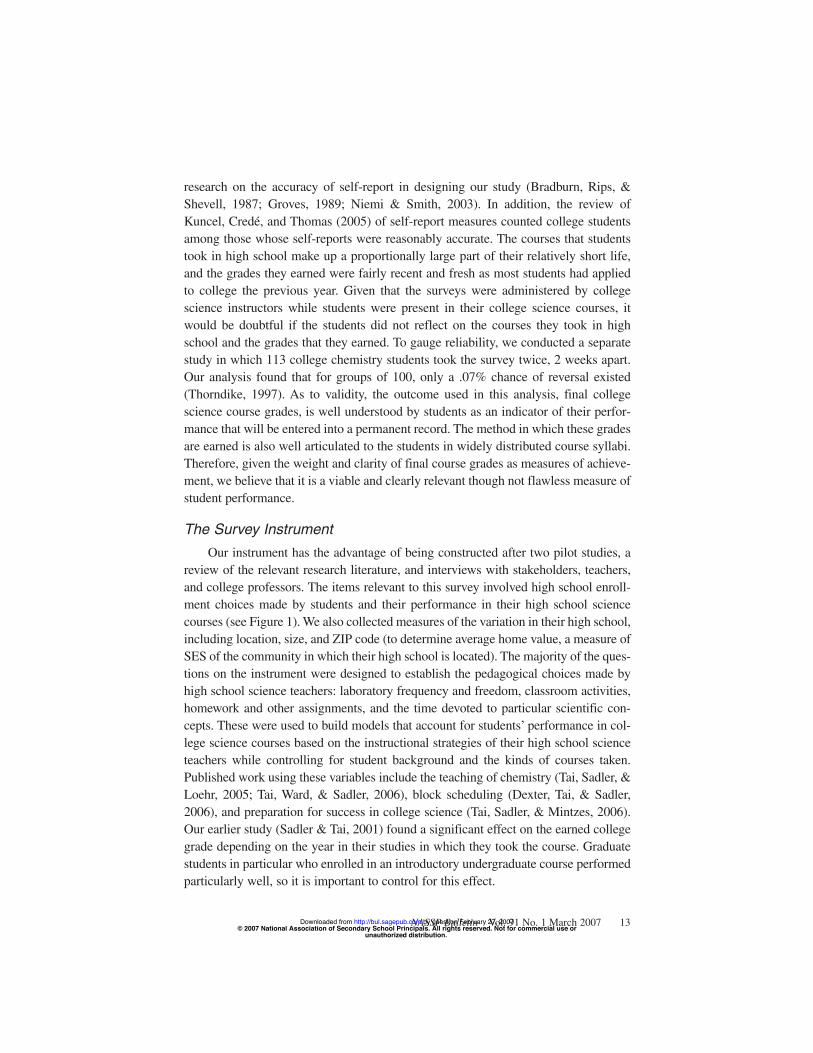
The Survey InstrumentOur instrument has the advantage of being constructed after two pilot studies, a
review of the relevant research literature, and interviews with stakeholders, teachers,and college professors. The items relevant to this survey involved high school enroll-ment choices made by students and their performance in their high school sciencecourses (see Figure 1). We also collected measures of the variation in their high school,including location, size, and ZIP code (to determine average home value, a measure ofSES of the community in which their high school is located). The majority of the ques-tions on the instrument were designed to establish the pedagogical choices made byhigh school science teachers: laboratory frequency and freedom, classroom activities,homework and other assignments, and the time devoted to particular scientific con-cepts. These were used to build models that account for students’ performance in col-lege science courses based on the instructional strategies of their high school scienceteachers while controlling for student background and the kinds of courses taken.Published work using these variables include the teaching of chemistry (Tai, Sadler, &Loehr, 2005; Tai, Ward, & Sadler, 2006), block scheduling (Dexter, Tai, & Sadler,2006), and preparation for success in college science (Tai, Sadler, & Mintzes, 2006).Our earlier study (Sadler & Tai, 2001) found a significant effect on the earned collegegrade depending on the year in their studies in which they took the course. Graduatestudents in particular who enrolled in an introductory undergraduate course performedparticularly well, so it is important to control for this effect.
NASSP Bulletin Vol. 91 No. 1 March 2007 13 unauthorized distribution.
© 2007 National Association of Secondary School Principals. All rights reserved. Not for commercial use or by guest on February 27, 2007 http://bul.sagepub.comDownloaded from
The SampleThis study is a part of a larger research effort, Factors Influencing College
Science Success (Project FICSS), a grant-funded, national study that includes inter-views and surveys of college science students, high school science teachers, and pro-fessors in biology, chemistry, and physics (interviews available online atwww.ficss.org). The 55 colleges and universities included were selected from allU.S. 4-year schools, stratified to account for the proportional representation of thenational variation in undergraduate enrollment. Initially, professors were recruited toadminister an eight-page survey to students during the first 3 weeks of their intro-ductory biology, chemistry, or physics course. Set aside for the semester, these sur-veys were later marked with students’ final grades and then sent back to the researchteam. Once received, the surveys were checked, machine scanned, and the data com-piled for analysis. Roughly 25% of survey participants volunteered their e-mailaddresses for follow-up communications.
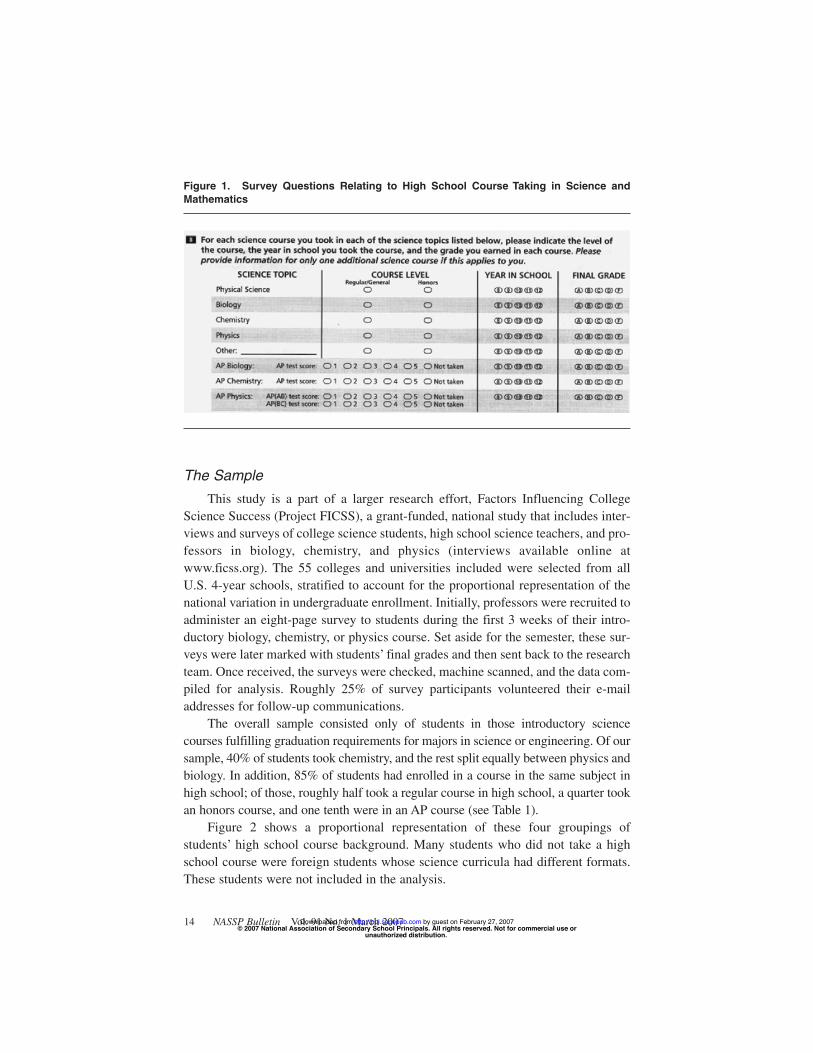
The overall sample consisted only of students in those introductory sciencecourses fulfilling graduation requirements for majors in science or engineering. Of oursample, 40% of students took chemistry, and the rest split equally between physics andbiology. In addition, 85% of students had enrolled in a course in the same subject inhigh school; of those, roughly half took a regular course in high school, a quarter tookan honors course, and one tenth were in an AP course (see Table 1).
Figure 2 shows a proportional representation of these four groupings ofstudents’ high school course background. Many students who did not take a highschool course were foreign students whose science curricula had different formats.These students were not included in the analysis.
14 NASSP Bulletin Vol. 91 No. 1 March 2007
Figure 1. Survey Questions Relating to High School Course Taking in Science andMathematics
unauthorized distribution.© 2007 National Association of Secondary School Principals. All rights reserved. Not for commercial use or
by guest on February 27, 2007 http://bul.sagepub.comDownloaded from
NASSP Bulletin Vol. 91 No. 1 March 2007 15
Table 1. Distribution of Students in College Science Courses by Level of High School
Science Course in the Same Subject
High School ScienceCourse Level Biology Chemistry Physics Total Percentage
No high school
science course 151 268 902 1,321 15
Regular 1,626 1,993 1,114 4,733 52
Honors 650 983 506 2,139 24
Advanced placement 335 393 161 889 10
Total 2,762 3,637 2,683 9,082 100
Column percentage 30 40 30 100
0
500
1000
1500
2000
2500
3000
3500
4000
Biology Chemistry PhysicsCollege Course
AP
Honors
Regular
none
Figure 2. Distribution of Student High School Science Background in the Same Field forStudents Taking Introductory College Biology, Chemistry, and Physics Courses
Note: AP = advanced placement.
It is of special note that the students who enrolled in these courses and who hadtaken an AP course in high school did not tend to be those who had performed poorlyin their AP courses. Namely, 45% of these AP students reported that they took theAP exam. Their mean score on the exam was 3.05 (out of 5) compared to a meanscore of 2.99 for students who took the exam nationally in these subject areas(CEEB, 2005b).
unauthorized distribution.© 2007 National Association of Secondary School Principals. All rights reserved. Not for commercial use or
by guest on February 27, 2007 http://bul.sagepub.comDownloaded from
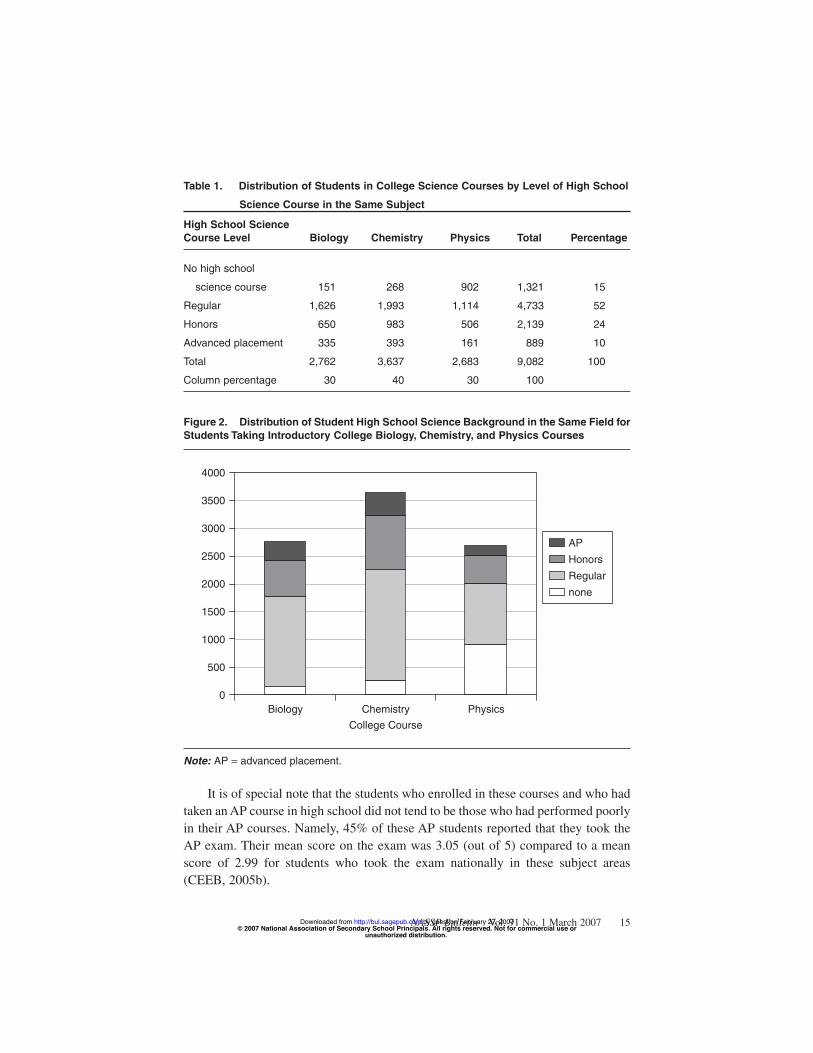
The college course grading schemes differed across classrooms with a mean scoreof 81.32 and a mean standard deviation of 10.23 points, where final course grades wereassigned values of A+ = 98, A = 95, A– = 92, B+ = 88, etc. (see Figure 3). We choseto assign college grades using this scale for ease of interpretation. Because we have noway to equate the difficulty of courses among institutions, we concerned ourselveswith how well students performed within an institution. For this purpose, we enteredeach institution into our regression models as a separate variable to account for differ-ences across institutions.
AnalysisTo make sense of our data, we first examined the raw scores of students in col-
lege courses through tabular summaries and then by graphing the data with appropri-ate error bars. We then constructed three regression models. The first model accountsfor variation in college science grade on the basis of HS grade in that subject and thecourse type (regular, honors, or AP). The second model includes variables that con-trol for the differences at the college level, accounting for the impact of differentlevels of grading stringency (college ID) and when in a student’s college career theytook the course (year in college, which includes 1, 2, 3, 4, graduate, and specialstudents status). At the level of the particular high school, our controls include a mea-sure of the wealth of the community (mean home value taken from students’ ZIPcode), high school type (public, private, or other), and college course (college biol-ogy, chemistry, or physics). A third model incorporates student performance in other
16 NASSP Bulletin Vol. 91 No. 1 March 2007
50
55
60
65
70
75
80
85
90
95
100
College Science Course Ordered by Mean
Figure 3. Mean and Standard Deviation in Student Grade in Introductory CollegeScience Courses in the 123 College Science Courses Surveyed
unauthorized distribution.© 2007 National Association of Secondary School Principals. All rights reserved. Not for commercial use or
by guest on February 27, 2007 http://bul.sagepub.comDownloaded from
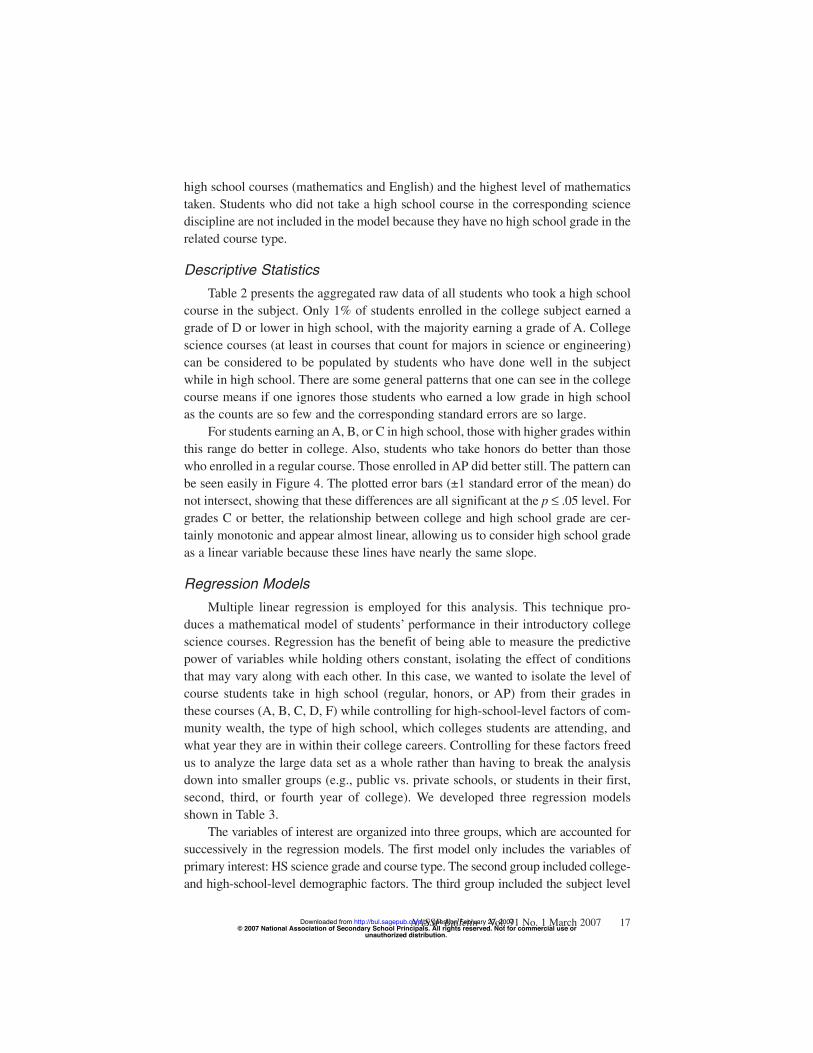
high school courses (mathematics and English) and the highest level of mathematicstaken. Students who did not take a high school course in the corresponding sciencediscipline are not included in the model because they have no high school grade in therelated course type.
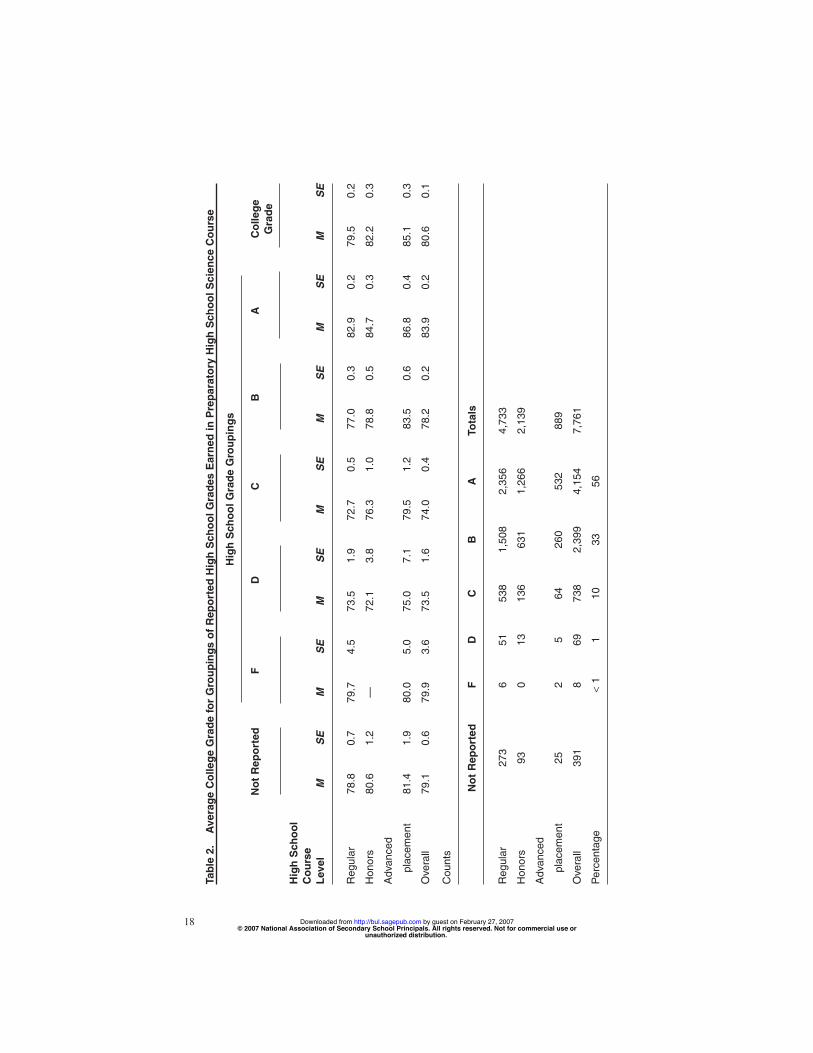
Descriptive StatisticsTable 2 presents the aggregated raw data of all students who took a high school
course in the subject. Only 1% of students enrolled in the college subject earned agrade of D or lower in high school, with the majority earning a grade of A. Collegescience courses (at least in courses that count for majors in science or engineering)can be considered to be populated by students who have done well in the subjectwhile in high school. There are some general patterns that one can see in the collegecourse means if one ignores those students who earned a low grade in high schoolas the counts are so few and the corresponding standard errors are so large.
For students earning an A, B, or C in high school, those with higher grades withinthis range do better in college. Also, students who take honors do better than thosewho enrolled in a regular course. Those enrolled in AP did better still. The pattern canbe seen easily in Figure 4. The plotted error bars (±1 standard error of the mean) donot intersect, showing that these differences are all significant at the p ≤ .05 level. Forgrades C or better, the relationship between college and high school grade are cer-tainly monotonic and appear almost linear, allowing us to consider high school gradeas a linear variable because these lines have nearly the same slope.
Regression ModelsMultiple linear regression is employed for this analysis. This technique pro-
duces a mathematical model of students’ performance in their introductory collegescience courses. Regression has the benefit of being able to measure the predictivepower of variables while holding others constant, isolating the effect of conditionsthat may vary along with each other. In this case, we wanted to isolate the level ofcourse students take in high school (regular, honors, or AP) from their grades inthese courses (A, B, C, D, F) while controlling for high-school-level factors of com-munity wealth, the type of high school, which colleges students are attending, andwhat year they are in within their college careers. Controlling for these factors freedus to analyze the large data set as a whole rather than having to break the analysisdown into smaller groups (e.g., public vs. private schools, or students in their first,second, third, or fourth year of college). We developed three regression modelsshown in Table 3.
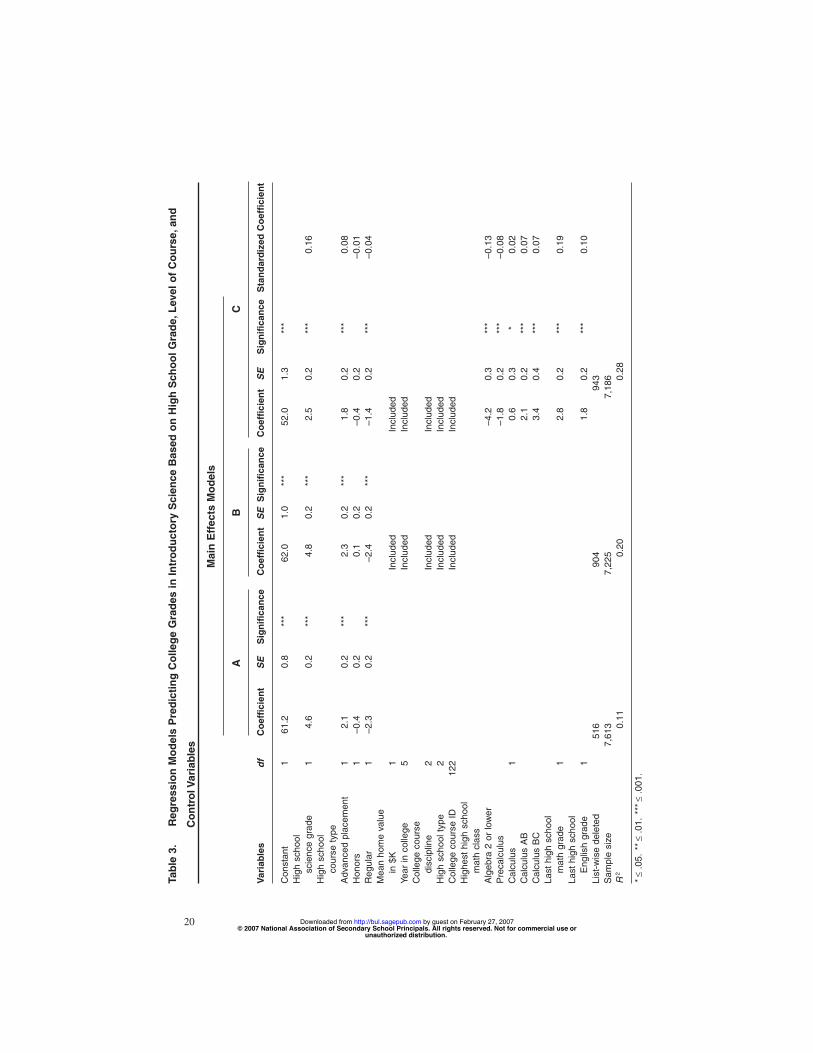
The variables of interest are organized into three groups, which are accounted forsuccessively in the regression models. The first model only includes the variables ofprimary interest: HS science grade and course type. The second group included college-and high-school-level demographic factors. The third group included the subject level
NASSP Bulletin Vol. 91 No. 1 March 2007 17 unauthorized distribution.
© 2007 National Association of Secondary School Principals. All rights reserved. Not for commercial use or by guest on February 27, 2007 http://bul.sagepub.comDownloaded from
18
Tabl
e 2.
Ave
rage
Col
lege
Gra
de fo
r G
roup
ings
of
Rep
orte
d H
igh
Sch
ool G
rade
s E
arne
d in
Pre
para
tory
Hig
h S
choo
l Sci
ence
Cou
rse
Hig
h S
choo
l Gra
de G
roup
ings
Not
Rep
orte
dF
DC
BA
Col
lege
Gra
de
Hig
h S
choo
lC
ours
e Le
vel
MS
EM
SE
MS
EM
SE
MS
EM
SE
MS
E
Reg
ular
78.8
0.7
79.7
4.5
73.5
1.9
72.7
0.5
77.0
0.3
82.9
0.2
79.5
0.2
Hon
ors
80.6
1.2
—72
.13.
876
.31.
078
.80.
584
.70.
382
.20.
3
Adv
ance
d
plac
emen
t81
.41.
980
.05.
075
.07.
179
.51.
283
.50.
686
.80.
485
.10.
3
Ove
rall
79.1
0.6
79.9
3.6
73.5
1.6
74.0
0.4
78.2
0.2
83.9
0.2
80.6
0.1
Cou
nts
Not
Rep
orte
dF
DC
BA
Tota
ls
Reg
ular
273
651
538
1,50
82,
356
4,73
3
Hon
ors
930
1313
663
11,
266
2,13
9
Adv
ance
d
plac
emen
t25
25
6426
053
288
9
Ove
rall
391
869
738
2,39
94,
154
7,76
1
Per
cent
age
<1
110
3356
unauthorized distribution.© 2007 National Association of Secondary School Principals. All rights reserved. Not for commercial use or
by guest on February 27, 2007 http://bul.sagepub.comDownloaded from

difference in relevant high school courses, mathematics and English. We have substi-tuted dummy variables for each categorical variable for the purpose of comparison.
The Model A accounts for 11% of the variance in college grade. Students whoearn higher grades in high school science or who take advanced courses (or both) dosignificantly better in their college science course.
Model B accounts for an additional 8% of the variance in college science gradeby including the additional college- and high-school-level variables described ear-lier. The variables include year in college to account for the fact that graduate andspecial students who take introductory courses perform much better than undergrad-uates. The particular college course (i.e., biology, chemistry, or physics) differs inmean grade, as do the individual college courses. At the high school level, weaccount for the HS type (public, private, or other) and SES through the mean homevalue generated from U.S. census data associated with students’ ZIP codes. Studentsfrom private high schools earn higher grades in college science. In Model B, students
NASSP Bulletin Vol. 91 No. 1 March 2007 19
Figure 4. Mean Introductory College Science Course Grade by Level of High SchoolCourse and Grade Earned in that Course
Note: AP = advanced placement.
unauthorized distribution.© 2007 National Association of Secondary School Principals. All rights reserved. Not for commercial use or
by guest on February 27, 2007 http://bul.sagepub.comDownloaded from
20
Tabl
e 3.
Reg
ress
ion
Mod
els
Pre
dict
ing
Col
lege
Gra
des
in In
trod
ucto
ry S
cien
ce B
ased
on
Hig
h S
choo
l Gra
de,L
evel
of
Cou
rse,
and
Con
trol
Var
iabl
es
Mai
n E
ffec
ts M
odel
s
AB
C
Vari
able
sdf
Coe
ffic
ient
SE
Sig
nific
ance
Coe
ffic
ient
SE
Sig
nific
ance
Coe
ffic
ient
SE
Sig
nific
ance
Sta
ndar
dize
d C
oeff
icie
nt
Con
stan
t1
61.2
0.8
***
62.0
1.0
***
52.0
1.3
***
Hig
h sc
hool
scie
nce
grad
e1
4.6
0.2
***
4.8
0.2
***
2.5
0.2
***
0.16
Hig
h sc
hool
cour
se ty
peA
dvan
ced
plac
emen
t1
2.1
0.2
***
2.3
0.2
***
1.8
0.2
***
0.08
Hon
ors
1–0
.40.
20.
10.
2–0
.40.
2–0
.01
Reg
ular
1–2
.30.
2**
*–2
.40.
2**
*–1
.40.
2**
*–0
.04
Mea
n ho
me
valu
ein
$K
1In
clud
edIn
clud
edYe
ar in
col
lege
5In
clud
edIn
clud
edC
olle
ge c
ours
edi
scip
line
2In
clud
edIn
clud
edH
igh
scho
ol ty
pe2
Incl
uded
Incl
uded
Col
lege
cou
rse
ID12
2In
clud
edIn
clud
edH
ighe
st h
igh
scho
olm
ath
clas
sA
lgeb
ra 2
or
low
er–4
.20.
3**
*–0
.13
Pre
calc
ulus
–1.8
0.2
***
–0.0
8C
alcu
lus
10.
60.
3*
0.02
Cal
culu
s A
B2.
10.
2**
*0.
07C
alcu
lus
BC
3.4
0.4
***
0.07
Last
hig
h sc
hool
mat
h gr
ade
12.
80.
2**
*0.
19La
st h
igh
scho
olE
nglis
h gr
ade
11.
80.
2**
*0.
10Li
st-w
ise
dele
ted
516
904
943
Sam
ple
size
7,61
37,
225
7,18
6R
20.
110.
200.
28
* ≤
.05.
** ≤
.01.
***
≤.0
01.
unauthorized distribution.© 2007 National Association of Secondary School Principals. All rights reserved. Not for commercial use or
by guest on February 27, 2007 http://bul.sagepub.comDownloaded from
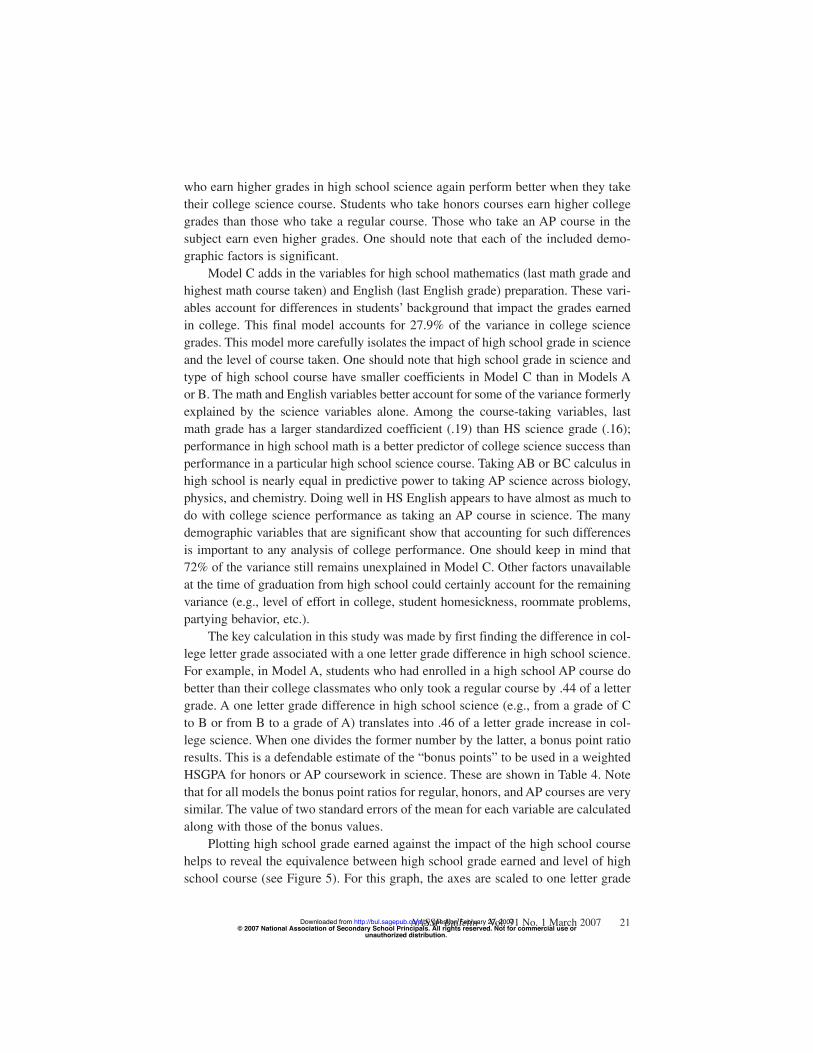
who earn higher grades in high school science again perform better when they taketheir college science course. Students who take honors courses earn higher collegegrades than those who take a regular course. Those who take an AP course in thesubject earn even higher grades. One should note that each of the included demo-graphic factors is significant.
Model C adds in the variables for high school mathematics (last math grade andhighest math course taken) and English (last English grade) preparation. These vari-ables account for differences in students’ background that impact the grades earnedin college. This final model accounts for 27.9% of the variance in college sciencegrades. This model more carefully isolates the impact of high school grade in scienceand the level of course taken. One should note that high school grade in science andtype of high school course have smaller coefficients in Model C than in Models Aor B. The math and English variables better account for some of the variance formerlyexplained by the science variables alone. Among the course-taking variables, lastmath grade has a larger standardized coefficient (.19) than HS science grade (.16);performance in high school math is a better predictor of college science success thanperformance in a particular high school science course. Taking AB or BC calculus inhigh school is nearly equal in predictive power to taking AP science across biology,physics, and chemistry. Doing well in HS English appears to have almost as much todo with college science performance as taking an AP course in science. The manydemographic variables that are significant show that accounting for such differencesis important to any analysis of college performance. One should keep in mind that72% of the variance still remains unexplained in Model C. Other factors unavailableat the time of graduation from high school could certainly account for the remainingvariance (e.g., level of effort in college, student homesickness, roommate problems,partying behavior, etc.).
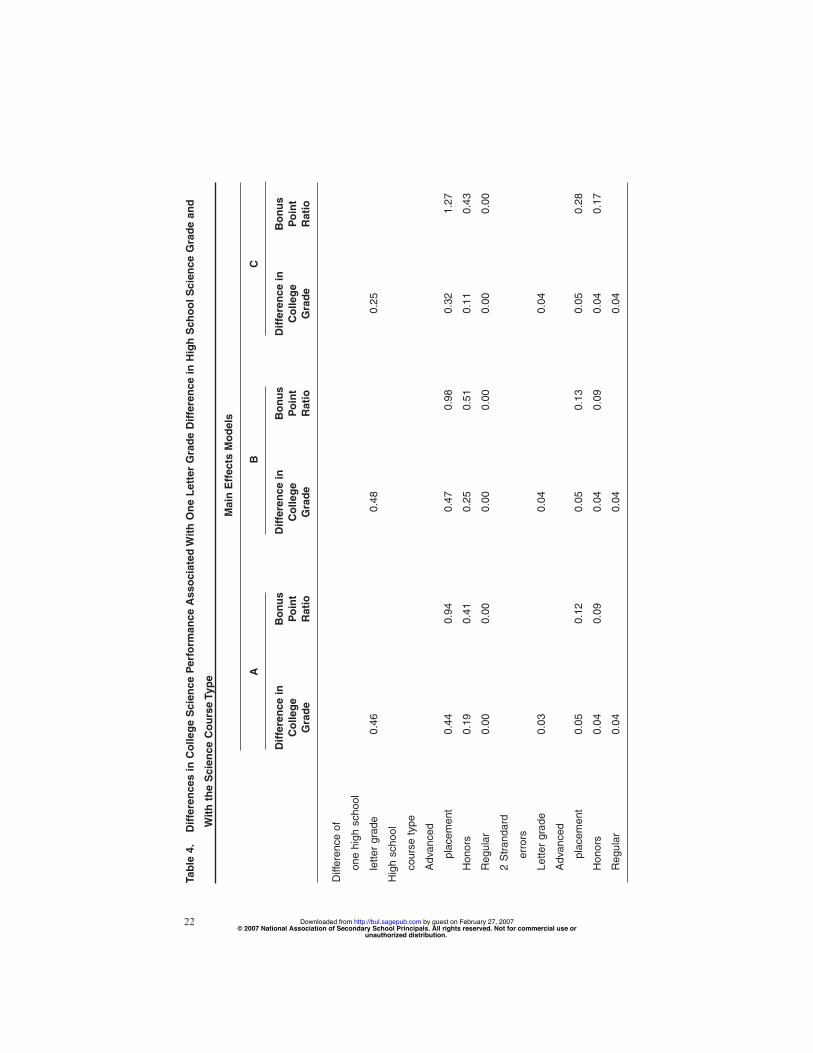
The key calculation in this study was made by first finding the difference in col-lege letter grade associated with a one letter grade difference in high school science.For example, in Model A, students who had enrolled in a high school AP course dobetter than their college classmates who only took a regular course by .44 of a lettergrade. A one letter grade difference in high school science (e.g., from a grade of Cto B or from B to a grade of A) translates into .46 of a letter grade increase in col-lege science. When one divides the former number by the latter, a bonus point ratioresults. This is a defendable estimate of the “bonus points” to be used in a weightedHSGPA for honors or AP coursework in science. These are shown in Table 4. Notethat for all models the bonus point ratios for regular, honors, and AP courses are verysimilar. The value of two standard errors of the mean for each variable are calculatedalong with those of the bonus values.
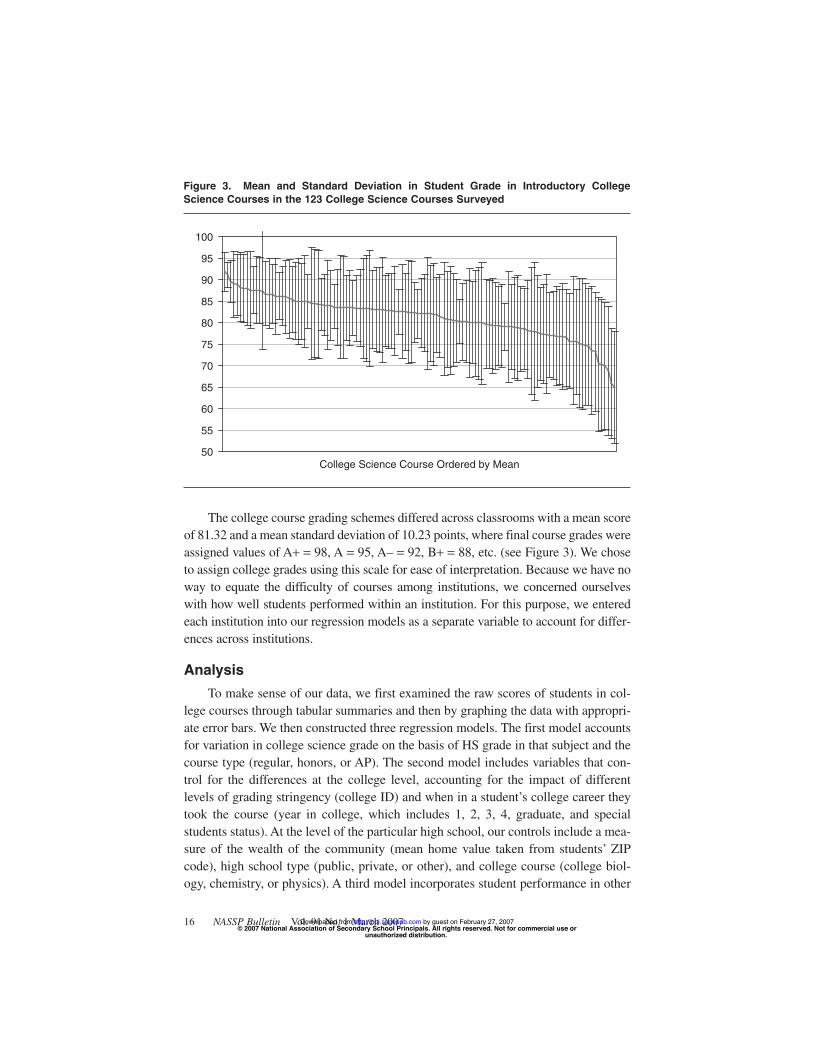
Plotting high school grade earned against the impact of the high school coursehelps to reveal the equivalence between high school grade earned and level of highschool course (see Figure 5). For this graph, the axes are scaled to one letter grade
NASSP Bulletin Vol. 91 No. 1 March 2007 21 unauthorized distribution.
© 2007 National Association of Secondary School Principals. All rights reserved. Not for commercial use or by guest on February 27, 2007 http://bul.sagepub.comDownloaded from
22
Tabl
e 4.
Diff
eren
ces
in C
olle
ge S
cien
ce P
erfo
rman
ce A
ssoc
iate
d W
ith O
ne L
ette
r G
rade
Diff
eren
ce in
Hig
h S
choo
l Sci
ence
Gra
de a
nd
With
the
Sci
ence
Cou
rse
Type
Mai
n E
ffec
ts M
odel
s
AB
C
Diff
eren
ce in
Bon
usD
iffer
ence
inB
onus
Diff
eren
ce in
Bon
usC
olle
geP
oint
Col
lege
Poi
ntC
olle
geP
oint
Gra
deR
atio
Gra
deR
atio
Gra
deR
atio
Diff
eren
ce o
f
one
high
sch
ool
lette
r gr
ade
0.46
0.48
0.25
Hig
h sc
hool
cour
se ty
pe
Adv
ance
d
plac
emen
t0.
440.
940.
470.
980.
321.
27
Hon
ors
0.19
0.41
0.25
0.51
0.11
0.43
Reg
ular
0.00
0.00
0.00
0.00
0.00
0.00
2 S
trand
ard
erro
rs
Lette
r gr
ade
0.03
0.04
0.04
Adv
ance
d
plac
emen
t0.
050.
120.
050.
130.
050.
28
Hon
ors
0.04
0.09
0.04
0.09
0.04
0.17
Reg
ular
0.04
0.04
0.04
unauthorized distribution.© 2007 National Association of Secondary School Principals. All rights reserved. Not for commercial use or
by guest on February 27, 2007 http://bul.sagepub.comDownloaded from
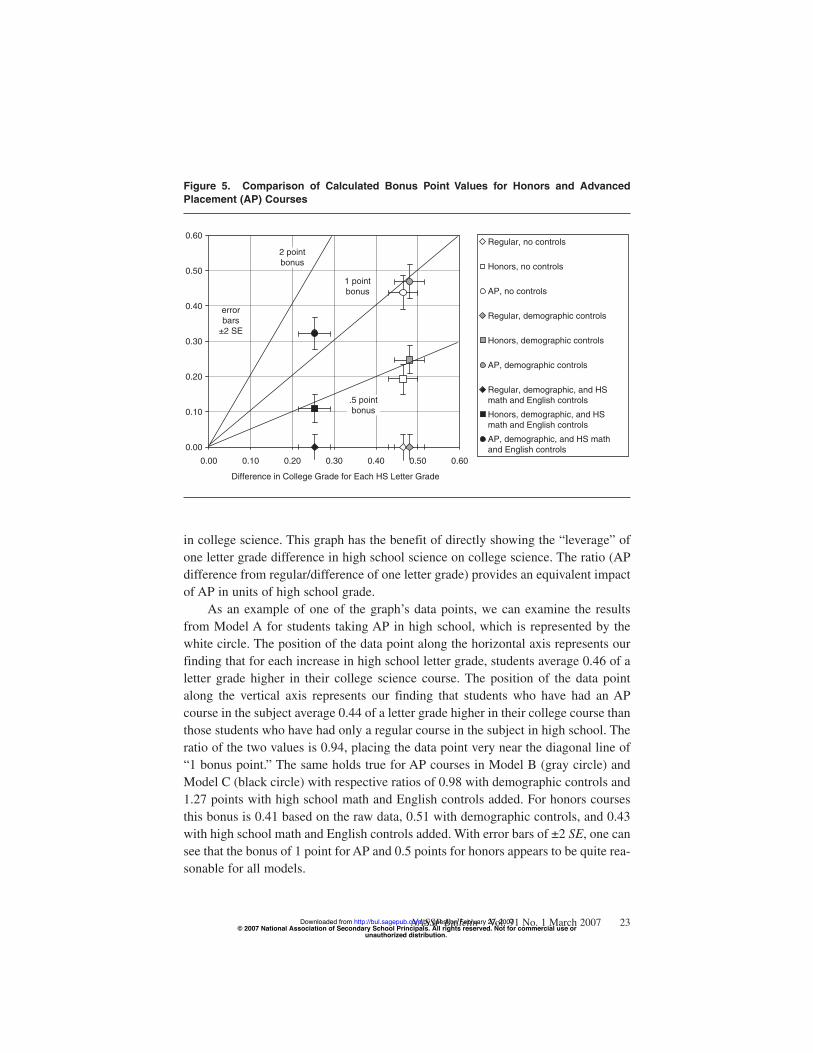
in college science. This graph has the benefit of directly showing the “leverage” ofone letter grade difference in high school science on college science. The ratio (APdifference from regular/difference of one letter grade) provides an equivalent impactof AP in units of high school grade.
As an example of one of the graph’s data points, we can examine the resultsfrom Model A for students taking AP in high school, which is represented by thewhite circle. The position of the data point along the horizontal axis represents ourfinding that for each increase in high school letter grade, students average 0.46 of aletter grade higher in their college science course. The position of the data pointalong the vertical axis represents our finding that students who have had an APcourse in the subject average 0.44 of a letter grade higher in their college course thanthose students who have had only a regular course in the subject in high school. Theratio of the two values is 0.94, placing the data point very near the diagonal line of“1 bonus point.” The same holds true for AP courses in Model B (gray circle) andModel C (black circle) with respective ratios of 0.98 with demographic controls and1.27 points with high school math and English controls added. For honors coursesthis bonus is 0.41 based on the raw data, 0.51 with demographic controls, and 0.43with high school math and English controls added. With error bars of ±2 SE, one cansee that the bonus of 1 point for AP and 0.5 points for honors appears to be quite rea-sonable for all models.
NASSP Bulletin Vol. 91 No. 1 March 2007 23
Figure 5. Comparison of Calculated Bonus Point Values for Honors and AdvancedPlacement (AP) Courses
0.00
0.10
0.20
0.30
0.40
0.50
0.60
0.00 0.10 0.20 0.30 0.40 0.50 0.60
Difference in College Grade for Each HS Letter Grade
Regular, no controls
Honors, no controls
AP, no controls
Regular, demographic controls
Honors, demographic controls
AP, demographic controls
Regular, demographic, and HSmath and English controls
Honors, demographic, and HSmath and English controls
AP, demographic, and HS mathand English controls
1 pointbonus
.5 pointbonus
2 pointbonus
errorbars
±2 SE
unauthorized distribution.© 2007 National Association of Secondary School Principals. All rights reserved. Not for commercial use or
by guest on February 27, 2007 http://bul.sagepub.comDownloaded from
Discussion
“It is better to take a tougher course and get a low grade than to take an easycourse and get a high grade” opined Senior Research Analyst Clifford Adelman (Lee,1999, p. 6). This view is echoed in other reports as well: “One of the best predictorsof success is taking rigorous high school classes. Getting good grades in lower-levelclasses will not prepare students for college-level work” (Venezia, Kirst, & Antonio,2003, p. 31; Rose & Betts, 2001). We have attempted to gauge the truth of these state-ments. Is it really better to earn a D in an AP course than an A in a regular course?Do students get anything out of a high-level course for which they are unprepared andas a result earn a low grade?
We find that on average, students who take an AP or honors science course inhigh school perform better in a follow-up college science course. However, our studyshows that there is a limit to the apparent value of AP and honors courses over reg-ular science courses. On average, students who end their high school years with a Bin an AP course do not do better in the college subject than those who earn an A inthe regular course. Those who earn a C in AP science do significantly worse thanthose who earn an A in a regular science course. This raises a troubling concern.Most students who take an AP course enroll in it only after taking a regular highschool course in the subject. For students who earn a whole letter grade less in APscience than in their regular course, there appears to be no apparent benefit whenpredicting their college science grade. As an example, a student who earns an A inregular chemistry and goes on to earn a B in AP chemistry may perform no betterthan a student who stops with the A in regular chemistry. For students who start inan honors chemistry course, the difference is half a letter grade.
The fact that Model C is most predictive of college science grades is an impor-tant finding. Standardized coefficients for math and English variables in this modelare of a larger magnitude than that for science courses. In particular, performance inHS mathematics is more connected than doing well in HS science to performance incollege science. AP calculus courses and AP science courses have nearly the samestandardized coefficients; they are equally associated with performance in collegescience. These findings agree with research showing that quantitative skills areessential to good performance in college science (Marsh & Anderson, 1989).
Should this study be interpreted as proving that AP and honors courses areeffective at preparing students for college science? No, this is not the view we wishto promote. It is only that among students who take college science, those with hon-ors and AP courses in their backgrounds do significantly better. This may be formany reasons, and the difference in college grade between those with different levelsof high school courses is small.
One of the pressures on schools to give bonus points for honors and AP coursesis that grade inflation has compressed the scale of HSGPAs at the high end; 18% of
24 NASSP Bulletin Vol. 91 No. 1 March 2007 unauthorized distribution.
© 2007 National Association of Secondary School Principals. All rights reserved. Not for commercial use or by guest on February 27, 2007 http://bul.sagepub.comDownloaded from
seniors had an A average in 1968 versus 47% in 2004 (Cooperative InstitutionalResearch Program, 2005; Kirst & Bracco, 2004). The inclusion of bonus pointshelps to increase the spread of HSGPAs, aiding colleges in making judgmentsamong competing candidates.
Many high schools offer science courses that are taught by teachers who areunderqualified. Nationally, 38% of the life science students (middle school life scienceand high school biology) and 56% of physical science students (middle school earthscience and physical science and high school chemistry and physics) are taught byteachers without a major or minor in that field (Ingersoll, 1999). We did not control forteacher background in this study. Because better prepared teachers generally gravitatetoward the AP and honors courses, the apparent advantage of these higher level coursesmay result, at least in part, from more talented or more highly experienced teachersrather than from the more rigorous standards or faster pace.
We find that SES is a factor. Why? AP courses are much more common in moreaffluent schools. Students in AP courses in less affluent areas may have to deal withthe fact that such course taking is more rare in their school and may conflict withsome of the ways in which they relate to their friends, causing social isolation.Students could be under adverse social stress because they study more than peers inregular courses (Ferguson, 2001).
Teachers of AP courses can have difficulty maintaining standards because othersmay judge their effectiveness by the fraction of students who earn a 3, 4, or 5 on theAP exam (Lurie, 2000). The CEEB recently announced that it will now audit all APcourses to ensure that all courses meet their high standards. Some are AP courses inname only, not offering a fast pace or rigorous standards (Honowar, 2005). No suchaudit for honors courses exists. Venezia et al. (2003) told of a school system that redes-ignated each of its courses as honors courses—while making no changes in rigor—when hearing that the University of Georgia gave extra weight to honors courses.
This study involves a policy issue that concerns students, parents, teachers, andadministrators. We have constructed our models to account for information available atthe end of a student’s senior year and not information that would be available to collegeadmissions officers. In some school districts, decisions concerning GPA, RIC, and classhonors are made at the school level by teachers and principals. More commonly, districtadministrators and boards of education must wrestle with these issues particularlybecause they have a wide impact on individuals and institutions. In some cases, the issueis so charged that students, teachers, parents, and administrators all desire to sway thedecision of the school board (Papadonis, 2006). School administrators must balance thedesire of most individual students (and their parents) to maximize their appeal to post-secondary institutions against the collective reputation of their own school (Attewell,2001). Weighted HSGPA allows exceptional students to stand out more prominently tocolleges, whereas a policy of nonweighting tends to benefit students who do not takeadvanced courses when applying to colleges that do not recalculate HSGPA.
NASSP Bulletin Vol. 91 No. 1 March 2007 25 unauthorized distribution.
© 2007 National Association of Secondary School Principals. All rights reserved. Not for commercial use or by guest on February 27, 2007 http://bul.sagepub.comDownloaded from
High school principals who wish to influence policies concerning HSGPA cal-culation, RIC, and the award of honors should consider the data presented here attwo levels, school and district. At the school level, it is wise to acknowledge that therecognition of students through high HSGPA, RIC, or honors is a scarce resource inan educational system where access to financial aid or admission to prestigiousschools is at stake. Colleges are driven to select students who will best succeed intheir classrooms. Our study presents evidence that students who take more advancedcoursework in high school perform better in their introductory college courses. Highschool faculty and staff should consider whether they wish to help make the difficultdistinction between students through a uniform HSGPA policy or not. If they do notmake these judgments, they defer to college admissions officers who will attempt tomake distinctions between applicants with whatever tools they have at hand. At thedistrict level, empirical data concerning the impact of high school course taking oncollege performance are rare as anecdotes from teachers who speak to formerstudents or parents’ perceptions offer little in the way of generalizable evidence. Ourstudy can be used to advocate for more advanced level courses in high school butonly for the population of students who can perform well in them. We see no evi-dence that students who enroll and do poorly in honors or AP courses (i.e., below C)benefit when they later enroll in college. This study also argues for students to bewell rounded in English and mathematics if they wish to pursue science and engi-neering careers.
ConclusionWe find that the common practice of adding bonus points for AP and honors
courses taken in high school when calculating HSGPA is supported. Those studentstaking these more advanced courses perform better in their college science courses.There is a large difference between AP and honors in their predicted impact on col-lege grades, with honors courses valued at about half the level of AP courses. Thus,we find no support for these courses to be valued equally. We find strong support forhigh schools to calculate weighted grade point averages and assign RIC and honorsbased on these measures.
Performance in college science also appears to have a substantial connection topreparation in high school mathematics and English. We have investigated theserelationships for science courses only and have no evidence to support or refute theawarding of bonus points for nonscience AP or honors courses.
ReferencesAdelman, C. (1999). Answers in the toolbox: Academic intensity, attendance patterns,
and bachelor’s degree attainment (PLLI 1999-8021). Washington, DC: U.S.Department of Education, Office of Educational Research and Improvement.
26 NASSP Bulletin Vol. 91 No. 1 March 2007 unauthorized distribution.
© 2007 National Association of Secondary School Principals. All rights reserved. Not for commercial use or by guest on February 27, 2007 http://bul.sagepub.comDownloaded from

Alder, H. L. (1984). How colleges and universities employ credit and placementfor advanced academic studies. New York: Annual Meeting of the CollegeScholarship Service Assembly. (ERIC Document Reproduction Service No.ED 263 842)
Attewell, P. (2001). The winner-take-all high school: Organizational adaptationsto educational stratification. Sociology of Education, 74, 267-295.
Bassiri, D., & Shulz, E. M. (2003). Constructing a universal scale of high schoolcourse difficulty. Journal of Educational Measurement, 40, 147-161.
Beckman, P. (1971). A history of pi. Boulder, CO: Golem Press.Bradburn, N. M., Rips, L. J., & Shevell, S. K. (1987). Answering autobiographi-
cal questions: The impact of memory and inference on surveys. Science,236(4798), 157-161.
Breeland, H., Maxey, J., Gernand, R., Cumming, T., & Trapani, C. (2002). Trendsin college admission 2000: A report of a national survey of undergraduateadmission policies, practices, and procedures. Retrieved December 1, 2006,from http://www.airweb.org/images/trendsreport.pdf
Bridgeman, B., & Lewis, C. (1996). Gender differences in college mathematicsgrades and SAT-M scores: A reanalysis of Wainer and Steinberg. Journal ofEducational Measurement, 33, 257-270.
Bridgeman, B., McCamley-Jenkins, L., & Ervin, N. (2000). Prediction of fresh-man grade-point average from the revised and recentered SAT I: Reasoningtest (CEEB Research Report No. 2000-1). New York: College EntranceExamination Board.
Bridgeman, B., & Wendler, C. (1991). Gender differences in predictors of collegemathematics performance and in college mathematics course grades. Journalof Educational Psychology, 83, 275-284.
Burdinan, P. (2000). Extra credit, extra criticism. Black Issues in HigherEducation, 17(18), 28-33.
Burton, N. W., & Ramist, L. (2001). Predicting long term success in undergrad-uate school: A review of predictive validity studies. Princeton, NJ: EducationalTesting Service.
Cahow, C. R., Christensen, N. L., Gregg, J. R., Nathans, E. B., Strobel, H. A., &Williams, G. W. (1979). Undergraduate Faculty Council of Arts and Sciences,Committee on Curriculum, Subcommittee on Advanced Placement report.Durham, NC: Duke University.
Camara, W., Dorans, N. J., Morgan, R., & Myford, C. (2000). Advanced placement:Access not exclusion. Education Policy Analysis Archives, 8(40). RetrievedDecember 1, 2006, from http://epaa.asu.edu/epaa/v8n40.html
Camara, W. J., & Michaelides, M. (2005). AP use in admissions: A response toGeiser and Santelices. Retrieved September 21, 2005, from www.college-board.com/research/pdf/051425Geiser_050406.pdf
NASSP Bulletin Vol. 91 No. 1 March 2007 27 unauthorized distribution.
© 2007 National Association of Secondary School Principals. All rights reserved. Not for commercial use or by guest on February 27, 2007 http://bul.sagepub.comDownloaded from
Capasso, J. C. (1995). Grade weighting: Solution to disparity, or creator ofdespair? NASSP Bulletin, 79(568), 100-102.
Chamberlain, P. C., Pugh, R. C., & Shellhammer, J. (1978). Does advanced placementcontinue through the undergraduate years? College & University, 53, 195-200.
Cognard, A. M. (1996). The case for weighting grades and waiving classes forgifted and talented high school students. Storrs: National Research Center onthe Gifted and Talented, University of Connecticut.
College Entrance Examination Board. (1998). Interpreting and using AP grades.New York: Author.
College Entrance Examination Board. (2005a). 2005-2006 AP fact sheet. New York:Author.
College Entrance Examination Board. (2005b). Student grade distributions. New York:Author.
Cooperative Institutional Research Program. (2005). The American freshman:National norms for fall 2004. Los Angeles: Author.
Dexter, K. M., Tai, R. H., & Sadler, P. M. (2006). Traditional and block schedul-ing for college science preparation: A comparison of college science successof students who report different high school scheduling plans. The HighSchool Journal, 89(4), 22-33.
Dillon, D. H. (1986). The advanced placement factor. Journal of CollegeAdmission, 113, 14-17.
Downs, G. C. (2000). Weighted grades: A conundrum for secondary schools(Occasional Paper No. 35). Orono: University of Maine, Center for Researchand Evaluation.
Dougherty, C., Mellor, L., & Jian, S. (2006). The relationship between advancedplacement and college graduation. Austin, TX: National Center forEducational Accountability.
Dupuis, J. (1999). California lawsuit notes unequal access to AP courses.Rethinking Schools Online, 14(1). Retrieved December 8, 2006, fromhttp: / /www.rethinkingschools .org/cgi-bin/hse/HomepageSearchEngine.cgi?url=http://www.rethinkingschools.org/archive/14_01/caap141.shtml;geturl=d+highlightmatches+gotofirstmatch;terms=dupuis;enc=dupuis;utf8=on;noparts#firstmatch
Ferguson, R. (2001). A diagnostic analysis of Black-White GPA disparities inShaker Heights, Ohio (Brookings Papers on Education Policy). Washington,DC: Brookings Institution.
Gallager,A. M., & Kaufman, J. C. (2005). Gender differences in mathematics: An inte-grative psychological approach. Cambridge, UK: Cambridge University Press.
Geiser, S., & Santelices, V. (2004). The role of advanced placement and honorscourses in college admissions. Retrieved December 8, 2006, from http://repositories.cdlib.org/cshe/CSHE-4-04/
28 NASSP Bulletin Vol. 91 No. 1 March 2007 unauthorized distribution.
© 2007 National Association of Secondary School Principals. All rights reserved. Not for commercial use or by guest on February 27, 2007 http://bul.sagepub.comDownloaded from

Goldman, R. D., & Sexton, D. W. (1974). Archival experiments with collegeadmissions policies. American Educational Research Journal, 11, 195-201.
Groves, R. M. (1989). Survey errors and survey costs. New York: John Wiley.Hawkins, D. A., & Clinedinst, M. (2006). State of college admission 2006.
Alexandria, VA: National Association for College Admission Counseling.Herr, N. (1991a). The influence of program format on the professional develop-
ment of science teachers: A within-subjects analysis of the perceptions ofteachers who have taught AP and honors science to comparable student popu-lations. Science Education, 75, 619-621.
Herr, N. (1991b). Perspectives and policies regarding advanced placement andhonors coursework. College & University, 62(2), 47-54.
Herr, N. (1992). A comparative analysis of the perceived influence of advancedplacement and honors programs upon science instruction. Journal of Researchin Science Teaching, 29, 521-532.
Herr, N. (1993). National curricula for advanced science classes in American highschools? The influence of the College Board’s advanced placement programon science curricula. International Journal of Science Education, 15, 297-306.
Hershey, S. W. (1990). College admission practices and the advanced placementprogram. Journal of College Admission, 128, 8-11.
Honowar, V. (2005). To maintain rigor, College Board to audit all AP courses.Education Week, 24(3), 8-10.
Hout, M. (2005). Berkeley’s comprehensive review method for making freshmenadmission decisions: An assessment. Retrieved December 8, 2006, fromwww.berkeley.edu/news/media/releases/2005/05/16_houtreport.pdf
Ingersoll, R. M. (1999). The problem of underqualified teachers in American sec-ondary schools. Educational Researcher, 28(2), 26-37.
Jones, J. Q. (1975). Advanced placement—Taking a hard look. NASSP Bulletin,59(393), 64-69.
Kirst, M. W., & Bracco, K. R. (2004). Bridging the great divide: How the K-12 andpost-secondary split hurts students, and what can be done about it. In M. W. Kirst& A. Venezia (Eds.), From high school to college: Improving opportunities forsuccess in post-secondary education (pp. 1-30). San Francisco: Jossey-Bass.
Klopfenstein, K. (2004). The advanced placement expansion of the 1990s: How didtraditionally underserved students fare? Education Policy Analysis Archives,12(68). Retrieved December 1, 2006, from http://epaa.asu.edu/epaa/v12n68/
Klopfenstein, K., & Thomas, K. M. (2005). The advanced placement per-formance advantage: Fact or fiction? Retrieved December 1, 2006, fromhttp://www.aeaweb.org/annual_mtg_papers/2005/0108_1015_0302.pdf
Kuncel, N. R., Credé, M., & Thomas, L. L. (2005). The validity of self-reportedgrade point averages, RICs, and test scores: A meta-analysis and review of theliterature. Review of Educational Research, 75(1), 63-82.
NASSP Bulletin Vol. 91 No. 1 March 2007 29 unauthorized distribution.
© 2007 National Association of Secondary School Principals. All rights reserved. Not for commercial use or by guest on February 27, 2007 http://bul.sagepub.comDownloaded from
Lang, D. (1997). Accurate and fair RICs: One step closer with the RIC Index.ERS Spectrum, 15(3), 26-29.
Lee, F. G. (1999). Improving the validity of law school admissions: A pre-law cur-riculum. Retrieved December 1, 2006, from http://www.napla.org/spring%2099.htm
Lichten, W. (2000). Whither advanced placement? Education Policy AnalysisArchives, 8(29). Retrieved December 8, 2006, from http://epaa.asu.edu/epaa/v8n29.html
Lockhart, E. (1990). Heavy grades. Journal of College Admission, 126, 9-16.Lurie, M. N. (2000). AP U.S. history: Beneficial or problematic? The History
Teacher, 33, 521-525.MacVicar, R. (1988). Advanced placement: Increasing efficiency in high school-
university articulation. Phoenix: Arizona Board of Regents. (ERIC DocumentReproduction Service No. ED 306 835)
Marsh, J. F., & Anderson, N. D. (1989). An assessment of the quantitative skillsof students taking introductory college biology courses. Journal of Researchin Science Teaching, 26, 757-769.
Morgan, R., & Ramist, L. (1998). Advanced placement students in college: Aninvestigation of course grades at 21 colleges (ETS Report No. SR-98-13).Princeton, NJ: Educational Testing Service.
National Research Council. (2002). Learning and understanding: Improvingadvanced study of mathematics and science in U.S. high schools. Washington,DC: National Academies Press.
Niemi, R. G., & Smith, J. (2003). The accuracy of students’ reports of course tak-ing in the 1994 National Assessment of Educational Progress. EducationalMeasurement: Issues and Practice, 22(1), 15-21.
Nyberg, A. (1993). High school and the advanced placement program in nurtur-ing potential. In Proceedings of the Society for the Advancement of GiftedEducation annual conference (pp. 47-51). Calgary, Canada: Centre for GiftedEducation, the University of Calgary.
Papadonis, J. (2006). Weighted GPA Committee report. Retrieved December 1,2006, from http://lhs.lexingtonma.org/w_gpa_rep.pdf
Phillips Academy. (1952). General education in school and college; a committeereport by members of the faculties of Andover, Exeter, Lawrenceville, Harvard,Princeton, and Yale. Cambridge, MA: Harvard University Press.
Pushkin, D. B. (1995). The AP exam and the introductory college course. ThePhysics Teacher, 33, 532-535.
Rose, H., & Betts, J. R. (2001). Math matters: The link between highs schoolcurriculum, college graduation, and earnings. San Francisco: Public PolicyInstitute of California.
30 NASSP Bulletin Vol. 91 No. 1 March 2007 unauthorized distribution.
© 2007 National Association of Secondary School Principals. All rights reserved. Not for commercial use or by guest on February 27, 2007 http://bul.sagepub.comDownloaded from
Rothschild, E. (1999). Four decades of the advanced placement program. TheHistory Teacher, 32, 175-206.
Ruch, C. (1968). A study of the collegiate records of advanced placement andnon-advanced placement students. College & University, 44, 207-210.
Rutledge, B. (1991). An alternative to ranking high school students. Journal ofCollege Admission, 133, 5-6.
Sadler, P. M., & Tai, R. H. (2001). Success in college physics: The role of highschool preparation. Science Education, 85, 111-136.
Seyfert, W. (1981). Rank-in-class—Another look at the guidelines. CurriculumReport, 11(1), 1-13.
Schneider, B. (2003). Strategies for success: High school and beyond. In D.Ravitch (Ed.), Brookings papers on education policy (pp. 55-93). Washington,DC: Brookings Institution.
Tai, R. H., Sadler, P. M., & Loehr, J. F. (2005). Factors influencing success inintroductory college chemistry. Journal of Research in Science Teaching, 42,987-1012.
Tai, R. H., Sadler, P. M., & Mintzes, J. (2006). Factors influencing college sciencesuccess. Journal of College Science Teaching, 36(1), 52-56.
Tai, R. H., Ward R. B., & Sadler, P. M. (2006). High school chemistry contentbackground of introductory college chemistry students and its association withcollege chemistry grades. Journal of Chemical Education, 83, 1703-1711.
Talley, N. R. (1989). The effect of weighted averages on private four-year under-graduate college admissions in the United States. Unpublished Ed.D. disser-tation, Hofstra University.
Thompson, G. L., & Joshua-Shearer, M. (2002). In retrospect: What collegeundergraduates say about their high school education. The High SchoolJournal, 85(5), 1-15.
Thorndike, R. M. (1997). Measurement and evaluation in psychology and educa-tion (6th ed.). Columbus, OH: Merrill.
Venezia, A., & Kirst, M. W. (2005). Inequitable opportunities: How current edu-cation systems and policies undermine the chances for student persistence andsuccess in college. Educational Policy, 19, 283-307.
Venezia, A., Kirst, M. W., & Antonio, A. L. (2003). Betraying the college dream:How disconnected K-12 and postsecondary education systems underminestudent aspirations. Retrieved December 1, 2006, from http://www.stanford.edu/group/bridgeproject/betrayingthecollegedream.pdf
Vickers, J. M. (2000). Justice and truth in grades and their averages. Research inHigher Education, 41, 141-164.
Wainer, H., & Steinberg, L. S. (1992). Sex differences in performance on themathematics section of the Scholastic Aptitude Test: A bidirectional validitystudy. Harvard Educational Review, 62, 323-335.
NASSP Bulletin Vol. 91 No. 1 March 2007 31 unauthorized distribution.
© 2007 National Association of Secondary School Principals. All rights reserved. Not for commercial use or by guest on February 27, 2007 http://bul.sagepub.comDownloaded from