Embed Size (px)
Citation preview

ENERGY CONFERENCEOctober 2, 2012 / New Orleans, LA
W. Cardon GernerSr. Vice President & CFOSr. Vice President & CFO
Oceaneering International, Inc.
Safe Harbor Statement
Statements we make in this presentation that express a belief, expectation, or intention are forward looking. Forward-looking statements are generally accompanied by words such as “estimate,” “project,” “predict,” “believe,” “expect,” “anticipate,” “plan,” “forecast,” “budget,” “goal,” or other words that convey the uncertainly of future events orother words that convey the uncertainly of future events or outcomes. These forward-looking statements are based on our current information and expectations that involve a number of risks, uncertainties, and assumptions. Among the factors that could cause the actual results to differ materially from those indicated in the forward-looking statements are: industry conditions, prices of crude oil and natural gas, our ability to obtain and the timing of new projects and changesability to obtain and the timing of new projects, and changes in competitive factors. Should one or more of these risks or uncertainties materialize, or should the assumptions underlying the forward-looking statements prove incorrect, actual outcomes could vary materially from those indicated.
For additional information regarding these and other factors, g g ,see our periodic filings with the Securities and Exchange Commission, including our most recent Reports on Forms 10-K and 10-Q.

WHY OII?
• Leveraged to Deepwater and Subsea Completions• Leveraged to Deepwater and Subsea Completions
– Secular Growth– Secular Growth
• Leading Market Positions
ROVs and Specialty Subsea Products
• Leading Market Positions
ROVs and Specialty Subsea Products– ROVs and Specialty Subsea Products
• Good Project Execution
– ROVs and Specialty Subsea Products
• Good Project ExecutionGood Project Execution
• Excellent Earnings, Liquidity and Cash Flow
Good Project Execution
• Excellent Earnings, Liquidity and Cash Flowg , q yg , q y

Leveraged to Deepwater
• Projects Take Years to Develop• Projects Take Years to Develop
• Largely Oil Reservoirs• Largely Oil Reservoirs
– With High Production Flow Rates– With High Production Flow Rates
• Well Capitalized Customer Base• Well Capitalized Customer Base
• Investment Based on Long-Term Commodity Price• Investment Based on Long-Term Commodity Price

Long-Term Deepwater Outlook
• Largest Source of Future Supply Growth
• Exploration Success Bodes Well for the FutureExploration Success Bodes Well for the Future
• Drilling Intensity is Rising
Source: ExxonMobil, Wood Mackenzie and Deutsche Bank

Earnings Per Share Guidance2012 Estimate $2 55-$2 65Earnings Per Share Guidance2012 Estimate $2 55-$2 65
$3.00Actual Low Estimate High Estimate
2012 Estimate $2.55 $2.652012 Estimate $2.55 $2.65
$
$2.50
$3.00
are
$1.50
$2.00
ngs
per S
ha
$0.50
$1.00
Earn
in
$0.002008 2009 2010 2011 2012E
OII 2012 Guidance Range as of July 25, 2012

Combined EPS – OSX CompaniesExcluding OIICombined EPS – OSX CompaniesExcluding OII
$75Actual Consensus Estimate
Excluding OIIExcluding OII
$60
$75
are
$30
$45
ngs
per S
ha
$15
$30
Earn
in
$02008 2009 2010 2011 2012E
Based on First Call Actuals and Mean Estimates as of July 31, 2012

Relative EPS PerformanceTo Recent 2008 OSX PeakRelative EPS PerformanceTo Recent 2008 OSX PeakTo Recent 2008 OSX PeakTo Recent 2008 OSX Peak
60%
OII OSX w/o OII
40%
60%
0%
20%
-40%
-20%
-60%2008 2009 2010 2011 2012E
Based on First Call Actuals and Mean Estimates as of July 31, 2012

2012 EPS Guidance The Big Picture2012 EPS Guidance The Big PictureThe Big PictureThe Big Picture
SEGMENT OPERATING INCOMESEGMENT OPERATING INCOMESEGMENT OPERATING INCOME
ROV > 2011
SEGMENT OPERATING INCOME
ROV > 2011
Subsea Products > 2011Subsea Products > 2011
Subsea Projects > 2011
Asset Integrity > 2011
Subsea Projects > 2011
Asset Integrity > 2011
Advanced Tech > 2011Advanced Tech > 2011

Field Support Vessel Services ContractBP Angola – Blocks 18 and 31
• Project Management & EngineeringThree Years from Febr ar 1 2012
• Project Management & EngineeringThree Years from Febr ar 1 2012
BP Angola Blocks 18 and 31
– Three Years from February 1, 2012
• Two Chartered Vessels
– Three Years from February 1, 2012
• Two Chartered Vessels– Ocean Intervention III– Bourbon Oceanteam 101– Ocean Intervention III– Bourbon Oceanteam 101
• BP Options– Two, 1-Year Periods
• BP Options– Two, 1-Year Periods– Third Vessel– Third Vessel

AGR Field Operations Acquisition
• Closed December 2011• Closed December 2011
Acquisition
• Expanded Asset Integrity Management Business
• Expanded Asset Integrity Management BusinessManagement Business– Particularly in Norway
Management Business– Particularly in Norway
• Added Subsea Inspection Tooling
• Established Subsea Engineering
• Added Subsea Inspection Tooling
• Established Subsea EngineeringEstablished Subsea Engineering & Field Operations Presence in Australia
Established Subsea Engineering & Field Operations Presence in Australia

Excellent Cash Flow & Liquidity
• At Least $565 MM of EBITDA Expected in 2012• At Least $565 MM of EBITDA Expected in 2012– $489 MM in 2011– $489 MM in 2011
• Ample Resources to Invest in GrowthAt June 30, 2012:
• Ample Resources to Invest in GrowthAt June 30, 2012:
– $86 MM Cash– $125 MM Debt
$
– $86 MM Cash– $125 MM Debt
$– $1.6 B Equity– $1.6 B Equity
EBITDA Reconciliation to Net Income is in Supplemental Financial Information Slides

Plans For Cash
• Investments• Investments– Organic Growth– Acquisitions– Organic Growth– Acquisitions
• Regular Quarterly Dividend• Regular Quarterly Dividend
• Share Repurchases• Share Repurchases

Acquisition Targets
• Within Our Market Niches• Within Our Market Niches
– Expand Subsea Products– Expand Subsea Products
• International Focus• International Focus
• Reasonably Priced• Reasonably Priced

Remotely Operated VehiclesRevenue by Business SegmentRemotely Operated VehiclesRevenue by Business Segment
32%
Revenue by Business SegmentRevenue by Business Segment
YTD June 2012

Floating Rig Demand
300268
250
300
Rig
s
200
d Fl
oatin
g R
150
Con
trac
ted
100
C
*Source: IHS-Petrodata at June 30, 2012
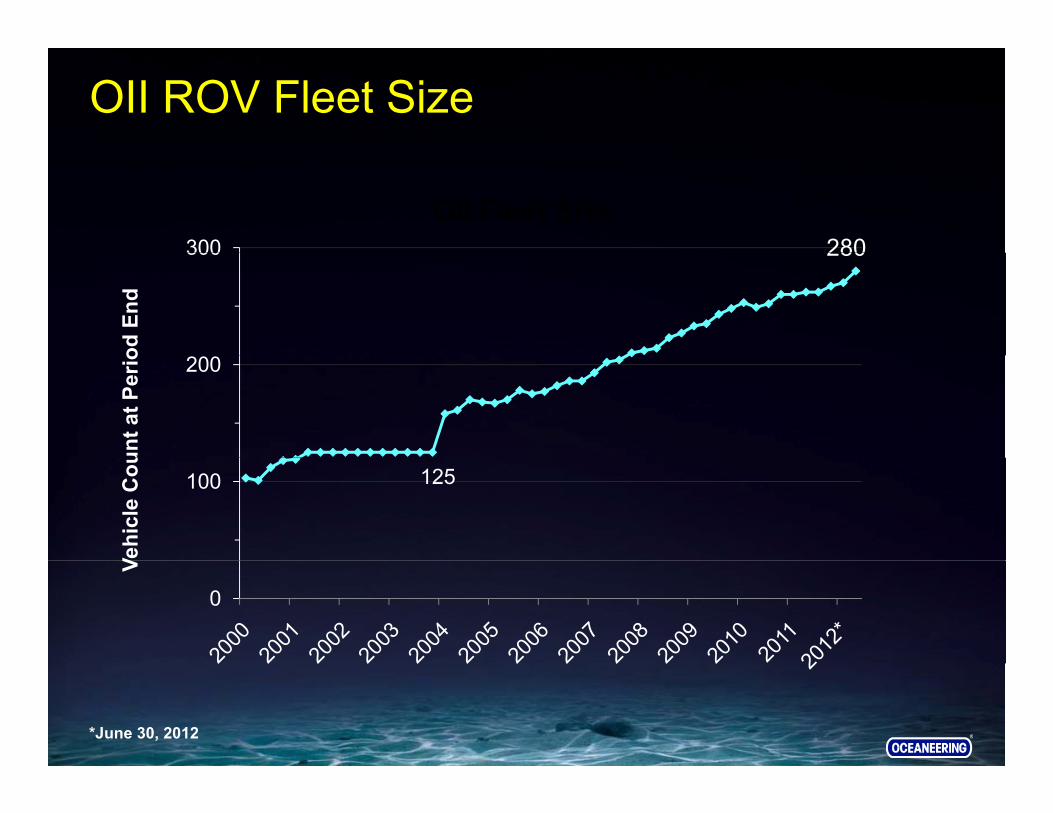
OII ROV Fleet Size
280300OII Fleet Size
280300
od E
nd
200
unt a
t Per
io
125100
Vehi
cle
Cou
0
V
*June 30, 2012

High-Spec, Non-PBR Brazil Rig FleetJune 30 2012 StatusJune 30, 2012 Status
• 94 Existing Rigs
– OII ROV Contracts on 73%
• 57 Rigs On Order
– Visibility of >60% Rig Fleet Growth– OII Expects to Continue as Dominant ROV Provider
• OII ROV Contracts on 10 of 11 Awards• 46 Remaining ROV Contract Opportunities
Source: IHS-Petrodata Data & OII Estimates

Outlook for ROV Demand on Vessels
3.5 3:1
2.5
3.0
atin
g R
ig
2:1
1.5
2.0
OV
s pe
r Flo
If the recent trend ratio of ≈ 3 ROVs per rig persists,
2:1
0.5
1.0
Glo
bal R
O p g p ,future ROV demand to support vessel-based activities may grow by more than 180 vehicles
0.0more than 180 vehicles.
Source: Oceaneering Estimates and IHS-Petrodata
Year End

ROV Pricing and Fleet UtilizationROV Pricing and Fleet Utilization
100%$11,000Revenue / Day on Hire Fleet Utilization
90%
100%
$9,000
$11,000
70%
80%
$5 000
$7,000
60%
70%
$3,000
$5,000
50%$1,000*
* YTD June 2012

2012 ROV Overview
• Increase in Days On Hire• Increase in Days On Hire– Higher Demand
– Expect to Add 25 to 30 New Systems
– Higher Demand
– Expect to Add 25 to 30 New Systems25 to 30 New Systems
Sli htl Hi h M i
25 to 30 New Systems
Sli htl Hi h M i• Slightly Higher Margin– Additional Days on Hire
• Slightly Higher Margin– Additional Days on Hire
– Change in Geographic Mix– Change in Geographic Mix
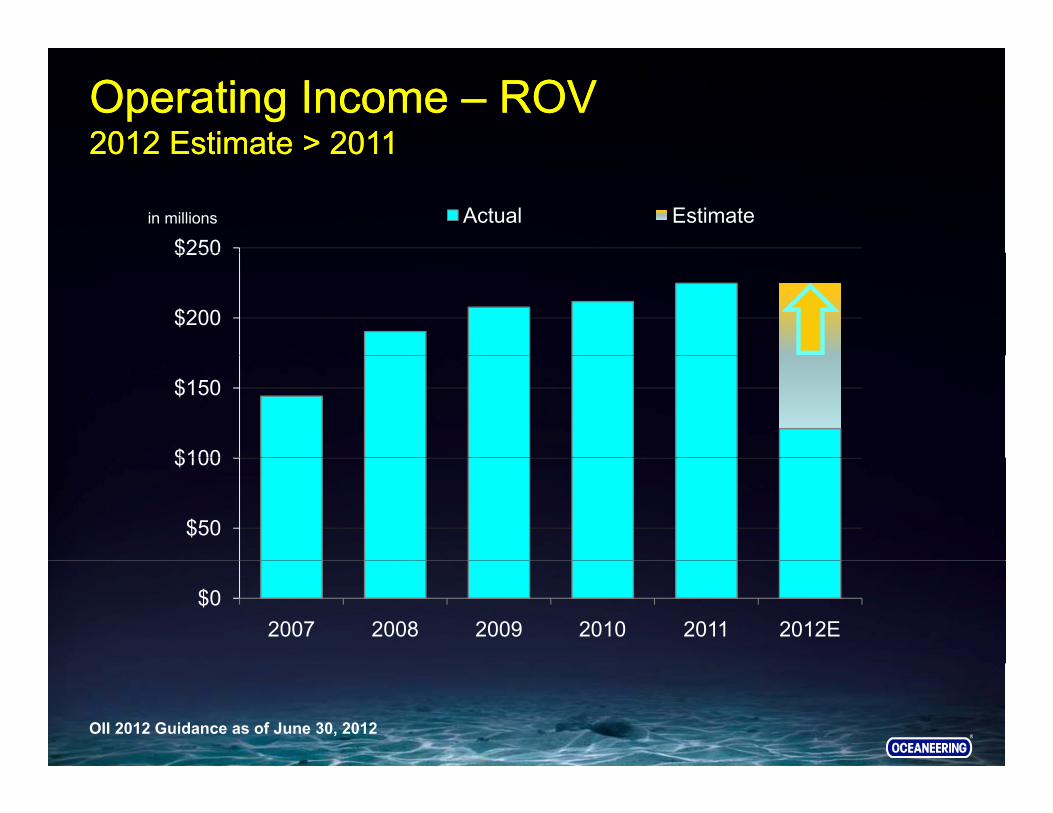
Operating Income – ROV2012 Estimate > 2011Operating Income – ROV2012 Estimate > 2011
$250in millions Actual Estimate
2012 Estimate 2011 2012 Estimate 2011
$200
$250
$100
$150
$50
$100
$02007 2008 2009 2010 2011 2012E
OII 2012 Guidance as of June 30, 2012

Worldwide Subsea CompletionsThis Decade Expected to Grow ≈45%Worldwide Subsea CompletionsThis Decade Expected to Grow ≈45%
5000Completed Estimated
This Decade Expected to Grow 45% This Decade Expected to Grow 45%
4000
5000
ompl
etio
ns 4448
2000
3000
Subs
ea C
o
1000
2000
Num
ber o
f
090s 00s 10s
N
Source: Quest Offshore Resources – June 2012

Subsea Tree OrdersForecast at Historically High LevelsSubsea Tree OrdersForecast at Historically High LevelsForecast at Historically High LevelsForecast at Historically High Levels
1,000
750
1,000
ers
> 75% Growth*
500Tree
Ord
250
0'07 '08 '09 '10 '11 '12F '13F '14F '15F '16F
* 2012-2016 vs. 2007-2011
Source: Quest Offshore Resources – Mean Case Forecast, August 2012

Subsea Tree Orders – Excluding BrazilForecast at Historically High LevelsSubsea Tree Orders – Excluding BrazilForecast at Historically High LevelsForecast at Historically High LevelsForecast at Historically High Levels
500 ≈ 60% Growth*
400
500
ers
60% Growth
200
300
Tree
Ord
100
200
0'07 '08 '09 '10 '11 '12F '13F '14F '15F '16F
* 2012-2016 vs. 2007-2011
Source: Quest Offshore Resources – Mean Case Forecast, August 2012

Subsea ProductsRevenue by Business SegmentSubsea ProductsRevenue by Business Segment
29%
Revenue by Business SegmentRevenue by Business Segment
Umbilicals &Field Development Hardware
ROV Tooling & Work Packages Installation and
Workover ControlSystems
YTD June 2012

Subsea ProductsSubsea Products
• Required for Every Subsea Completion• Required for Every Subsea Completion
• Subsea Hardware– Umbilicals
• Subsea Hardware– Umbilicals– Tooling– Field Development– IWOCS
– Tooling– Field Development– IWOCS– IWOCS– Connectors & Valves – BOP Controls
– IWOCS– Connectors & Valves – BOP Controls
• Highly Engineered
World ide Co erage
• Highly Engineered
World ide Co erage• Worldwide Coverage• Worldwide Coverage

Subsea Products BacklogAt Period EndSubsea Products BacklogAt Period End
$700in millions
At Period EndAt Period End
$621
$500
$600
$700
$300
$400
$
$100
$200
$02007 2008 2009 2010 2011 2012*
* June 2012

Operating Income – Products2012 Estimate > 2011Operating Income – Products2012 Estimate > 2011
$160in millions Actual Estimate
2012 Estimate 20112012 Estimate 2011
$120
$160
$80
$40
$02007 2008 2009 2010 2011 2012E
OII 2012 Guidance as of July 25, 2012

OII Summary
• Diversified OFS Company• Diversified OFS Company
• Leveraged to Deepwater and Subsea Completions• Leveraged to Deepwater and Subsea Completionsg p p
• Leading Market Positions in Technical Niches
g p p
• Leading Market Positions in Technical Niches• Leading Market Positions in Technical Niches • Leading Market Positions in Technical Niches
• Excellent Earnings, Liquidity and Cash Flow• Excellent Earnings, Liquidity and Cash Flow

®®

Supplemental Financial Information

EBITDA
$700in millions Actual Low Estimate High Estimate
$500
$600
$700
$300
$400
$
$100
$200
*2012 $565MM $595MM
$02007 2008 2009 2010 2011 2012*
*2012 - $565MM-$595MMBased on OII 2012 EPS Guidance as of July 25, 2012.See Next Slide For Non-GAAP Reconciliation to Net Income

EBITDA Reconciliation to Net IncomeEarnings before interest, taxes, depreciation and amortization (EBITDA) is a non-GAAP financial measurement. Oceaneering’s management uses EBITDA because we believe that this measurement is a widely accepted financial indicator used by investors and analysts to analyze and compare companies on the basis of operating performance, and that this measurement may be used by some investors and others to make informed investment decisions. You should not consider EBITDA in isolation from or as a substitute for net income or cash flow measures prepared in
Earnings before interest, taxes, depreciation and amortization (EBITDA) is a non-GAAP financial measurement. Oceaneering’s management uses EBITDA because we believe that this measurement is a widely accepted financial indicator used by investors and analysts to analyze and compare companies on the basis of operating performance, and that this measurement may be used by some investors and others to make informed investment decisions. You should not consider EBITDA in isolation from or as a substitute for net income or cash flow measures prepared inshould not consider EBITDA in isolation from or as a substitute for net income or cash flow measures prepared in accordance with generally accepted accounting principles or as a measure of profitability or liquidity. EBITDA calculations by one company may not be comparable to EBITDA calculations made by another company. The following table provides a reconciliation between net income (a GAAP financial measure) and EBITDA (a non-GAAP financial measure) for Oceaneering’s historical and projected results on a consolidated basis for the periods indicated:
should not consider EBITDA in isolation from or as a substitute for net income or cash flow measures prepared in accordance with generally accepted accounting principles or as a measure of profitability or liquidity. EBITDA calculations by one company may not be comparable to EBITDA calculations made by another company. The following table provides a reconciliation between net income (a GAAP financial measure) and EBITDA (a non-GAAP financial measure) for Oceaneering’s historical and projected results on a consolidated basis for the periods indicated:
Period Ended December 31, 2007 2008 2009 2010 2011 2012E 2012E(in millions of $) LOW HIGH
N t I 180 4 199 4 188 4 200 5 235 7 275 290Net Income 180.4 199.4 188.4 200.5 235.7 275 290
Depreciation & Amortization 93.8 115.0 122.9 153.7 151.2 165 170
Subtotal 274 2 314 4 311 3 354 2 386 9 440 460Subtotal 274.2 314.4 311.3 354.2 386.9 440 460
Interest Expense/Income, Net 14.1 12.6 7.1 5.4 .2
Income Tax Expense 97.1 107.8 101.4 104.7 102.2 125 135p
EBITDA 385.4 434.8 419.8 464.3 489.3 565 595

OII Balance Sheet(in millions)
D 31 D 31 D 31 D 31 D 31 J 30
( )
Dec 31, 2007
Dec 31, 2008
Dec 31, 2009
Dec 31, 2010
Dec 31, 2011
Jun 30, 2012
$ $ $ $ $ $Equity $915 $968 $1,224 $1,390 $1,558 $1,625
Debt 200 229 120 0 120 125Debt 200 229 120 0 120 125
Cash 27 11 162 245 106 86
Debt/Cap 18% 19% 9% 0% 7% 7%

Business Segment Revenue
% of Oilfield% of Oilfield
90% ROV - 36%
Products - 32%
Asset Integrity 18%Asset Integrity - 18%
Projects - 14%
Oilfield Non-Oilfield
YTD June 2012

Business Segment Operating Income
% of Oilfield% of Oilfield
96% ROV - 52%
Products - 28%
Asset Integrity 10%Asset Integrity - 10%
Projects - 10%
Oilfield Non-Oilfield
YTD June 2012

Capital Expenditures: 2007-2011$1.4 Billion, Including ≈ $400 Million on Acquisitionsg q
ROV Subsea Products Asset Integrity Subsea Projects Other
11%2%
47%18%
22%

Supplemental Market Information

Oilfield ROV FleetOwnership Profile - December 2011p
35%
OIIOIISubsea 7
35%
267 SonsubFugroCanyonyOther
758 Vehicles
Source: OII Estimates

OII ROV FleetGeographic Profile – June 2012g p
833 70
17GOM
Africa
38Norway
Brazil
6351
U.K.
Asia/Pac
Can/Mex
280 Vehicles

Oilfield ROV Drill Support MarketJune 2012
OII
Subsea 7
58%
Subsea 7
Fugro
Sonsub
Other
268 Floating Rigs Contracted
Source: IHS-Petrodata and OII Estimates

OII ROVs on VesselsLocations
2010 GOM
Africa
15
Norway
Other
1715
62 Vehicles
June 2012

OII ROVs on VesselsCustomers
3428 Operators
Contractors
62 Vehicles
June 2012

Worldwide Umbilical Market Overview Forecasted at Historically High LevelsWorldwide Umbilical Market Overview Forecasted at Historically High Levelsy gy g
30001,000Umbilicals Tree Orders > 75% Growth* - Trees
≈ 60% Growth* - Umbilicals
2500
3000
750
1,000
KMers
1500
2000
500
cal O
rder
s -K
Tree
Ord
500
1000250 U
mbi
lic
00'07 '08 '09 '10 '11 '12F '13F '14F '15F '16F
* 2012-2016 vs 2007-2011
Source: Quest Offshore Resources – Mean Case Forecast, August 2012

Umbilical Products
Steel Tube UmbilicalsSteel Tube UmbilicalsThermoplastic Hose UmbilicalsThermoplastic Hose Umbilicals

OIE Products
ROV Tooling & Work Packages
Production Control Valves
g
Installation Workover & Control Systems Field Development HardwareConnectors & Repair Systems