Embed Size (px)
Citation preview

9HSTFMG*affhih+

Aalto University publication series DOCTORAL DISSERTATIONS 23/2014
Accomplishing rural electrification for over a billion people: Approaches towards sustainable solutions
Md. Mizanur Rahman
A doctoral dissertation completed for the degree of Doctor of Science (Technology) to be defended, with the permission of the Aalto University School of Engineering, at a public examination held at the lecture hall K216 (Otakaari 4) of the school on 18 March 2014 at 12 noon.
Aalto University School of Engineering Department of Energy Technology Energy Economics and Power Plant Engineering

Supervising professor Professor Risto Lahdelma Thesis advisor Dr. Jukka Paatero Preliminary examiners Professor Mark Howells, Department of Energy Technology, Royal Institute of Technology KTH, Stockholm, Sweden Associate Professor Poul Alberg Østergard Department of Development and Planning, The Faculty of Engineering and Science, Aalborg University, Denmark Opponents Professor Esa Vakkilainen, LUT Energy, Sustainable Energy Systems, Lappeenranta University of Technology, Finland
Aalto University publication series DOCTORAL DISSERTATIONS 23/2014 © Md. Mizanur Rahman ISBN 978-952-60-5578-7 ISBN 978-952-60-5579-4 (pdf) ISSN-L 1799-4934 ISSN 1799-4934 (printed) ISSN 1799-4942 (pdf) http://urn.fi/URN:ISBN:978-952-60-5579-4 Unigrafia Oy Helsinki 2014 Finland Publication orders (printed book): [email protected]

Abstract Aalto University, P.O. Box 11000, FI-00076 Aalto www.aalto.fi
Author Md. Mizanur Rahman Name of the doctoral dissertation Accomplishing rural electrification for over a billion people: Approaches towards sustainable solutions Publisher School of Engineering Unit Department of Energy Technology
Series Aalto University publication series DOCTORAL DISSERTATIONS 23/2014
Field of research Energy Economics and Powerplant Engineering
Manuscript submitted 14 August 2013 Date of the defence 18 March 2014
Permission to publish granted (date) February 2014 Language English
Monograph Article dissertation (summary + original articles)
Abstract Access to electricity appears to be a prerequisite to materialize social, economic, and human
development in the underprivileged rural areas. However, 1.1 billion rural people in the world, almost all of them living in developing countries, still do not have access to electricity. Although the rural electrification process poses more challenges than urban electrification, rural areas are blessed with abundant and relatively evenly distributed renewable energy resources. To facilitate electricity access to this huge population, it is essential to deal with the rural electrification task by considering its challenging features and the potential merits of renewable resources. The objective of this thesis is to present policy and techno-economic frameworks for sustainable and accelerated rural electrification for over a billion people in developing countries. This thesis considers grid expansion as the primary option for rural electrification, and renewable resource based off-grid options were considered as the alternative where grid expansion is not feasible. Grid-based rural electrification policies were examined by focusing on one case program (the Bangladesh rural electrification program) in light of challenges that are generic for developing countries. The assessment of the potentials and techno-economic viability of renewable resources were performed by utilizing analytical methodologies and well-established computer tools (HOMER and RETScreen). The evaluation of choices among rural electrification alternatives has been illustrated with the help of the Stochastic Multicriteria Acceptability Analysis (SMAA) tool. The evaluation methods and tools are illustrated by employing case data obtained mainly from Bangladesh. This thesis observed that some key policy elements influence the performance of a grid-based rural electrification program. These policy elements guide the rural electrification program towards success through addressing distinct rural electrification challenges. Agricultural residues have the potential to generate electricity to meet household-level demands in rural areas of many developing countries. Hybrid biogas and solar resources can serve both clean-cooking and electricity loads in rural households with achieving benefit (saving) more than the cost. The multicriteria decision support technique enables a rural electrification program to choose decision options from different alternatives based on sustainability criteria.
Keywords Rural electrification, Renewable resource, Multicriteria, Policy elements, Developing country
ISBN (printed) 978-952-60-5578-7 ISBN (pdf) 978-952-60-5579-4
ISSN-L 1799-4934 ISSN (printed) 1799-4934 ISSN (pdf) 1799-4942
Location of publisher Helsinki Location of printing Helsinki Year 2014
Pages 143 urn http://urn.fi/URN:ISBN:978-952-60-5579-4


v
Preface
This doctoral work was carried out during the years 2010-2014 at the Energy Economics
Research Group (EVO), Department of Energy Technology, Aalto University School of
Engineering, Espoo, Finland. I gratefully acknowledge the financial support provided by the
Fortum Foundation, the Graduate School for Energy Science and Technology (EST), and the
Aalto University School of Engineering Doctoral Program.
I offer my heartiest gratitude to my instructor, Dr. Jukka Paatero, for providing all the
necessary supports, ranging from admission to the program, obtaining funding and supporting
practical matters to conducting research. I acknowledge his continuous guidance and support
throughout my doctoral studies. Without his support, it would not have been possible for me
to come to Finland and perform this PhD work. I offer my sincere gratitude to my supervisor,
Prof. Risto Lahdelma, for accepting me as a doctoral student and providing me with
continuous support throughout the work. Professor Lahdelma’s guidance and instructions on
publication activities were invaluable to me and significantly enriched my publication
experience.
I express my sincere thanks to our secretaries, Helena Eklund (retired), Seija Erander-
Luukkanen, and Jenni Lehtonen for their kind help in many practical and secretarial issues. I
would also like to thank our research group’s professors, Pekka Ahtila and Sanna Syri, for
their encouragement. I would like to thank all my colleagues in the group. I also express my
thanks to Senior Lecturer Dr. Tuomas Paloposki and IT support person Mika Pantsu for their
cooperation and support.
I offer my sincere gratitude to Professor Mark Howells of KTH, Sweden and Associate
Professor Poul Alberg Østergard of Aalborg University, Denmark for serving as the
preliminary examiners and utilizing their valuable time to examine the dissertation.
I would like to thank my dear wife, Suraiya, for her support and my lovely children, Tawsif
and Tasfia, for making me euphoric by their presence. Above all, all the praises are due for
Allah (God), the creator to Him we all to be returned.
Espoo, February 2014
Md. Mizanur Rahman

vi
Table of contents
Abstract ………………………………………………………………………………............ iii
Preface ………………………………………………………………………………………. v
Table of contents ……………………………………………………………………………. vi
List of original publications and author’s contribution …………………………………...... viii
Notation and abbreviations........................................................................................................ x
1. Introduction......................................................................................................................... 1
1.1. Background and motivation........................................................................................ 1
1.2. Objectives and research questions…………………………………………………. 2
1.3 Scope of research and applied approach……………………………………………. 4
1.4 Contributions of the thesis to add new knowledge…………………………………. 4
2. Concept and definition of rural electrification in developing countries …………………. 6
2.1 Defining the scope of rural electrification…………………………………………. 6
2.2 Sustainable rural electrification…………………………………………………….. 5
2.3 Technology options for rural electrification………………………………………… 7
3. Methodological frameworks ……………………………………………………………. 8
3.1 Rural electrification through grid expansion (Publication I)……………………… 8
3.1.1 Challenging features of extending grid based-rural electrification……………. 8
3.1.2 Determination of the factors contributing to performance ……………………. 10
3.2 Methodology for assessing the potentials of sustainable agricultural
residues in five South Asian countries (Publication II)………………………….. 11
3.2.1 Assessing the potential of crop residues……………………………………… 12
3.2.2 Assessing the potential of animal manure……………………………………. 14
3.2.3 Economic evaluation of the residues for electricity generation……………….. 15
3.2.4 Applied data for the assessment of residue potential …………………………. 16
3.3 An approach for evaluating hybrid application of biogas and solar
resources (Publication III)………………………………………………………… 16
3.3.1 Concerns associated with current fuel applications……………………………. 16
3.3.2 Framework for alternative fuel applications…………………………………… 17
3.3.3 Biogas generation……………………………………………………………… 18
3.3.4 Evaluation tool…………………………………………………………………. 19
3.3.5 Input data for the HOMER tool……………………………………………….. 20
3.3.6 Determination of saving in terms of monetary worth…………………………. 24
3.3.7 Household biogas plant survey………………………………………………… 25

vii
3.4 Multicriteria approach for evaluation of choices for sustainable
rural electrification (Publication IV)……………………………………………… 25
3.4.1 Criteria for rural electrification………………………………………………… 26
3.4.2 Grid versus off-grid decision…………………………………………………… 27
3.4.3 Cost of electricity from off-grid options………………………………………. 30
3.4.4 Critical line length (circuit-km) for grid extension…………………………….. 30
3.4.5 Multicriteria decision aiding tool …………………………………………….. 31
3.5 PV system integration into a rural electric feeder (Publication V)……………….. 32
3.5.1 Optimization and financial analysis……………………………………………. 32
3.5.2 Applied data for the analysis………………………………………………….. 33
4. Results ………………………………………………………………………………….. 35
4.1 Driving and hindering factors, and essential policy elements for a
grid-based rural electrification program (RQ1)……………………………………. 35
4.1.1 Driving factors………………………………………………………………… 35
4.1.2 Hindering factors ……………………………………………………………… 37
4.1.3 Essential policy elements …………………………………………….……….. 39
4.2 Electricity generating potentials of agricultural residues (RQ2) ………………….. 40
4.3 Viability for serving clean-cooking and electricity loads through
hybrid biogas and solar resources (RQ3)………………………………………….. 41
4.3.1 Optimal system configurations ……………………………………………….. 41
4.3.2 Monetary saving by adopting new technologies……………………………….. 43
4.3.3 Appraisal from ongoing biogas plants (from a practical case survey)………… 44
4.4 Choices of technology options for rural electrification (RQ4)…………………….. 45
4.4.1Critical length for grid line extension………………………………………….. 45
4.4.2 Critical load to circuit-km ratio………………………………………………… 46
4.4.3 Ranking of off-grid technologies ……………………………………………… 47
4.5 Economic viability of integration of centralized PV system into a rural
electricity feeder (RQ5) …………………………………………………………… 49
4.5.1 Economic indicators…………………………………………………………… 49
4.5.2 Viable PV electricity selling price……………………………………………. 50
5. Discussion……………………………………………………………………………….. 53
6. Summary and conclusions………………………………………………………………… 55
References …………………………………………………………………………………… 57
Appended publications [I-V]………………………………………………………………… 65

viii
List of publications
This doctor dissertation consists of an overview of the following five scientific publications.
The publications are referred to by Roman numerals [I-V].
I Rahman MM, Paatero JV, Poudyal A, Lahdelma R. Driving and hindering factors
for rural electrification in developing countries: Lessons from Bangladesh.
Energy Policy 2013; 61: 840-851.
II Rahman MM, Paatero JV. A methodological approach for assessing potential of
sustainable agricultural residues for electricity generation: South Asian
perspective. Biomass and Bioenergy 2012; 47:153-163.
III Rahman MM, Hasan MM, Paatero JV, Lahdelma R. Hybrid application of biogas
and solar resources to fulfill household energy needs: A potentially viable option
in rural areas of developing countries. Renewable Energy 2014; 68:35-45.
IV Rahman MM, Paatero JV, Lahdelma R. Evaluation of choices for sustainable
rural electrification in developing countries: a multicriteria approach. Energy
Policy 2013; 59: 589-599.
V Rahman MM, Paatero JV. Integration of centralized photovoltaic (PV) system
into a rural electric feeder at Laxmipur in Bangladesh. The 3rd International
Renewable Energy Congress. Hammamet, Tunisia 20-22 December 2011. Tunis
2011, Centre de Publication Universitaire, 373-379.
Author’s contribution in the published articles [I-V]
The thesis author is the principal contributor of all five original publications [I-V]. Dr. Jukka
Paatero provided huge comments and corrections to all the five publications. Professor Risto
Lahdelma provided plenty of suggestions and corrections to papers [I], [III] and [IV]. In
publication [III], Mohammad Mahmodul Hassan conducted biogas plants survey and
provided survey data.

ix
Other publications by the author not included in the thesis
1. Rahman MM, Mostafiz SB, Paatero JV, Lahdelma R. Extension of energy crops on
surplus agricultural lands: A potentially viable option in developing countries while
fossil fuel reserves are diminishing. Renewable and Sustainable Energy Reviews
2014; 108-119.
2. Elojärvi M, Poudyal A, Rahman MM, and Paatero JV. Review on rural energy
policy: Nepal, Ghana, Bangladesh, and Zambia. 4th International Conference on
Sustainable Energy and Environment (SEE 2011). 23-25 November 2011, Bangkok,
Thailand.
3. Rahman MM, Paatero JV. Electricity generation from agricultural residues in five
South Asian countries: Prospects and potential. 4th International Conference on
Sustainable Energy and Environment (SEE 2011). 23-25 November 2011, Bangkok,
Thailand.
4. Alanne K, Saari K, Kuosa M, Rahman MM, Martin A, Pohjola H. Micro-
Cogeneration and Desalination Using Rotary Steam Engine (RSE) Technology,
Microgen´II, the 2nd International Conference on Microgeneration and Related
Technologies, University of Strathclyde, Glasgow, April 4-6 2011.

x
Notation and abbreviations
Notation
a annuity coefficient of capital cost
batB lifetime throughput of battery [kWh]
boilerc
,PVcapC
,cap tC t
enerC annual income from energy selling
FCC
fuel,tC t
,tinC cash inflow for year t
,toutC cash outflow for year
& ,O M tC t
perC periodic cost incurred by the system
replace,tC t
TC
annual debt paymenthcallE
hlallE
eEhcadiE ihjE j
servedEhcltotE
batf number of charge cycles of the battery [-]
df debt ratio [-]
servedH

xi
I
apL daily appliances load [kWh/d]
cL daily cooking load [kWh/d]
LL daily lighting load [kWh/d]
jM j
jN
batP battery lifecycle cost per kWh [US$/kWh]
eP
PLP
cfp
fp
fwP price of fuelwood
kP price of kerosene
& ,O M batP battery lifetime maintenance cost per kWh [US /kWh]
uP price of urea
fwQ heating value of fuelwood [MJ/kg]
kQ heating value of kerosene [MJ/kg]
mcQ
r
er energy cost escalation rate
iR ithiR i
bgjr j
rgrjr
salvage,tR t
s
batS nominal capacity of battery [kWh]

xii
PVS capacity of PV system [W]
batt battery life [y]
dx
iY i
�HR�
dod� acceptable depth of discharge [%]
e�
fw� efficiency of fuelwood for combustion by cook-stove [%]
mi� irdfi� irrfi� iryri� ivsi� ircfj� j
dmj� j
vsj� j
k� efficiency of kerosene for lighting [%]
saf�FC�
LF�
Abbreviations and acronyms
BREP Bangladesh Rural Electrification Program
DGE Digester Gas Engine
Dgen Diesel generator
ESMAP Energy Sector Management Assistance Program

xiii
HHC1 Household Category 1
IPP Independent Power Producer
IRR Internal Rate of Return
LCOE Levelized Cost of Energy
MCDA Multicriteria Decision Analysis
NPV Net Present Value
NREL National Renewable Energy Laboratory
PV Photovoltaic
REP Rural Electrification Program
SCR Saving Cost Ratio
TAC Total Annualized Cost
TAS Total Annual Saving

1
1. Introduction
1.1 Background and motivation
Access to electricity is a necessary precondition in bringing about social and economic
development in the underprivileged rural areas of developing countries1 [1-4] . Electricity
allows for the enhancement of productivity and thus brings prosperity and eradicates the
worst effect of poverty in rural areas. By considering its great importance, governments and
the international community have long been emphasizing expansion of electricity service to
the population of developing countries [6,7]. Despite the continuous efforts, the rural
electrification progress in many developing countries is distressfully slow [8,9], and still
today 1.3 billion people in the developing world do not have access to electricity, and 85% of
them live in the rural areas.
Rural electrification is characterized by many challenging features, such as small and disperse
nature of loads, low level of consumption, rough terrain, and lack of infrastructure. These
features make the rural electrification process a much more complex task than electrification
of urban areas [10-12]. Rural electrification programs require special form of policy and
institutional frameworks for operating and maintaining this complex task. Also, power
generation from fossil fuel sources inflicts a burden on the economy, and many developing
countries suffer power shortages in serving their rural people. The shortage in power
generation capacity is one of the key reasons for the resulting underachievement and
sluggishness of the rural electrification task [13,14].
Rural areas are often economically unfeasible for grid extension. Moreover, in many cases,
after achieving a certain level of electrification, the remaining areas are unlikely to be viable
for grid expansion [12]. Off-grid renewable energy options, on the other hand, have evolved
as promising through the maturation of small-scale technologies such as solar photovoltaic
(PV) systems, biogas digesters, small wind generators and micro hydropower, etc. Though the
renewable energy technologies face many obstacles, their deployment not only accelerates the
1There is no established definition for developed and developing countries in United Nations system.
However, United Nations Statistics Division (UNSD) broadly categorized geographic areas into developed
and developing countries or regions. According to UNSD and common practices, countries except Japan in
Asia, Canada and the USA in northern America, Australia and New Zealand in Oceania, and Europe are
considered as developing countries or regions [5].

2
rural electrification process but also relieves a significant burden from the economy of the
respective county [11,15]. Many developing countries are endowed with an abundant amount
of biomass resources and long hours of daily sunshine [16]. In contrast, in many cases,
renewable-based off-grid rural electrification projects have failed due to lack of attention to
sustainability issues beyond the financial and technical objectives [17]. Renewable resource-
based off-grid rural electrification programs need to involve social, environmental and policy
criteria in addition to economic and technical objectives in its planning and decision-making
process [18].
Bangladesh, which has been focused on as the case country to provide data for illustrating
applied methods and models, possesses similar attributes as many other developing countries
[19]. This country has a huge lack of access to electricity for its rural population and it is
endowed with an abundant amount of renewable resources.
To ensure electricity in rural areas of developing countries, international organizations,
research institutions, and individual researchers have conducted numerous research and case
studies to determine the issues influencing the performance of the rural electrification tasks
[3,20-22]. These studies have emphasized that rural electrification is a socio-culturally
integrated process where the performance of different programs vary with a number of factors
[6,23-27]. Research dealing with rural electrification tasks lacks an emphasis on its distinctive
features and potential merits from renewable resources and integration of sustainability issues
in the decision-making process. To accomplish successful rural electrification for these billion
of people, it is essential to employ strategic approaches to overcome the distinct rural
electrification challenges, utilize advantages of endowing renewable resources, and integrate
sustainability issues in the decision making process.
1.2 Objectives and research questions
Despite the complex nature of rural electrification task, some developing countries (e.g.,
Thailand, Tunisia, and Costa Rica) have been more successful in providing electricity to their
rural population than other developing countries [6]. Evidences show that rural electrification
programs can be successful in developing countries if appropriate policies are enacted. To lay
effective and successful policies, it is necessary to determine the driving and hindering
factors, which influence the performances of rural electrification programs. Despite having
advantages of endowing renewable resources, electrification through renewable technologies

3
in rural areas is quite low. Strategic approaches are required to enhance the dissemination of
renewable energy technologies. With this background, the overall objective of this thesis is to
explore the distinctive features of rural electrification task and present solution frameworks
for sustainable and accelerated rural electrification for 1.1 billion people.
To accomplish the overall objective, the thesis is divided into five research questions, whose
answers are sought through five appended published articles. Grid-based electrification is the
preferred option to accomplish rural electrification, therefore, at the beginning, the research
question 1 has pursued to determine the policy elements which influence the performance of
on-grid rural electrification program. This research question also sought to formulate the
policy elements, which guide the rural electrification program into success with diverse set of
program designs. Rural areas are normally located far from the central grid, and very often
grid expansion is not a cost effective solution compared with the renewable-based off-grid
solutions [2,28]. Research questions 2, 3 and 5 have been meant to determine how potentially
renewable resources serve rural electrification and to find suitable approaches to utilize these
resources. Research question 4 has been meant to determine how to choose alternatives based
on sustainability criteria. The following table denotes the research questions (RQs) and
indicates which published article contributed to answering which research question.
Table 1. Research question (RQ) and corresponding article that addresses the question.
Research questions Addressed by
RQ1. What are the driving and hindering factors and essential policy
elements for a grid-based rural electrification program?
Publication I
RQ2. How potentially agricultural residues can be utilized to generate
electricity in rural households of selected South Asian countries without
conflicting with other applications?
Publication II
RQ3. How potentially hybrid biogas and solar PV systems can serve both
clean-cooking and electricity loads in rural households, and what are their
monetary benefits and implications over conventional fuels?
Publication III
RQ4. How to choose among technology options, considering all
sustainability dimensions in rural electrification program?
Publication IV
RQ5. Can power generation through integration of PV system into rural
grid be competitive over fossil fuel based private independent power?
Publication V

4
1.3 Scope of research and applied approach
There are generally two technical options for bringing electricity to rural areas. The first
option is the extension and intensification of the central grid while the second option is off-
grid technologies (in the form of standalone or mini-grid). Grid extension is the most common
mode of electrification and has been the preferred option by policy makers and clients due to
its well-known advantages (including reliability, unrestricted capacity, economies of scales,
and independence from weather conditions) [29-32]. This thesis primarily seeks rural
electrification solutions through grid expansion. As the grid expansion is not a feasible option
in many cases, the renewable resource-based off-grid option then come as an alternative
option. Among different renewable resources, solar and biomass (particularly agricultural
residues) are very common in developing countries, including Bangladesh. Therefore, these
two resources mainly have been emphasized in this thesis as the main off-grid rural
electrification options. Overall, this thesis focuses on rural electrification aspects of the
developing countries. However, special focus is given to South Asian regions, particularly
Bangladesh, to illustrate the methodologies and to answer the research questions.
1.4 Contributions of the thesis to add new knowledge
This dissertation adds new knowledge to the rural electrification literature in several ways.
Firstly, this dissertation evaluates a rural electrification case to determine the major driving
and hindering factors behind the performance of the rural electrification program from the
developing country perspective (Publication I). As a result, it accumulates new insights on the
policy ingredients that are essential for a successful rural electrification program. Secondly,
this thesis proposes a methodology of systematically assessing the energy potential of
agricultural residues converting through anaerobic digestion process and shows that rural
households have significant potential to generate electricity from residues in competitive
ways (Publication II). The determination of energy potential via anaerobic digestion and by-
correlating data directly with annual crop and livestock yields brings novelty to this work.
Thirdly, this thesis also shows that hybrid biogas and solar resources can potentially serve
both thermal (clean-cooking) and electricity loads of rural households, incurring more savings
than costs (Publication III). The assessment of hybrid biogas and solar resources and their
evaluation techniques bring new information to the household-level energy evaluation
literature. Fourthly, despite multicriteria decision choices being an integral part of the long-
term sustainability of rural electrification projects, the stochastic multicriteria approach has
not been adequately incorporated in rural electrification projects. This work incorporated and

5
demonstrated the use of SMAA (Stochastic Multicriteria Acceptability Analysis, a
multicriteria decision aiding tool) in the rural electrification decision-making process, which
brings a new dimension to the rural electrification literature (Publication IV). Fifthly, this
thesis presents a methodological technique to check the economic viability of PV system
integrated into a rural electric feeder (Publication V). The proposed technique and illustration
add a new discussion in the rural electrification literature.

6
2. Concept and definition of rural electrification in developing countries
2.1 Defining the scope of rural electrification
Rural electrification is the process of bringing electrical power to rural and remote areas.
Researchers use this concept with diversity of interpretations. Frequently, a rural
electrification program refers to the administrative units responsible for electrifying rural or
remote areas [33]. Although the term ‘rural electrification’ generally means expansion of the
electricity connections through the central grid, rural electrification through grid expansion is
not an economically superior option in every rural area [10]. According to another definition,
rural electrification is the provision of electricity to rural areas for the use of rural
communities, regardless of the generation sources and technologies [34]. The World Bank
and other international organizations, however, have applied a broader view in utilizing the
term ‘rural electrification’. According to the World Bank, IEA, and ESMAP, rural
electrification is the facility of bringing electricity to the rural or remote areas of a country
through grid or off-grid or even combined technologies [7,8,12,21,31,35].
2.2 Sustainable rural electrification
According to sustainable development definition and millennium statements of World Energy
Council (WEC), sustainable rural electrification is the provision of electricity services to the
rural people by complying the following objectives: available in terms of continuity of supply
and reliability, affordable in terms of price, and acceptable in terms of social and
environmental objectives [36,37,38]. In other words, sustainable rural electrification means
providing electricity services to the rural population reliably and cost efficiently, and
complying with social and environmental needs. Despite electricity generation from fossil
fuel sources causes a major portion of global-level greenhouse gas emissions, grid-based rural
electrification in the developing countries does not cause such strong emissions. Moreover,
grid-based rural electrification is considered as the preferable option for its wide ranging
acceptability and advantages [31]. On the other hand, for many rural areas, renewable-based
off-grid options can be the adaptable and flexible rural electrification option if their selections
are based on social, environmental, and economic objectives. This thesis considers
‘sustainable rural electrification’ as the provision of electricity services to rural areas, either
through efficient, equitable and effective grid expansion or through viable renewable energy
technologies.

7
2.3 Technology options for rural electrification
Rural electrification is placed high on the socio-political development agenda in almost every
developing country. But besides the policy issues, the other major problem is the selection of
technologies. The choice of technology for rural electrification mostly depends on resource
availability, distance from the central grid, load types, geographic features of the targeted
areas, characteristics of local community, existing infrastructure, and availability and maturity
of any chosen technology [23]. The selection of technology is also influenced by the policy
and institutional framework and the socioeconomics of the rural areas [18]. The potential
technologies for rural electrification is a group of a large number of options and each
technology varies in many aspects, such as generation techniques, per-unit energy costs
(LCOE), initial capital cost, reliability of services, availability in local markets, and the
employment of local skills and manpower. The most common technologies used in rural
electrification programs are extension of national or regional grid, off-grid renewable
technologies (which include photovoltaic, wind turbine, hydropower, bioenergy), and diesel
generators or hybrid systems.

8
3. Methodological frameworks
This section presents a brief overview of the methodological frameworks, which were applied
in answering the five research questions. It also provides theoretical support to validating and
identifying the implications to apply the methodologies and data. This section is divided into
five sub-sections, where each sub-section deals with applied methodology against each
research question.
3.1 Rural electrification through grid extension (Publication I)
Extension of the grid is the primary option for providing electricity access to rural areas. A
grid-based electricity supply is the first preference by the clients, policy makers, and other
stakeholders, because it has numerous advantages, such as reliability, unrestricted capacity,
and weather independence. Globally, only a few developing countries are successful in
providing electricity to rural population through grid extension, whereas many countries still
have remained unsuccessful. This sub-section analyzed the challenging features of rural
electrification program to bring understanding on the performance factors of grid-based rural
electrification program. The institutional features of Bangladesh rural electrification program
were also presented to validate its characteristic factors behind the performance.
3.1.1 Challenging features of extending grid-based rural electrification (Presented in generic form for developing countries) Despite being preferred over off-grid options, rural electrification through grid extension
poses many distinctive challenges.
Rural areas have many characteristics that make their electrification more challenging
compared to urban areas [6,28]. In rural areas, agricultural activities are dominant, the ratio of
labor to capital is high, and income is on average quite low. Due to disperse nature of
households, number of connections per km of power line is quite low. Power consumption per
connection is also low due to lack of productive energy uses (lack of industries). These cause
power demand per km of distribution line very low. Hence, the costs per connection and per
supplied kWh are significantly higher. Due to poor communications and bad terrain, operation
and maintenance are more problematic and costly, and the quality of power supply is often
quite low [10].

9
Rural people in developing countries are remained in the bottom section of the pyramid and
usually cannot afford the full cost of the high initial investment. In addition to community
equity and credit from donor agencies and the government, rural electrification usually
requires some form of subsidy from the government to cope with the high capital cost [39].
The subsidy, if not administered properly, causes problems. For instance, it can create
opportunities for politicians to intervene, because politicians feel they have the right to
participate in decision making while the financing are based on subsidy, which destroy
impartial management practices. The subsidy often makes the program prone to unfair
practices such as restoring connections that have been cut off due to lack of payment, stealing
of power and other illegal activities, and bypassing the criteria for the selection of loads. Also,
poorly designed subsidies deviate the electricity distribution company from customer service
to money maximization. This causes the rural electrification program to alienate the customer,
and compromise the quality of its service [6].
The right-of-way2 access also causes problems in rural areas where the overhead lines criss-
cross croplands, houses, or a land reserved for future households. The local community may
also seek compensation against the right-of-ways, which is usually not budgeted in rural
electrification schemes. The load factor in rural areas is quite low, and the demand is
generally concentrated in the peak evening times. This requires a high peak capacity for the
conductors and other equipment, which leads to higher costs. Another challenge in rural
electrification has to do with the grid expansion versus the off-grid dilemma. Many politicians
have a strong preference for extending the national grid irrespective of viability [31].
Besides the above challenges, counties with low-lying and hilly lands also face a few
exceptional challenges. Bangladesh, for example, has almost 800 rivers and tributaries that
crisscross and pass through the country. Most of the country’s rivers are characterized by
massive land erosion and changing water courses every year. This means that many rural
areas face the challenge of removing the grid lines and expanding the grid. Massive river
erosion also causes new areas to form, which are called “chars” (islands), through silt
deposition within the water course. Although thousands of people may live on the newly
formed ‘chars’, extending the grid lines to the chars is both unfeasible and impractical. 2
The idea of ‘right-of-way’ is the right to build the distribution infrastructure across someone’s property
without expecting any legal challenge in the future.

10
3.1.2 Determination of the factors contributing to performance
The Bangladesh rural electrification program (BREP) received a very distinctive status in
developing countries with respect to its highly representative features. The program pioneered
in successfully tackling the typical adverse socio-economic and turbulent political conditions
in the developing country situations. Rural electrification programs involved multiple aspects,
such as technology and institutional and financing policy issues, and there appears to be no
clear methodological framework to deal with the aspects together. Therefore, this thesis used
exploratory research approach to evaluate the performances and determine the driving and
hindering factors behind the performance of BREP. At this point, I give a brief institutional
overview of BREP to elucidate performance features that are connected with the institutional
framework. Bangladesh adopted the rural electric cooperative (REC) concept in its rural
electrification program. According to this concept, a central statutory agency called the Rural
Electrification Board (REB) was formed, which was given the responsibility of organizing the
rural electric cooperatives (Palli Bidyut Samity, PBS). The cooperative is a consumer-owned
autonomous organization responsible for delivering electricity to designated rural areas. The
REC (PBS) constructs, operates, and manages its own electricity distribution system. REB
supervises the financial and administrative activities of the cooperatives through managers
(Figure 1) [24]. Consumers of the cooperative elect a board of directors, which formulates the
cooperative’s policy and implements the policies through managers. The cooperatives obtain
funding from government and donor agencies and REB acts as a conduit to channel funding
to the cooperatives.
11
Figure 1. Institutional framework of Bangladesh Rural Electrification Program.
3.2 Methodology for assessing the potential of sustainable agricultural residues in five South Asian countries (Publication II)
Biomass is the source of fuel for subsistence in most of the South Asian developing countries.
Biomass products like firewood, charcoal, manure, and crop residues provide the main source
of household energy for around one billion people in South Asian countries [40,41]. Among
renewables, bioenergy is the most promising, as its mobilization can stimulate employment
generation, combat desertification, and prompt gender equity activities [42]. The agricultural
residues, which include crop residues and animal manure, provide a major part (e.g., 80% to
90%) of the cooking fuels for rural households [43]. Agricultural residues cover a wide
spectrum of leftovers derived from crops and livestock such as rice straw, corn cobs,
sugarcane bagasse, cattle manure, poultry dropping, etc. The most significant classifications
of these residues are- crop residues and animal manure. Although the agricultural residues are
widely used, their conversion efficiency is very low and a significant portion is wasted and
poorly managed. Despite a huge amount of residues being produced every year in the rural
areas, their application through cleaner conversion is limited. This thesis determines the
electricity generating potential from this resource in meeting rural households’ demands by
complying with environmental, economic and societal constraints.
Provides electricity service
Cooperative’s Managers
Consumers/Cooperative’s members
Cooperative‘s Board of Directors
Rural Electrification Board (REB)
Rural Electric Cooperative (PBS)
Elect Board of directors
Appoint managers, formulate policies
Construct and operate
National level policies
Communicate national level policies
Provides operational supervision

12
3.2.1 Assessing the potential of crop residues
The term ‘crop residue’ is used to describe all the organic materials that are produced as by-
products from harvesting and the processing of agricultural crops. These crop residues can be
further categorized into- field residues and process residues. Crop residues that are generally
in the field at the time of harvesting are defined as field residues (e.g., rice straw, wheat
straw), whereas those co-produced during processing of the crops are called process residues
(e.g., rice husk, bagasse) [44].
The residues usually lay in scattered places in the fields and process sites, and they possess
diverse characteristics. The availability of residues depends on many different issues and
constraints. Moreover, all residues are not readily applicable for modern energy uses. The
assessment of the sustainable residues is associated with the steps presented in Figure 2.
Figure 2. Residue assessment steps.
Gross residue amount of any crop species: The gross residue amount (t/y) generated
annually by the crop type can be obtained in Eq. (1)
�� (1)
where (t/y) is the annual crop yield and � ryri is the residue-to-yield ratio of crop type . The
residue-to-yield ratio indicates how much residue (mass) is generated per unit of crop
products of any crop type. The annual average yields of main crop types can be determined
from the regional, national or international statistics. The values of � ryri vary with several
factors, such as crop varieties, harvesting seasons, harvesting practices, fertilizer use, etc.
[45].

13
The amount of residues obtained from Eq. (1) is not entirely available; rather, there are
several active uses for this resource, such as fodder, fuel, and thatching [3]. Several
estimations of the surplus availability factors saf� have been presented in the literature
[41,44,46,47]. Also several constraints limit the accessibility of the residues, such as soil
condition, transportation means, landscape, harvesting methods, and adverse effects on future
yields. Considering all these factors, the amount of net available residues (field or process) thiR (t/y) for crop type can be obtained in Eq. (2).
where rrfi� is the residue recovery factor (kg/kg of residue) and saf
i� is the surplus availability
factor (kg/kg of residue) for field or process-based residues for crop type . Each crop species
eventually gives the residue amount by summing up the amounts for both residue types (i.e.,
field and process).
Despite the biomass being renewable in nature, it faces a number of drawbacks when its
utilization involves a combustion process. In contrast, the anaerobic digestion (AD) process
has been recognized as the lowest cost and environmentally friendly technology to convert
biomass into biogas in a rural context [48]. Therefore, it will be worthwhile to ascertain the
energy potential of residues through AD to completely utilize the residues and minimize the
adverse effects on the environment. The annual thermal potential hcadiE (GJ/y) of residues of
crop type through AD process can be determined in Eq. (3)
Here rdfi� is the residue dryness factor (kg/kg of residue), vs
i� is the ratio of volatile solid
(VS) to dry matter (DM), mi� is the biogas generation rate (m3/kg of VS) of crop species i ,
and mcQ (MJ/m3) is the heating value of biogas. The total annual thermal potential of all crops
hcallE (GJ/y) can be calculated by summing up the annual thermal energy potentials of the
residues of all crop types as given in Eq. (4) below:
� �� �� (2)
� � �� �� � (3)
�
� (4)

14
3.2.2 Assessing the potential of animal manure Anaerobic decomposition of animal manure produces methane gas (CH4), carbon dioxide
(CO2), and stabilized organic materials. The potential for the generation of electricity from
livestock manure can be calculated considering its transformation into biogas via anaerobic
digestion. Livestock such as cattle, buffalo, sheep, goat, and poultry are common in South
Asian rural areas [49]. The dung production from animals depends on many factors, such as
the body weight of the animals, the type and quality of the feeds, and physiological states
[50]. The literature suggests the average residue generation rates for varieties of livestock in
different regions of the world [41,50,51]. The annual manure production jM (t/y) of livestock
species j can be obtained in Eq. (5)
where jN (in thousands) is the head count of livestock type j and rgrjr (kg/y) is the residue
generation rate. Accessibility of the dung is an important factor, particularly where livestock
are range-fed, and consequently the dung is not easily accessible. However, the dung from
cattle can be collected from the droppings at the cattle sheds, which are generally stationed in
rural areas [52]. The annual thermal potential hjE (GJ/y) of livestock type j can thus be
obtained by Eq. (6):
where rcfj� is the residue collection factor (kg/kg of residue), dm
j� is the fraction of dry matter
of residues (kg/kg of residue), vsj� is the ratio of volatile solid to dry matter, bg
jr is the biogas
generation rate (m3/kg of VS) of livestock species j , and hvlQ (MJ/m3) is the lower heating
value of biogas. As a result, the total thermal potential of animal manure for all major species hlallE (GJ/y) can be calculated as Eq. (7)
The thermal outputs from the co-digestion of all of the residue species are not available in the
literature. However, it is obvious from the literature that co-digestion between crop and
livestock residues produces more biogas than their separate digestion if optimum digester
conditions (e.g., temperature, pH, organic loading rate) are maintained [53]. This thesis
�� (5)
� � �� � �� � � (6)
�
� (7)

15
assumed that the total thermal potential of crop and livestock residues hcltotE (GJ/y) is equal to
the sum of their individual yield and can be determined by Eq. (8) as follows:
3.2.3 Economic evaluation of the residues for electricity generation
The levelized cost of energy production (LCOE) is one of the popular tools used to evaluate
the viability of an energy system [54, 55]. Based on the heating value of the biogases from the
possible residues, the levelized cost of energy production, LCOE (US$/kWh), can be
determined by the Eqs. (9-11):
where hcltotE (GJ/y) is the total annual thermal potential of crop and livestock residues, eP (kW)
is the plant capacity, and e� is the conversion efficiency from biogas to electricity, which is
around 26% for a gas engine [50]. Also, eE is the annual electricity generation (kWh/y), cfp
is the plant capacity factor, a is the annuity coefficient of the capital cost, I (US$) is the
capital cost, &O MC (US$/y) is the annual operation and maintenance cost, R (US$/y) is the
revenue from by-products, and fC (US$/y) is the fuel (residue) cost.
Besides LCOE, the Net Present Value (NPV) and Internal Rate of Return (IRR) are the
financial indicators commonly used for to evaluate an energy project and to create insight into
the project’s profitability [55,56]. The NPV (US$) and IRR (%) can be obtained using Eqs.
(12-13)
� (8)
�� ��
(9)
� �� (10)
� � � � (11)
�
� (12)
�
� (13)

16
where tCF (US$) is the net cash flow of the investment in year t , which can be calculated as
� � � and T (y) is the plant life, and r (%) is the real interest rate.
Despite a few limitations, these two indicators are widely used for a project’s financial
analysis [54].
3.2.4 Applied data for the assessment of residue potentials
To establish the main characteristic values of the major crops and livestock, a selection of
literary sources were used [41,45,47,50,57,58,59,60]. The crop species which were considered
in this study are rice, wheat, maize, jute, sugarcane, cotton, pulses, coconut, millet, and
vegetables, while the livestock are cattle, buffalo, goats, sheep, horses, and chickens.
3.3 An approach for evaluating hybrid applications of biogas and solar resources
(Publication III)
Electricity and thermal energy for cooking are the two energy forms essential in the rural
areas. Renewable resources- biomass (resource for biogas) and solar are abundantly available
in the rural areas of many developing countries and pose potential to serve both thermal
(cooking) and electricity demands. Biogas and solar resources separately, however, are not
feasible to meet these two forms of energy demand. This section presents methodological
framework for examining the techno-economic performance of hybrid applications of these
two renewable resources
3.3.1 Concerns associated with current fuel applications The rural household usually uses conventional cookstove and wet (i.e. with moisture content
≥ 15%) solid biomass as fuel for cooking purposes. The low efficiency stove with wet solid
biomass produces a high level of smoke that is hazardous for human health. Lighting using a
paraffin candle and a kerosene lantern emits smoke, and they produce poor lighting intensity
per unit of consumed wattage. Other basic energy applications such as the provision of
entertaining/leisure, communication, and space cooling (fans) require electricity. Thus, there
is a crucial need to provide clean gaseous fuel for cooking and electricity for other basic
applications in rural households. Many developing countries produce plenty of bio-waste
from livestock every day and have many hours of daily sunshine [41,61].

17
3.3.2 Framework for alternative fuel applications
The main energy use in rural households is for cooking and lighting purposes. The other basic
energy requirements beyond cooking and lighting are space cooling, home appliances for
leisure, and cell-phone charging. Because of geography and climate conditions, space and
water heating needs in rural households are very small in many developing countries [62]. In
Bangladesh, households use a wide range of energy sources for cooking, such as fuelwood,
agricultural residues, kerosene, liquefied natural gas (LNG), liquefied petroleum gas (LPG),
and biogas. The uses of other fuels, such as plant oils, biomass briquettes, charcoal, and
electricity, are very small or negligible. The lighting services are provided by some form of
external sources such as kerosene, paraffin candle, etc. The other energy services such as
leisure/entertainment and cell-phone battery charging are provided by car-battery or dry-cell
battery [19].
In Bangladesh, three-stone burners are used for cooking by biomass fuels, and kerosene
stoves are used for cooking by kerosene and LPG/LNG fuels. Lighting services in the rural
households are provided by paraffin candles, hurricane lantern, or wicks lamps. The common
appliances for leisure/entertainment and communication are radio, cassette player, TV, and
mobile phone. Beyond theses appliances, some other home-appliances (such as refrigerator,
hair-dryer, rice-cooker, and flat-iron) are also used in a few households. Households’ current
energy applications, fuel sources, devices/appliances, and possible alternative forms are
presented in Figure 3. Two forms of renewable fuels (e.g., biogas and solar) have been
focused on in this study as the alternative fuels to meet household energy needs [19,63,64,65].

18
Figure 3. Framework for current and alternative fuels and appliances in rural households.
3.3.3 Biogas generation
One kilogram of fresh cattle dung has the potential to generate about 0.04 m3 of biogas. In
other words, 25 kg of cattle dung is required for producing 1 m3 of biogas [66]. One cattle on
average gives 10 kg of fresh dung per day. Biogas plants (sometimes referred to as anaerobic
digesters), which is an assembly of a few containers (tanks) and pipes, convert livestock
wastes into biogas. Household-scale biogas plants usually consist of an airtight underground
digester tank, a gas holder, two inlet outlet tanks, a mixing device, a few pipes, and gas
regulator valves (see Figure 4). The digester tank gets feed in with properly mixed bio-wastes
and water. The size (or in other words, the capacity) of biogas plants corresponds to the
quantity of biogas (m3) the plant can produce in 24 hours. Biogas burns with a blue flame
without emitting smoke and gives CO2-neutral combustion [67].
Fuel applications
Alternative appliances
Alternative fuels
Current fuels
Current appliances
Household category
Radio/Tape/Television/
Fan (space cooling)
Fuel wood/Residues/LPG/LNG
Kerosenne stove/Three-stone wood
stove
Solar radiation and biogas
Kerosene
Wick lamp/ Hurricane lantern/
Paraffin candle
Car battery/Dry-cell battery
Radio/Tape/Television/
Mobile phone charger/Computer/
Fan (space cooling)/ Others
Gas stove CFL bulb
Cooking Lighting Other appliances

19
Figure 4. Main components of biogas plants.
3.3.4 Evaluation tool
This thesis first designed hybrid systems from biogas and solar resources that can serve both
electricity and thermal demands while complying with technical and resource constraints.
Then it performed techno-economic evaluations on the resulting hybrid systems to examine
how these two renewable energy resources can potentially serve household energy demands.
This research work considers two energy generation technologies: Digester gas engine (DGE)
and solar PV system. Among different approaches, simulation-based optimization is a widely
utilized approach for designing small-scale energy systems and performing economic
evaluations on them [31]. Some common optimization tools are HOMER [68], Hybrid2 [69],
and HOGA [70]. Renewable-based power systems entail complexity due to the transient
nature of power outputs and variation in availability of renewable resources. This thesis
applied the HOMER computer tool because it has the unique capability of handling small-
scale renewable-based energy systems. HOMER performs hourly time-series simulations and
can incorporate the effects from uncertainties of different input variables such as load sizes,
fuel price, and resource availability.
The HOMER tool performs three principal tasks: simulation, optimization, and sensitivity
analysis. In the simulation process, it first simulates the performance of a vast number of
system configurations based on energy balance calculations for each hour of the year to
determine whether these configurations are feasible. The HOMER tool considers the system
to be feasible if it can adequately serve the electric and thermal loads and satisfy all technical
constraints imposed by the model users. HOMER tool applies dispatch strategies to determine
the charging order for storing of energy. The tool follows two separate dispatch strategies:
load-following and cycle-charging. Under the load-following strategy, only renewable power

20
sources charge the battery but non-renewable sources do not charge. Under the cycle-charging
strategy, whenever the system produces surplus power (either from renewable or non-
renewable sources), the extra power goes to charge the battery [71].
The model estimates the total net present cost (NPC), which is the present value of all costs
for installing and operating the system minus the present value of all revenue over its lifetime.
The total net present cost (NPC) and total annualized cost (TAC) of the system are calculated
as below:
where is the lifetime of the project, is the present value of capital cost for year
is the present value of operation & maintenance cost for year is the present value of
fuel cost for year , is the present value of the replacement costs for year , and
is the current value of the salvage price for year is real interest rate and is
capital recovery factor.
In the optimization process, HOMER ranks the system configuration from many different
configurations based on the lowest total NPC. Though HOMER ranks the system on total
NPC, it also calculates the LCOE (electricity) value for each of the optimized systems. The
LCOE (electricity) is the average cost of producing per kWh of useful electrical energy and
does not include the thermal part and is calculated using the following equation:
where is the total annualized cost of the system (US$/y), is the boiler marginal cost
(US$/kWh), is the total thermal load served (kWh/y) , and is the total electrical
load served (kWh/y).
3.3.5 Input data for the HOMER tool
HOMER simulation requires lots of data sets as input. The following section describes the
techniques used for processing the input data.
�
� � (14)
� � (15)
, .( )
�� a tot boiler served
served
C c HLCOE electricity
E (16)

21
3.3.5.1 Anticipated loads and other required parameters
HOMER loads consist of three components: primary load, thermal load, and deferrable load.
Primary load is the electrical demand that the power system must meet at any specific time.
Thermal load is the heat demand that must be served. And deferrable load is the electrical
demand that can be served at any time within a certain time span.
I have categorized rural households into three categories based on energy use information
from the Grameen Shakti survey report [72], Asaduzzaman et al. [19], Miah et al. [63], and
the World Bank [64].
The daily electric and thermal energy demands for the three household categories (HHC) are
presented in Tables 2 and 3. All three household categories (i.e. HHC1, HHC2 and HHC3)
have been considered to have basic electric appliances operating 2 to 6 hours per day. The gas
burner with 60% efficiency has been considered as a cooking device (as Boiler in HOMER)
using biogas as fuel. The gas burner operates 4 to 8 hours a day with a final thermal output
per burner of 1.6 MJ/h [1,63,65]. The physical and economic parameters, which were used in
economic evaluation, are presented in Table 4.
Table 2. Thermal (cooking) energy demand per household for three households categories.
Load
type
Appliance Thermal
output
per
burner
(MJ/h)
Household category
HHC1 HHC2 HHC3
Burner
-hour a
Daily final
heat
consumption
(kWh/d)
Burner
-hour
Daily final
heat
consumption
(kWh/d)
Burner
-hour
Daily final
heat
consumption
(kWh/d)
Cooking Gas
burner 1.6 b 4 1.776 6 2.664 8 3.552
a A burner-hour is the thermal (cooking) load served by one burner in one hour. b A gas burner approximately gives a final thermal output of 1.6 MJ/h.
Source: [65]

22
Table 3. Electric energy demand per household for three household categories.
HHC1 HHC2 HHC3
Daily electricity demand per household (kWh/d) 1.71 2.17 2.49
Sources: [19,63,73]
Table 4. Parameters related to biogas digester and cooking fuels.
Parameters Symbol Values Variations
Calorific value of biogas 23 MJ/m3
Calorific value of fuelwood
(15% moisture)
16 MJ/kg
Calorific value of kerosene 43 MJ/kg
Biogas cook-stove efficiency 60%
Efficiency of kerosene for
lighting
6%
Fresh dung required to produce
1 m3 of biogas
25 kg
Nitrogen available in fresh dung 2%
Nitrogen retention factor 60%
Price of kerosene 1.0 US$/kg
Efficiency of fuelwood for
cooking
15%
Price of fuelwood 0.02 US$/kg 0.01-0.07 US$/kg
Price of urea 0.25 US$/kg
Price of cattle dunga 0.25 US$/m3 0.10-0.50 US$/m3
Lifetime of the project 20 y
Real interest rate 5%
a Note: The price of cattle dung is expressed in US$/m3, which directly corresponds
to price (in US$) of 25 kg of cattle dung.
Sources: [2,7]

23
3.3.5.2 Electrical load profile
The HOMER model requires an hourly load profile to enable hourly simulation of the system
by making energy balance calculations for each of the 8,760 hours in a year. I have gathered a
monthly-averaged daily load profile for rural areas. This load profile is based on the real loads
of 8.2 million rural consumers connected to the electric distribution network in Bangladesh
[74]. The daily and hourly noise inputs allow adding randomness to the load data, enabling
the load profile to be more realistic. I have incorporated randomness by applying daily 15%
and hourly 10% noise inputs.
3.3.5.3 Costs of system components
Capital cost for a solar PV system: To obtain the capital cost of PV systems of various sizes, I
applied a generalized cost function equation (Eq. 17) [75] .
where (US$) is the capital cost of a solar PV system of size (W). The solar PV
system package includes a PV module, a battery and other accessories. The breakdown of
capital costs for each component is as follows: 60% of the cost for the PV module, 25% for
the battery, and the remaining 15% of the cost for the converter.
Operation and maintenance (O&M) costs of a PV system: The solar module requires no
significant maintenance during its lifetime of over 20 years [76], but the battery unit needs to
be replaced several times [77]. Batteries with various lifetimes and of different types are
available in the market. Hence it will be appropriate to obtain the annual operation and
maintenance cost of a battery from its lifetime maintenance cost per kWh and lifetime
throughput (kWh). I have obtained the operation and maintenance cost of battery
(US$/y) with the help of following equations.
� ; {Applicable for: 20 500PVW S W } (17)
� (18)
�� (19)

24
where (kWh) is the lifetime throughput of the battery, (US$/kWh) is the battery
lifetime maintenance cost per kWh, (y) is the battery life, (kWh) is the nominal
capacity of the battery, and is the number of charge-cycles of the battery for acceptable
depth of discharge ( ).
Capital cost of the digester gas engine (DGE) system: The cost function equations for gas
engines in the range of 0.6-5 kW and bio-digesters in the range of 1.6 - 77 m3 are taken from
Rahman and Paatero [78], which are based on cost data obtained by reviewing markets prices
in Bangladesh.
Operation and maintenance cost of the digester gas engine system: The operation and
maintenance cost of the digester gas engine system has been obtained from methodology
developed by Rahman and Paatero [78].
3.3.6 Determination of savings in terms of monetary worth
The saving is the hypothetical cost that could be incurred if a household consumed the same
energy with conventional fuels (i.e. fuelwood and kerosene). It is the value of the
conventional fuels displaced by the new fuels. Total annual savings are computed from Eq.
(20), which was developed based on the methodology of Kandpal et al. [79], and Bala and
Hossain [80].
where (US$/y) is the total annual saving, (kWh/d) is the daily cooking load,
(MJ/kg) is the calorific value of fuelwood, is the efficiency of fuelwood for combustion
by cookstove, (US$/kg) is the price of fuelwood, (kWh/d) is the daily lighting load,
(MJ/kg) is the calorific value of kerosene, is the efficiency of kerosene for lighting,
(US$/kg) is the price of kerosene, ap (kWh/d) is the daily appliances load, is the
efficiency of battery, (US$/kWh) is the battery lifecycle cost per kWh until the battery
reached the maximum limit of depth-of-discharge ( , (m3/d) is the daily biogas
consumption, (kg/m3) is fresh cattle dung required to produce 1 m3 of biogas, is the
nitrogen available in fresh dung, is the nitrogen retention factor, and (US$/kg) is the
price of urea.
� � � �
� �� � �
� �� � (20)

25
Annual savings-to-cost ratio (SCR): The SCR is the ratio of the total annual savings from
displacing conventional fuels to the total annualized cost for adopting new fuels. The annual
savings are calculated from Eq. (19), and the total annualized costs (TAC) are taken from
HOMER results as in Eq. (15). The SCR can be calculated as below.
3.3.7 Household biogas plants survey
The objectives of this survey were to get the users’ appraisals on the acceptability and
practical applicability of biogas plants. The survey data are based on a primary data collection
survey on households’ biogas plants, supplied by Grameen Shakti (a private organization
serving renewable energy) [72]. The survey covered 72 households from three districts of
Bangladesh (39 from Gazipur, 20 from Joipurhat, and 13 from Naogaon). The households
were selected to be representative of the typical features of households who own and operate
the biogas plants from Grameen Shakti. The survey used a structured questionnaire with 36
questions in 5 sections.
3.4 Multicriteria approach for evaluation of choices for sustainable rural electrification
(Publication IV)
Rural electrification requires effective prioritization and planning to enable economic choices
of technology by considering socio-economic and environmental consequences [6,12]. A
large number of off-grid rural electrification projects have failed due to little or no attention to
long-term sustainability issues beyond technical considerations [17]. Case studies indicate
that an off-grid supply acts as a pre-electrification option, with the community continuing to
aspire for grid connection. Consequently, many off-grid electrification projects are
discontinued due to access to grid lines at a later stage of the off-grid projects [3]. Reddy and
Srinivas [18] observed that the choice of technology for rural electrification is influenced by
various policy, institutional, and socio-economic factors in the rural areas. Appropriate and
multi-factorial (multicriteria) decision choices are, therefore, an integral part of long-term
sustainability of rural electrification projects.
� (21)

26
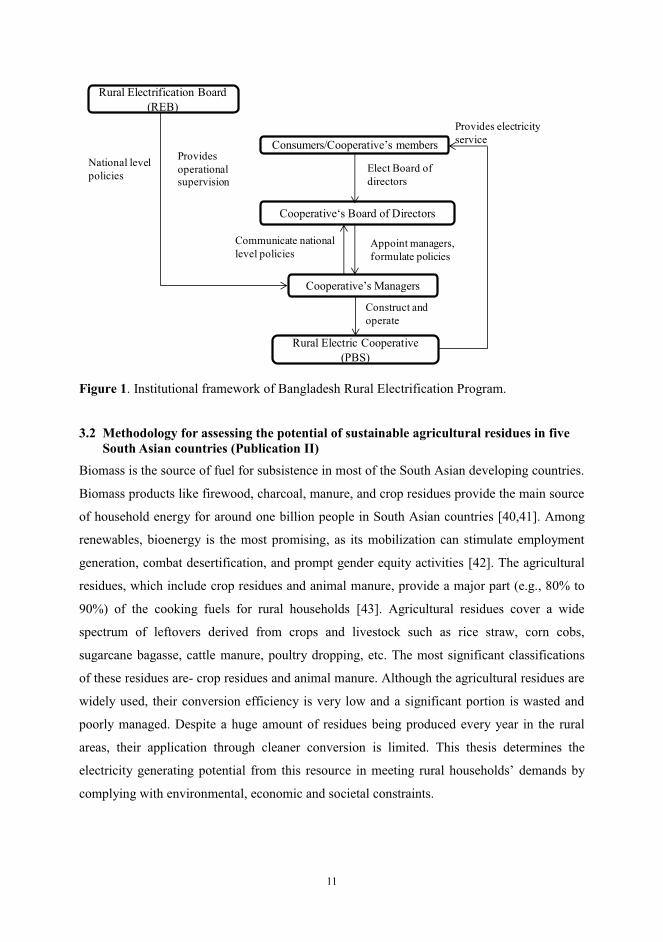
3.4.1 Criteria for rural electrification
Tshewang [81] proposed an evaluation method for rural electrification options by considering
18 indicators under technical, regulatory, environmental and social dimensions. Elisabeth [82]
argues that rural electrification success is allied with as much as 39 indicators under five
dimensions, namely technical, economic, social, environmental and institutional
sustainability. Ilskog and Kjellström [83] evaluated a rural electrification case using 31
indicators. Cherni et al. [84] proposed a decision-support system to determine an appropriate
set of energy options in terms of five factors. A joint UN publication [85] has recommended
39 indicators. These well-defined indicators are suitable measure of five dimensions of
sustainability: technical, economic, social, environmental and institutional sustainability. This
thesis has compiled and proposed 24 criteria under five sustainability dimensions (Table 5);
these criteria potentially lead to an energy system that can retain better sustainability in terms
of all 39 energy indicators.
27
Table 5. Criteria under five sustainability dimensions.
Sustainability dimensions
Technical
dimension
Economic
dimension
Social
dimension
Environmental
dimension
Policy
dimension
Criteria under each sustainability dimension
(1) Capacity
utilization factor,
%
(7) Capital
cost, US$/W
(13) Public and
political
acceptance
(17) Lifecycle
GHG emissions,
kg CO2/kWh
(19) Land
requirement and
acquisition
(2) Compatibility
with future
capacity
expansion
(8) Annual
operation and
maintenance
costs (fixed),
US$/kW
(14) Scope for
local
employment
(18) Local
environmental
impact
(20) Emphasis
on use of local
resources
(3) Compatibility
with existing
infrastructure
(9) Lifespan
of the
system, y
(15) Public
awareness and
willingness
(21) Opportunity
for private
participation
(4) Availability of
local skills and
resources
(10) Learning
rate, %
(16) Conflict
with other
applications
(22) Tax
incentives, %
(5) Weather and
climate condition
dependence
(11) Current
market share,
%
(23) Degree of
local ownership
(6) Annual
resource
availability
duration (h/y)
(12)
Dependence
on fossil fuel,
%
(24) Interference
with other
utilities
3.4.2 Grid versus off-grid decision
Though it is evident from many case studies that off-grid renewable energy systems can play
a vital, cost-effective role in supplying electricity to rural areas, these off-grid options are not
mutually exclusive. The national or regional utility companies have often structured their
grid-extension plan without excluding villages that might have potential for an off-grid supply

28
in future. Therefore, for the long term sustainability of an off-grid system, it is required to
know whether the off-grid system will be exposed to grid extension competition in future.
The proposed approach first determines whether the electricity supply provision should be
grid expansion or off-grid on the basis of the levelized cost of delivered electricity (apple-to-
apple comparison). If the grid expansion is not found to be viable, then the SMAA (Stochastic
Multicriteria Acceptability Analysis) tool is used for evaluating different off-grid alternatives
considering 24 criteria under five sustainability dimensions.
Checking the viability of a grid expansion can be done by comparing the costs of delivered
electricity against the off-grid supply costs [86]. At any location, the cost of delivered
electricity from the grid has three components: (a) the cost of generation at the bus-bar of the
generation plant, (b) cost of transmission, and (c) cost of distribution to the client’s meter.
Cost of generation at the plant bus bar: The levelized cost of energy generation is the
preferred tool to compare different power generation technologies of unequal economic life,
capital cost, efficiencies (or heat rates), and fuel costs [55]. The levelized cost of electricity
generation can be calculated according to the formulae presented below.
Here represents the power generating plant (1, 2, . . . . , ), is the total number of power
generating plants serving to the central grid, iE is the annual electricity output at the bus bar
(kWh) of plant i which can be obtained as �� � � , is is the fraction of
generated power consumed by the auxiliaries of plant i , is the capital recovery factor for
plant i of life t years and can be calculated according to Wang et al. [87] as
�
�, iP is the rated capacity of the generator unit in kW, iI is the capital
cost of plant measured in (US$/kW), � is the heat rate3 of the plant measured in
3
Heat rate is the thermal performance or energy efficiency of a thermal power plant for a specified period
of time and measured in MJ/kWh. A power plant has heat rate 10 MJ/kWh means that 10 MJ of heat
energy which is input into the engine will result in conversion to 1 kWh of electricity.
� �
�
�
� �� � ��
(22)

29
(MJ/kWh), and is the fuel cost (US$/MJ), � is the plant capacity factor4, is the real
interest rate, and � is the fraction of the capital cost for annual operation and maintenance of
plant .
Cost of transmission of electricity: The power grid serves to transport electric power from the
generators to the low voltage distribution substations. The cost of power transmission is
associated with capital costs, operation and maintenance costs, and technical losses and
depends on the specific power system configuration. The path travelled by electricity through
the transmission network is very difficult to trace in a large national electricity transmission
network. ESMAP [2] has summarized the levelized cost of power transmission ( ) for
four power generation configurations from a developing countries perspective (see Table 6).
Table 6. Levelized cost of electricity transmission ( ).
Large scale Small scale Mini-
grid
Off-grid
Typical generator size
(kW)
50-300 MW 5-50 MW 5-250
kW
0.3-5.0 kW
Transmission costs 0.25 US¢/kWh
(100 km circuit)
0.5 US¢/kWh
(20 km circuit)
None None
Source: [2]
Transmission and distribution (T&D) losses: In developing country situations, the losses in
electric power output from generator to customer can vary from 10% in a well-designed and
maintained power grid to 25% or more in an ordinary power grid.
Cost of distribution of electricity: The cost of electricity distribution mainly depends on the
line length (circuit-km5) of the distribution conductors, and the size and number of
distribution equipment installed. The levelized cost of electricity distribution can be
calculated using Eq. 23 below.
4 Plant capacity factor is the ratio of actual output of a power plant over a period of time and its potential
output if it had operated at full nameplate capacity the entire time.
5 Circuit-km is the line length in km required for extending the grid electricity services.
�
�
��
(23)

30
where, is the levelized cost of electricity distribution in US$/kWh; is the power
factor of transformers, (US$/kVA) is the unit capital cost of distribution transformers;
(km) is the total length of the electricity distribution line (circuit-km); (US$/km) is the
unit cost of an 11 kV distribution line; (US$/km) the unit cost of a 3-phase 400 V line;
(US$/km) is the unit cost of a 1–phase 230 V line; 11a , 4Wa and 2Wa are the percent
fractions of the total length (circuit-km) for 11 kV, 400 V and 230 V circuits, respectively; �
is the fraction of the total capital cost of the distribution system towards annual operation and
maintenance; (kW) is the anticipated load in the village for which the distribution system
has to be designed; and � (%) is the load factor (LF)6 in the village or cluster of villages
which to be served by the new distribution network.
Cost of delivered electricity by grid expansion: The estimated total cost of delivered
electricity (US$/kWh) by extending the grid in the remote villages can be estimated by
summing up its components using the following expression:
3.4.3 Cost of electricity from off-grid options
The cost of electricity delivered from off-grid options ( ) in the rural areas has been
widely studied and reported in the literature. REN21 [88] has estimated the cost of the
electricity supply by the most common renewable energy technologies in the rural areas. The
ESMAP [2] technical report presents a cost review of a range of off-grid/mini-grid
technologies covering a wider spectrum of capacities from 50 W to 100 kW. Several other
studies have also presented site-specific levelized electricity supply costs for off-grid options
in developing countries context [32, 89-91].
3.4.4 Critical line length (circuit-km) for grid extension
The critical grid extension line length can be determined by comparing the electricity supply
costs by grid extension and off-grid options. The critical line length (or circuit-km) is the
length beyond which a stand-alone or mini-grid system has a lower cost of delivered
electricity than that of the grid extension. If the site requires less line length (circuit-km) than
the critical length, then the grid extension appears to be more cost-effective than the off-grid 6 Load factor (LF) is the ratio of average load to the anticipated load of a power system over a period of
time.
� � (24)

31
options. On the other hand, if the site requires more circuit-km than the critical length, then
the off-grid supply options would be economically preferable. The critical line length (or
break-even length), (km), can be calculated for different off-grid alternatives using
Eq. (25).
For = 1, . . . , , where stands for the off-grid option among different alternatives.
Equation (25) shows that the delivered cost of electricity varies with the anticipated load-to-
line length ratios for a local setting.
3.4.5 Multicriteria decision aiding tool
Multicriteria decision aiding (MCDA) is a methodology that helps decision makers (DMs) to
choose their most preferred alternative from a discrete set X = {x1, …,xi, …, xm}, where each
xi is measured in terms of multiple criteria (indicators). The methodology provides a decision
model that combines the criteria measurements with decision makers’ preferences to rank the
alternatives. Most commonly, an additive utility function is applied [92].
where is the criteria measurement of the alternative with respect to the criterion, and
the partial utility function transforms the criteria measurements to a scale from 0 to 1,
where 0 corresponds to the worst outcome and 1 corresponds to the best outcome. The vector
of weights represents the DM’s preferences. The weights are assumed to be non-negative
and normalized. Therefore, the feasible weight space is � � � and�
� .
Given fixed values for and , the utility function determines the rank of each alternative as
rank(i,x,w) = 1+��k�i�(u(xk,w)>u(xi,w)) where ρ (true) = 1 and ρ (false) = 0.
However, in many real-life problems, preference information from multiple decision makers
may be difficult to obtain, and most of the associated information possesses a degree of
uncertainty or impreciseness. Sometimes preference information can even be missing. Also, if
preference information can be obtained from the DMs, it is unclear how the preferences of
��
� �
�
(25)
�
� (26)

32
several DMs that disagree should be combined. To overcome these limitations, Lahdelma et
al. [93] developed the Stochastic Multicriteria Acceptability Analysis (SMAA) method.
Among the different variants of the SMAA method, this thesis utilizes SMAA-2 (and its
variant, SMAA-O, which can treat mixed ordinal and cardinal criteria) [94].
3.5 PV system integration into a rural electric feeder (Publication V)
Grid-connected PV has been identified as the fastest growing power generation technology in
mitigating the ongoing supply shortage in developing countries [95]. In India, for example, a
2.12 MW grid-interacted PV power plant was installed in 2008, and an additional 5 MW
project is under construction [96]. Grid-connected PV offers many advantages over off-grid
PV supply, including no need for batteries and other related accessories [15]. Apart from its
own generation, Bangladesh has also been purchasing fossil-based electricity from privately
owned ‘Independent Power Producer’ (IPP) at a higher price for its national grid. As the
purchasing price of electricity from IPP is high, it could be possible to produce electricity by
renewables at a similar price. A study found that a 1 MW grid-connected PV system in
Bangladesh has the potential to generate up to 1844 MWh of electricity annually [97]. This
section briefly describes the methodology to perform viability analysis of a hypothetically
integrated centralized PV system into a real rural electric feeder. The financial
competitiveness of this integrated PV system is compared with fossil fuel based private IPP
generation.
3.5.1 Optimization and financial analysis
To determine a PV system that best balances local needs, optimization between grid and PV
system is required. Numerous articles have been written about the optimal economic design of
components such as PV, Wind, Diesel and Battery [98]. HOMER, a system optimization tool
can optimize both off-grid and grid-connected power systems for a variety of generation mix
[99]. RETScreen, a clean energy project analysis software program developed by the
government of Canada, was used to evaluate the financial viability of the systems [100]. The
model’s algorithms for financial evaluation are as follows:
Cash outflow, for year .
where is the annual operation & maintenance costs of the PV systems, is the inflation
rate, is the periodic costs or credits incurred by the system, and is the annual debt
� (27)

33
payment, while the cash outflow at year zero ( ) is if (US$) is the total initial
cost of the project and is the debt ratio. Cash inflows, for year can be calculated as:
where is the annual income from energy selling, is GHG reduction income, is
the GHG credit escalation rate, and s the energy cost escalation rate. At year zero, the only
cash inflow is the sum of incentives and grants it received. The net cash flow ( ) for year is
.
3.5.2 Applied data for the analysis
Solar data: Solar inputs data are taken as a monthly averaged daily insulation incident on a
horizontal surface (kWh/m2/day) from NASA’s Surface Meteorology and Solar Energy (SSE)
website [101] for the proposed site of Laxmipur (22.3 º latitude, 91.8 º longitude).
Load profile: The monthly averaged daily load profile for the year 2010 is taken from the
Load monitoring center of Laximipur Palli Bidyut Samity (PBS) [102]. Hourly data for all
365 days are not available, so monthly-averaged daily load data was utilized to create the
hourly data, adding a daily 10% and hourly 5% noise portion.
Rural Feeder C: A centralized PV system has been introduced into the ‘rural feeder C’ of the
Laxmipur sub-station. The rural feeder is currently fed by a 10 MVA, 33/11 kV rural sub-
station situated in the Mozupur village in the Laxmipur district (Figure 5). The substation is
fed power from the nearest central grid, Maizdi (132/33 kV), through a 35 km long 33 kV
power line, which is made of a penguin 4/0 stranded ACSR (Aluminium conductor steel
reinforced) bare overhead conductor. The average power loss for this 33 kV line section is
found to be 1.6% of the power flow through it. The backbone of the feeder comprises 19.29
km of 11.0 kV lines that serves electricity to 10,145 clients in 45 villages at 240-400 volts
through several 11/0.240 kV distribution transformers. The peak demand of this feeder in
summer is 2.3 MW (17:00-22:00) and in winter is 1.80 MW (18:00-21:00).
Figure 5. Grid-connected PV system.
Rural S/SGrid sub-
station0.4/11 kV
Transformer
33 kV line 11 kV feeder
Inverter
Solar array
.t (1 ) (1 )� t tin ener e GHG GHGC C r C r (28)

34
The costs of the PV system and related parameters are presented in Table 7.
Table 7. Component costs and other parameters.
Parameters Unit Value
Per unit electricity price from IPP at rural
sub-station
US$/kWh 0.210
Cost of PV cell US$/Wp a 3.5
Lifetime of PV cell y 25
Annual operation & maintenance cost US$/kW 0.71
Cost of Inverter US$/Wp 0.21
Replacement cost of inverter US$/Wp 0.14
Lifetime of inverter y 10
Miscellaneous cost % of initial cost 3
Installation and spare parts % of initial cost 8.6
Inflation rate % 5
Nominal discount rate % 10
Derating factor % 97
Cost of transformer, (0.40/11 kV, y-y) US$/100 kVA 2 500 a Wp= watt peak
Sources: [89,97]

35
4. Results
This section presented question-wise results of five predefined research questions. This
section first presented research findings on the issues related to grid-based rural electrification
program. Then it presented findings related to evaluation and utilization of renewable
resources to supplement those areas where grid extension is not viable. The resulted
information are obtained through utilizing the methodological frameworks presented in
section 3.
4.1 Driving and hindering factors and essential policy elements for a grid-based rural electrification program (RQ1)
This sub-section outlined the driving and hindering factors involved in on-grid rural
electrification program and compiled the necessary elements to be integrated in the rural
electrification policy to overcome the challenges. The key factors that determine the
performance of rural electrification program, which were extracted from Bangladesh case and
illustrated in light of generic rural electrification challenges, are presented below.
4.1.1 Driving factors
Prioritized system investment: Maintaining a priority to extend distribution lines is one of the
challenges for a rural electrification program. Local areas that would appear to produce better
revenues should be given priority for the financial viability of the program. Every year,
sections of distribution lines are built because of political motives that are not justified on the
grounds of revenue. This misallocation has been kept low by adopting a master planning
system. Master planning is a clearly defined prioritizing process for line expansion based on
anticipated revenue generation. By sticking with this priority model, BREP has been able to
expand the distribution lines without undermining revenue preferences.
Community involvement: Community participation has been an important factor contributing
to the success of rural electrification. Every electricity user is a member of a rural electric
cooperative and has the right to be involved in the decision-making and policy-making
practices. This membership practice gives the electricity users a feeling of ownership in the
electric cooperative and encourages them to protect the assets from thieves and abuse.
Electricity users have been educated by arranging village meetings and training programs
about their responsibilities and the limitations of the power systems. Meetings with
community leaders are also held to disseminate information on the key rights and
responsibilities of the representatives. Rural industries, farming groups, and commercial

36
leaders are also invited to the meetings to ensure that their interests are not ignored. House-
wiring technicians are also selected from the local community so that they are easily available
and trusted; this also helps reduce the wiring cost.
Anti-corruption features: Anti-corruption features are another success tool for Bangladesh’s
rural electrification program. Meter reading and bill collection are the major areas vulnerable
to corruption and people trying to undermine the success of the electricity distribution
systems [98]. The anti-corruption mechanism is equipped with selection, training, job
contract, and cross-checking processes for meter reading and billing operations. Meter readers
are carefully selected and trained before being put on a master roll contract by cooperatives.
The meter reader’s reports are entered by billing assistants into a system, and they are used to
prepare the electric bills. The billing supervisors prepare a meter report register and cross-
check the entry made by the billing assistants. The meter reader’s reports are also cross-
checked by the people who deliver the monthly bills. The number of bills and the kWh
recorded in the electric bills must agree with the number of accounts read and the kWh posted
on the meter book control sheet.
Performance-based incentives: In order to improve the technical, operational, and financial
efficiencies and the quality of the services, a performance measure tool is introduced in the
cooperatives. This tool, called the Performance Target Agreement (PTA), consists of a clearly
stated set of goals. The agreement is also meant to guide the cooperatives in becoming more
self-sufficient and providing better customer services. As a reward for reaching the targets,
employees of the cooperatives get a bonus. Cooperatives that fail to achieve their targets face
financial penalties. The PTAs are set by considering the overall status of the cooperatives.
The PTA contains parameters that measure financial performance as well as technical and
operational competencies.
System loss monitoring: System loss monitoring is another important feature implemented to
improve the cooperative’s technical performance. This measure enables the cooperative to
make individual employees liable for losses incurred at substations, electric feeders, and line
sections. The managers of the cooperatives are required to visit the meters on a regular basis
and take readings from the substation power meters. All meters for industrial and other large-
scale consumers must be read within three days of the substation reading. In addition to the
substation meters, the cooperatives must place meters at all feeder outgoings and at
intermediate positions for long feeders. These readings make it possible to monitor system
losses and make the managers more accountable for carrying out their responsibilities.

37
Disconnection for non-payment: Payments and bills are quickly reconciled by billing systems.
Meters are to be disconnected after two months of non-payment. The finance section of the
cooperative prepares account lists for those who need to be disconnected. The disconnection
teams promptly carried out the disconnection. To restore the service after disconnection, the
charges along with all unpaid bills have to be paid [103].
Centralized supervision, decentralized operations: The BREP is characterized by centralized
planning, design, and construction and decentralized operational responsibility. Centralized
supervision enables the REB to monitor and evaluate the cooperatives’ performance using
standardized and objective tools. Decentralized operational responsibility through the
cooperatives ensures that the right personnel are empowered to make day-to-day operational
decisions [6].
Standardized procedures and practices: The REB has introduced a series of instructions on
planning, engineering, administrative, and business procedures. They have consistently been
put into practice throughout the entire program, covering all aspects of the development and
operations of the electricity distribution system. Standardization ensures the quality of the
operations and accelerates their growth, while giving operation engineers the opportunity to
share technical resources [24].
Exclusion of political parties: To be an eligible candidate for being a representative in a
cooperative (e.g., a director), one must not be an office bearer in any political party. This
requirement has helped isolate the rural electrification cooperatives from general politics. This
feature enables them to focus on economic, commercial, and technical criteria for determining
new connections and limits the scope for political intervention [103].
Prohibition of unions (CBA), and hiring and firing: A law prohibits unions from becoming
involved in cooperatives, although staff welfare organizations do exist. Unions involved in
many other organizations in Bangladesh have a painful history of diminishing the
performance of those organizations and offering shelter for corrupt staff and practices. This
factor prompted rural cooperatives to offer no mercy to wrongdoers or for bad practices and
instead to encourage good performance. The message “perform or be fired” sets the standard
that employees must work hard and abide by the cooperative’s principles.
4.1.2 Hindering factors
Institutional weakness: Institutional weakness has been the major reason for the deterioration
of the rural electrification program, and this weakness affects other issues as well. The main

38
reasons for the weakness are that the institutional structure makes the cooperatives unfit to
defy political influence and maintain autonomy for the REP. Due to the institutional
weakness, major donors feel reluctant to provide funding for this program until credible
reform has been made. Bangladesh’s REP has been enjoying a certain measure of autonomy,
but it has failed to defend the cooperative from political pressure in many ways, such as by
allowing it to defy master planning, to refuse to purchase non-standard materials, to refuse to
protect thieves, and to stamp out corruption.
Power supply shortages: Like other developing countries, Bangladesh lacks the capacity for
sufficient electricity generation, and thus there has been a huge gap between supply and
demand. Although only a portion of the rural population has been connected to the grid, the
demand is still largely unmet due to supply shortages. Rural clients in Bangladesh face a huge
amount of load shedding within the range of 10-18 hours a day during the hot summer days
due to national power generation shortages. Vigorous load shedding creates many problems,
such as (1) decreases in collection rates, (2) increases in power theft, (3) lower staff morale,
(4) decreases public interest, and (5) diminishes the reputation of the program. The power
shortage problem hinders expansion of rural electrification in Bangladesh to a large extent.
Unrealistic power tariffs: Considering what rural clients can afford, the tariffs for the
domestic loads have been set artificially low. The higher percentage of domestic loads with an
unconvincingly low price prevents the BREP from achieving financial stability. Studies have
found that if the electricity price increased to a realistic level, the households would still not
be spending that much more money than they would for kerosene for lighting. Several studies
of rural households have found that each household without electricity spends on average 2.85
US$ to 5 US$ per month for lighting. The average household’s electricity consumption in
Bangladesh per month is 64 kWh. This means the cost will not go beyond their spending limit
if tariffs are increased to a realistic level.
Shortage of funding: Rural electrification in Bangladesh, like other developing countries, has
been primarily supported by donor agencies. The international donor agencies prefer to
support the renewable-based rural electrification program. Major donor agencies are reluctant
to provide funding for the on-grid rural electrification program due to institutional weakness
issues. As the development budget is hugely dependent on donors’ funding, the donors’
reluctance to invest in the program has meant that the annual budget has been cut, slowing
growth.

39
4.1.3 Essential policy elements
Although globally, many rural electrification programs are struggling due to the lack of
effective policy settings, a number of rural electrification programs have achieved remarkable
success by employing a diverse set of program designs. This thesis observed that a rural
electrification program requires some key elements to be integrated in the concerned policy
settings. These policy elements guide the rural electrification program towards success
through addressing distinct rural electrification challenges. The essential elements for rural
electrification program, which are formulated in line with Bangladesh’s experience and in
light of generic rural electrification challenges, are presented in Table 8.
Table 8. Essential policy elements for successful rural electrification.
Policy elements Challenges to deal with
� Transparent criteria for project prioritization
based on:
o Capital investment costs
o Density of load and consumers
o Contribution from local communities
� Selection of infeasible areas
� No priority for economic merits
� Lack of discipline in area selection
� Community involvement through
o Community level meeting
o Democratic participation
o Hire wiring crews from local community
o Village advisers
o Training for the clients
� Right-of-way
� Thieving, cheating, and misuse of
electricity and infrastructure
� Non-payment of bills
� Efficient billing features for
o Effective metering and billing
o Proficient recoding of electric bills,
collection bills, and
o Disconnecting services for non-payment
� Cheating
� Lack of commercial practices
� Higher system losses
� Separate implementing and supervising
agencies
� Lack of accountability and
efficiency in financial and
management operations.
40
Table 8. (contd.)
Policy elements Challenges to deal with
� Incentive provisions for efficient staff
� Inefficient operation
� Low staff morale
� Standardized procedures and practices:
o Standard specification for materials and
designs
o Maximize single-phase design
o Minimize low voltage line
� High capital cost
� High operating and maintenance
costs
� Low load densities
� Professional management practices:
o Disconnection for non-payment
o Exclusion of political parties
o Prohibition of unions
� Higher system loss
� Lack of sustainable business
management
� Higher operation and maintenance
cost
� Lack of customer service
� Smart subsidy:
o Provide long-term soft loan
� Customers’ affordability is low
� Poorly administered subsidy
� Low connection fee
o Spreading a portion of capital costs over
the electricity price
� Up-front hindrance for a new
connection
� Lower connection rate
� Customer feedback through village advisers � Lower motivation to pay bills
� Customer dissatisfaction
4.2 Electricity generating potentials of agricultural residues (RQ2)
The thesis has assessed the potential of sustainable agricultural residues in five South Asian
counties – Bangladesh, India, Nepal, Pakistan, and Sri Lanka by applying the methodological
framework presented in section 3.2. The available residues from crops and livestock and their
total electricity generating potential per rural household were determined. The electricity
generating potential of these residues was determined considering their conversion through

41
the Anaerobic Digestion process. The annual electricity generating potential per household in
the five countries is depicted in Table 9.
Table 9. The electricity generating potential per rural household (HH) in five countries.
Country
Energy
potential
(thermal) from
freely
collectable
agricultural
residues (PJ/y)
Electricity
generating
potential
(TWh/y)
Number
of rural
HHs
(million)
[104]
Average
electricity
potential per
rural
household
(kWh/y)
Basic
demand per
rural
householda
(kWh/y)
Bangladesh 230 16.7 24.5 679 360 [105]
India 1570 113.0 138.2 820 365 [106]
Nepal 53 3.8 5.3 724 365b
Pakistan 282 20.4 16.4 1238 365b
Sri Lanka 22 1.5 3.2 479 360 [107] aA hypothetical demand which is considered as a lifeline goal from off-grid renewable-
based energy systems in rural areas. bAuthor’s consideration.
This result means that a significant amount of bio-resources are available from agricultural
residues for modern energy applications in the selected South Asian countries. The estimated
annual electricity potentials from the residues per household in Bangladesh, India, Nepal,
Pakistan and Sri Lanka are much higher than the basic electricity demand of rural households.
4.3 Viability for serving clean-cooking and electricity loads through hybrid biogas and
solar resources (RQ3)
4.3.1 Optimal system configurations
This thesis has determined the optimal configurations of the power generating components
that match the energy demands (both electric and thermal) of three categories of households.
The optimized system components, total annualized cost, annual electricity production, and
biogas consumption for all three category households are presented in Table 10. The

42
presented configurations are capable of serving both heat (for clean-cooking) and electricity
to the households at an electricity price (LCOE) of 0.384 US$/kWh, 0.354 US$/kWh, and
0.341 US$/kWh, respectively, for HHC1, HHC2 and HHC3 without facing any capacity
shortage. Biogas required by each household corresponds to 30 kg, 45 kg, and 56 kg cattle
dung per day for HHC1, HHC2 and HHC3, respectively.
Table 10. System architecture for meeting energy demands for three household categories.
Household
category
System architecture Total
annualized
cost (US$/y)
LCOE
(electricity)
(US$/kWh)
Electricity
production
(kWh/y)
Annual
biogas
requirement
(m3/y)
HHC1 PV 0.2 kW
Converter 0.3 kW
DGE 0.6 kW
Battery 1080 Ah, 6V
Cycle charging
282 0.384 PV = 333,
DGE = 461
449
HHC2 " 344 0.354 PV=333,
DGE=670
657
HHC3 " 394 0.341 PV=333,
DGE=817
828
This result means that a hybrid biogas and solar system can potentially serve both thermal
(clean-cooking) and electricity loads in rural areas if households possess 3 to 6 cattle per
household. The optimization results give that all 3 household categories require system
architecture of same sizes. This is because, in the simulation search space, the minimum size
of digester gas engine (DGE) system was restricted to 0.6 kW that resulted over sizes of DGE
and batteries. The oversized DGE system forced the batteries to receive energy from both PV
and DGE system. The oversized DGE system has a significant effect to increase the LCOE as
it causes more losses due to bidirectional power flows in batteries and converters. Thus,
availability of gas engine of size less than 0.6 kW would cause further decrease of LCOE.

43
4.3.2 Monetary saving by adopting new technologies
This thesis has weighted the saving in monetary terms for shifting from conventional fuels
such as fuelwood, kerosene, and batteries to new fuel sources- solar and biogas. The annual
savings for displacing the conventional fuels for HHC1, HHC2, HHC3 were found to be 309
US$/y, 381 US$/y, and 412 US$/y, respectively. HHC1 incurred a total annualized cost of
282 US$/y for new service, while it would save 309 US$/y, which means that the savings
exceed the cost if HHC1 shifts its energy service from conventional to new technologies.
Figure 6. Variations in LCOE (electricity), SCR and TAC against various dung prices.
The costs and savings depend on the price of feedstock materials, which varies significantly
in different circumstances. The total annualized cost (TAC) increases almost linearly with
increases in the dung price, which results in decreases in the saving-cost ratio (SCR) (Figure
6). For example, for HHC2, the TAC is 234 US$/y for a dung price of 0.10 US$/m3, while the
TAC is 439 US$/y for a dung price of 0.50 US$/m3, which yield SCR 1.63 and 0.87,
respectively. This sensitivity results show that even at a higher dung cost (for example, 0.30
US$/m3), the savings-cost ratios still remain more than 1 for the household categories 1 and 2.
The LCOE (electricity) also varies significantly with variations in dung price. For example,
the LCOE (electricity) is 0.263 US$/kWh for a dung price of 0.10 US$/m3, while it is 0.39
US$/kWh if the dung price is set at 0.50 US$/m3 for HHC2.

44
These results mean that the economics of the new energy services will still be better, even if
households collect or buy dung at a slightly higher price as long as the energy consumption
level remains the same.
The variation in current fuel prices (e.g., fuelwood) also has a significant effect on the annual
savings and thus also on the savings-cost ratios. The SCR increases linearly with increases in
fuelwood prices (Figure 7). For instance, the SCR is 0.82 for the fuel-wood price of 0.01
US$/kg and 1.21 for the fuelwood price of 0.07 US$/kg for HHC3. Thus, the trend of
increasing prices for fuelwood (which is indeed the reality) makes the PV and gas engine
hybrid system even more attractive in terms of monetary savings.
Figure 7. Variation in SCR with fuelwood prices.
4.3.3 Appraisal from ongoing biogas plants (from a practical case survey)
To validate the practical applicability of the biogas, this thesis investigated this matter through
practical case findings from a questionnaire survey of 72 biogas plant households. The
households’ annual incomes varied depending on many factors, such as assets owned by the
households, the nature of the livelihood of household members, and ownership of livestock.
More than 70% of the surveyed households have an annual income of more than 1600 US$,
and 21% have an annual income between 801 US$ and 1600 US$. About half (48%) of the
households installed biogas plants to serve their cooking energy needs and get relief from
problems related to collecting and burning biomass. About 60% of the households maintained
that they have achieved time savings by installing biogas plants, and household members
could spend more time with family members and guests. They also asserted that the use of

45
biogas increased children’s spare time. Around 50% of the households observed that the
biogas brought a positive impact on their health by creating a pollution-free environment in
the kitchen and relieved their members from health issues such as inhalation, skin disease, fire
accidents, etc., and improved their food habits and reduced health-care costs.
About 55% of the households expressed that the amount of biogas was sufficient to meet their
cooking needs. Some households (27%) even maintained that the biogas amount was more
than they needed. The households were also asked about their satisfaction with the biogas
plant services. The majority of households (73%) were satisfied with the biogas plants. The
survey also found that the households studied possessed an average of 4.5 cattle per
household.
4.4 Choices of technology options for rural electrification (RQ4)
4.4.1 Critical length for grid line extension
This thesis has determined the critical line lengths (or circuit-km) against renewable energy
technologies – solar PV, biogas plant, wind turbine, PV-wind hybrid, and non-renewable
technology diesel generator by applying methodology described in section 3.4. The costs of
delivered electricity by the grid expansion and off-grid technologies with various line lengths
are depicted in Figure 8. The intersection points between cost of grid lines and off-grid
technologies are the critical line length for grid expansion. For example, if a line section has a
load factor of 50%, the critical grid extension length (circuit-km) for a 10 kW load will be
12.8 km at off-grid supply cost of 0.50 US$/kWh (solar PV).

46
Figure 8. Critical line lengths for grid expansion against five off-grid technologies.
4.4.2 Critical load to circuit-km ratio
The LCOE for grid expansion is merely a function of the anticipated load to circuit-km ratio
( / )PL dP x , and therefore the viability of grid expansion against off-grid options can be
represented by ( / )PL dP x (Figure 9). The intersections between off-grid costs lines and the grid
extension curves are the least anticipated load to circuit-km ratios for viable grid expansion
against off-grid alternatives. For example, the cost line for PV-wind-hybrid ( =0.35) and
the grid extension curve for load factor 0.50 intersects at the point of anticipated load to
circuit-km ratio 1.2 kW/km, which means that the critical line length against this off-grid
alternative is 1 km if the line has an anticipated load of 1.2 kW and the critical line length will
be 2 km if the line has an anticipated load of 1.2�2=2.4 kW and so on.

47
Figure 9. Anticipated load to circuit-km ratios ( / )PL dP x against off-grid configurations.
According to the above analysis, the critical line lengths for the selected area (village) were
found to be 1.8 km, 5.0 km, 7.8 km, 13.9 km, and 23 km against off-grid costs of 0.15
US$/kWh (biogas plants), 0.20 US$/kWh (diesel generator), 0.25 US$/kWh (wind turbine),
0.35 US$/kWh (PV-wind-hybrid), and 0.50 US$/kWh (solar PV), respectively. In fact, the
village requires a 24.1 km line for supplying grid electricity services. Therefore, this village
was found to be non-viable for grid expansion against all of the off-grid options.
4.4.3 Ranking of off-grid technologies
As grid expansion is not a viable option for the selected village, I have illustrated which off-
grid options would be best suited in terms of five sustainability dimensions. After simulation
with SMAA-O, it gives rank acceptability indices for all the alternatives (Figure 10). The rank
acceptability indices show how often an alternative will get this rank with any preference
weights. Figure 10 shows that solar PV and the biogas plant are the most attractive
alternatives for the first rank (b1) with 59% and 41% acceptability, respectively. Among
others, wind turbine, small-hydro, PV-wind hybrid, and diesel generator obtain zero
acceptability for their first ranks. The alternatives other than solar PV and biogas plants are
unlikely to be the most preferred alternatives, based on the assumed decision model.
0.10
0.15
0.20
0.25
0.30
0.35
0.40
0.45
0.50
0.55
0.60
0.65
0.70
0.75
0.80
0.85
0.90
0.95
1.00
1 3 5 7 9 11 13 15
Leve
lised
cos
ts o
f del
iver
ed e
lect
ricity
(US$
/kW
h)
Anticipated load to circuit-km ratio (kW/km)
Grid extension for LF 0.10
Grid extension for LF 0.20
Grid extension for LF 0.30
Grid extension for LF 0.40
Grid extension for LF 0.50
Grid extension for LF 0.80
Solar PV 1-25 kW
PV-wind-hybrid 1-25 kW
Wind turbine 1-25 kW
Diesel generator 1-25 kW
Biogas plant 1-25 kW

48
Figure 10. Rank acceptability indices.
The above rankings are obtained without any preference information, and therefore it is
necessary to check that the preferences are agreed by the DMs. Figure 11 presents the central
weights for the alternatives against all of the criteria. Figure 11 shows that the alternatives –
solar PV and biogas plants – are favored by the weight preferences that are uniformly
distributed among all five criteria dimensions. Solar PV and biogas plants look likely to get
DMs’ consent. The confidence factor is another term to check the acceptability of the results.
It is the probability for an alternative to be the preferred one with the preferences expressed
by its central weight vector. A high confidence factor indicates that the alternative is almost
certainly the most preferred one. The solar PV system and biogas plant have obtained a good
confidence factor, 98% and 87%, respectively. In contrast, diesel generator and wind turbine
are possessed with low confidence factors, 10% and 4%, respectively.

49
Figure 11. Distribution of central weights for efficient alternatives.
This above result means that the required length of the grid-line is more than the critical
distances against all the off-grid alternatives. Therefore, the grid extension is no more a
preferable (or exclusive) option to serve the studied village. The DMs might choose solar PV
(best option) or both options (best and second best) for extending electrification to this
village.
4.5 Economic viability of integration of centralized PV system into a rural electricity
feeder (RQ5)
4.4.1 Economic indicators
The optimized PV system can generate 43% of the total electricity demand of the feeder
against the current 40% shortfall at COE of 0.264 US$/kWh. The financial indicators- net
present value ( ), internal rate of return ( ), benefit cost ratio ( ) and simple payback
( ) are obtained with this optimized PV system, while the PV energy selling price was set to
0.264 US$/kWh. The financial indicators vary strongly with the variation in the electricity
selling price escalation rate while all other inputs are kept constant. is found negative
when the electricity price escalation rate was set to zero. The seems to reach zero at
2.2% of the yearly escalation rate (Figure 12). The is also less than 1 for a 0% escalation
rate, and it is found to be unity at a 2.0% escalation rate (Figure 12). The is 11.2 years
against the project life of 20 years. These indicators mean that the project is profitable if at
least the 2.2% electricity price escalation rate is considered.

50
Figure 12. Economic indicators while electricity selling price was set to (0.264US$/kWh).
4.5.2 Viable PV electricity selling price
The of the project was found to be positive when the PV energy selling price was set to
0.250 US$/kWh and electricity price escalation rate was fixed at 3% (Figure 13a). By
including the benefit from the clean energy project, i.e., income from GHG reduction (e.g., 30
US$/tCO2e) [108], the project was found to be viable at the electricity selling price of 0.235
US$/kWh. This is only 10% higher than the current IPP purchasing cost (Figure 13b).
Figure 13(a). Indicators with respect to PV electricity selling price.

51
Figure 13(b). Indicators while the clean tech benefit was included.
Figure 13. Variation of economic indicators with the PV electricity selling price.
If the utility wants to buy electricity from the PV system at the same price as it purchased
from IPP, the PV system needs a 5% electricity price escalation rate to make the
positive. The and is 10.2% and 1.02, respectively, when the electricity price
escalation rate was set to 5% annually. At this escalation rate, the PV system can produce
electricity at 0.205 US$/kWh, which is less than the IPP price (Figure 14).The simple
payback time now is 14.2 years.
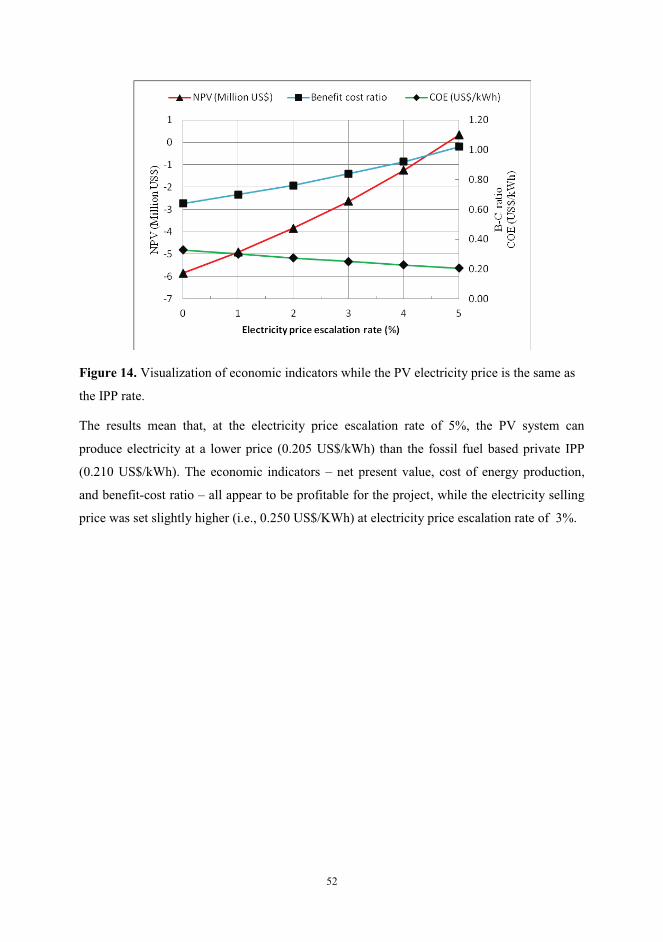
52
Figure 14. Visualization of economic indicators while the PV electricity price is the same as
the IPP rate.
The results mean that, at the electricity price escalation rate of 5%, the PV system can
produce electricity at a lower price (0.205 US$/kWh) than the fossil fuel based private IPP
(0.210 US$/kWh). The economic indicators – net present value, cost of energy production,
and benefit-cost ratio – all appear to be profitable for the project, while the electricity selling
price was set slightly higher (i.e., 0.250 US$/KWh) at electricity price escalation rate of 3%.

53
5. Discussion
Rural electrification process, as a whole, poses more challenges in terms of policy and
institutional requirements, selection of technologies, and capital financing than the urban
electrification process. Amidst these challenges, there are few developing countries which
have succeeded in this effort whereas many countries especially in South Asia and Sub-
Saharan Africa having their progress very slow and the coverage remains low. This thesis
examines the distinct rural electrification challenges, and factors remain behind the success
and failure of rural electrification program. From the lessons of Bangladesh REP and in light
of rural electrification challenges, it is evident that rural electrification program requires some
key policy elements to make the program a success. These policy elements should be
integrated into the concerned policy setting of rural electrification program. Despite these
essential policy elements are derived from the lessons of Bangladesh program, common
nature of these challenges validate them equally applicable for many other developing
countries.
If rural areas are found unviable for grid expansion, then off-grid options should be taken into
consideration. The thesis shows that deploying of renewable energy technologies are
potentially viable option based on resource availability and techno economic merits for rural
areas in many developing countries.
Significant amount of agricultural residues are available for electricity generation in South
Asian countries. The assessment considers anaerobic digestion process (biogas plants) for
converting residues into biogas because it is recognized as an environment friendly and cheap
technology in rural context. These residues can be utilized for electricity generation to meet
household-level basic electricity demands. The utilization of these residues proves financially
attractive and they do not compete with other applications. Despite the data processing
techniques and methodology are illustrated by utilizing data from South Asian countries, they
can be generally applicable for any other developing counties subject to applying site specific
residues characteristics values. The main challenge in applying this method is choosing or
determining the appropriate characteristic factors data that vary significantly over geographic
regions, harvesting practices, storage, ages etc. These presented data are obtained from
available literatures sources and can be used for estimation of potentials of residue resources.

54
Site specific characteristic values are essential to plan and design a specific rural
electrification project.
Conventional solid biomass based cooking is another problem in developing countries.
Although biogas and solar resources separately cannot practically meet both cooking and
electricity loads, their hybrid applications in households are very rare. Also these two
renewable resources are abundantly found in rural areas and they are separately utilized by
many households. This thesis shows that rural households can adopt biogas plants and solar
photovoltaic together to realize both their clean-cooking and electric loads. This thesis
considers animal manure for the feedstock of biogas plants by considering its widespread
application. Whereas both crop and animal residues could even produce more biogas than this
estimation.
Rural electrification decision choice needs to involve several sustainability criteria for their
long term sustainability. The presented multicriteria-based methodology facilitates to select
electrification options based on chosen sustainability criteria. This approach and data
processing techniques can be applied in any site attributed by rural area. If the electrification
decisions are made according to the predefined multiple criteria under all sustainability
dimensions, their chance of failure will be minimized.
These methods and evaluation results can be sought by decision makers to upgrade the rural
electrification policies and manage efficient, equitable and effective rural electrification
program. By enacting proper policies and judiciously utilizing abundant renewable resources,
developing countries can achieve electricity for all within an acceptable time framework. The
major limitation of this thesis is that all the methodologies and tools are illustrated through
Bangladesh’s case data, whereas data from other developing countries may give, to some
extent, different outcomes.

55
6. Summary and conclusions
Many developing countries in the world, particularly in South Asia and Sub-Saharan Africa,
have been struggling to accomplish rural electrification with having rural electrification pace
very slow and coverage low. The rural electrification program of Bangladesh received a very
distinctive status with respect to its representative features and its pioneer tackling of adverse
socioeconomic conditions in developing country. Based on the Bangladesh experience and
global-level success cases in developing country situations, it is evident that despite having
varied socio-political situations among developing countries, rural electrification programs
require some common elements to be included in their policy settings to make rural
electrification program a success. The key driving factors for the success of Bangladesh
program had to do with prioritizing system investments, community involvement, anti-
corruption features, standardized practices and performance-based incentives while excluding
political parties. On the other hand, hindering factors were found to be the lack of
organizational autonomy, shortage of funding, unrealistic tariffs, and power supply shortages.
According to the estimation by the assessment method, a significant amount of bio resources
are available from agricultural residues for modern energy applications in the selected South
Asian countries. The estimated annual electricity potentials from agricultural residues in
Bangladesh, India, Nepal, Pakistan, and Sri Lanka are about 680, 820, 720, 1200, and 480
kWh per household, respectively, and could be used to meet the basic electricity demand of
rural households.
The lack of clean-cooking fuels is a major hindrance for billions of rural people in developing
countries. Individual renewable resources alone cannot practically serve both clean-cooking
and electricity loads. Biogas plants together with solar PV systems can potentially serve both
thermal (clean-cooking) and electricity loads in rural households in Bangladesh if they
possess 3 to 6 cattle per household. The households can achieve monetary savings of worth
309 US$, 381 US$, and 412 US$ per year for household category1, 2, and 3, respectively,
which is more than their annual cost, with the aim of vastly improved services. The survey
results from the studied households made it clear that the biogas technology offers many
benefit to the users, and it is acceptable and within reach of many rural households. Almost all
the households would be satisfied with the biogas plant if some supportive measures (e.g.,

56
warrantee, maintenance support, and marketing facility for manure) are taken by the biogas
plant providers.
Rural electrification decisions are community conjugate process which need close focuses on
all the major sustainability dimensions. Social and environmental factors are usually
overlooked in the decision choice when selecting decentralized options, which makes them
imprudent against environmental and community challenges. Multicriteria decision support
for selecting the appropriate technologies would enable a rural electrification program to have
safeguarded itself from these challenges.
Facing severe power crisis in the grid for many developing countries, the addition of
electricity to the grid from integration of PV system can be a great step to reduce the supply
shortage. A PV system was integrated into a real rural electric-feeder in Bangladesh, and the
viability of the system was examined in terms of financial indicators. The analysis shows that
the rural grid can produce electricity from PV systems at the same price the fossil fuel-based
Independent power producers serve.
To sum up, a grid-based rural electrification program requires some key policy elements to be
integrated into the concerned policy settings to overcome the distinctive rural electrification
challenges. Developing countries can achieve efficient, equitable and effective rural
electrification programs by enacting these elements into their policy. Renewable resources
can potentially supplement rural electrification in many rural areas where grid expansion is
not viable through judicious application.

57
References
[1] Barnes DF, Khandker SR, Samad HA. Energy poverty in rural Bangladesh. Energy
Policy 2011; 39:894–904.
[2] ESMAP. Technical and Economic Assessment of off-grid, mini-grid and grid
Electrification Technologies. Washington, DC, USA: The World Bank Group; 2007.
[3] Palit D, Chaurey A. Off-grid rural electrification experiences from South Asia: Status
and best practices. Energy for Sustainable Development 2011;15: 266–76.
[4] World Bank. Financing for Rural Electrification and Renewable Energy Development
Project: Bangladesh. Washington, DC, USA: World Bank; 2010.
[5] UNSD. United Nations Statistics Division-Standard Country and Area Codes
Classifications (M49). NY: United Nations; 2013.
[6] Barnes DF. The challenge of rural electrification: strategies for developing countries.
1st. ed. Washington, DC, USA: Resources for the Future; 2007.
[7] UN. Energy for a Sustainable Future: The secretary-general’s advisory group on energy
and climate change (AGECC)-summary report and recommendations. New York: UN;
2010.
[8] World Bank. The Welfare Impact of Rural Electrification: A Reassessment of the Costs
and Benefits. Washington, DC, USA: The World Bank Group; 2008.
[9] Paul C. Infrastructure, rural electrification and development. Energy for Sustainable
Development 2011; 15:304–13.
[10] Mohan M. The economics of rural electrification projects. Energy Economics 1988;
10:3–17.
[11] Urmee T, Harries D, Schlapfer A. Issues related to rural electrification using renewable
energy in developing countries of Asia and Pacific. Renewable Energy 2009; 34:354–7.
[12] World Bank. Designing Sustainable off-grid rural electrification projects: Principles and
practices -operational guidance for World Bank Group Staff. Washington, DC, USA:
The World Bank; 2008.
[13] Haanyika CM. Rural electrification policy and institutional linkages. Energy Policy
2006; 34:2977–93.
[14] Ibrahim M, Anisuzzaman M, Kumar S, Bhattacharya SC. Demonstration of PV micro-
utility system for rural electrification. Solar Energy 2002; 72:521–30.
[15] Li DHW, Cheung KL, Lam TNT, Chan WWH. A study of grid-connected photovoltaic
(PV) system in Hong Kong. Applied Energy 2012; 90:122–7.

58
[16] ISES. Renewable Energy Future for the Developing World. Germany: International
Solar Energy Society; 2005.
[17] Kumar A, Mohanty P, Palit D, Chaurey A. Approach for standardization of off-grid
electrification projects. Renewable and Sustainable Energy Reviews 2009; 13:1946–56.
[18] Reddy BS, Srinivas T. Energy use in Indian household sector – An actor-oriented
approach. Energy 2009; 34:992–1002.
[19] Asaduzzaman M, Barnes DF, Khandker SR. Restoring Balance: Bangladesh’s Rural
Energy Realities. Washington, DC, USA: World Bank; 2010.
[20] Fulkerson W, Levine MD, Sinton JE, Gadgil A. Sustainable, efficient electricity service
for one billion people. Energy for Sustainable Development 2005; 9:26–34.
[21] IEA. Energy Poverty: How to make modern energy access universal? Special early
excerpt of the World energy outlook 2010 for the UN General Assembly on the
Millennium Development Goals. Paris, France: IEA; 2010.
[22] Peters J, Harsdorff M, Ziegler F. Rural electrification: Accelerating impacts with
complementary services. Energy for Sustainable Development 2009; 13:38–42.
[23] Alexandra Niez. Comparative study on rural electrification policies in emerging
economies: keys to successful policies. Paris, France: International Energy Agency;
2010.
[24] NRECA. Cooperative Development Case Studies Report: Cooperativa Rural de
Electrificación, Bolivia; Comilla Palli Bidyut Samity 1, Bangladesh. Virginia, USA:
NRECA International Ltd.; 2005.
[25] Zomers A. The challenge of rural electrification. Energy for Sustainable Development
2003; 7:69–76.
[26] Waddle D. Principles of Successful Expansion of Rural Electrification Programs.
Pacific Energy Summit, 2012.
[27] Holland R, Perera L, Sanchez T, Wilkinson R. Decentralized rural electrification:
Critical success factors and experiences of an NGO. Refocus 2001; 2:28–31.
[28] ARE. Renewable Energy Technologies for Rural Electrification -The role of the Private
Sector. Renewable Energy House, Brussels: Alliance for Rural Electrification (ARE);
2008.
[29] ARE. Hybrid mini-grids for rural electrification: Lessons learned. Renewable Energy
House, Brussels: Alliance for Rural Electrification (ARE); 2011.
[30] Javadi FS, Rismanchi B, Sarraf M, Afshar O, Saidur R, Ping HW, et al. Global policy of
rural electrification. Renewable and Sustainable Energy Reviews 2013; 19:402–16.

59
[31] ARE. Green light for renewable energy in developing countries: Shining a light for
progress. Renewable Energy House, Brussels: Alliance for rural electrification; 2010.
[32] Subhes C. B. Review of alternative methodologies for analysing off-grid electricity
supply. Renewable and Sustainable Energy Reviews 2012; 16:677–94.
[33] Munasinghe M. Rural electrification in the Third World. Power Engineering Journal
1990; 4:189–202.
[34] Zomers AN. Rural Electrification. PhD Thesis. University of Twente, the Netherlands,
2001.
[35] UNDP. Integrating Energy Access and Employment Creation to Accelerate Progress on
the MDGs in Sub-Saharan Africa. NY, USA: United Nations Development Program;
2012.
[36] Brundtland GH. Global Change and Our Common Future. Environment: Science and
Policy for Sustainable Development 1989; 31:16–43.
[37] Keeble BR. The Brundtland report: “Our common future.” Medicine and War 1988;
4:17–25.
[38] WEC. Deciding the Future: Energy Policy Scenarios to 2050-Promoting the sustainable
supply and use of energy for the greatest benefit of all. London: World Energy Council;
2007.
[39] ARE. Best practices of the Alliance for Rural Electrification: what renewable energy
can achieve in developing countries. Renewable Energy House, Brussels: Alliance for
Rural Electrification (ARE); 2011.
[40] Kammen D. Bioenergy in Developing Countries: Experiences and Prospects. Bioenergy
and Agriculture: Promises and Challenges, International Food Policy Research Institute;
2006.
[41] K Hossain A, Badr O. Prospects of renewable energy utilization for electricity
generation in Bangladesh. Renewable and Sustainable Energy Reviews 2007; 11:1617–
49.
[42] BE. Bioenergy in developed and developing countries. Educational website on Biomass
and Bioenergy, available at http://www.aboutbioenergy.info/ [Accessed 12 March,
2013].
[43] Calle FR, Groot PD, Hemstock SL, Woods J. The Biomass Assessment Handbook:
Bioenergy for a Sustainable Environment. Earthscan, UK, ISBN: 13:978-1-84407-285-
9; 2007.

60
[44] Bhattacharya SC, Abdul Salam P, Runqing H, Somashekar HI, Racelis DA, Rathnasiri
PG, et al. An assessment of the potential for non-plantation biomass resources in
selected Asian countries for 2010. Biomass and Bioenergy 2005; 29:153–66.
[45] Perera KKCK, Rathnasiri PG, Senarath SAS, Sugathapala AGT, Bhattacharya SC,
Abdul Salam P. Assessment of sustainable energy potential of non-plantation biomass
resources in Sri Lanka. Biomass and Bioenergy 2005; 29:199–213.
[46] Gómez A, Rodrigues M, Montañés C, Dopazo C, Fueyo N. The potential for electricity
generation from crop and forestry residues in Spain. Biomass and Bioenergy 2010;
34:703–19.
[47] Prasertsan S, Sajjakulnukit B. Biomass and biogas energy in Thailand: Potential,
opportunity and barriers. Renewable Energy 2006; 31:599–610.
[48] Li R, Chen S, Li X. Biogas Production from Anaerobic Co-digestion of Food Waste
with Dairy Manure in a Two-Phase Digestion System. Applied Biochemistry and
Biotechnology 2010; 160:643–54.
[49] Rofiqul I. M, Rabiul I. M, Rafiqul A. M. Renewable energy resources and technologies
practice in Bangladesh. Renewable and Sustainable Energy Reviews 2008; 12:299–343.
[50] Gómez A, Zubizarreta J, Rodrigues M, Dopazo C, Fueyo N. Potential and cost of
electricity generation from human and animal waste in Spain. Renewable Energy 2010;
35:498–505.
[51] Karaj S, Rehl T, Leis H, Müller J. Analysis of biomass residues potential for electrical
energy generation in Albania. Renewable and Sustainable Energy Reviews 2010;
14:493–9.
[52] Rao PV, Baral SS, Dey R, Mutnuri S. Biogas generation potential by anaerobic
digestion for sustainable energy development in India. Renewable and Sustainable
Energy Reviews 2010; 14:2086–94.
[53] Khalid A, Arshad M, Anjum M, Mahmood T, Dawson L. The anaerobic digestion of
solid organic waste. Waste Management 2011; 31:1737–44.
[54] Diaf S, Diaf D, Belhamel M, Haddadi M, Louche A. A methodology for optimal sizing
of autonomous hybrid PV/wind system. Energy Policy 2007; 35:5708–18.
[55] Short W, Packey DJ, Holt T. A Manual for the Economic Evaluation of Energy
Efficiency and Renewable Energy Technologies. Golden (CO): NREL; 1995.
[56] Rothwell GS, Gómez T. Electricity economics: regulation and deregulation. John
Wiley, USA; 2003.

61
[57] Bhattacharya SC, Thomas JM, Abdul Salam P. Greenhouse gas emissions and the
mitigation potential of using animal wastes in Asia. Energy 1997; 22:1079–85.
[58] FAOSTAT [database on the Internet]. Rome-Italy: Food and Agriculture Organization
of the United Nations; 2010- [cited 2010 Aug 15] Production, Livestock Primary;
Available from http://faostat.fao.org/ Files updated annually.
[59] Junginger M, Faaij A, van den Broek R, Koopmans A, Hulscher W. Fuel supply
strategies for large-scale bio-energy projects in developing countries. Electricity
generation from agricultural and forest residues in Northeastern Thailand. Biomass
Bioenerg 2001; 21(4):259–75.
[60] Singh J, Panesar BS, Sharma SK. Energy potential through agricultural biomass using
geographical information system: A case study of Punjab. Biomass Bioenerg 2008;
32(4):301–7.
[61] IDCOL. Final survey report on biogas plants installed in Bangladesh. Dhaka,
Bangladesh: Infrastructure Development Company Ltd (IDCOL); 2005.
[62] IEA. World energy outlook 2006: Focus on key topics. Paris, France: International
Energy Agency (IEA); 2006.
[63] Miah MD, Kabir RRMS, Koike M, Akther S, Yong Shin M. Rural household energy
consumption pattern in the disregarded villages of Bangladesh. Energy Policy 2010;
38:997–1003.
[64] World Bank. Expenditure of Low-Income Households on Energy. Washington, DC,
USA: World Bank; 2010.
[65] Miah MD, Al Rashid H, Shin MY. Wood fuel use in the traditional cooking stoves in
the rural floodplain areas of Bangladesh: A socio-environmental perspective. Biomass
and Bioenergy 2009; 33:70–8.
[66] Singh KJ, Sooch SS. Comparative study of economics of different models of family size
biogas plants for state of Punjab, India. Energy Conversion and Management 2004;
45:1329–41.
[67] Katuwal H, Bohara AK. Biogas: A promising renewable technology and its impact on
rural households in Nepal. Renewable and Sustainable Energy Reviews 2009; 13:2668–
74.
[68] HOMER. Hybrid Optimization Model for Electric Renewables. CO, USA: HOMER
Enertgy, LLC; 2012.
[69] HYBRID2. The hybrid power system simulation model. MA, USA: Renewable Energy
Research Laboratory (RERL); 2012.

62
[70] HOGA. Hybrid Renewable Optimization by Genetic Algorithms. Spain: University of
Zaragoza; 2012.
[71] Lambert T, Gilman P, Lilienthal P. Micropower System Modeling with Homer. In:
Farret FA, Simoes MG, editors. Integration of Alternative Sources of Energy, John
Wiley & Sons, Inc.; 2006, p. 379–418.
[72] Grameen Shakti. Biogas plant survey report-2011. Dhaka, Bangladesh: Grameen
Shakti; 2011.
[73] Bala B, Siddique SA. Optimal design of a PV-diesel hybrid system for electrification of
an isolated island--Sandwip in Bangladesh using genetic algorithm. Energy for
Sustainable Development 2009; 13:137–42.
[74] REB. Load Information System. Dhaka, Bangladesh: System Operation Management,
Rural Electrification Board; 2010.
[75] Grameen Shakti. Price List. Mirpur, Dhaka, Bangladesh: Grameen Shakti; 2012.
[76] Schleicher-Tappeser R. How renewables will change electricity markets in the next five
years. Energy Policy 2012; 48:64–75.
[77] Givler T, Lilienthal P. Using HOMER Software to Explore the Role of Gen-sets in
Small Solar Power Systems: Case study-Sri Lanka. Washington, DC, USA: National
Renewable Energy Laboratory; 2005.
[78] Rahman MM, Paatero JV. A methodological approach for assessing potential of
sustainable agricultural residues for electricity generation: South Asian perspective.
Biomass and Bioenergy 2012; 47:153–63.
[79] Kandpal TC, Joshi B, Sinha CS. Economics of family sized biogas plants in India.
Energy Conversion and Management 1991; 32:101–13.
[80] Bala BK, Hossain MM. Economics of biogas digesters in Bangladesh. Energy 1992;
17:939–44.
[81] Tshewang L. Rural electrification in Bhutan and a methodology for evaluation of
distributed generation system as an alternative option for rural electrification. Energy
for Sustainable Development 2008; 12:13–24.
[82] Elisabeth I. Indicators for assessment of rural electrification-An approach for the
comparison of apples and pears. Energy Policy 2008; 36:2665–73.
[83] Ilskog E, Kjellström B. And then they lived sustainably ever after? Assessment of rural
electrification cases by means of indicators. Energy Policy 2008; 36:2674–84.

63
[84] Cherni JA, Dyner I, Henao F, Jaramillo P, Smith R, Font RO. Energy supply for
sustainable rural livelihoods. A multi-criteria decision-support system. Energy Policy
2007; 35:1493–504.
[85] IAEA. Energy indicators for sustainable development: Guidelines and methodologies.
Vienna, Austria: International Atomic Energy Agency; 2005.
[86] Nouni MR, Mullick SC, Kandpal TC. Providing electricity access to remote areas in
India: An approach towards identifying potential areas for decentralized electricity
supply. Renewable and Sustainable Energy Reviews 2008; 12:1187–220.
[87] Wang H-C, Jiao W-L, Lahdelma R, Zou P-H. Techno-economic analysis of a coal-fired
CHP based combined heating system with gas-fired boilers for peak load compensation.
Energy Policy 2011;39:7950–62.
[88] REN21. Renewables Global Status Report 2007. Paris, France: Renewable energy
policy network for the 21st century; 2007.
[89] Mondal AH, Denich M. Hybrid systems for decentralized power generation in
Bangladesh. Energy for Sustainable Development 2010; 14:48–55.
[90] Nandi SK, Ghosh HR. Prospect of wind–PV-battery hybrid power system as an
alternative to grid extension in Bangladesh. Energy 2010; 35:3040–7.
[91] Kumar Nandi S, Ranjan Ghosh H. Techno-economical analysis of off-grid hybrid
systems at Kutubdia Island, Bangladesh. Energy Policy 2010;38:976–80.
[92] Jacquet-Lagreze E, Siskos J. Assessing a set of additive utility functions for
multicriteria decision-making, the UTA method. European Journal of Operational
Research 1982; 10:151–64.
[93] Lahdelma R, Hokkanen J, Salminen P. SMAA - Stochastic multiobjective acceptability
analysis. European Journal of Operational Research 1998;106:137–43.
[94] Lahdelma R, Miettinen K, Salminen P. Ordinal criteria in stochastic multicriteria
acceptability analysis (SMAA). European Journal of Operational Research 2003;
147:117–27.
[95] ADB. Solar Energy Development in South Asia. Manila: Asian Development Bank;
2009. Available at http://www2.adb.org/Documents/TARs/REG/43522-REG-TAR.pdf.
[96] CDM: 5 MW. CDM: 5 MW Solar PV Power Project in Sivagangai Village, Sivaganga
District, Tamil Nadu: India; 2008. Available at http://cdm.unfccc.int [Accessed 24 July,
2011].
[97] Mondal MAH, Islam AKM. Potential and viability of grid-connected solar PV system
in Bangladesh. Renewable Energy 2011; 36:1869–74.

64
[98] Nandi SK, Ghosh HR. A wind-PV-battery hybrid power system at Sitakunda in
Bangladesh. Energy Policy 2009; 37:3659–64.
[99] Bernal-Agustín JL, Dufo-López R. Simulation and optimization of stand-alone hybrid
renewable energy systems. Renewable and Sustainable Energy Reviews 2009;13:2111–
8.
[100] RETScreen. RETScreen International, natural resources Canada 1997–2008. Available
from http://www.retscreen.net/ang/home.php [Accessed 10 June 2011].
[101] SMSE. NASA Surface meteorology and Solar Energy: A renewable energy resource
website. Available at http://eosweb.larc.nasa.gov/sse/ [Accessed 10 July, 2011].
[102] LPBS. Laxmipur Palli Bidyut Samity (Rural Electric Co-operative). Laxmipur,
Bangladesh: Laxmipur Rural Electric Cooperative; 2011.
[103] Nathan AI. Integrity in Bangladesh’s Rural Electrification. Dhaka, Bangladesh: The
United States Agency for International Development (USAID) Dhaka Branch; 2006.
[104] UNDP. UNDP around the world. NY: United Nations Development Program;
2011.Available from http://www.undp.org/ [Accessed 22 August 2011].
[105] Ministry of Power, Energy and Mineral Resources. National Energy Policy of
Bangladesh 2004.Dhaka, Bangladesh: The power cell; 2004.
[106] Ministry of Power, India. Rural Electrification Policy. New Delhi, India: The Gazette of
India; 2006.
[107] Ministry of Power and Energy, Government of Sri Lanka. National Energy Policy and
Strategies of Sri Lanka. Colombo, Sri Lanka; 2008.
[108] Massey J. Carbon credit and how you can make money from it. Rediff India Abroad
2008. Available at http://www.rediff.com/money/2008/feb/o5inter1.htm. [Accessed 19
Sep 2011].

9HSTFMG*affhih+
![] P ] v P Z ' W } u µ ^ ] v W rDKK ( } & ] ^ u ^ µ v · 2020. 10. 13. · /^^E í ð ó õ r ð ð ì ï î ð ô W/> Z ( v Z ] W ^ ] o U X U o X U î ì î ì X ] P ] v P Z ' W](https://img.dokumen.tips/doc/110x75/6121b323e279a84889398086/-p-v-p-z-w-u-v-w-rdkk-u-v-2020-10-13-e.jpg)
![Lista Curso Propedeutico · 2021. 6. 6. · w x w >>/ k^ x w >>/ kekd z ] p } l o ] p o } } u ð ñ e' >d w/ e w k> ð ò e' > ^w >d z/ew z> ð ó e'h/ ek e'h/ ek > : e zk ð ô e'h](https://img.dokumen.tips/doc/110x75/6140320de59fcb3c636a577a/lista-curso-2021-6-6-w-x-w-k-x-w-kekd-z-p-l-o-p.jpg)


![Yearly Rental Application...d p } } u v Ç í î ô d ] v ^ u , Ç v v ] u d ì î ò ì í w w ñ ì ô r ð î ô r ð ð ð ï & w ñ ì ô r ð î ô r ð ð õ ï , fhuwli\ xqghu](https://img.dokumen.tips/doc/110x75/5e7bd251826f46143a34d748/yearly-rental-application-d-p-u-v-d-v-u-v-v-u-d-.jpg)


![Z © W l l µ } ] v v ] } v o X µ X o W = ï ð ô ô í ô í ð ð î ð ( Æ W o W ... · 2013-06-12 · cursosinternacionais cursosinternacionales internationalc0urses sc universidade](https://img.dokumen.tips/doc/110x75/5e68e9ef8967ec44803258bf/z-w-l-l-v-v-v-o-x-x-o-w-.jpg)
![BCDEFGHIportal.dl.saga-u.ac.jp/bitstream/123456789/118475/1/...IJAB KL 9: L] ,-mËÌ. 8 ` 1 ,-W Ð @ Í Î 1 { õ zo × " ½¢ { Ë _ B 1 Ë W Ð @TUT Ëø \ £ × Ë _" ' { Ë W Ð](https://img.dokumen.tips/doc/110x75/5e3de7f28d7e0e75b2601a53/-ijab-kl-9-l-moe-8-1-w-1-zo-.jpg)


![W } ] o ] Ç · Ç Z µ o W u v t^ } v ~W ð u } W W u v t^ } v tE } o ] ( ~> í ð í](https://img.dokumen.tips/doc/110x75/5c12924c09d3f224238b4624/w-o-c-c-z-o-w-u-v-t-v-w-d-u-w-w-u-v-t-v-te-o-i.jpg)