Embed Size (px)
Citation preview

VYSOKE UCENI TECHNICKE V BRNEBRNO UNIVERSITY OF TECHNOLOGY
FAKULTA INFORMACNICH TECHNOLOGIIUSTAV INTELIGENTNICH SYSTEMU
FACULTY OF INFORMATION TECHNOLOGYDEPARTMENT OF INTELLIGENT SYSTEMS
HODNOCENI KVALITY OTISKU PRSTUFINGERPRINT IMAGE QUALITY ASSESSMENT
DIPLOMOVA PRACEMASTER’S THESIS
AUTOR PRACE VLADIMIR SMIDAAUTHOR
VEDOUCI PRACE doc. Ing. MARTIN DRAHANSKY, Ph.D.SUPERVISOR
BRNO 2011

AbstraktKritickým prvkem biometrického systému pro rozpoznávání otisků prstů je proces snímání.Kvalita snímku totiž ovlivňuje všechny další části systému počínaje zpracováním obrazu,přes extrakci rysů až po samotné rozhodnutí. Přestože bylo navrženo několik metodurčování kvality snímku, chybějící formální specifikace kvality otisku nedovoluje ověřitjejich přesnost. Tato diplomová práce se zabývá hodnocením metod určujících kvalitubiometrického signálu otisku prstu. Popisuje jednotlivé faktory ovlivňující kvalitu spoluse současnými přístupy používanými pro její odhad. V práci je rovněž vysvětlena evalu-ační technika navržená za účelem porovnání schopnosti jednotlivých metod předpovědětvýkon biometrického systému. Několik metod pro odhad kvality bylo naimplementováno aohodnoceno touto technikou.
AbstractThe crucial factor of fingerprint recognition is image acquisition. Quality of the capturedfingerprint image influences all other components of the recognition system, from imageprocessing, through feature extraction to decision making. Therefore, to retain the securityof the overall biometric system, it is necessary to determine the quality and validity ofthe captured fingerprint image. Although several quality estimation techniques have beenproposed, a missing general definition of fingerprint quality makes it difficult to verify them.This thesis deals with the problem of evaluation of the fingerprint signal quality assessmentmethods. Several factors that influence the quality of fingerprints are described. The state-of-the-art approaches for assessing fingerprint quality are reviewed and implemented. Anevaluation method based on the biometric performance is suggested in order to determinethe capability to predict the performance of the reviewed methods.
Klíčová slovabiometrie, rozpoznávání otisků prstů, zpracování obrazu, kvalita signálu otisku prstu, výkonbiometrického systému
Keywordsbiometrics, fingerprint recognition, image processing, fingerprint image signal quality, bio-metric performance
CitaceVladimír Šmida: Fingerprint Image Quality Assessment, diplomová práce, Brno, FIT VUTv Brně, 2011

Fingerprint Image Quality Assessment
ProhlášeníProhlašuji, že jsem tuto diplomovou práci vypracoval samostatně pod vedením pana doc.Ing. Dipl.-Ing. Martina Drahanského, Ph.D.Další informace mi poskytli M.Sc. Martin Aastrup Olsen a Prof. Dr. Christoph Busch.Uvedl jsem všechny literární prameny a publikace, ze kterých jsem čerpal.
. . . . . . . . . . . . . . . . . . . . . . .Vladimír Šmida
May 24, 2011
PoděkováníForemost I would like to thank to my consultant prof. Dr. Christoph Busch. His lecturesI attended during my stay at the Gjøvik University College in Norway raised my interestin biometric research and lead me to this master’s thesis. Moreover, I’m grateful to him forgiving me the oportunity to join the ongoing research at CASED1 in Darmstadt, Germany.During this period I benefited from his encouraging philosophy of research work, inspiringdiscussions and valuable advice.I also thank to M.Sc. Martin Aastrup Olsen for all the interesting discussions we had, forhis recommendations and comments.I want to thank to my supervisor doc. Ing. Dipl.-Ing. Martin Drahanský, Ph.D. forreviewing this thesis, for his wise comments and suggestions.A special thank belongs to Barbora Micenková for all the inspiration and encouragement.
Venované rodine, za jej neutíchajúcu pomoc a podporu pri štúdiu.
c© Vladimír Šmida, 2011.Tato práce vznikla jako školní dílo na Vysokém učení technickém v Brně, Fakultě in-formačních technologií. Práce je chráněna autorským zákonem a její užití bez uděleníoprávnění autorem je nezákonné, s výjimkou zákonem definovaných případů.
1Center for Advanced Security Research Darmstadt, http://www.cased.de.

Contents
1 Introduction 3
2 Biometrics Overview 42.1 Biometrics . . . . . . . . . . . . . . . . . . . . . . . . . . . . . . . . . . . . . 42.2 Generic Biometric System . . . . . . . . . . . . . . . . . . . . . . . . . . . . 42.3 Biometric Recognition . . . . . . . . . . . . . . . . . . . . . . . . . . . . . . 52.4 Biometric Performance . . . . . . . . . . . . . . . . . . . . . . . . . . . . . . 6
3 Biometric Sample Quality 83.1 Definition . . . . . . . . . . . . . . . . . . . . . . . . . . . . . . . . . . . . . 83.2 Relevance of Quality Data . . . . . . . . . . . . . . . . . . . . . . . . . . . . 93.3 Quality Assessment in the Biometric System . . . . . . . . . . . . . . . . . 10
4 Fingerprint Image Quality 114.1 Acquisition Fidelity . . . . . . . . . . . . . . . . . . . . . . . . . . . . . . . 114.2 Quality Factors . . . . . . . . . . . . . . . . . . . . . . . . . . . . . . . . . . 134.3 Defining Fingerprint Quality . . . . . . . . . . . . . . . . . . . . . . . . . . 16
5 Methods for Fingerprint Image Signal Quality Estimation 185.1 Local Analysis . . . . . . . . . . . . . . . . . . . . . . . . . . . . . . . . . . 185.2 Global Analysis . . . . . . . . . . . . . . . . . . . . . . . . . . . . . . . . . . 245.3 Implementation of the Quality Assessment System . . . . . . . . . . . . . . 28
6 Performance-based Quality 306.1 Previous Work . . . . . . . . . . . . . . . . . . . . . . . . . . . . . . . . . . 306.2 Measuring Biometric Performance . . . . . . . . . . . . . . . . . . . . . . . 316.3 Quantifying Utility . . . . . . . . . . . . . . . . . . . . . . . . . . . . . . . . 336.4 Quality Levels . . . . . . . . . . . . . . . . . . . . . . . . . . . . . . . . . . . 34
7 Dataset Selection 377.1 FVC Datasets . . . . . . . . . . . . . . . . . . . . . . . . . . . . . . . . . . . 377.2 MCYT Fingerprint Subcorpus . . . . . . . . . . . . . . . . . . . . . . . . . . 397.3 CASIA Fingerprint Image Database . . . . . . . . . . . . . . . . . . . . . . 40
8 Evaluation 418.1 Quality Estimation . . . . . . . . . . . . . . . . . . . . . . . . . . . . . . . . 418.2 Relationship Among Quality Metrics . . . . . . . . . . . . . . . . . . . . . . 428.3 Performance-oriented Evaluation . . . . . . . . . . . . . . . . . . . . . . . . 438.4 Performance-based Quality . . . . . . . . . . . . . . . . . . . . . . . . . . . 46
1

8.5 Proposed Utility Modifications . . . . . . . . . . . . . . . . . . . . . . . . . 478.6 Results Statement . . . . . . . . . . . . . . . . . . . . . . . . . . . . . . . . 49
9 Conclusion 54
A Quality Score Distribution 60
B CD Content 61
2

Chapter 1
Introduction
“Are you who you claim to be?” In the effort to fight with identity fraud, organized crime,illegal immigration and other security risks, biometric technology has been increasinglyemployed. Among others, it has been integrated into identity cards, driving licences andATM’s to prevent them from unauthorized use. From all biometric characteristics, finger-prints are still the most widespread for several reasons. They are unique and permanent,easy to capture and highly reliable. That is why they have been used in criminal prosecutionfor centuries. Nowadays, their field of application is much wider. Fingerprint recognitionhas been adopted for physical access control, time and attendance control, e-commerce,transaction authentication and also for border control.
The most evident is the utilization of fingerprints in the US Visit program and, recently,also in the biometric passports used by European Union and all member states of ICAO1.As fingerprints are used by wider population, the databases are still growing. For example,the US Visit fingerprint database consists of over 90 million samples by this time [37]. Forsuch large datasets, more reliable recognition algorithms are needed.
Fingerprint recognition systems are able to achieve high accuracy as long as the finger-print quality is high [42]. Fingerprint images of low quality carry an insufficient amountof information that is essential for the recognition process. Therefore, it is necessary todetermine the quality of the captured sample before it is accepted.
For that reason, several methods to estimate the signal quality of fingerprints have beenproposed. It has been shown that their incorporation into a biometric system has improvedthe biometric performance. However, their capability of prediction of the influence of aparticular sample on the biometric performance has not been analysed.
This thesis is focused on the evaluation of the quality assessment methods in orderto answer the following open question: Do the methods assessing fingerprint image signalquality predict the performance of a biometric system?
The structure of the thesis is following. Chapter 2 gives a short introduction intothe field of biometrics. Chapter 3 covers a novel ISO/IEC definition of the biometricsample quality which is afterwards interconnected with the fingerprint image quality inChapter 4. Different aspects that influence the quality of a captured fingerprint imageare also outlined in this Chapter. Chapter 5 reviews the state-of-the-art approaches tothe estimation of the fingerprint image signal quality while Chapter 6 proposes a qualitymeasure derived accurately from the observed biometric performance. Chapter 7 describesthe specific datasets that are later used in the evaluation of quality measures, coveredin Chapter 8. Finally, a summary of the work and possible extensions are included inChapter 9.
1The International Civil Aviation Organization, http://www.icao.int.
3
Chapter 2
Biometrics Overview
Before immersing into the main topic, proper terminology shall be explained. This chapteris addressed to readers that are not familiar with biometric terminology. Rather than givingan exhaustive explanation, it introduces only the terms that are important to know in orderto follow the discussion in the next chapters.
2.1 Biometrics
Biometrics is undergoing a process of standardization in the last years. The terminologyused in this thesis follows the definitions [17] established by ISO/IEC1.
The term biometrics refers to the automated recognition of individuals based on theirbehavioural and biological characteristics. Biometric characteristics can be perceived intwo different manners: behavioural characteristics and biological characteristics. Whilethe first refers to the behavioural processes created by human body, the second is relatedto the the physical properties of body parts. For example, signature, voice and gait arebehavioural characteristics while fingerprint, face and veins are biological.
For an analogue or digital representation of biometric characteristics, the term biometricsample is used. Then, biometric features are numbers or labels extracted from the biometricsamples that are reproducible for a given biometric characteristic of a person but they differamong the population. Biometric template is a set of stored biometric features comparabledirectly to the probe biometric features.
An implementation of automated recognition based on biometric characteristics is thebiometric system.
More definitions from the biometric terminology are described in Harmonized BiometricVocabulary [17], available also online [10].
2.2 Generic Biometric System
A generic biometric system uses one or more biometric characteristics for recognition. Fromthe operational point of view, a biometric system consists of two main parts: enrolmentand recognition.
1The ISO stands for the International Standard Organization and the IEC for the International Elec-trotechnical Commission.
4

2.2.1 Enrolment
Before using the biometric system, each individual has to be enrolled. First, one or morebiometric samples of the desired biometric characteristic are captured from the individual.A biometric reference is created that is that biometric samples or biometric templates areattributed to an individual and stored as a biometric reference (in a database or smart-card/token). Biometric reference is later used for recognition. An individual, whose bio-metric characteristic is used in the biometric system, is defined as a biometric data subject.
2.2.2 Recognition
To recognize person’s identity, again one or more biometric samples have to be obtainedfrom the data subject. Biometric features are extracted and compared to the biometricreference(s) stored in the database. According to the desired functionality, the recognitionphase can be designed in two different manners:
Verification – subject claims his identity and a biometric system verifies whether the claimis genuine or imposter by providing 1:1 comparison with the corresponding reference.Note that the term genuine refers to the person who submits a biometric characteristicto a biometric system in an attempt to be recognized as himself. Similarly, the termimposter refers to the person who submits a biometric characteristic to a biometricsystem in an (intentional or unintentional) attempt to be recognized as another personalready enrolled in the biometric system.
Identification – biometric system compares data subject’s input to all the biometric ref-erences stored in the database (1:many comparison). The system returns identity ofthe data subject corresponding to the most similar biometric reference or a decisionindicating that the data subject was not enrolled in the biometric system.
2.3 Biometric Recognition
A generic biometric system consists of several components in order to work as an iden-tification or verification system. The reference architecture according to ISO/IEC [18] isillustrated in Figure 2.1. Here, we will describe only the main parts of biometric system.
Data Capture Subsystem The acquisition device measures the subject’s characteristicand creates its digital representation – a biometric sample
Signal Processing Subsystem Several processing steps are applied to a biometric sam-ple to derive a concise representation of the biometric sample – biometric features.
Data Storage Subsystem During the enrolment, extracted biometric features or a bio-metric sample attributed to its subject are stored in the database as a reference.
Comparison Subsystem Comparison is the process in which the probe biometric sampleof one individual is compared against biometric references of one or more individuals.The result of such a comparison is a score that indicates similarity or dissimilarity oftwo samples.
Decision Subsystem After the comparison, the recognition system is capable of decidingaccording to the comparison score whether a presented sample matches or does notmatch to a stored reference.
5

Figure 2.1: ISO reference architecture of the biometric system [18].
2.4 Biometric Performance
Biometric performance reflects how precisely the biometric system recognizes individuals.Several metrics that measure the biometric performance have been included into ISO/IECInternational Standard (IS) [15]. Only the most important metrics, those that are usedlater in the thesis, are described here.
2.4.1 Failure-to-Capture Rate
The failure-to-capture rate (FTC) is the proportion of failures of the biometric captureprocess to produce a captured biometric sample that is acceptable for use.
2.4.2 Failure-to-Extract Rate
The failure-to-extract rate (FTX) is the proportion of failures of the feature extractionprocess to generate a template from the captured biometric sample.
2.4.3 Failure-to-Acquire Rate
The failure-to-acquire rate (FTA) is the proportion of verification or identification attemptsfor which the system fails to capture or locate an image or signal of sufficient quality. FTAis caused by either a FTC or an FTX in the in the verification process.
6

2.4.4 False Match Rate
False match rate (FMR) is the proportion of zero-effort imposter attempt samples falselydeclared to match the compared non-self reference.
2.4.5 False Non-Match Rate
The false non-match rate (FNMR) is the proportion of genuine attempt samples falselydeclared not to match the reference of the same characteristic from the same subject.
7

Chapter 3
Biometric Sample Quality
The first component of biometric recognition is the capture subsystem for measuring bio-metric characteristics. Since all elements of the biometric workflow operate in succession,the initial phase, acquisition of a biometric sample, influences all the following parts of thesystem. Therefore it is important to place requirements directly on the biometric samplein order to ensure that a sufficient amount of useful information will be obtained. In thebiometric terminology, these requirements are conveyed by the expression biometric samplequality.
3.1 Definition
There is an emerging effort put into defining the biometric sample quality in order toimprove the security of biometric systems. ISO/IEC recently established InternationalStandard [19], in which they define different aspects of sample quality that influence thegeneral performance of the biometric system. Three main aspects of quality are describedbelow.
Character of a sample is the quality attributable to the inherent features of the sourcefrom which the biometric sample is derived. For example scarred finger has a poorcharacter.
Fidelity of a sample is the quality that describes the degree of similarity between thebiometric sample and its source. The relationship between character and fidelity isillustrated in Figure 3.1.
Utility of a sample refers to the predicted impact of an individual sample to the overallperformance of the biometric system. It is dependent on the character as well as thefidelity of the sample. More detail description of utility is provided in chapter 6.
In that meaning, quality is considered to be a function on the character and fidelity com-ponents. It should convey the predicted utility of the biometric sample.
8

Figure 3.1: Character and fidelity as components of the biometric sample quality. Imageadopted from [19].
3.2 Relevance of Quality Data
Sample quality measures play different roles in various contexts of biometric operations.
Sample Submission
Sample submission requires a real-time quality assessment. It helps the operator or theautomated system to improve the average quality of biometric samples submitted uponenrolment. Improvement can be done by several decisions based on the quality of theobtained sample:
Accept a sample of sufficient quality.
Reject a sample because of insufficient quality.
Reattempt a capture in order to obtain a sample of better quality.
Declare a failure to acquire based on the repetitious rejections.
This feedback is not only related to the operational efficiency. The performance of theoverall biometric system could be improved as it depends on the assumption that for allthe enrolled subjects suitable samples have been stored from which distinguishing featurescan be derived.
Differential Processing
Different enhancement methods can be applied to biometric samples of different qualitiesin order to improve the accuracy of feature extraction (e.g. applying image restorationto the fingerprint image) or the biometric system can invoke different feature extractionalgorithms.
Conditional Decision
The quality of a sample can also contribute to the decision making. Changing the opera-tional threshold of the recognition system can prevent the imposter attempts at spoofingor defeating detection with discernible samples.
In multimodal biometric systems, the relative qualities of samples of different modalitiescan contribute to the fusion process as it has been shown by Fierrez-Aguilar et al. [5].
9

Reference Replacement
A reference dataset can be improved by tracking the quality of the reference entries. Astored biometric sample or a biometric template can be replaced by newly obtained samples(templates) of better quality. A similar scenario can also negate the effects of aging of thereference.
Survey Statistics
Aggregated quality data in the operation process can monitor and detect abnormal be-haviour, which can for example indicate failures in acquisition device, usability drawbacksetc. Survey statistics can also indicate whether a higher quality sample is likely to beobtained by another capture.
Benchmarking
Association of the quality data with samples allows us for creating a quality-oriented datasetthat can be further used for a specific performance evaluation. Testing biometric systems onsamples of specified quality can highlight potential weak areas of the recognition pipeline.
3.3 Quality Assessment in the Biometric System
In order to achieve one or more improvements described above it is needed to include thequality apparatus into the biometric system. Figure 3.2 illustrates a general solution. Afterthe biometric sample is acquired, several methods are applied in order to estimate thesample’s quality. The output is the quality score which is used by other components of thebiometric system. First, the sample has to pass the quality control. Several scenarios ofsample submission have been described in section 3.2. However, the quality score can beused even in the other parts of the biometric system – at feature extraction and decisionmaking as described in 3.2.
Quality
ControlFeature
Extraction
Decision
Making
Acquire
d
Sample In
put
Feat
ures
Quality Score
Template (Enrollment)
Template
Database
Match/Non-Match
(Verification)
Data Subject Id /
Not recognized
(Identification)
Identity Claim (Enrollment, Verification)
Data Subject
Interface
Sensor
Quality
Estimation
Sample
Accep
ted
Sample
Rejec
ted
Figure 3.2: A generic biometric system with incorporated sample quality assessment.
10
Chapter 4
Fingerprint Image Quality
In the previous chapter, a general description of the biometric sample quality was given.This chapter is focused on a representation of the biometric sample in the fingerprintrecognition system – a fingerprint image. The definitions of sample quality are boundto the fingerprint image in order to describe the relevant factors that influence fingerprintimage quality.
4.1 Acquisition Fidelity
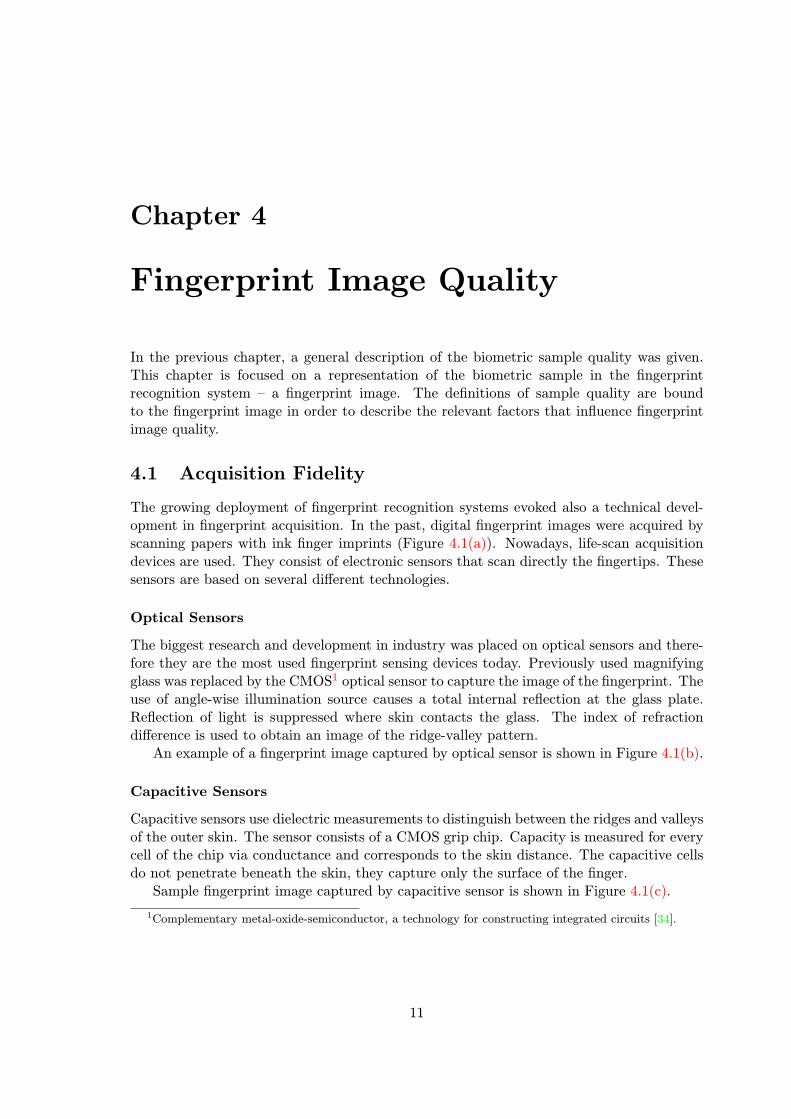
The growing deployment of fingerprint recognition systems evoked also a technical devel-opment in fingerprint acquisition. In the past, digital fingerprint images were acquired byscanning papers with ink finger imprints (Figure 4.1(a)). Nowadays, life-scan acquisitiondevices are used. They consist of electronic sensors that scan directly the fingertips. Thesesensors are based on several different technologies.
Optical Sensors
The biggest research and development in industry was placed on optical sensors and there-fore they are the most used fingerprint sensing devices today. Previously used magnifyingglass was replaced by the CMOS1 optical sensor to capture the image of the fingerprint. Theuse of angle-wise illumination source causes a total internal reflection at the glass plate.Reflection of light is suppressed where skin contacts the glass. The index of refractiondifference is used to obtain an image of the ridge-valley pattern.
An example of a fingerprint image captured by optical sensor is shown in Figure 4.1(b).
Capacitive Sensors
Capacitive sensors use dielectric measurements to distinguish between the ridges and valleysof the outer skin. The sensor consists of a CMOS grip chip. Capacity is measured for everycell of the chip via conductance and corresponds to the skin distance. The capacitive cellsdo not penetrate beneath the skin, they capture only the surface of the finger.
Sample fingerprint image captured by capacitive sensor is shown in Figure 4.1(c).
1Complementary metal-oxide-semiconductor, a technology for constructing integrated circuits [34].
11
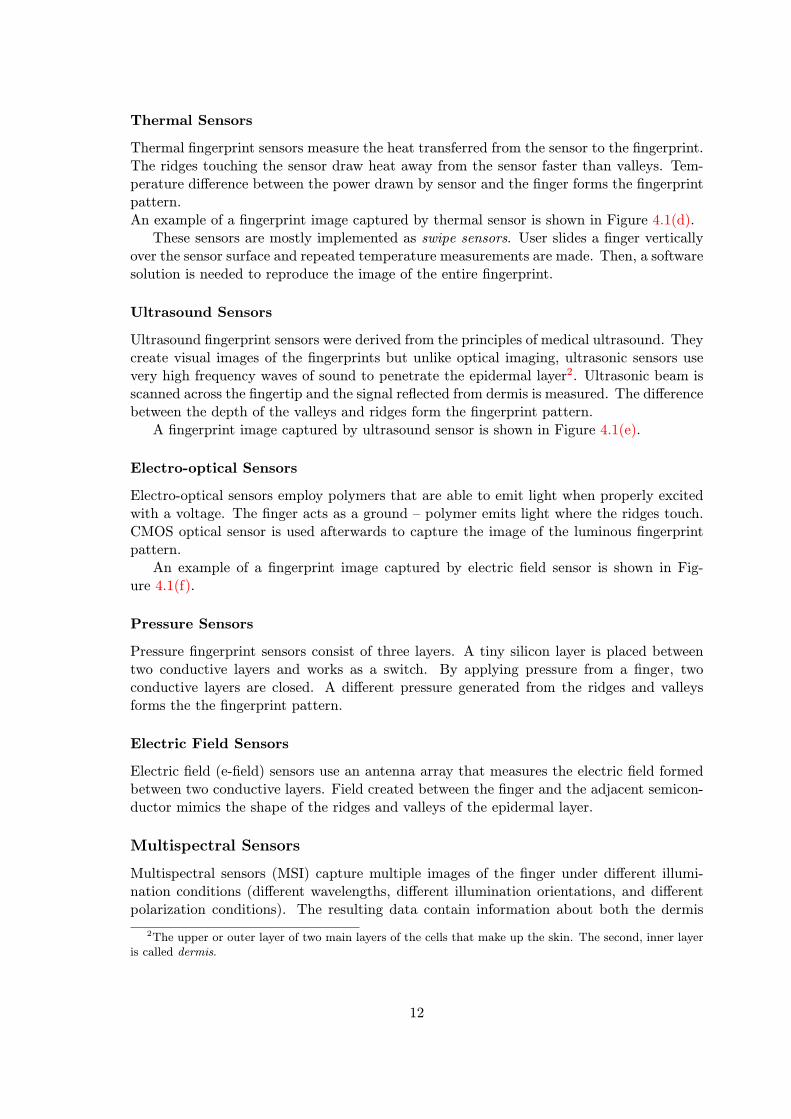
Thermal Sensors
Thermal fingerprint sensors measure the heat transferred from the sensor to the fingerprint.The ridges touching the sensor draw heat away from the sensor faster than valleys. Tem-perature difference between the power drawn by sensor and the finger forms the fingerprintpattern.An example of a fingerprint image captured by thermal sensor is shown in Figure 4.1(d).
These sensors are mostly implemented as swipe sensors. User slides a finger verticallyover the sensor surface and repeated temperature measurements are made. Then, a softwaresolution is needed to reproduce the image of the entire fingerprint.
Ultrasound Sensors
Ultrasound fingerprint sensors were derived from the principles of medical ultrasound. Theycreate visual images of the fingerprints but unlike optical imaging, ultrasonic sensors usevery high frequency waves of sound to penetrate the epidermal layer2. Ultrasonic beam isscanned across the fingertip and the signal reflected from dermis is measured. The differencebetween the depth of the valleys and ridges form the fingerprint pattern.
A fingerprint image captured by ultrasound sensor is shown in Figure 4.1(e).
Electro-optical Sensors
Electro-optical sensors employ polymers that are able to emit light when properly excitedwith a voltage. The finger acts as a ground – polymer emits light where the ridges touch.CMOS optical sensor is used afterwards to capture the image of the luminous fingerprintpattern.
An example of a fingerprint image captured by electric field sensor is shown in Fig-ure 4.1(f).
Pressure Sensors
Pressure fingerprint sensors consist of three layers. A tiny silicon layer is placed betweentwo conductive layers and works as a switch. By applying pressure from a finger, twoconductive layers are closed. A different pressure generated from the ridges and valleysforms the the fingerprint pattern.
Electric Field Sensors
Electric field (e-field) sensors use an antenna array that measures the electric field formedbetween two conductive layers. Field created between the finger and the adjacent semicon-ductor mimics the shape of the ridges and valleys of the epidermal layer.
Multispectral Sensors
Multispectral sensors (MSI) capture multiple images of the finger under different illumi-nation conditions (different wavelengths, different illumination orientations, and differentpolarization conditions). The resulting data contain information about both the dermis
2The upper or outer layer of two main layers of the cells that make up the skin. The second, inner layeris called dermis.
12

and epidermis features of the skin. Afterwards, data are processed by software to generatea single composite fingerprint image.
(a) Ink (b) Optical (c) Capacitive
(d) Thermal (e) Ultrasound (f) Electro-optical
Figure 4.1: An example of fingerprint images acquired by different sensing techniques.Image (a) was obtained from SD27a dataset [30], images (b) and (c) from FVC2002 dataset[26], image (d) from FVC2004 dataset [27] and image (e) from [40]. Image (f) was capturedby author.
The appearance of the generated fingerprint image depends on the specific sensor whichwas used. The deployment of different acquisition technologies results in a great variety offingerprint images of different parameters. To establish a universal quality standard thatwill be adaptable for use by all the applications is a challenging task.
The variety of fingerprint images obtained from different acquisition devices can be seenin Figure 4.1. In this thesis, just live-scan fingerprint images will be considered.
4.2 Quality Factors
The purpose of explaining all the present acquisition technologies in previous section is toshow the important problem of obtaining fingerprint images. Only ultrasonic and multi-spectral sensors are able to penetrate beneath the epidermal layer of the skin. All the othertechnologies rely purely on surface measurements that can be negatively affected by many
13

different factors. These factors decrease the fidelity and thus the quality of the capturedfingerprint sample. But as shown in Section 3, the quality also depends on the character ofthe sample.
Different factors that cause defects on fingerprint samples are listed in ISO/IEC Tech-nical Report [19]. Here, a detailed description will be provided.
4.2.1 Defect Caused by User Character
Skin conditions can degrade the quality of the captured fingerprint image to such an extentthat they make it impossible to observe the ridge structure of the fingerprint. Commonmatters such as dry fingerprints cause that some parts of the ridges do not come in directcontact with the surface of the sensor. They cause that the ridge pattern is intermittent,or the fingerprint area is of low contrast, which leads to feature extraction problems. Bycontrast, too wet fingertips have the valleys filled with liquid and they produce fingerprintimages with blending ridges.
Similar problems can be caused by character impurities such as dirt, latent print, etc.Also other character properties such as scars, wrinkles, blisters, eczema as well as der-
matology factors negatively influence the fingerprint quality.An example of a defect on fingerprint image caused by character is shown in Fig-
ure 4.3(a).
4.2.2 Defects Caused by Imaging
Biometric samples that are represented by digital images are dependent on image samplingand on the quantization process which causes alterations to the original biometric char-acteristic. These factors are mostly attributed to the properties of the acquisition device.Namely they are:
• sampling error,
• low contrast or signal-to-noise ratio,
• distortion,
• erroneous or streak lines,
• uneven background,
• insufficient dynamic range,
• non-linear or non-uniform grayscale output,
• missing pixels due to hardware failure,
• aliasing problems.
In [36, 35] it has been shown that also the size of the sensing area of a sensor influencesthe recognition accuracy and therefore, it should also be considered as one of the factorsrelated to imaging that influences the quality. Figure 4.2 shows two fingerprints withdifferent sensing areas.
14

Figure 4.2: Two fingerprint images acquired by optical scanners with different sensing areas.On the left, a scanner with an insufficiently small sensing area was used. Images obtainedfrom FVC 2000 [28].
4.2.3 Defects Caused by User Behaviour
Several scenarios of incorrect user cooperation with the acquisition device can occur. Im-proper finger placement cause that different rotations and positions of a fingerprint patternoccur in the image.
When different parts of a finger are presented on the sensor surface, insufficient area ofthe fingerprint pattern is obtained.
Inadequate pressure of a finger on the sensor surface or pressure in different parts of afinger can cause elastic deformations.
An example of fingerprint images affected by user behaviour is shown in Figure 4.3(b).
4.2.4 Defects Caused by Environment
Environmental conditions in which the sensor operates can also influence the fingerprintquality. Most known influencing factors are: humidity, light conditions and impurities onthe scanner surface.
Sample fingerprint images affected by environmental conditions are shown in Figure 4.3(c).
(a) User character (wetfinger)
(b) User behaviour (fin-ger misplacement)
(c) Environment andimaging (Optical sensorwith broken, dirty glass)
Figure 4.3: An example of fingerprint samples influenced by different factors. Images werecaptured by author.
15

4.3 Defining Fingerprint Quality
Although several factors that influence fingerprint quality were described by ISO/IEC [19],a general definition of fingerprint quality does not exist. The most used is the descriptionby Chen et al. [4]. They conceive fingerprint quality as “the measure of the clarity of ridgesand valleys and the extract-ability of the features used for identification such as minutiae,core and delta points etc”.
In this thesis, the perception of fingerprint quality is slightly different from the men-tioned one. The author addresses the problem of fingerprint quality not only to the prop-erties of the observed fingerprint pattern but the completeness of the fingerprint is alsoconsidered as one of the quality factors. Inspired by Ratha et al. [33], fingerprint qualityin this thesis is described from two different points of view: consistency and uniformity.
4.3.1 Fingerprint Consistency
The consistency of the fingerprint image relates to the quality factors influenced by userbehaviour. Improper user cooperation with the acquisition device can cause a situation,where the captured fingerprint image carries only partial information about its source.
Inconsistent samples of the same finger have a very small similarity and thus degradesignificantly the comparison accuracy. Therefore, the measures of fingerprint consistencyshould examine the completeness of the fingerprint area. However, an exact specification onthe fingerprint completeness does not exist. Several open issues still remain, for example:should there be the delta and core points necessarily present in the fingerprint image?
Sample fingerprints of different consistency are shown in Figure 4.4.
(a) Consistent (b) Inconsistent (c) Consistent
Figure 4.4: An example of three fingerprint images of the same finger with different con-sistency. Wrong finger placement on the sensor plate caused the inconsistent fingerprintsample (b). Images were obtained from FVC2002 [26].
Note, that the elastic distortions caused by user behaviour are not related to the fin-gerprint consistency. Fingerprint consistency, as it is used here, reflects the completenessof the fingerprint image. It does not deal with the quality of the information obtained andthus it should be not attributed to the signal quality of the fingerprint image.
16

4.3.2 Fingerprint Uniformity
Fingerprint uniformity is directly related to the quality of the information already includedin the image. Often it is referred to as the “signal quality”. It can be understood as theclarity of the ridge-valley pattern and feature extract-ability as described above.
Defects in the fingerprint sample caused by user character, imaging and environmentfactors but also elastic distortions caused by user behaviour result in a non-uniform finger-print pattern.
An example of different fingerprint uniformity is shown in Figure 4.5.
(a) Non-uniform (b) Uniform (c) Non-uniform
Figure 4.5: An example of three fingerprints of the same finger with different uniformity.Samples were obtained from user character of different skin conditions. Sample (c) isinfluenced by the moisture present at the finger, while sample (b) wasn’t influenced by anyof the factors mentioned above. On the contrary too dry finger can also cause a non-uniformcaptured sample as shown in (a). Images were acquired with an optical scanner and belongto the FVC2004 dataset [27].
In this thesis, signal quality estimation methods will be dealt as the measures of finger-print uniformity.
17

Chapter 5
Methods for Fingerprint ImageSignal Quality Estimation
Several methods for fingerprint image quality estimation have been proposed in the litera-ture. According to ISO/IEC Technical Report [19] they can be divided into local and globalmethods.
In local analysis, local features of the fingerprint are used for computation of the qualityscore [2]:
• local direction of ridges,
• Gabor filters,
• pixel intensity and
• power spectrum.
For global analysis of quality, two approaches are used according to [2]:
• direction field and
• power spectrum.
In this thesis, two methods of local analysis of quality and two methods of global analysisof quality were examined and implemented. Orientation certainty level is based on the localdirection of ridges and ridge-valley structure analysis is based on pixel intensity features.From global analysis methods, orientation flow analysis based on the direction field featuresand radial power spectrum were selected.
5.1 Local Analysis
The majority of present methods of the fingerprint signal quality assessment examines localstructure of a fingerprint. Local structure is represented by the texture-like pattern of ridgesand valleys. An example is shown in Figure 5.1.
Image is partitioned into a grid of non-overlapping square blocks. The size of the blockdepends on the image resolution. It should be suitably chosen to cover at least 2 ridgelines. Within each block, local features are extracted and used to determine the quality ofa particular block. Quality is expressed by the quality score as described above. To obtain
18

Figure 5.1: Local structure of a fingerprint image. Image taken from [19].
the quality of an entire fingerprint image, quality scores of all blocks are combined into one.Different statistical methods can be used for the score combination, for example majorityvote, mean, median etc.
5.1.1 Orientation Certainty Level
The Orientation Certainty Level (OCL) measures the energy concentration along the di-rection of ridges.
In the method presented by Lim et al. [23], first the intensity gradient of each pixelwithin a block is computed. That is achieved by applying the Sobel operator with two 3×3windows [22]. Then, the covariance matrix C of the gradient vector for an N -point imageblock is computed as:
C =1
N
∑N
{[dxdy
] [dx dy
]}=
[a cc b
], (5.1)
where dx and dy represent the intensity gradient of each pixel.From the covariance matrix C, two eigenvalues λ are derived:
λmin =(a+ b)−
√(a− b)2 + 4c2
2, (5.2)
λmax =(a+ b) +
√(a− b)2 + 4c2
2. (5.3)
For a fingerprint image block, orientation certainty value (OCL) is defined simply asthe ratio of λmin and λmax:
OCL =λminλmax
. (5.4)
Since a, b from the Equation 5.1 are greater than 0 and λmin is always greater than λmax,λmin/λmax is always less than 1.
When two eigenvalues, λmin and λmax, have similar magnitudes, it indicates that thereis not a strong energy among the ridge orientation observed and OCL approximates to 1.When the eigenvalues are different, there is a strong energy observed andOCL approximatesto 0.
In the concept of fingerprint quality analysis, the energy concentration among the ridgeorientation can be used to measure the quality of the fingerprint image block. Higher energyconcentration should indicate a higher quality of the fingerprint. In ISO/IEC Technical
19

Report [19] the OCL value from Equation 5.4 is used to express the quality. Then, thelower the OCL is, the higher fingerprint quality is observed, while the range of quality scoreremains between 0 and 1. And that is in contradiction with ISO/IEC IS [16] which definesthe quality score to be continuously increasing with the higher quality, from 0 up to 100.
On that account, the local quality measure QOCL proposed here is the inverted andnormalized OCL value in order to follow the ISO/IEC requirements [16]:
QOCL =
(1− λmin
λmax
)× 100, (5.5)
where the range of the QOCL is between 0 and 100.An example of the OCL computation is shown in Figure 5.2.
(a) Average QOCL = 48
(b) Average QOCL = 72
Figure 5.2: Computation of the OCL for two fingerprints of the same finger of different qual-ity. Fingerprint images and corresponding block-wise values of QOCL are shown. Brightercolour indicate higher quality in the region, background area is marked with black colour.The average QOCL value was computed on the foreground blocks only. Fingerprint imageswere obtained from FVC2002 dataset [26].
Since the OCL is computed from the grey-level gradient, it can be negatively affectedby marks or residuals in the sample with strong orientation strength. Also high curvatureareas such as core and delta points have a negative impact on the OCL quality as theseregions often do not exhibit a one dominant direction within the block.
5.1.2 Ridge-Valley Structure Analysis
The ridge-valley structure analysis indicates the clarity of the local fingerprint structurewith the aim to distinguish the ridges and valleys along the ridge direction. Chen et al. [4]
20

analyse the distribution of the segmented fingerprint structure to describe the clarity of agiven fingerprint pattern. Their approach is generally accepted and will be followed in thisthesis.
First, inside each image block (denoted as V0) the direction of the ridge flow is measured.An orientation line perpendicular to the ridge direction is computed (Figure 5.3(a)). Thenthe block V0 is aligned to the horizontal position of the orientation line. The newly createdaligned block V1 is shown in Figure 5.3(b). From the centre of the block V1 along theorientation line a 2-D vector V2 is extracted as it is depicted in Figure 5.3(c).
Then, several parameters from the extracted block are computed, such as fingerprintpattern clarity, ridge thickness and valley thickness. For that reason, the vector V2 shouldbe of minimum size of 32 × 15 pixels to cover several ridge lines separated by valleys.Therefore, the original block V1 has to be of minimum size of 36 × 36 pixels. The wholeprocess is shown in Figure 5.3.
(a) Image block V0
with red orientationline shown.
(b) Block V1, createdby aligning the blockV0 to horizontal ori-entation line.
(c) Block V2, ex-tracted from V1.
Figure 5.3: Process of rotation and transformation of image block for ridge-valley analysis.
The average profile is computed from block V2 by equation:
V3(i) =
∑Mj=1 V 2(i, j)
M, (5.6)
where i = 1 . . . x is the horizontal index and M = y is the height of the block V3 of sizex×y. It is necessary to determine the threshold DT that will be used to distinguish betweenridge and valley regions in V3. For that purpose, linear regression is applied to the averageprofile. Figure 5.4 shows the process of segmentation of the block using DT . Regions withthe corresponding values of the profile lower than DT are considered to be ridges, the restare valleys.
As the ridge and valley have been separated, the clarity test can be performed on eachsegmented rectangular region of the 2-D vector V3. By the clarity test, the homogeneity ofthe ridge and valley regions is controlled. Each pixel of the ridge region is checked to haveintensity of the ridge pattern – which means that the pixel intensity should be lower thanthe established threshold DT . Similarly, the pixel of the valley region should have intensityhigher than the corresponding threshold DT .
The total proportion of bad pixels (those with different intensities than expected) canbe expressed by:
α = vB/vT , (5.7)
β = rB/rT , (5.8)
21
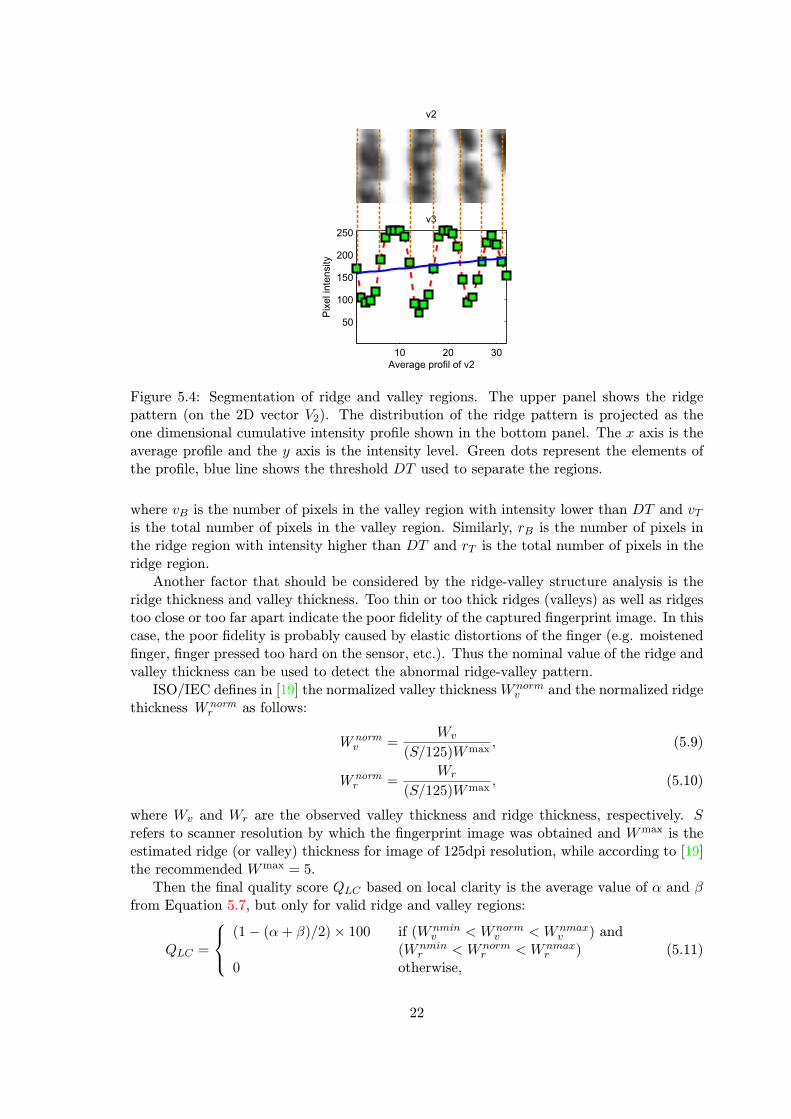
v2
10 20 30
50
100
150
200
250
Average profil of v2
Pixelintensity
v3
Figure 5.4: Segmentation of ridge and valley regions. The upper panel shows the ridgepattern (on the 2D vector V2). The distribution of the ridge pattern is projected as theone dimensional cumulative intensity profile shown in the bottom panel. The x axis is theaverage profile and the y axis is the intensity level. Green dots represent the elements ofthe profile, blue line shows the threshold DT used to separate the regions.
where vB is the number of pixels in the valley region with intensity lower than DT and vTis the total number of pixels in the valley region. Similarly, rB is the number of pixels inthe ridge region with intensity higher than DT and rT is the total number of pixels in theridge region.
Another factor that should be considered by the ridge-valley structure analysis is theridge thickness and valley thickness. Too thin or too thick ridges (valleys) as well as ridgestoo close or too far apart indicate the poor fidelity of the captured fingerprint image. In thiscase, the poor fidelity is probably caused by elastic distortions of the finger (e.g. moistenedfinger, finger pressed too hard on the sensor, etc.). Thus the nominal value of the ridge andvalley thickness can be used to detect the abnormal ridge-valley pattern.
ISO/IEC defines in [19] the normalized valley thickness Wnormv and the normalized ridge
thickness W normr as follows:
W normv =
Wv
(S/125)Wmax, (5.9)
W normr =
Wr
(S/125)Wmax, (5.10)
where Wv and Wr are the observed valley thickness and ridge thickness, respectively. Srefers to scanner resolution by which the fingerprint image was obtained and Wmax is theestimated ridge (or valley) thickness for image of 125dpi resolution, while according to [19]the recommended Wmax = 5.
Then the final quality score QLC based on local clarity is the average value of α and βfrom Equation 5.7, but only for valid ridge and valley regions:
QLC =
(1− (α+ β)/2)× 100
0
if (Wnminv < Wnorm
v < Wnmaxv ) and
(Wnminr < Wnorm
r < Wnmaxr )
otherwise,(5.11)
22

where Wnminr and Wnmin
v are minimum values for the normalized ridge and valley thickness,respectively. Similarly, Wnmax
r and Wnmaxv are maximum values for the normalized ridge
and valley thickness, respectively.Again, the resulting quality score QLC proposed here is slightly different from the defini-
tion of LCS proposed in ISO/IEC Technical Report [19]. The normalization was performedto achieve that the QLC will be in the range between 0 and 100. For the ridges with goodclarity, QLC approaches 100, while for unclear ridge-valley structure, QLC will be close to 0.
An example of the computation of QLC is shown in Figure 5.5.
(a) Average QLC = 80
(b) Average QLC = 32
Figure 5.5: Computation of the QLC for two fingerprints of different quality, obtained fromthe same finger. Fingerprint images and corresponding block-wise values of QLC are shown.Brighter colours indicate higher quality in the region, black colours represent the areas withinsufficient ridge thickness and background area. The average QLC value was computed onthe foreground blocks only. Fingerprint images were obtained from FVC2004 dataset [27].
There are several factors that can negatively affect the resulting QLC , such as highlycurved ridges, ridge endings, bifurcations, delta and core points. Since these factors corre-spond to the character of a sample, they cannot be eliminated. To minimize the probabilityto encounter these factors in one local fingerprint structure, the size of the block V3 usedfor analysis needs to be sufficiently small but, on the other hand, it should be possible toobserve the ridge-valley structure within one block.
23

5.2 Global Analysis
Fingerprint quality assessment methods that rely on global analysis examine the overallridge-valley structure of a fingerprint.
5.2.1 Orientation Flow Analysis
Orientation flow analysis measures the continuity of the ridge flow in the fingerprint pattern.The method proposed by Chen et al. [3] uses the local angle information provided by
the orientation field. First, the image is partitioned into a grid of non-overlapping blocks.Then, within each block of the grid, the dominant ridge orientation is determined. Theridge direction is given by the principal eigenvector of the covariance matrix computed fromthe gradient vector as described in Section 5.1.1. A 2D array V is defined to hold all theorientation angles of the ridge directions computed from the fingerprint, as shown in Figure5.6.
Then, to analyse the ridge flow around the particular block V , the absolute differenceD of the orientation angle of its surrounding blocks is computed as follows:
D(i, j) =
∑1m=−1
∑1n=−1 |V (i, j)− V (i−m, j − n)|
8. (5.12)
The sum is divided by 8 because 8-neighbourhood is assumed.The continuity in the orientation flow is observed where orientation changes gradually
between the neighbouring blocks. According to [3], the tolerance of 8◦of the angular changeis considered. On that account the local orientation quality score Qloc is computed:
Qloc(i, j) =
{100
(1− D(i,j)−8◦
90◦−8◦ )× 100
if D(i, j) ≤ 8◦
if D(i, j) > 8◦.(5.13)
Finally, the global quality score QOF is calculated by averaging the Qloc values:
QOF =
∑i,jQloc(i, j)
N, (5.14)
where N is the number of blocks in V . The resulting quality score QOF proposed here is inthe range of [0, 100]. Abnormal orientation changes observed in the ridge flow cause thatQOF decreases.
An example of orientation flow computed for two fingerprints of different quality ob-tained from the same finger is shown in Figure 5.6.
The core and delta points present in the fingerprint cause the significant change of ridgeflow and so they negatively influence the global quality score QOF .
5.2.2 Radial Power Spectrum
In a grey-scale image, spatial frequency is directly related to the rate of pixel intensitychange. For fingerprint image it means that the ridge frequency lies within a certain range.
Chen at al. [4] analyse the robustness of the ridge structure by computing the two-dimensional Discrete Fourier Transform (DFT). They assume that a good quality fingerprintimage should yield a strong ring pattern in the Fourier spectrum, indicating the dominantfrequency band associated with the frequency of ridges. On the other hand, poor quality
24

(a) QOF = 70 (b) QOF = 54
Figure 5.6: Computation of the OF for two fingerprints of different quality, obtained fromthe same finger. On the left image the ridge flow changes in a smooth trend which is reflectedby the higher QOF value. By contrast, in the right fingerprint image, the orientation flowdoes not change gradually in all the parts, and therefore the QOF is lower. Fingerprintimages were obtained from FVC2004 dataset [27].
image has unclear and non-uniformly spaced ridges which results in a more diffused energyin Fourier spectrum.
The 2-D DFT of a function p(x, y) evaluated at the spatial frequency (2πkM , 2πl
N ) is givenby the equation [8]:
f(k, l) =1
MN
M−1∑x=0
N−1∑y=0
p(x, y)e−j2π( kxM
+ lyN
). (5.15)
In the case of a fingerprint sample, p(x, y) refers to the intensity at pixel (x, y) of thegrey-scale digital image of size N ×M . Components of the Fourier transform in Equation5.15 are complex quantities. Therefore, to analyse the geometric structure of an image, themagnitude of the Fourier transform should be considered [8]:
F (k, l) = |f(k, l)|2. (5.16)
Sample fingerprint images and their corresponding energy concentrations in the Fourierspectrum are shown in Figure 5.8(a) and Figure 5.8(b), respectively.
According to [12], the ridge frequency is generally around 60 cycles per image widthor height. Since the quality measure should be invariant to the image size, the range ofpossible image width (height) is defined to be between 120 and 1000 pixels. Then, theminimum possible ridge frequency is rmin = 60/1000 = 0.06 cycle/pixel and the maximumrmax = 60/120 = 0.5 cycle/pixel. The term frequency of interest (FOI) will be used toexpress the range of possible ridge frequencies, defined by lower bound rmin and upperbound rmax.
Since the DFT is evaluated at the spacial frequency (2πkM , 2πl
N ), the ridge frequenciesrmin and rmax can be identified in Fourier spectrum on k axis by substitutions: rmin = 2πk
M ,rmax = 2πk
M , where M is the image width; and on l axis: rmin = 2πlN , rmax = 2πl
N , where Nis the image height.
25
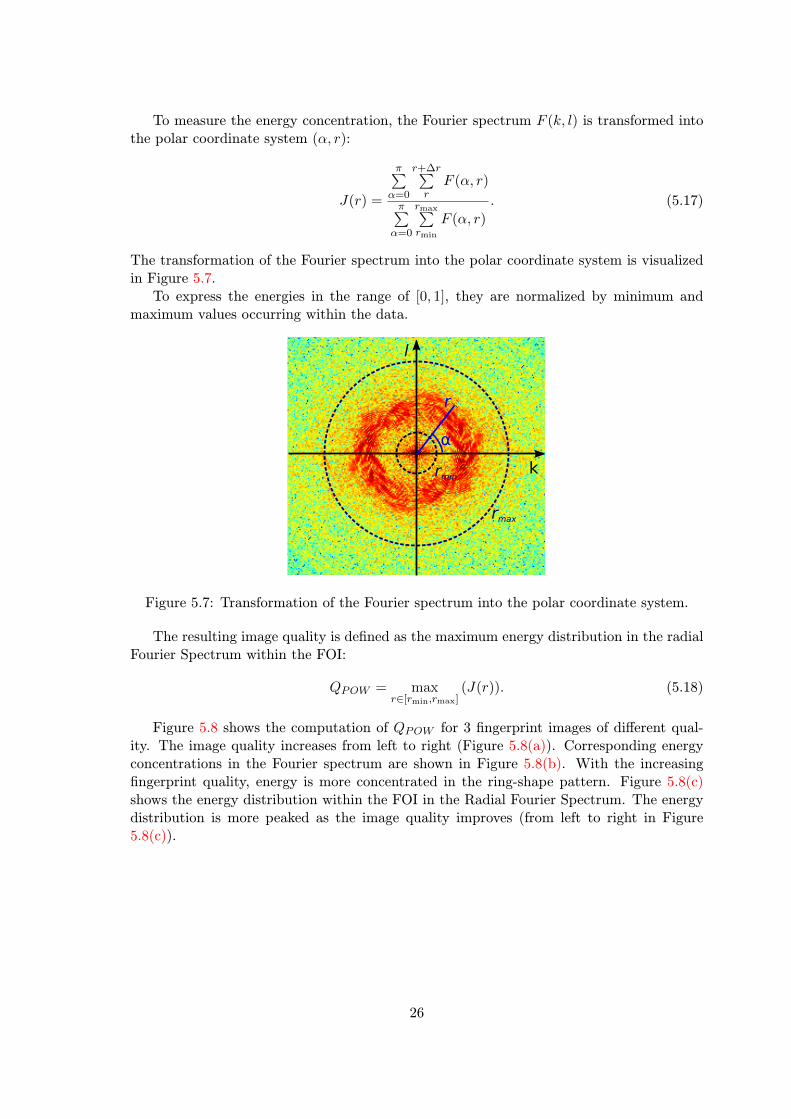
To measure the energy concentration, the Fourier spectrum F (k, l) is transformed intothe polar coordinate system (α, r):
J(r) =
π∑α=0
r+∆r∑r
F (α, r)
π∑α=0
rmax∑rmin
F (α, r)
. (5.17)
The transformation of the Fourier spectrum into the polar coordinate system is visualizedin Figure 5.7.
To express the energies in the range of [0, 1], they are normalized by minimum andmaximum values occurring within the data.
k
l
r
α
rmax
rmin
Figure 5.7: Transformation of the Fourier spectrum into the polar coordinate system.
The resulting image quality is defined as the maximum energy distribution in the radialFourier Spectrum within the FOI:
QPOW = maxr∈[rmin,rmax]
(J(r)). (5.18)
Figure 5.8 shows the computation of QPOW for 3 fingerprint images of different qual-ity. The image quality increases from left to right (Figure 5.8(a)). Corresponding energyconcentrations in the Fourier spectrum are shown in Figure 5.8(b). With the increasingfingerprint quality, energy is more concentrated in the ring-shape pattern. Figure 5.8(c)shows the energy distribution within the FOI in the Radial Fourier Spectrum. The energydistribution is more peaked as the image quality improves (from left to right in Figure5.8(c)).
26

(a) Fingerprint images of different quality.
(b) Energy concentration in the Fourier Spectrum.
0 5 10 15 20 25 300
0.1
0.2
0.3
0.4
0.5
0.6
0.7
0.8
0.9
1Radial Fourier spectrum
r
J(r
)
0 5 10 15 20 25 300
0.1
0.2
0.3
0.4
0.5
0.6
0.7
0.8
0.9
1Radial Fourier spectrum
r
J(r
)
0 5 10 15 20 25 300
0.1
0.2
0.3
0.4
0.5
0.6
0.7
0.8
0.9
1Radial Fourier spectrum
r
J(r
)
(c) Normalized Radial Fourier Spectrum in the FOI. x axis is the frequency r and y axis the normalizedenergy value J(r).
Figure 5.8: Computation of the Radial Power Spectrum. In (a), fingerprints subjectivelyassessed to be of different quality that increases from left to right. Their correspondingenergy concentration in the Fourier Spectrum is shown in (b), while (c) displays the energyconcentration within the FOI in the Radial Fourier Spectrum. The resulting quality scoresare: Q1
POW = 53 for the left image, Q2POW = 71 for the middle image and Q3
POW = 85 forthe right image. Fingerprints were obtained from the dataset FVC2000 [28].
27

5.3 Implementation of the Quality Assessment System
Within this thesis, a system for assessment of the quality of fingerprints has been designed,based on the described methods, and implemented in MATLAB1. The workflow diagramof the system is shown in Figure 5.9 and the description follows.
Fingerprint Image
Fingerprint Segmentation Fingerprint Partition
DominantRidge Direction
Foreground BlocksForeground Area
Radial PowerSpectrum
Orientation FlowAnalysis
Ridge-valley StructureAnalysis
OrientationCertainity Level
Local Quality ScoreGlobal Quality Score
Block Quality Scores
Agregation Function
Local AnalysisGlobal Analysis
Normalization Normalization
Figure 5.9: The workflow of the proposed quality assessment system.
First, several segmentation algorithms were implemented because the methods for qual-ity assessment need to be applied to the seperated foreground regions. The method basedon the standard deviation of pixel intensities within blocks was selected since the seg-mentation was sufficiently reliable for the most widespread sensoring technology – optical,thermal and capacitive. Further, an appropriate partition of the image was performed andthe dominant ridge direction was estimated for each block in the foreground area. Then, the
1MATLAB is a numerical computing environment and programming language developed by MathWorks,http://www.mathworks.com/products/matlab.
28

local assessment methods (ridge-valley structure analysis and orientation certainty level)determine the quality of each block separately and the final quality score is obtained fromtheir agregation. Global quality scores are output of the radial power spectrum methodand orientation flow analysis.
All the assessment methods were implemented according to the description given in thepreceding Sections 5.1, 5.2. The figures and results in those sections were generated withhelp of this system.
29

Chapter 6
Performance-based Quality
An open problem in fingerprint quality assessment is the lack of evaluation techniques thatare able to identify the reliability of the given quality estimation method. Most of thecurrent methods were evaluated by their authors on small datasets that are not publiclyavailable and therefore it is not possible to benchmark the algorithms [25, 3, 24].
A possible way out of this problem is to create a dataset which would consist of fin-gerprint images labelled with quality scores assigned by dactyloscopic experts. Then, theoutputs of the quality assessment methods can be easily compared to the assigned labels.But that becomes an impossible task for large-scale datasets one is interested in. Large-scale datasets that consist of fingerprint images obtained from multiple sensors in multiplesessions are the appropriate data for evaluation since they ensure a great diversity of thefingerprint quality.
Another solution can be to determine how the given biometric sample influences theaccuracy of a recognition system. The quality assessment methods were designed to refusesamples of poor quality on input. The rationale behind this is that the poor quality samplestrigger recognition errors in the biometric system and that results in degradation of thebiometric performance. Therefore it is one of the open questions today, how to assign sucha quality value to the biometric sample, that it predicts the biometric performance of thegiven sample in a recognition system. From now on such an evaluation of samples will bedenoted as the performance-based quality.
The performance-based quality is convenient to use for several reasons. First, sucha measure can be automatically computed for a dataset of any size. The results can bedirectly compared to the quality scores in order to determine to what degree the fingerprintimage signal quality estimation methods are capable of predicting the impact of the givensample on the general performance of the biometric system. Further, it allows differentquality assessment methods for benchmarking as well as identifying the overall quality ofdifferent datasets.
6.1 Previous Work
No extensive research has been done to measure the impact of a sample of a given qualityon the general biometric performance. Many studies [42, 6] have shown the performanceimprovement based on rejecting poor quality samples but they did not investigate in quan-tifying the influence of a particular sample on the recognition performance.
In the study on fingerprint image quality carried out by Alonso-Fernandez et al. [2],
30
quality assessment methods were evaluated on pairs of samples in comparison. The qualityvalue Q was simply computed for a pair of samples as Q =
√Qe ×Qt, where Qe and
Qt represent the quality values of the enrolment and test fingerprint image, respectively.Quality value is than compared to the similarity score obtained from comparison of thesetwo samples. But the experiments on the recognition performance [41] have shown thatrecognition errors were triggered by low quality samples. That indicates that each of thesamples of comparison will have a different impact on performance. Therefore, assigning aquality score to the comparison pair is not desirable.
Another approach of fingerprint quality assessment was proposed by Tabassi et al. [38, 9]and recently, it was also included in the in ISO/IEC IS [16]. It measures the fingerprintquality by quantifying the comparator’s performance. That makes it the right candidate forthe evaluation of quality estimation methods, and therefore this framework will be followed.
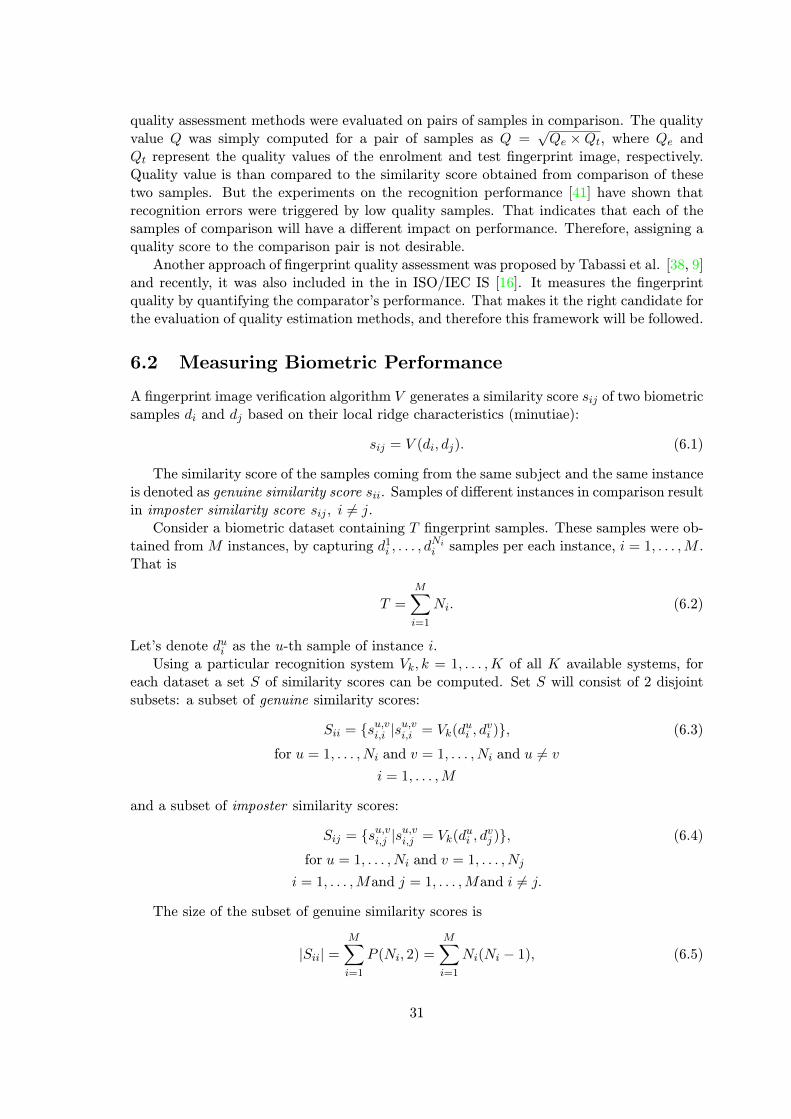
6.2 Measuring Biometric Performance
A fingerprint image verification algorithm V generates a similarity score sij of two biometricsamples di and dj based on their local ridge characteristics (minutiae):
sij = V (di, dj). (6.1)
The similarity score of the samples coming from the same subject and the same instanceis denoted as genuine similarity score sii. Samples of different instances in comparison resultin imposter similarity score sij , i 6= j.
Consider a biometric dataset containing T fingerprint samples. These samples were ob-tained from M instances, by capturing d1
i , . . . , dNii samples per each instance, i = 1, . . . ,M .
That is
T =
M∑i=1
Ni. (6.2)
Let’s denote dui as the u-th sample of instance i.Using a particular recognition system Vk, k = 1, . . . ,K of all K available systems, for
each dataset a set S of similarity scores can be computed. Set S will consist of 2 disjointsubsets: a subset of genuine similarity scores:
Sii = {su,vi,i |su,vi,i = Vk(d
ui , d
vi )}, (6.3)
for u = 1, . . . , Ni and v = 1, . . . , Ni and u 6= v
i = 1, . . . ,M
and a subset of imposter similarity scores:
Sij = {su,vi,j |su,vi,j = Vk(d
ui , d
vj )}, (6.4)
for u = 1, . . . , Ni and v = 1, . . . , Nj
i = 1, . . . ,Mand j = 1, . . . ,Mand i 6= j.
The size of the subset of genuine similarity scores is
|Sii| =M∑i=1
P (Ni, 2) =
M∑i=1
Ni(Ni − 1), (6.5)
31

in words there are Ni − 1 genuine scores per each sample of instance i.And the size of the subset of imposter similarity scores is
|Sij | =M∑
i=1,j=1,j 6=iNiNj , (6.6)
which means that each sample dui of the dataset has∑M
j=1,j 6=iNj imposter scores.Figure 6.1 shows the histogram of genuine and imposter similarity scores that were
computed on the FVC2004 Db3 dataset [27] using the Neurotechnology VeriFinger SDK[29]. There are 8 samples per instance, 110 instances, which is in total 6 160 genuine and767 360 imposter similarity scores. To visualize them altogether, the frequency of genuineand imposter scores was normalized in order to sum to one in total.
−200 0 200 400 600 800 1000 1200 14000
0.01
0.02
0.03
0.04
0.05
Similarity score
Norm
aliz
ed fre
quency
Genuine and imposter similarity scores: FVC2004, Neurotechnology
Imposter similarity scores
Genuine similarity scores
Figure 6.1: Normalized histogram of genuine and imposter similarity scores computed byNeurotechnology VeriFinger SDK [29] on the FVC2004 Db3 dataset [27].
Definition in [10] describes similarity score as a comparison score that increases withsimilarity. A higher similarity score indicates a higher likelihood that the samples comefrom the same subject. It is possible to observe this from the higher genuine scores inFigure 6.1. But at the same time you can also see that the genuine score distribution ismuch wider than the imposter score distribution. And even more, both the distributionsare overlapping.
Overlapping distributions mean that a given sample dui results in a false match if thereis a smaller genuine similarity score su,vi,i than some impostor similarity score su,wi,j :
su,vi,i < su,wi,j , (6.7)
u ∈ [1, Ni] and v ∈ [1, Ni] and w ∈ [1, Nj ] and u 6= v
i ∈ [1,M ] and j ∈ [1,M ] and i 6= j.
32

If the cumulative distribution function (CDF) is used to describe the distribution of theimposter similarity scores P (si), than it describes the False match rate (FMR):
FMR = 1− P (si). (6.8)
Similarly, the cumulative distribution function of genuine similarity scores, P (sg) rep-resents the False non-match rate (FMR):
FNMR = P (sg), (6.9)
Both the FNMR and FMR as described in Section 3 are common indicators of thebiometric system performance. It indicates the fact, that the similarity scores can be usedto construct a performance-based quality metric based on the genuine and imposter scoredistributions.
6.3 Quantifying Utility
If the performance-based quality should be predictive of the performance of the verificationalgorithm, good quality samples must have high genuine similarity scores and they shouldbe also well separated from the imposter score distribution. On the other hand, poor qualitysamples should have lower genuine similarity scores, some of them being even similar toimposter scores. In that context, the metric describing the performance of the biometricsystem should measure how much the genuine distribution P (sg) is separated from theimposter distribution P (si).
ISO/IEC IS [16] defines a term utility as the predictor of a positive or negative contribu-tion of an individual sample to the overall performance of the biometric system. Moreover,stemming from the formulas described above the utility computation is proposed in theinformative part of the ISO/IEC IS [16] as follows:
utilityui =mmatedi,u −mnon−mated
i,u
σmatedi,u + σnon−matedi,u
, (6.10)
where mmatedi,u is the mean of sample dui ’s genuine similarity scores. It is a representative
of the expected genuine similarity score. Similarly, mnon−matedi,u is the mean of sample dui ’s
non-mated similarity scores as expected imposter similarity score. Similarly, σmatedi,u is the
standard deviation of sample dui ’s mated similarity score and σnon−matedi,u is the standarddeviation of sample dui ’s non-mated similarity score.
The utility value proposed conforms to our requirements on the performance orientedmeasure of sample quality. In contrast to comparison which involves two samples, utilityis defined and measured per sample. Moreover, the quality values are continuous and canbe normalized into range of [0, 100] as recommended by the ISO/IEC IS [16]. Afterwards,regression methods can be applied in order to determine a linear or non-linear mappingfrom the quality score to the utility value.
Note that the utility as described here is not only dependant on the comparator sub-system. Also the process of feature extraction can contribute to the similarity score. Theterm recognition system was used to cover both.
33

6.4 Quality Levels
Transforming the continuous utilities into several distinct values makes evaluation morerobust. It is also pragmatic to do so because of the following facts.
First, the proposed utility computation is dependent on the used recognition algorithm.Therefore different algorithms can yield different comparison scores and thus to result indifferent utility values.
Figure 6.2 shows the correlation of utilities computed on similarity scores generatedby different recognition algorithms. Similarity scores were computed from total 880 sam-ples of FVC2004 Db1 dataset [27]. The similarity scores were generated by two availableverification algorithms: Neurotechnology VeriFinger SDK [29] and Innovatrics ANSI/ISOTemplate generator and comparator [13]. One can observe that there is a significant dif-ference in utility output of two vendors. The linear relationship between the utility values,measured by the Pearson correlation coefficient [32], is 0.6 which gives evidence about thevariation of utilities.
0 1 2 3 4 5 6 7 80
1
2
3
4
5
6
7
8
9
Neurotechnology
Innovatr
ics
UTILITY correlation: datasetFVC2004 Db1, 2 different verification algorithms
Pearson correlation = 0.61
Figure 6.2: Correlation of the utilities computed on the FVC2004 Db1 dataset [27]. Thereare 880 utilities, one utility per sample, shown. Similarity scores were generated by Neu-rotechnology VeriFinger SDK [29] and Innovatrics ANSI/ISO Generator & Matcher [13].To quantify the linear dependence, the Pearson correlation coefficient is shown.
Another fact is that some quality assessment algorithms might only provide a discreteoutput with few distinct values and such an algorithm would be difficult to compare to acontinuous utility.
The target quality resolution must be selected with respect to the dataset size and thesensitivity of the verification algorithm on the input image quality. ISO/IEC IS [16] specifiesthe minimal resolution of the sample quality that still has the ability to discriminate amongdistinct levels of performance.
34

There are four distinct classes:
• “excellent”
• “adequate”
• “marginal”
• “unacceptable”
In this work, 5 classes were considered to provide sufficient quality resolution. They areshown in the Table 6.1.
Mapping utilities into individual levels (=bins) can be accomplished according to theISO/IEC recommendation [16]. It is based on the separation of genuine and impostersimilarity scores. But utility value itself does not include the information about whichsamples resulted in false matches at comparisons. Therefore the utilities will be additionallydivided into two sets: utilities of falsely matched samples and utilities of correctly matchedsamples. The separation is based on the criteria 6.7.
Binning of the utility values should be designed in such a manner, that sufficient numberof samples fall into each bin. That involves binning based on the distribution of populationand not the range of utility. Two empirical cumulative distribution functions (CDF) shouldcomputed. One for utilities of falsely matched samples W (.) and one for those that werecorrectly matched in all cases C(.). Then the utilities are binned according to the quantilesof the utility distributions C(.) and W (.). The quantile functions are nothing else thanthe inverses of their CDF and therefore they are denoted as C−1(.) and W−1(.), whereC−1(0) (or W−1(0)) and C−1(1) (or W−1(1)) denote the empirical minima and maxima,respectively. Possible bin boundaries proposed by ISO/IEC [16] are shown in Table 6.1.According to [9], x = 0.25 and y = 0.75 were chosen for the utility binning performed inthis thesis.
Quality bin Label Range of utilities
1 “unacceptable” {zi : −∞ < zi < C−1(0.01)}2 “marginal” {zi : C−1(0.01) ≤ zi < W−1(1)}3 “tolerable” {zi :W−1(1) ≤ zi < C−1(x)}4 “adequate” {zi : C−1(x) ≤ zi < C−1(y)}5 “excellent” {zi : C−1(y) ≤ zi}
Table 6.1: Binning of the utility values according to the ISO /IEC [16].
Figure 6.3 shows the bin boundaries computed from the empirical CDF of utilities ofcorrectly and falsely matched samples. The CDFs were computed on 678 correctly and 202falsely matched samples of the FVC2004 Db3 dataset [27].
Finally, the performance-based quality qui is assigned to a sample dui according to thebin to which its utilityui falls in.
Note that this quality is bounded to a particular recognition algorithm. To createa system-independent quality measure, the performance-based quality values need to becomputed for all of the K available recognition algorithms and afterwards fused into oneaccording to an aggregation function. The aggregation function can be median or arithmeticmean or some other statistical expression of quality values.
35

0 2 4 6 8 10 12 14 16 180
0.1
0.2
0.3
0.4
0.5
0.6
0.7
0.8
0.9
1
1 2 3 4
Utility
Cum
ula
tive d
istr
ibution
CDFs of utilities of correctly and falsely matched samples:FVC2000Db2, Neurotechnology
Matched falesly
Matched correctly
Figure 6.3: Empirical cumulative distribution functions of utilities computed from simi-larity scores of correctly and falsely matched samples of FVC2000 Db2 dataset [28]. Binboundaries are shown (1 = red, 2 = green, 3 = blue, 4 = cyan). Similarity scores computedby Neurotechnology VeriFinger SDK [29].
36

Chapter 7
Dataset Selection
For a reliable evaluation of quality assessment methods it is important to select appropriatedata, from which a general conclusion can be derived. Therefore, several aspects wereconsidered while obtaining datasets.
First, for constructing a robust, performance-based quality measure it is necessary tohave fingerprint samples of high inter-subject and intra-subject variability. Translated intoEnglish, a large-scale dataset is needed, which consists of many fingers scanned in multiplesessions.
Second, the quality assessment should not be bounded to a particular acquisition device.Datasets should consist of fingerprint images obtained from multiple sensors.
Third, more realistic results are obtained if data is collected in sessions with time inter-vals in between.
The rest of the chapter describes the datasets that were used for quality assessment aswell as for creation of the performance-based quality metric.
The semi-public datasets were provided by the Center for Advanced Security ResearchDarmstadt, Germany.
7.1 FVC Datasets
Four international Fingerprint Verification Competitions (FVC) were organized in 2000,2002, 2004 and 2006 [28, 26, 27, 7]. For each competition, a fingerprint dataset had beencreated. In this thesis, the first three datasets are used. The fourth, FVC2006 dataset, isnot publicly available and despite of the author’s effort towards the BIOSEG1 group, thedataset was not provided till the submission date of this thesis.
Each dataset consists of four databases (Db1, Db2, Db3, Db4) that were acquired usingthree different sensors (Db1–3) and the SFinGE synthetic generator (Db4) [20]. This thesisonly considers real fingerprints and so from each FVC dataset Db4 was omitted.
Each database has 110 fingers with eight impressions per finger, resulting in 880 im-pressions.
The databases were obtained with different intentions and so they differ in severalaspects. The rest of this section provides a short description of each database with regardto sample quality [1].
1The Biometric Systems Lab of University of Bologna, http://bias.csr.unibo.it/research/biolab.
37

7.1.1 FVC2000
In FVC2000 [28], the acquisition conditions were different for each database (e.g. interleav-ing/not interleaving acquisition of different fingers, periodical cleaning/not cleaning of thesensor). For all the databases, no care was taken to assure the minimum quality of the fin-gerprints. The fingerprints are often rotated, however, it was assured that two impressionsfrom the same finger always have an overlapping area.
Database Db1 was excluded from the quality assessment and evaluation proposed inthis thesis as the author suspects it not to pass the requirements specified by ISO/IEC [14],also explained in Section 4. The observed problem is in an insufficiently small sensing area.
Sample images taken from each database are shown in Figure 7.1.
Figure 7.1: Example of a fingerprint image from each database of the FVC2000 dataset[28]. All the images were scaled down by the same factor.
7.1.2 FVC2002
In FVC2002 [26], the acquisition conditions were the same for each database: interleavedacquisition of different fingers to maximize differences in finger placement, no care was takenin assuring the minimum quality of the fingerprints and the sensors were not periodicallycleaned. Some sessions were focused on an excessive displacement or rotation and someother on dry or moistened fingers.
An example of acquired images from each database are shown in Figure 7.2.
Figure 7.2: Sample images taken from databases Db1, Db2, Db3 and Db4 of FVC2002dataset [26]. All the images were scaled down by the same factor.
38
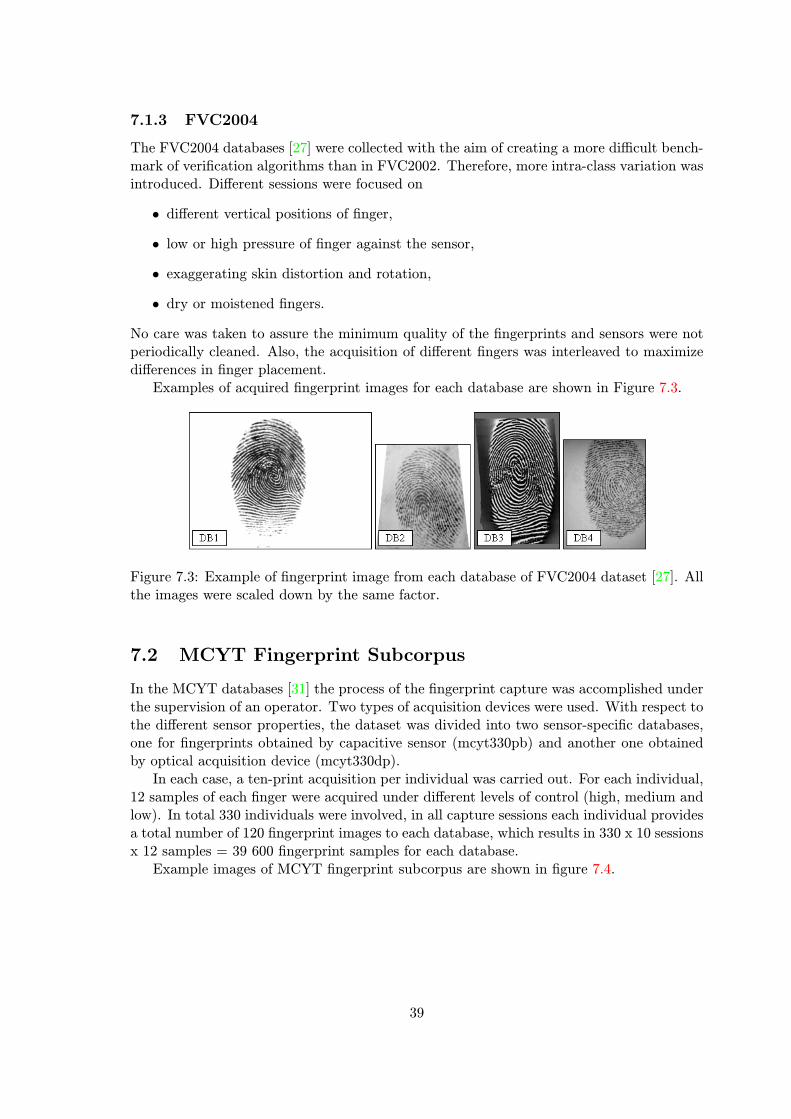
7.1.3 FVC2004
The FVC2004 databases [27] were collected with the aim of creating a more difficult bench-mark of verification algorithms than in FVC2002. Therefore, more intra-class variation wasintroduced. Different sessions were focused on
• different vertical positions of finger,
• low or high pressure of finger against the sensor,
• exaggerating skin distortion and rotation,
• dry or moistened fingers.
No care was taken to assure the minimum quality of the fingerprints and sensors were notperiodically cleaned. Also, the acquisition of different fingers was interleaved to maximizedifferences in finger placement.
Examples of acquired fingerprint images for each database are shown in Figure 7.3.
Figure 7.3: Example of fingerprint image from each database of FVC2004 dataset [27]. Allthe images were scaled down by the same factor.
7.2 MCYT Fingerprint Subcorpus
In the MCYT databases [31] the process of the fingerprint capture was accomplished underthe supervision of an operator. Two types of acquisition devices were used. With respect tothe different sensor properties, the dataset was divided into two sensor-specific databases,one for fingerprints obtained by capacitive sensor (mcyt330pb) and another one obtainedby optical acquisition device (mcyt330dp).
In each case, a ten-print acquisition per individual was carried out. For each individual,12 samples of each finger were acquired under different levels of control (high, medium andlow). In total 330 individuals were involved, in all capture sessions each individual providesa total number of 120 fingerprint images to each database, which results in 330 x 10 sessionsx 12 samples = 39 600 fingerprint samples for each database.
Example images of MCYT fingerprint subcorpus are shown in figure 7.4.
39

Figure 7.4: Fingerprint examples from MCYT Fingerprint subcorpus [31]. Fingerprintimages are given for the same finger for both capacitive acquisition (left in each pannel) andoptical acquisition (right in each pannel), and three different fingerprints in the database,one per column.
7.3 CASIA Fingerprint Image Database
The Fingerprint Image Database Version 5.0 [39] was created and provided by the theChinese Academy of Sciences Institute of Automation (CASIA).
The database contains 20,000 fingerprint images of 500 subjects. The fingerprint im-ages of CASIA-FingerprintV5 were captured in one session using optical fingerprint sensor.From each subject, 40 fingerprint images were acquired from eight fingers (left and rightthumb/second/third/fourth finger), i.e. 5 images per finger. The volunteers were askedto rotate their fingers with various levels of pressure to generate a significant intra-classvariation.
Example images from CASIA fingerprint database are shown in Figure 7.5.
Figure 7.5: Example fingerprint images of CASIA-FingerprintV5 database [39].
40

Chapter 8
Evaluation
Previous chapters described the concept of quality estimation measures and performanceoriented quality. Now these two concepts will be bound together and evaluated on thedatabases described in Section 7. The tools of explanatory data analysis will be used tovisualize the results.
8.1 Quality Estimation
For each sample from all available databases a quality score vector was computed. Thevector consists of the output values from global as well as local quality estimation methodsdescribed in Section 5.
To validate that the obtained data is correct, a visualization of its probability distribu-tion should be done. E.g. an enormous amount of quality values close to the minimum (0)or maximum (1) value would indicate a possible error in design or implementation of thequality assessment methods or the dataset composition.
Figure 8.1 shows the distribution of quality scores for the largest available database -MCYT330dp. Each of the histograms was computed on 39 600 quality values. From allthe histograms a desirable distribution of the data can be observed: the normalized outputrange (from 0 to 1) is adequately covered by the quality scores and moreover, there is anevident normal distribution of the scores.
A small difference can be seen for the output of the assessment method based on ori-entation flow where the scores are more concentrated close to the maximum (1). The factcan be assigned to the operational settings of the metric. Decreasing the tolerance of an-gular change in the ridge flow between the neighbouring blocks from 8◦(as explained in theISO/IEC Technical Report [19]) to a smaller angle would most likely yield lower qualityscores. The assumption is based on the definition of the orientation flow metric describedin Section 5.
A similar desirable distribution of quality scores has been observed for all availabledatabases.
Plotting the distributions of given quality metrics also allows for a certain comparisonof the databases. A comparison between databases MCYT330dp and FVC2002 Db3 ispresented in Appendix A. Briefly, higher quality scores were observed in the MCYT330dpdatabase, which testifies to the fact, that the fingerprint samples in MCYT sub-corpus wereacquired under the supervision of an operator in the role of quality controller. By contrast,samples from database FVC2002 were acquired without any quality control, with the intentto obtain more challenging fingerprint samples with varying quality.
41

0 0.1 0.2 0.3 0.4 0.5 0.6 0.7 0.8 0.9 10
200
400
600
800
1000
1200
1400
1600
1800
2000qnMCYT330dp − ocl
(a) Orientation Certainty Level QOCL
0 0.1 0.2 0.3 0.4 0.5 0.6 0.7 0.8 0.9 10
200
400
600
800
1000
1200
1400qnMCYT330dp − lcs
(b) Ridge-valley Structure Analysis: QLC
0 0.1 0.2 0.3 0.4 0.5 0.6 0.7 0.8 0.9 10
500
1000
1500qnMCYT330dp − of
(c) Orientation Flow Analysis QOF
0 0.1 0.2 0.3 0.4 0.5 0.6 0.7 0.8 0.9 10
200
400
600
800
1000
1200qnMCYT330dp − pow
(d) Radial Power Spectrum QPOW
Figure 8.1: Distribution of the scores of local and global quality analysis methods on theMCYT330dp fingerprint database [31]. There are total 36 900 values in each histogram.
8.2 Relationship Among Quality Metrics
To improve the prediction capability of the quality apparatus, several quality metrics canbe combined to produce a scalar quality score. High improvement can be achieved onlyif the metrics describe distinguishing properties of the fingerprint image. Therefore, it isimportant to analyse the relationship between quality scores of different metrics.
In Figure 8.2, scatter-plots were used to visualize the correlation between all pairs ofquality metrics. The quality scores are shown for the FVC2002 Db3 database. Note thatit is not necessary to observe a linear correlation between the quality values. The Spear-man’s rank correlation coefficient was chosen as a non-parametric measure of statisticaldependence between two quality values [32].
It can be visually observed from Figure 8.2, that there is quite high correlation betweenthe quality metrics. The strongest correlation is observed between the Ridge-valley struc-ture analysis (QLC) and Orientation Certainty Level (QOCL) (in Figure 8.2(c)). It can beexplained by the fact that both QLC and QOCL are local quality analysis methods and theyuse the same eigenvalues computed within blocks as a measure of ridge orientation.
On the contrary, the smallest correlation is observed between the Orientation FlowAnalysis (QOF ) and Radial Power Spectrum (QPOW ) (shown in Figure 8.2(f)).
The same degree of correlation between quality metrics was observed in all availabledatabases. The obtained Spearman’s correlation values can be a valuable information forthe quality metrics fusion.
42
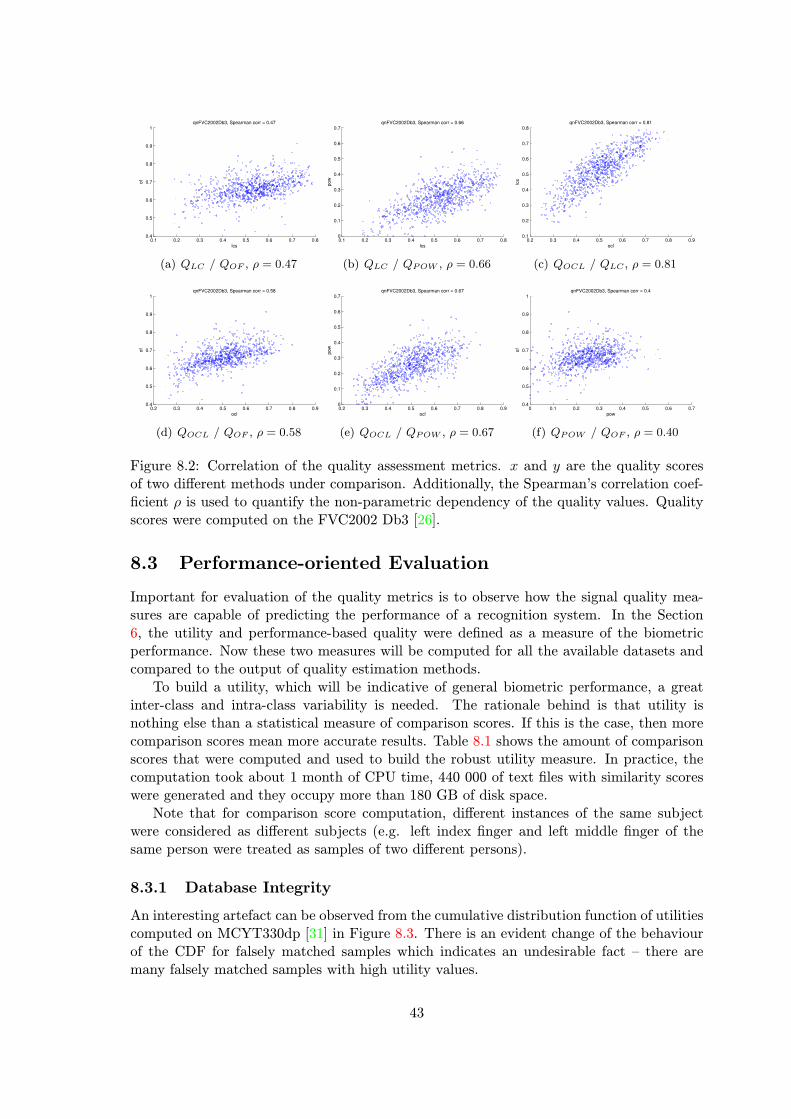
0.1 0.2 0.3 0.4 0.5 0.6 0.7 0.80.4
0.5
0.6
0.7
0.8
0.9
1
lcs
of
qnFVC2002Db3, Spearman corr = 0.47
(a) QLC / QOF , ρ = 0.47
0.1 0.2 0.3 0.4 0.5 0.6 0.7 0.80
0.1
0.2
0.3
0.4
0.5
0.6
0.7
lcs
pow
qnFVC2002Db3, Spearman corr = 0.66
(b) QLC / QPOW , ρ = 0.66
0.2 0.3 0.4 0.5 0.6 0.7 0.8 0.90.1
0.2
0.3
0.4
0.5
0.6
0.7
0.8
ocl
lcs
qnFVC2002Db3, Spearman corr = 0.81
(c) QOCL / QLC , ρ = 0.81
0.2 0.3 0.4 0.5 0.6 0.7 0.8 0.90.4
0.5
0.6
0.7
0.8
0.9
1
ocl
of
qnFVC2002Db3, Spearman corr = 0.58
(d) QOCL / QOF , ρ = 0.58
0.2 0.3 0.4 0.5 0.6 0.7 0.8 0.90
0.1
0.2
0.3
0.4
0.5
0.6
0.7
ocl
pow
qnFVC2002Db3, Spearman corr = 0.67
(e) QOCL / QPOW , ρ = 0.67
0 0.1 0.2 0.3 0.4 0.5 0.6 0.70.4
0.5
0.6
0.7
0.8
0.9
1
pow
of
qnFVC2002Db3, Spearman corr = 0.4
(f) QPOW / QOF , ρ = 0.40
Figure 8.2: Correlation of the quality assessment metrics. x and y are the quality scoresof two different methods under comparison. Additionally, the Spearman’s correlation coef-ficient ρ is used to quantify the non-parametric dependency of the quality values. Qualityscores were computed on the FVC2002 Db3 [26].
8.3 Performance-oriented Evaluation
Important for evaluation of the quality metrics is to observe how the signal quality mea-sures are capable of predicting the performance of a recognition system. In the Section6, the utility and performance-based quality were defined as a measure of the biometricperformance. Now these two measures will be computed for all the available datasets andcompared to the output of quality estimation methods.
To build a utility, which will be indicative of general biometric performance, a greatinter-class and intra-class variability is needed. The rationale behind is that utility isnothing else than a statistical measure of comparison scores. If this is the case, then morecomparison scores mean more accurate results. Table 8.1 shows the amount of comparisonscores that were computed and used to build the robust utility measure. In practice, thecomputation took about 1 month of CPU time, 440 000 of text files with similarity scoreswere generated and they occupy more than 180 GB of disk space.
Note that for comparison score computation, different instances of the same subjectwere considered as different subjects (e.g. left index finger and left middle finger of thesame person were treated as samples of two different persons).
8.3.1 Database Integrity
An interesting artefact can be observed from the cumulative distribution function of utilitiescomputed on MCYT330dp [31] in Figure 8.3. There is an evident change of the behaviourof the CDF for falsely matched samples which indicates an undesirable fact – there aremany falsely matched samples with high utility values.
43

Comparison scores (by one vendor)
Dataset Genuine Imposter
FVC 2000 Db1, Db2, Db3
6× 6.16× 103 6× 767.36× 103FVC 2002 Db1, Db2, Db3
FVC 2004 Db1, Db2, Db3
CASIA 80× 103 79.98× 10⁶
MCYT 330dp2× 435.6× 103 2× 130× 106
MCYT 330pb
Total, for 2 vendors 660 000 000
Table 8.1: Statistics on comparison scores used for utility computation.
Looking back into Section 6, the utility value is computed from sample’s genuine andimposter similarity scores. Correctly matched samples have high genuine similarity scoreswhile low imposter similarity scores, which implies high utility. On the contrary, if there isat least one genuine score which is lower than any imposter similarity score, the sample ismarked as falsely matched. These rules refer to the top-ranked conditions in ISO/IEC IS29794-1 [16].
−5 0 5 10 15 20 250
0.1
0.2
0.3
0.4
0.5
0.6
0.7
0.8
0.9
1
Utility
Cum
ula
tive d
istr
ibution
CDFs of utilities of correctly and falsely matched samples:MCYT330dp, Neurotechnology
Matched falsely
Matched correctly
Figure 8.3: Example of the impact of sample labelling errors on the utility computation.Cumulative distribution functions of utilities of correctly and falsely matched samples.Similarity scores were computed by running the Neurotechnology VeriFinger SDK [29] onthe MCYT330dp database [31].
If a sample is falsely matched and has a high utility, it indicates that it yields highgenuine similarity scores and low imposter scores except for at least one sample. If it is agenuine sample, the similarity score has to be extremely small (smaller than any imposterscore). If it is an imposter sample, the similarity score has to be extremely high (higherthan any genuine score). And this is a highly unlikely scenario for fingerprints that were
44

obtained in a controlled environment.As described in Section 7, fingerprint samples of MCYT sub-corpus were acquired under
supervision of an operator who performs the quality check. These facts led the author tothe theory that there are labelling errors in the MCYT330dp dataset and these errors canbe easily detected by the implemented utility function.
Labelling errors in fingerprint dataset MCYT330dp as well as MCYT330dp were after-wards also confirmed by the University of Twente, Holland1.
For performance evaluation, it is crucial for each fingerprint image to be correctly as-signed to its source. It can be observed from the figure that there are at least 30 %of wrongly falsely matched samples. Detection and correction of the mislabelled samplesis not in the scope of the thesis and therefore the author decided to exclude the entireMCYT330 fingerprint sub-corpus (dataset MCYT330dp and MCYT330pb) from furtherevaluation based on biometric performance.
(a) QLC , ρ = 0.17 (b) QOCL, ρ = 0.22
(c) QPOW , ρ = 0.23 (d) QOF , ρ = 0.022
Figure 8.4: Correlation between predicted quality and measured utility. There are utilitieson the x axis and quality values of given metric on the y. The Spearman’s correlationcoefficient ρ is shown. For the utility computation, similarity scores obtained from Neu-rotechnology VeriFinger [29] were used.
1To the best knowledge of the author, there has not been published any report describing labelling errorsin MCYT [31] fingerprint sub-corpus yet.
45

8.3.2 Correlation Between Quality and Utility Scores
Computed utility can be directly plotted against the predicted quality to see how theparticular quality measure is able to predict the impact of a sample on the biometricperformance.
Figure 8.4 shows the correlation between particular quality metric and utility of thesamples from the CASIA dataset [39]. Again, the Spearman correlation coefficient is usedto measure the non-linear relationship between the quality and utility.
Very low correlation was observed for all the quality metrics on the CASIA but also theFVC databases. Such a poor dependency makes it impossible to find a regression methodwhich will map quality values to utilities. The same problem was encountered by Tabassiet al. [38]. Thus, with reminder to the Section 6, the utilities will be further divided intofewer classes.
8.4 Performance-based Quality
Raw utility scores are not used for the known reasons (see Section 6). Instead, the binnedutility was designed and it will be referred to as the performance-based quality (PBQ).
However, there is still one more problem with utility. Utility values represent the per-formance of a particular recognition system. Therefore, to improve generality of the utilitymeasure, another recognition algorithm (Innovatrics ANSI/ISO template generator andcomparator [13]) was involved to generate the similarity scores for utility computation.Figure 8.5 shows CDFs of utilities of two different vendors. As one can see, each vendorproduces different similarity scores and so also the range of utility values varies for each ven-dor. To create more robust performance-based quality, utility values from different vendorswill be fused.
0 2 4 6 8 10 12 14 16 180
0.1
0.2
0.3
0.4
0.5
0.6
0.7
0.8
0.9
1
1 2 3 4
Utility
Cu
mu
lative
dis
trib
utio
n
CDFs of utilities of correctly and falsely matched samples:FVC2000Db2, Neurotechnology
Matched falesly
Matched correctly
(a) Neurotechnology
0 2 4 6 8 10 12 140
0.1
0.2
0.3
0.4
0.5
0.6
0.7
0.8
0.9
1
1 2 3 4
Utility
Cu
mu
lative
dis
trib
utio
n
CDFs of utilities of correctly and falsely matched samples:FVC2000Db2, Innovatrics .
Matched falesly
Matched correctly
(b) Innovatrics
Figure 8.5: CDFs of utilities of correctly and falsely matched samples for two vendors[29, 13]. Boundaries between bins shown (1 = red, 2 = green, 3 = blue, 4 = cyan).
For the fusion of utilities, the rule of unanimity was chosen. Only the samples with iden-tical utility bins from both recognition algorithms will be considered for further evaluation.The others will be discarded.
Once the PBQ values were computed according to the proposal in Section 6, they can becompared with the output of the signal quality assessment methods. Figure 8.6 shows the
46

correlation between each quality metric and PBQ on the CASIA dataset. As there are only5 distinct classes, box-plot figures were chosen for visualization. They show the distributionof each quality measure for each class of PBQ. Only insignificantly higher correlation wasachieved compared to to the results in Figure 8.4 although the continuous scale of utilitieswas quantized into 5 classes and 2 different recognition algorithms were incorporated.
0.3
0.4
0.5
0.6
0.7
0.8
1 2 3 4 5Fused&binned utility (Neurotechnology, Innovatrics)
lcs
CASIAfpv5, Spearman cor. = 0.21
(a) QLC , ρ = 0.17
0.3
0.4
0.5
0.6
0.7
0.8
0.9
1 2 3 4 5Fused&binned utility (Neurotechnology, Innovatrics)
ocl
CASIAfpv5, Spearman cor. = 0.25
(b) QOCL, ρ = 0.22
0.2
0.3
0.4
0.5
0.6
0.7
0.8
0.9
1 2 3 4 5Fused&binned utility (Neurotechnology, Innovatrics)
po
w
CASIAfpv5, Spearman cor. = 0.28
(c) QPOW , ρ = 0.23
0.1
0.2
0.3
0.4
0.5
0.6
0.7
0.8
0.9
1
1 2 3 4 5Fused&binned utility (Neurotechnology, Innovatrics)
of
CASIAfpv5, Spearman cor. = 0.089
(d) QOF , ρ = 0.022
Figure 8.6: Correlation between predicted quality and PBQ. On the x axis there is PBQ,on y axis quality values of given metrics. Box-plots are used to visualize the distribution ofquality measure for each class of PBQ. The red line inside the box represents the median,the blue boxes show the inter-quartile range of quality scores, whiskers extend to the mostextreme data points not considered to be outliers. Outliers are plotted individually byred points. The Spearman’s correlation coefficient ρ is shown. For the PBQ computation,similarity scores obtained from Neurotechnology VeriFinger [29] and Innovatrics SDK [13]were used.
8.5 Proposed Utility Modifications
The poor dependency between the signal quality scores and PBQ values indicates a poorcapability of the signal quality measures to predict the biometric performance. However,many studies have demonstrated [2, 42, 6] that rejecting samples that were assessed by thesignal quality measures as low-quality improves the general performance of the biometricsystem. This obvious contradiction requires a deeper analysis of the process of utility
47

computation and also of the impact of one sample to the general biometric performance.The analysis is performed in the next sections.
8.5.1 Score Distributions
Looking back into Section 6, concretely at the computation of utility in Equation 6.10,statistical mean is proposed by ISO/IEC [16] as the mathematical expectation of the gen-uine (imposter) similarity score. And that can be only true if the distribution of genuine(imposter) similarity scores is gaussian. To verify that, a normality test was performed onthe similarity scores for each sample. Jarque-Bera test JB [21] is defined as:
JB =|Sii|6
(U2 +
1
4R2
), (8.1)
where |Sii| is the number of similarity scores for subject i, U is the skewness of sample’ssimilarity score distribution and R is the kurtosis of the sample’s score distribution.
DatasetSamples with normal distribution
genuine comp. s. imposter comp. s.FVC 2000 Db1 8.07% 100%FVC 2000 Db2 5.68% 100%FVC 2000 Db3 13.41% 100%FVC 2002 Db1 5.88% 100%FVC 2002 Db2 6.59% 100%FVC 2002 Db3 8.64% 100%FVC 2004 Db1 8.18% 100%FVC 2004 Db2 7.84% 100%FVC 2004 Db3 8.23% 100%CASIA FPv5.0 6.19% 100%
Table 8.2: Jarque-Bera normality test. Percentage of samples with normal genuine andimposter similarity score distribution. Scores obtained by Neurotechnology VeriFinger [29].The MCYT databases were omitted as they consist of mislabelled samples that negativelyinfluence the score distribution.
Table 8.2 shows the percentage of samples with normal genuine and imposter distri-bution. Only around 8% of samples have a normal genuine distribution and therefore themean value proposed in ISO/IEC is definitely not representing the expected value. Themedian and corresponding absolute median deviation (MAD) were preferred by the authoras statistically robust measures, being more resilient to outliers than mean and standarddeviation [11]. The utility is then computed as
utilityui =medianmatedi,u −mediannon−matedi,u
MADmatedi,u +MADnon−mated
i,u
, (8.2)
with the same notation of sample and subject as in the initial Equation 6.10.An illustration of the difference between the old and new utility distribution is given
in Figure 8.7. It is visible that there are more falsely matched samples with high utilityvalues. The reason of the effect will be described in Section 8.5.2. There are also some
48

extreme outliers among the falsely matched samples and therefore the corresponding CDFstretches more towards higher utility values. It is out of the interest. Further, it can benoticed that the bins now overlap. It means that for the utility computed from medians, adifferent binning has to be set which is a reasonable effect.
0 2 4 6 8 10 12 14 16 18 200
0.1
0.2
0.3
0.4
0.5
0.6
0.7
0.8
0.9
1
1 2 3 4
Utility
Cu
mu
lative
dis
trib
utio
n
CDFs of utilities of correctly and falsely matched samples:CASIAmean, Neurotechnology
Matched falsely
Matched correctly
(a) Utility with mean
0 2 4 6 8 10 12 14 16 18 200
0.1
0.2
0.3
0.4
0.5
0.6
0.7
0.8
0.9
1
1 23 4
Utility
Cu
mu
lative
dis
trib
utio
n
CDFs of utilities of correctly and falsely matched samples:CASIAmed., Neurotechnology
Matched falsely
Matched correctly
(b) Utility with median
Figure 8.7: CDFs of utilities of correctly and falsely matched samples computed accordingto the old and newly proposed equation. Boundaries between bins shown (1 = red, 2 =green, 3 = blue, 4 = cyan).
8.5.2 Falsely and Correctly Matched Samples
Table 8.2 showed that samples genuine similarity scores do not fit the normal distribution.It often means that there was some low genuine similarity score for a subject while theothers were high.
As an example of this problem, a similarity score matrix for subject 57 from databaseFVC2000 Db2 is shown in Table 8.3. In the table, probe 1 yields low similarity scores withmost of the other genuine samples. For some of them, it is even lower than some impostersimilarity score (red cells in the table). According to the utility division proposed by ISO/IEC [16], all such samples will be marked as falsely matched (red lines/colloums in table).As a result these samples will end up with quite a low utility and a very low PBQ.
However, it can also be seen from the table that these samples yield high genuinesimilarity scores with all the other samples which means they provide high recognitionperformance with all except one sample (in this case it is probe 1). On that account, it isdesirable to assign low PBQ only to sample 1 and not to all the falsely matched samples.
In the proposed modified utility computed from median values, all the samples exceptfrom #1 would gain a high utility though they would be still marked as falsely matched.If the binning system is adjusted to allow false matched samples with high utility to havehigh PBQ, the problem is solved.
8.6 Results Statement
With respect to the mentioned issues, modifications in the utility computation were madeand all utility values were recalculated according to them.
49

Probe\Ref. 1 2 3 4 5 6 7 81 1629 389 327 143 26 62 17 202 2087 1103 680 189 179 132 1053 2126 663 207 200 165 1524 2144 123 104 222 2065 2132 348 320 2856 1925 210 1297 2066 7748 1818
Table 8.3: Similarity score matrix for subject 57 from FVC 2000 Db2 [28].
To construct the performance-based quality, a new binning has to be performed. Toachieve a bigger quality coarseness, utilities are divided just into two classes (bins) – sampleswith insufficient quality (labelled as “poor PBQ”) and samples with sufficient quality (“goodPBQ”). The boundary between the classes was set to the utility value reached by 90% of thefalsely matched samples. Such a coarse division enables the relationship with signal-qualitymeasures to be analysed in a more robust way.
In Figure 8.8 quality measures were plotted one against another (analysis on the CASIAdataset). Each sample from the dataset was labelled according to its PBQ value (class).An evident correlation between the quality measures can be observed but the samples ofdifferent PBQ classes strongly overlap. The conclusion of the study is that the signalquality measures themselves cannot achieve high accuracy in prediction of the recognitionperformance.
Note that this statement is not in contradiction with the studies [2, 6] stating thatthey have achieved improvement of the biometric performance based on rejecting sampleswith poor quality. These poor signal-quality samples are in Figure 8.8 scattered in thelower left corner in each plot. For a suitable combination of multiple quality measures, (inour example probably QOCL with QPOW 8.8(b)), most of the samples assigned as of poorsignal-quality will be of poor PBQ, too. Thus sample rejection based on the signal qualitymeasures will certainly achieve some biometric performance improvement.
Why the signal quality metrics do not predict the recognition performance?Further investigations have revealed that the biggest impact on the performance of minutiae-based recognition systems have mutually inconsistent samples of the same subject.
For explanation, subject 57 from FVC 2000 Db2 database was again chosen as anexample. All the samples of the subject are shown in Figure 8.9. The genuine similarityscores matrix is provided in Table 8.3. It can be seen immediately from the images thatthe sample 1 only includes a partial impression of the finger. Looking at the similarityscore matrix, it yields low similarity scores with the other genuine samples (red row) andthus it results in low utility2. But the low utility is in contradiction with the behaviourof all the signal quality measures since they assigned high quality values for sample 1! Avisual control confirms that the output of signal quality assessment methods is correct – thefingerprint image is of a high biometric signal quality. It consists of clear, distinguishableridges and valleys from which the features can be unambiguously extracted (description offingerprint quality by Ratha et al. [33]). Therefore, the low utility and the low biometric
2The new utility was computed.
50

(a) QOCL/QLC (b) QOCL/QPOW
(c) QLC/QPOW (d) QOCL/QOF
Figure 8.8: Relationship between two given signal quality measures (x and y axes) andperformance-based quality, represented by two classes: “poor” and “good”. Quality assess-ment performed on the fingerprints of CASIA dataset [39]. PBQ computed on the similarityscores obtained from Neurotechnology Verifinger [29] and Innovatrics SDK [13].
performance on that sample is caused by the number of minutiae detected and does notrefer to the extract-ability of features. This is the reason why signal quality metrics are notin a strong correlation with PBQ.
51

No.Util.QOCLQLCQPOWQOF
1 1.08 0.65 0.58 0.58 0.70
2 2.06 0.76 0.59 0.61 0.65
3 3.37 0.76 0.76 0.68 0.64
4 2.28 0.58 0.57 0.55 0.63
5 2.29 0.80 0.75 0.71 0.62
6 3.01 0.75 0.64 0.66 0.68
7 2.46 0.76 0.72 0.67 0.64
8 2.48 0.77 0.72 0.58 0.70
Figure 8.9: Example of the fingerprint sample-quality assessment. On the left there arefingerprint samples of one subject shown. On the right, sample utility values and qualityvectors are computed. The data are from subject 57 from FVC 2000 Db2 [28]. The utilitieswere computed from similarity scores obtained from Neurotechnology VeriFinger [29].
52

What is the solution?All the methods that are included in the evaluation only deal with the signal quality offingerprints and not with the fingerprint area and position. The only metric which isrelatively capable to reflect the size of the area of the fingerprint pattern is the methodbased on the analysis of power spectrum in frequency domain (QPOW , described in Section5). It was designed with respect to the ISO/IEC IS [16] and measures the maximum ofthe energy concentration in the power spectrum of the frequency band corresponding to afingerprint pattern. A complete fingerprint pattern gives a stronger energy concentrationand thus QPOW achieved a higher correlation with utility and PBQ than any other method.
To sum it up, for systematic evaluation of fingerprint signal quality assessment methods,it is necessary to construct a large-database that consists of images of varying quality butwhere the completeness of the fingerprint images is guaranteed.
Another possible solution is to combine signal quality metrics with measures dealingwith the completeness of the fingerprint pattern. The methods that reflect the presence andposition of the core point within the fingerprint image could achieve a higher performanceprediction capability, especially for recognition systems based on minutiae detection. Apromising technique could be a measure of the distance of the core point from the centreof gravity of the fingerprint pattern.
53

Chapter 9
Conclusion
As long as the fingerprint recognition is used in biometrics, the problem of fingerprintquality remains open. But there is an evidence of change. Standardization process ondefining fingerprint quality has begun. In 2010, when this thesis was initiated, ISO/IECpublished a Technical Report [19] on fingerprint image quality. This thesis was conductedin consideration of the mentioned report.
The thesis presents a comparative study of fingerprint image signal quality estima-tion methods. Crucial aspects that influence the fingerprint quality were described andconnected to the definition of biometric sample quality. The selected state-of-the-art ap-proaches for fingerprint image signal quality estimation were described and implementedin MATLAB. Further, the problem of evaluation of these methods was explained and aperformance-based quality measure was introduced as a possible way out. Finally, the eval-uation was performed on large-scale multi-sensor and multi-session databases in order todetermine the capability of the fingerprint estimation methods to predict the performanceof the recognition algorithm.
While designing and implementing the quality assessment workflow in Section 5, severalerrors were detected in the published ISO/IEC Technical Report [19]. They refer to theissues of score normalization and aggregation function. The performance-based evaluationin Section 8 disclosed another problem in the publicly accepted utility computation, alreadyincluded in the informative part of the ISO/IEC International Standard [16]. Improperstatistical measures (mean and standard deviation) and an inappropriate design based onthe utility binning lead to the inaccuracies in computation of sample’s utility, especially forfingerprints with high intra-subject variability. All these comments have been formulatedand soon they will be addressed to the ISO JTC1/SC37 technical committee for furtherinvestigation.
Also practical applications can benefit from the evaluation proposed in the thesis. Re-cently, NIST1 together with BSI2 initiated a joint project on developing a novel measureof fingerprint quality, more accurate than the current NIST Fingerprint Image Quality(NFIQ) algorithm. This thesis has identified several areas of the potential improvement ofthe NFIQ and the results proposed here will be considered for the new proposal.
To the best knowledge of the author, no previous studies on the capability of qualityassessment methods to predict the biometric performance have been published. It is stilla matter of further investigation. To considerably improve the prediction of the biomet-
1American National Institute of Standards and Technology, USA.2Federal Office for Information Security, Germany.
54

ric performance, the methods assessing signal quality should be combined together withmethods detecting fingerprint consistency and completeness. Besides, experiments haveshown that some quality measures are more suitable for a specific acquisition technology.Therefore, future work should also involve the study of differences in behaviour of qualityassessment methods.
55

Bibliography
[1] Alonso-Fernandez, F., and Fiérrez, J. Fingerprint databases and evaluation.In Encyclopedia of Biometrics. 2009, pp. 452–458.
[2] Alonso-Fernandez, F., Fiérrez-Aguilar, J., Ortega-Garcia, J.,Gonzalez-Rodriguez, J., Fronthaler, H., Kollreider, K., and Bigün, J. Acomparative study of fingerprint image-quality estimation methods. IEEETransactions on Information Forensics and Security 2, 4 (2007), 734–743.
[3] Chen, T., Jiang, X., and Yau, W. Fingerprint image quality analysis. In ImageProcessing, 2004. ICIP ’04. 2004 International Conference on (oct. 2004), vol. 2,pp. 1253 – 1256 Vol.2.
[4] Chen, Y., Dass, S., and Jain, A. Fingerprint quality indices for predictingauthentication performance. In In: Proc. AVBPA, Springer LNCS-3546 (2005),pp. 160–170.
[5] Fierrez-Aguilar, J., garcia A, J. O., and rodriguez A, J. G. Discriminativemultimodal biometric authentication based on quality measures. Pattern Recognition38, 5 (2005), 777–779.
[6] Fronthaler, H., Kollreider, K., Bigun, J., Fierrez, J.,Alonso-Fernandez, F., Ortega-Garcia, J., and Gonzalez-Rodriguez, J.Fingerprint image-quality estimation and its application to multialgorithmverification. Information Forensics and Security, IEEE Transactions on 3, 2 (june2008), 331 –338.
[7] FVC2006. Fingerprint verification competition.http://bias.csr.unibo.it/fvc2006/default.asp, 2006. [online], [accessed2010-10-15].
[8] Gonzalez, R. C., and Woods, R. E. Digital Image Processing (3rd Edition).Prentice-Hall, Inc., Upper Saddle River, NJ, USA, 2006.
[9] Grother, P., and Tabassi, E. Performance of biometric quality measures. IEEETransactions on Pattern Analysis and Machine Intelligence 29 (2007), 531–543.
[10] Harmonized Biometric Vocabulary.http://www.3dface.org/media/vocabulary.html, [online], [accessed 2010-10-11].
[11] Hoaglin, D., Mosteller, F., and Tukey, J. Understanding Robust andExploratory Data Analysis. John Wiley & Sons, New York, 1983.
56

[12] Hong, L., Jain, A., Pankanti, S., and Bolle, R. Fingerprint enhancement.202–207.
[13] Innovatrics. ANSI/ISO generator and matcher 1.52. http://www.innovatrics.com/products/fingerprint-identification-sdk/ansiiso-sdk, 2011. [online],[accessed 2011-04-20].
[14] ISO/IEC IS 19794-4. Information technology – Biometric data interchange formats– Part 4: Finger image data, 2005.
[15] ISO/IEC IS 19795-1. Information technology – Biometric performance testing andreporting – Part 1: Principles and framework, 2006.
[16] ISO/IEC IS 29794-1. Information technology – Biometric smaple quality – Part 1:Framework, 2009.
[17] ISO/IEC JTC1 SC37. Biometrics: ISO/IEC JTC1 SC37: Harmonized biometricvocabulary.
[18] ISO/IEC JTC1 SC37. Biometrics: ISO/IEC JTC1 SC37: Text of StandingDocument 11 (SD 11), Part 1 Overview Standards Harmonization Document.
[19] ISO/IEC TR 29794-4. Information technology – Biometric smaple quality – Part 4:Finger image data, 2010.
[20] Jain, A. K., and Maltoni, D. Handbook of Fingerprint Recognition.Springer-Verlag New York, Inc., Secaucus, NJ, USA, 2003.
[21] Jarque, C. M., and Bera, A. K. Efficient tests for normality, homoscedasticityand serial independence of regression residuals. Economics Letters 6, 3 (1980), 255 –259.
[22] Kanopoulos, N., Vasanthavada, N., and Baker, R. L. Design of an imageedge detection filter using the sobel operator. IEEE Journal of Solid-state Circuits 23(1988), 358–367.
[23] Lim, E., Jiang, X., and Yau, W.-Y. Fingerprint quality and validity analysis. InICIP (1) (2002), pp. 469–472.
[24] Lim, E., Toh, K.-A., Suganthan, P., Jiang, X., and Yau, W.-Y. Fingerprintimage quality analysis. In Image Processing, 2004. ICIP ’04. 2004 InternationalConference on (oct. 2004), vol. 2, pp. 1241 – 1244 Vol.2.
[25] Liu, L., Tan, T., and Zhan, Y. Based on svm automatic measures of fingerprintimage quality. In Proceedings of the 2008 IEEE Pacific-Asia Workshop onComputational Intelligence and Industrial Application - Volume 01 (Washington,DC, USA, 2008), PACIIA ’08, IEEE Computer Society, pp. 575–578.
[26] Maio, D., Maltoni, D., Cappelli, R., Wayman, J., and Jain, A. K. Fvc2002:Second fingerprint verification competition. In In Proceedings of 16th InternationalConference on Pattern Recognition (ICPR2002), Quebec City (2002), pp. 811–814.
57

[27] Maio, D., Maltoni, D., Cappelli, R., Wayman, J. L., and Jain, A. K.Fvc2004: Third fingerprint verification competition. In in Proceedings of the FirstInternational Conference on Biometric Authentication (2004), pp. 1–7.
[28] Maio, D., Maltoni, D., Wayman, J. L., and Jain, A. K. Fvc2000: Fingerprintverification competition. IEEE Transactions on Pattern Analysis and MachineIntelligence 24 (2002), 402–412.
[29] Neurotechnology. Neurotechnology VeriFinger Software Development Kit.http://www.neurotechnology.com/verifinger.html, 2011. [online], [accessed2011-04-20].
[30] NIST. The NIST special database 27A.http://www.nist.gov/itl/iad/ig/sd27a.cfm, [online], [accessed 2010-10-11].
[31] Ortega-Garcia, J., Fierrez-Aguilar, J., Simon, D., Gonzalez, J.,Faundez-Zanuy, M., Espinosa, V., Satue, A., Hernaez, I., Igarza, J. J.,Vivaracho, C., Escudero, D., and Moro, Q. I. MCYT baseline corpus: Abimodal biometric database. Vision, Image and Signal Processing, IEE Proceedings-150, 6 (2003), 395–401.
[32] Papoulis, A. Probability, Random Variables and Stochastic Processes, 3rd ed.McGraw-Hill Companies, Feb. 1991.
[33] Ratha, N., and Bolle, R. Automatic Fingerprint Recognition Systems. Springer,2003.
[34] Razavi, B. Design of Analog CMOS Integrated Circuits, 1 ed. McGraw-Hill, Inc.,New York, NY, USA, 2001.
[35] Ross, A., and Jain, A. Biometric sensor interoperability: A case study infingerprints. In in Fingerprints, Appeared in Proc. of International ECCV Workshopon Biometric Authentication (2004), pp. 134–145.
[36] Schneider, J. K., Richardson, C. E., Kiefer, F. W., and Govindaraju, V.On the correlation of image size to system accuracy in automatic fingerprintidentification systems. In Proceedings of the 4th international conference on Audio-and video-based biometric person authentication (Berlin, Heidelberg, 2003),AVBPA’03, Springer-Verlag, pp. 895–902.
[37] Shafir, M. US-VISIT transition to 10-fingerprint collection. http://innovya.com/2009/09/19/us-visit-transition-to-10-fingerprint-collection, 2011.[online], [accessed 2011-02-06].
[38] Tabassi, E., Wilson, C. L., and Watson, C. I. Fingerprint image quality:NISTR 7151. Tech. rep., 2004.
[39] Tan, T., and Sun, Z. CASIA–FingerprintV5.http://biometrics.idealtest.org, [online], [accessed 2011-02-05].
[40] Taylor, F., Bicz, W., Banasiak, D., Bruciak, P., Gumulinski, S.,Gumienny, Z., Kosz, D., Krysiak, A., Kuczynski, W., Pluta, M., andRabiej, G. Fingerprint structure imaging based on an ultrasound camera.Instrumentation Science & Technology (1999), 295 –303.
58

[41] Watson, C., Wilson, A., Marshall, K., Indovina, M., and Snelick, R.Studies of one-to-one fingerprint matching with vendor SDK matchers NISTIR. Tech.rep., NIST, Gaithersburg MD, 2003.
[42] Wilson, C., Watson, C., and Garris, M. Matching performance for theUS-VISIT IDENT system using flat fingerprints. Tech. rep., NIST, 2004.
59

Appendix A
Quality Score Distribution
0 0.1 0.2 0.3 0.4 0.5 0.6 0.7 0.8 0.9 10
200
400
600
800
1000
1200
1400
1600
1800qnMCYT330pb − ocl
0 0.1 0.2 0.3 0.4 0.5 0.6 0.7 0.8 0.9 10
5
10
15
20
25
30
35
40qnFVC2002Db3 − ocl
(a) Orientation Certainity Level QOCL
0 0.1 0.2 0.3 0.4 0.5 0.6 0.7 0.8 0.9 10
500
1000
1500
2000
2500qnMCYT330pb − lcs
0 0.1 0.2 0.3 0.4 0.5 0.6 0.7 0.8 0.9 10
5
10
15
20
25
30
35
40qnFVC2002Db3 − lcs
(b) Ridge-Valley Structure Analysis QLC
0 0.1 0.2 0.3 0.4 0.5 0.6 0.7 0.8 0.9 10
500
1000
1500
2000
2500qnMCYT330pb − of
0 0.1 0.2 0.3 0.4 0.5 0.6 0.7 0.8 0.9 10
10
20
30
40
50
60
70qnFVC2002Db3 − of
(c) Orientation Flow Analysis QOF
0 0.1 0.2 0.3 0.4 0.5 0.6 0.7 0.8 0.9 10
500
1000
1500qnMCYT330pb − pow
0 0.1 0.2 0.3 0.4 0.5 0.6 0.7 0.8 0.9 10
5
10
15
20
25
30
35
40
45qnFVC2002Db3 − pow
(d) Radial Power Spectrum QPOW
Figure A.1: Comparison of quality score distributions for two different fingerprint databases.In both databases, samples were obtained using capacitive sensor. Higher quality scores canbe observed in the the MCYT330dp database [31] (left coloumn) than in the FVC2002 Db3database [26] (right coloumn) because the samples were collected under quality control.
60

Appendix B
CD Content
/doc The electronic version of this report in PDF file.
/fpquality Source files of methods for quality computation (MATLAB code).
/fputility Source files for utility computation (MATLAB code).
61


![VYSOKE´ UCˇENI´ TECHNICKE´ V BRNEˇ · 2016. 9. 29. · nejrøznìj„í alternativní klÆvesnice napł. Swype, SwiftKey, SlideIT slibující rychlej„í psaní textu [3]. Tyto](https://img.dokumen.tips/doc/110x75/60159e55b367c020ad356805/vysoke-uceni-technicke-v-brne-2016-9-29-nejrznja-alternativn.jpg)


![VYSOKE´ UCˇENI´ TECHNICKE´ V BRNEˇ › download › pdf › 44386625.pdfDrishti[1] byl vyvinut za œŁelem vizualizace CT dat, elektronovØ-mikroskopie a dal„ích. Hlavním](https://img.dokumen.tips/doc/110x75/60d0a87d3e9ee35e733de3b2/vysoke-uceni-technicke-v-brne-a-download-a-pdf-a-drishti1-byl.jpg)


![VYSOKE´ UCˇENI´ TECHNICKE´ V BRNEˇ - core.ac.uk · Tyto technologie se stÆvají standardem, ... tice se jako první vìnovali Kohno et al. [5], ... analýza rozdílu posunu](https://img.dokumen.tips/doc/110x75/5b98e3e509d3f2210c8d0236/vysoke-uceni-technicke-v-brne-coreacuk-tyto-technologie-se-stavaji.jpg)