Embed Size (px)
Citation preview

Vulnerable Supply Chains
Productivity CommissionInterim Report
March 2021
This interim report focuses on how disruptions to supply chains might affect Australians’ access to essential goods and services. To contribute to this study, please send a submission or brief comment before 30 April 2021.

© Commonwealth of Australia 2021
Except for the Commonwealth Coat of Arms and content supplied by third parties, this copyright work is
licensed under a Creative Commons Attribution 3.0 Australia licence. To view a copy of this licence, visit
http://creativecommons.org/licenses/by/3.0/au. In essence, you are free to copy, communicate and adapt the
work, as long as you attribute the work to the Productivity Commission (but not in any way that suggests the
Commission endorses you or your use) and abide by the other licence terms.
Use of the Commonwealth Coat of Arms
Terms of use for the Coat of Arms are available from the Department of the Prime Minister and Cabinet’s website:
www.pmc.gov.au/government/commonwealth-coat-arms
Third party copyright
Wherever a third party holds copyright in this material, the copyright remains with that party. Their permission
may be required to use the material, please contact them directly.
Attribution
This work should be attributed as follows, Source: Productivity Commission, Vulnerable Supply Chains,
Interim Report.
If you have adapted, modified or transformed this work in anyway, please use the following, Source: based on
Productivity Commission data, Vulnerable Supply Chains, Interim Report.
An appropriate reference for this publication is:
Productivity Commission 2021, Vulnerable Supply Chains, Interim Report, Canberra.
Publications enquiries
Media, Publications and Web, phone: (03) 9653 2244 or email: [email protected]
The Productivity Commission
The Productivity Commission is the Australian Government’s independent research and advisory
body on a range of economic, social and environmental issues affecting the welfare of Australians.
Its role, expressed most simply, is to help governments make better policies, in the long term
interest of the Australian community.
The Commission’s independence is underpinned by an Act of Parliament. Its processes and
outputs are open to public scrutiny and are driven by concern for the wellbeing of the community
as a whole.
Further information on the Productivity Commission can be obtained from the Commission’s
website (www.pc.gov.au).

TERMS OF REFERENCE
INTERIM REPORT
iii
Terms of reference
I, the Hon Josh Frydenberg MP, pursuant to Parts 2 and 4 of the Productivity Commission
Act 1998, hereby request that the Productivity Commission undertake a study into
Australia’s resilience to global supply chain disruptions.
Background
Australia’s experience with the COVID-19 pandemic has highlighted Australia’s potential
vulnerability to global supply chain disruptions. While Australia’s supply chains have held
up relatively well during the COVID-19 pandemic, future shocks to supply chains will likely
be different in nature.
Scope
The purpose of the study is to examine the nature and source of risks to the effective
functioning of the Australian economy and Australians’ wellbeing associated with
disruptions to global supply chains, identifying any significant vulnerabilities and possible
approaches to managing them.
In undertaking the study, the Commission should consider Australia’s part in global supply
chains as an importer and exporter, and:
• consider the factors that make supply chains vulnerable
• develop a framework for identifying supply chains that are vulnerable to the risk of
disruption and also critical to the effective functioning of the economy, national security
and Australians’ wellbeing
• use trade and other relevant data to identify supply chain vulnerabilities
• explore risk management strategies, including the roles of, and options for, government
and businesses to manage supply chain risks.
Process
The Productivity Commission should undertake appropriate consultation, and provide an
interim report focusing on Australia’s role as an importer in March 2021; and a final report
including Australia’s role as an exporter in late May 2021.
The Hon Josh Frydenberg MP
Treasurer
[Received 19 February 2021]

CONTENTS
INTERIM REPORT
v
Contents
Terms of reference iii
Preface vii
Abbreviations viii
Executive summary 1
Findings 7
1 About this study 11
1.1 Background to the study 11
1.2 What was the Commission asked to do? 13
1.3 How does this study relate to other reviews and
government initiatives? 14
2 Supply chains and risks 17
2.1 Supply chains are complex, and becoming more so 18
2.2 Supply chain vulnerabilities 24
3 A framework to identify vulnerable supply chains 31
3.1 The links between wellbeing and supply chains 32
3.2 The approach to identifying goods and services that are
vulnerable, essential and critical 34
4 Applying the framework to Australian imports 43
4.1 How important are imports to economic activity? 45
4.2 How vulnerable are Australian imports to disruption? 46
4.3 How reliant is the production of essential goods and
services on vulnerable imports? 56
4.4 Direct and indirect contribution of vulnerable imports to the
consumption of essential goods and services 65
4.5 Possible extensions to this work 67

vi VULNERABLE SUPPLY CHAINS
INTERIM REPORT
5 Supply chain risk management 69
5.1 A framework for managing risks 70
5.2 Understanding risk 73
5.3 Managing supply chain risks 78
5.4 Risk ownership and the role of government 86
A Consultation 105
B Case studies in vulnerability 107
B.1 Estimating global supply concentrations 107
B.2 Case studies 107
C Technical application of the analytical framework 113
C.1 Assessing import vulnerability 113
C.2 Assessing essential goods and services 122
Annex A: Data sources 126
Annex B: Classifications 128
D Import demand elasticities 131
D.1 What is elasticity of demand and why is it useful? 131
D.2 Estimating elasticities for chemicals 133
References 141

PREFACE INTERIM REPORT
vii
Preface
This interim report focuses on imports
In response to the terms of reference, the Commission has prepared an interim report that
focuses on how disruptions to imports might affect Australians’ access to essential goods
and services. The interim report develops a framework to identify risks that might affect
supply chains, and ultimately Australians’ wellbeing.
The final report will add material relating to exports
The final report will analyse disruptions to supply chains that can affect exports. These are
risks to the economy. There are two main sources of disruptions to exports: disruption to
upstream supply chains and disruption to downstream supply chains, including to market
access. The report will review risk management strategies to deal with these types of
disruptions.
Consultations
The Commission received final terms of reference on 19 February. As a result, consultation
for this interim report has been limited to workshops and bilateral meetings with relevant
Australian Government agencies.
To contribute to this study, please send a submission or brief comment before 30 April
2021.
Find out how to reach us at: www.pc.gov.au/inquiries/current/supply-chains

viii VULNERABLE SUPPLY CHAINS
INTERIM REPORT
Abbreviations
ABS Australian Bureau of Statistics
ACBPS Australian Customs and Border Protection Service
ACCC Australian Competition and Consumer Commission
AMGC Advanced Manufacturing Growth Centre
ANAO Australian National Audit Office
ANZSIC Australian New Zealand Standard Industrial Classification
BEC Broad Economic Classification
CIF Commercial invoice value, insurance costs, and freight
CSIRO Commonwealth Scientific and Industrial Research Organisation
DFAT Department of Foreign Affairs and Trade
DISER Department of Industry, Science, Energy and Resources
EU European Union
FOB Free on board
HHI Herfindahl Hirschman Index
HS Harmonized System
HTISC Harmonized Tariff Item Statistical Code
IFAM International Freight Assistance Mechanism
IOIG Input-Output Industry Groups
IOPC Input-Output Product Classification
IOPG Input-Output Product Group
JIT just-in-time
NMS National Medical Stockpile
NSW New South Wales
OPEC Organization of the Petroleum Exporting Countries
PPE Personal Protective Equipment
SA South Australia
SITC Standard International Trade Classification

ABBREVIATIONS
INTERIM REPORT
ix
SNA System of National Accounts
TGA Therapeutic Goods Administration
US United States
WCO World Customs Organization
WTO World Trade Organisation


EXECUTIVE SUMMARY
INTERIM REPORT
1
Executive summary
Australia’s supply chains proved generally resilient in response to the COVID-19 pandemic,
but the experience with COVID-19, following the devastating 2019-20 bushfires has
highlighted Australia’s potential vulnerability to supply chain disruptions. Panic buying of
some goods, notably personal protective equipment, and the imposition of export restrictions
on these products by some countries added a degree of urgency to the unfolding situation.
In this febrile environment, understanding the nature of possible disruptions received relatively
little attention, but it did prompt a host of views on Australia’s degree of self-sufficiency and
strident opinions on how best to manage the risks involved. The Economist Intelligence Unit,
a research advisory service, projected global value chains may become shorter, less
fragmented and more regional. Others were less equivocal. For example, Andrew Liveris, then
special adviser to the National COVID-19 Commission, said that: ‘Australia drank the
free-trade juice and decided that off-shoring was OK. Well, that era is gone … We’ve got to
now realise we’ve got to really look at onshoring key capabilities.’
Regardless of the response, managing the risks of supply chain disruptions — whatever
their origin — inescapably entails costs on businesses, consumers and governments. These
costs vary substantially and depend on the choice of mitigation strategy — stockpiling,
supplier diversification, contingent contracting, developing domestic capability, among
others. They also depend on the state of preparedness of firms and governments to assume
responsibility, and to make effective decisions, on the level and manner of risk
management to take.
The purpose of this study is to help further Australia’s preparedness to deal with possible global
supply chain disruptions. The report considers the factors that make supply chains vulnerable,
with a focus on the international linkages and dependencies from trade. Importantly, we have
developed and piloted a framework for identifying those supply chains and products that are
vulnerable to disruption and critical to the effective functioning of the economy, using imports
and production data. We then explore effective risk management strategies for governments and
businesses and provide policy guidance on the roles for governments.
Supply chains and risks
Supply chains are networks of firms participating in the process of transforming inputs into
final products that are delivered to consumers. Improvements in technology and trade
liberalisation have made it easier and cheaper to source many goods and services from
overseas. This has brought benefits from specialisation and economies of scale. It has also
lifted the complexity of supply chains — modern supply chains often rely on inputs from
2 VULNERABLE SUPPLY CHAINS
INTERIM REPORT
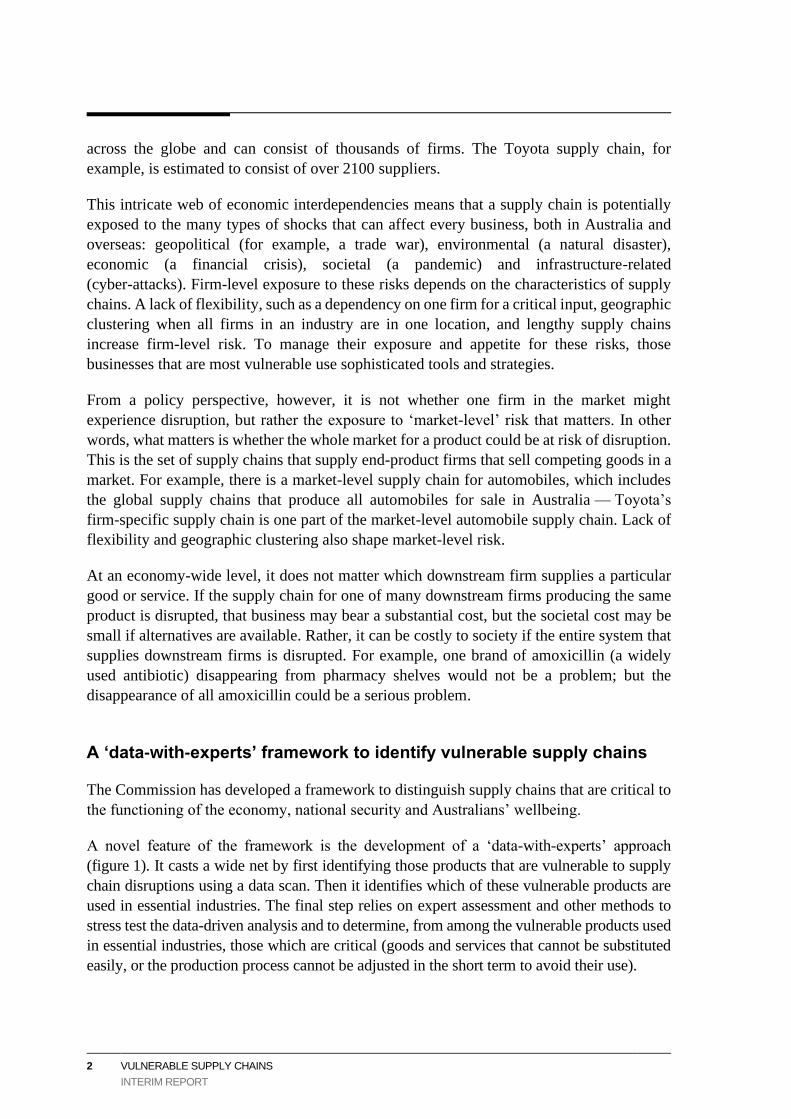
across the globe and can consist of thousands of firms. The Toyota supply chain, for
example, is estimated to consist of over 2100 suppliers.
This intricate web of economic interdependencies means that a supply chain is potentially
exposed to the many types of shocks that can affect every business, both in Australia and
overseas: geopolitical (for example, a trade war), environmental (a natural disaster),
economic (a financial crisis), societal (a pandemic) and infrastructure-related
(cyber-attacks). Firm-level exposure to these risks depends on the characteristics of supply
chains. A lack of flexibility, such as a dependency on one firm for a critical input, geographic
clustering when all firms in an industry are in one location, and lengthy supply chains
increase firm-level risk. To manage their exposure and appetite for these risks, those
businesses that are most vulnerable use sophisticated tools and strategies.
From a policy perspective, however, it is not whether one firm in the market might
experience disruption, but rather the exposure to ‘market-level’ risk that matters. In other
words, what matters is whether the whole market for a product could be at risk of disruption.
This is the set of supply chains that supply end-product firms that sell competing goods in a
market. For example, there is a market-level supply chain for automobiles, which includes
the global supply chains that produce all automobiles for sale in Australia — Toyota’s
firm-specific supply chain is one part of the market-level automobile supply chain. Lack of
flexibility and geographic clustering also shape market-level risk.
At an economy-wide level, it does not matter which downstream firm supplies a particular
good or service. If the supply chain for one of many downstream firms producing the same
product is disrupted, that business may bear a substantial cost, but the societal cost may be
small if alternatives are available. Rather, it can be costly to society if the entire system that
supplies downstream firms is disrupted. For example, one brand of amoxicillin (a widely
used antibiotic) disappearing from pharmacy shelves would not be a problem; but the
disappearance of all amoxicillin could be a serious problem.
A ‘data-with-experts’ framework to identify vulnerable supply chains
The Commission has developed a framework to distinguish supply chains that are critical to
the functioning of the economy, national security and Australians’ wellbeing.
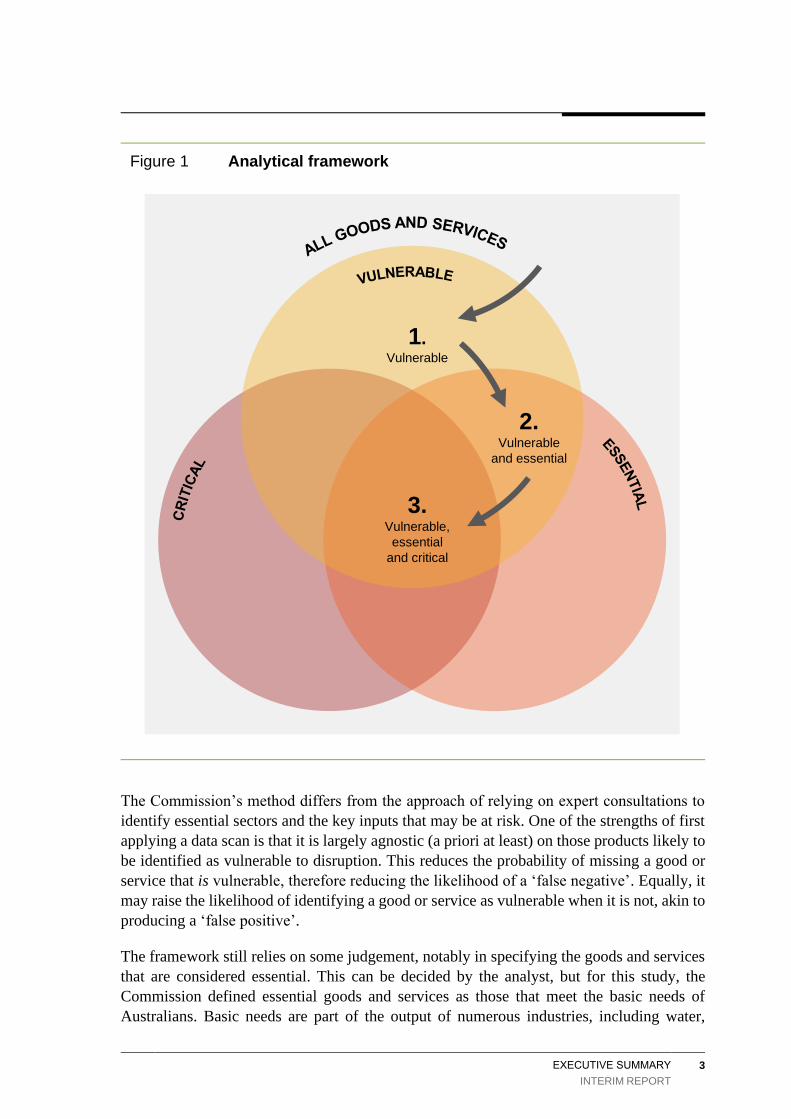
A novel feature of the framework is the development of a ‘data-with-experts’ approach
(figure 1). It casts a wide net by first identifying those products that are vulnerable to supply
chain disruptions using a data scan. Then it identifies which of these vulnerable products are
used in essential industries. The final step relies on expert assessment and other methods to
stress test the data-driven analysis and to determine, from among the vulnerable products used
in essential industries, those which are critical (goods and services that cannot be substituted
easily, or the production process cannot be adjusted in the short term to avoid their use).
EXECUTIVE SUMMARY INTERIM REPORT
3
Figure 1 Analytical framework
The Commission’s method differs from the approach of relying on expert consultations to
identify essential sectors and the key inputs that may be at risk. One of the strengths of first
applying a data scan is that it is largely agnostic (a priori at least) on those products likely to
be identified as vulnerable to disruption. This reduces the probability of missing a good or
service that is vulnerable, therefore reducing the likelihood of a ‘false negative’. Equally, it
may raise the likelihood of identifying a good or service as vulnerable when it is not, akin to
producing a ‘false positive’.
The framework still relies on some judgement, notably in specifying the goods and services
that are considered essential. This can be decided by the analyst, but for this study, the
Commission defined essential goods and services as those that meet the basic needs of
Australians. Basic needs are part of the output of numerous industries, including water,
1.Vulnerable
2. Vulnerable
and essential
3. Vulnerable,
essential
and critical

4 VULNERABLE SUPPLY CHAINS
INTERIM REPORT
health, communications, energy, logistics, finance, and government. Food, while essential,
is excluded from the analysis because Australia is a major and diversified producer of food.
While food products may have vulnerable supply chains, food as a category is much less so.
Another area of judgment is the time frame of analysis for assessing the economic impacts
of disruption. We have focused on severe short-term (six-month) supply chain disruptions,
because in the long run there is greater capacity to adjust and adapt to shocks.
Testing the framework with imports data
The framework developed by the Commission was piloted with Australian imports and
global trade data to assess import vulnerability.
High-level trade statistics illustrate imports as a key source of supply chain vulnerability.
Australia imported 5950 different product aggregates in 2016-17 with a combined value of
A$272 billion, equivalent to around 16 per cent of gross national income. These imports
came from 223 countries, although, the majority by value were from the five largest
suppliers — China, the United States, Japan, Thailand and Germany. The main imports by
value were motor vehicles and parts; electrical, optical and other specialised equipment; fuel;
pharmaceuticals; and chemicals.
As a first step to operationalise the framework and identify which imported products are
vulnerable, filters are applied to the trade data. The first filter ascertains whether the market
for each product that Australia imports is highly concentrated (when the main supplying
country accounts for over 80 per cent of imports of a product). The second filter determines
whether there are limited alternative suppliers that Australia could access in the event of a
disruption (considered to be when the main supplying country globally accounts for over
50 per cent of global exports). The third filter determines whether Australia sourced its
concentrated imports from the main global supplier in a concentrated market.
The results of these filters suggest that one-in-five products (1327 products worth
A$30 billion) imported by Australia is highly concentrated. However, the global trade data
(filter 2) indicate that for many of these products alternative sources of supply exist and
could be utilised should the need arise. Once all three filters are applied, the result is that
one-in-twenty Australian imports (292 products worth about A$20 billion) are identified as
originating from concentrated sources of global supply and, by this combination of criteria,
might be vulnerable. Two-in-three of these vulnerable imports came from China.
The list of vulnerable imports arising from the broad-based data scan reveal many products
that, while having high import concentrations, are unlikely to be essential — either directly
or as an input into the production of essential goods and services — for the material
wellbeing of Australians. Examples of such products include festive decorations,
Champagne, clothing items, and toys.

EXECUTIVE SUMMARY
INTERIM REPORT
5
The second step in operationalising the framework involves identifying whether any
vulnerable imports were used to produce essential goods and services. This involves linking
trade and production data that relate to a group of essential industries. The essential
industries are mainly service producing industries that primarily use locally sourced services
in their production; vulnerable imports constitute a small fraction of all the inputs into
essential goods and services. Further, fewer than half of all vulnerable imports are used in
essential industries.
Taken together, the analysis offers suggestive — but not conclusive — evidence that many
essential goods and services do not depend critically on vulnerable imported inputs. The
main supply chain disruption risks that could be problematic arise from the reliance on
concentrated imports of some basic chemicals, or some personal protective equipment.
These results have limitations, mainly stemming from a lack of product detail and difficulties
in linking trade and production data. This is where specialised expertise is vital in stress
testing the data-led approach. In addition, expert knowledge is required to identify whether
an import is technically critical in the sense that its absence would interrupt the supply of an
essential good or service. While not a substitute for expert knowledge, the Commission
tested whether estimating demand elasticities for a selection of chemicals could corroborate
the findings gleaned from the ‘data-with-experts’ approach. This can be informative, but
data limitations make it difficult to apply the estimation approach systematically.
How is risk managed and is there a role for government?
Efficient supply chain risk management balances the trade-off between the costs of a
disruption — a large increase in the cost of purchasing goods and services upstream — with
the opportunity cost of investing in risk management. To make effective decisions on the
level of action to take, firms need to understand the nature of the potential disruption
(likelihood, size etc.), and its potential impact to their supply chains. The analytical
framework developed for this study is a tool that can be used for that purpose.
However, it is not straightforward to assimilate the information. Supply chains can be long,
complex, and opaque, and data on a firm’s supply chain can be difficult to obtain. Biases can
also affect the decisions of firms to invest in risk management. For example, because of their
recent experience with the COVID-19 pandemic, firms may overinvest in strategies that seek
to mitigate this risk, when other risks may be more probable and imminent.
Notwithstanding these challenges, risks are best managed by those who have direct
incentives to mitigate against them, and typically this means firms. Similarly, government
has a responsibility to manage risks in supply chains for which they purchase and deliver
goods and services directly. Key mitigation strategies used to prepare for supply chain risks
include: no action, stockpiling, supplier diversification, contingent contracting, and
developing domestic capability. Several strategies are likely to be required to mitigate the
risks that firms face.

6 VULNERABLE SUPPLY CHAINS
INTERIM REPORT
There can also be circumstances where there is a rationale for government to intervene in
market risk management. For example, intervention may be justified where risk management
by a firm is hampered by regulation, or there is a divergence in risk appetite between firms and
the community. A divergence could come about if, for instance, disruptions have ‘contagion’
effects, or might affect national security. In these cases, government could consider options
ranging from providing information about risks that they are best informed about, to taking
more direct ownership of risk management (such as maintaining government stockpiles,
mandating or subsidising private stockpiles, or maintaining domestic production capacity).
That said, government intervention may crowd out private investment in risk management,
imposing higher costs on the community. For example, the costs of maintaining a local
capability could outweigh many times the cost of other strategies. Further, onshoring could
still rely on a critical input (such as crude oil), or Australia might lack the expertise to
produce locally and be competitive. Even when firms consider onshoring, they often
maintain several locations globally to diversify risks — and control costs. Hence, even where
an in-principle case for government intervention exists, any case for intervention needs to
demonstrate that the benefits of intervention outweigh its costs.
One area where governments could focus their efforts is on ensuring firms do not face
unnecessary constraints on how they plan and respond to disruptions. A stable and
rules-based trading environment, for example, facilitates firms’ ability to diversify their
suppliers in preparation for, and their ability to find alternative suppliers in response to, a
supply chain disruption. A responsive regulatory environment is another example.
Lastly, it is important that government periodically reviews and updates the list of goods and
services that are vulnerable to supply disruptions and essential for the wellbeing of
Australians, as it is likely to change over time. The frameworks developed in this study
provide a means to repeat such reviews, and ideally reviews would begin with industry
consultation. While time consuming, this approach is recommended to better understand
where vulnerabilities will be visible in data, and thereby inform the use or gathering of data
best suited to identifying vulnerable, essential, and critical goods.

FINDINGS
INTERIM REPORT
7
Findings
Applying the framework
FINDING 4.1
One-in-five products imported by Australia is considered highly concentrated; however,
the global trade data suggest that for many of these products alternative sources of
supply exist and could be utilised should the need arise. The result is that one-in-twenty
Australian imports might be vulnerable to concentrated sources of global supply.
FINDING 4.2
Most vulnerable imports are classified as either consumption or intermediate goods, with
fewer capital goods. But by value, capital goods typically form the highest share of
vulnerable imports. Though important in the long run, disruptions to the supply of capital
goods that might appear vulnerable are unlikely to affect wellbeing in the short run.
FINDING 4.3
For many products, the main supplier of vulnerable imports is China, accounting for
roughly two-thirds of those products. Notwithstanding this, the main source of supply
varies by product.
FINDING 4.4
The list of vulnerable imports consists of a variety of products that are used in production
or consumption, but many of them are not essential to the wellbeing of Australians.
FINDING 4.5
Vulnerable imports are a small share of the goods used in essential industries, by value.
This is suggestive, but not conclusive, evidence that vulnerable imports may not be
critical to the production of essential goods and services.
8 VULNERABLE SUPPLY CHAINS
INTERIM REPORT
FINDING 4.6
Since the narrow definition of essential industries used in this study comprises mainly
service producing industries, locally-sourced services are primarily used in their
production, rather than locally-sourced or imported goods. Consequently, vulnerable
imports are a small share in their production costs. Furthermore, many of the vulnerable
products identified, such as textile products, are unlikely to be critical to the production
of these services.
Vulnerable imports that are inputs into the goods-producing industries of petrol refining
and medicine manufacturing are more likely to be critical.
FINDING 4.7
Combining imports and production data suggests that the supply of essential goods and
services in Australia is not highly susceptible to a short-term disruption to the supply of
imported goods. Vulnerable imports represent a small fraction of the value of essential
goods and services consumed by Australians — whether that consumption be direct
(final goods, A$20 million out of total consumption of essential goods and services of
A$593 billion) or indirect (as inputs into Australian production, A$2.7 billion). But this
evidence is not conclusive and industry experts are required to determine criticality.
Risk management and the role of government
FINDING 5.1
Effective risk management requires a good understanding of a firm’s risks to ensure that
the net benefits of any investment to mitigate the costs of disruptions is matched by their
potential effects and costs.
Supply chain risk management is similar to buying insurance for any other types of risk.
In effect, a firm pays an insurance premium upfront to invest in a range of strategies
such as, stockpiling, supplier diversification, contingent contracting, and domestic
capability, to insure itself against potentially large cost increases if a disruption occurs.
The focus of these risk management strategies is on the physical restoration of supply
chains, rather than taking out insurance for a pure financial compensation in the event
of a disruption.

FINDINGS
INTERIM REPORT
9
FINDING 5.2
Risks are best managed by those who have direct incentives to mitigate against them.
Firms are primarily responsible for managing risks in their supply chain.
Governments have responsibility, like any firm, to manage risks in supply chains for
which they purchase and/or deliver goods and services directly, particularly when these
are essential goods and services.
Each strategy has costs and some will perform better under different types of disruptions
and contexts. Firms will employ a range of strategies to effectively manage risk.
FINDING 5.3
There are conditions where government intervention in private sector risk management
may be justified — specifically, if society’s tolerance for a residual risk is lower than the
residual risk that results from the market. Another situation is where government or other
impediments prevent firms from effectively managing their risks.
That said government intervention could crowd out private investment in risk management.
The net benefit of any intervention would have to outweigh the possible costs.
The Australian Government also has responsibility for maintaining and promoting a
respected and rules-based international trading system which promotes low-cost trading
and firms’ ability to insure themselves and respond to disruption. And all levels of
government have responsibility for ensuring regulations are fit for purpose, including
making temporary changes that let firms adjust to temporary disruptions.


ABOUT THIS STUDY
INTERIM REPORT
11
1 About this study
1.1 Background to the study
The COVID-19 pandemic raised concerns about Australia’s ability to supply goods and
services to meet Australians’ needs. Fear of shortages led to panic buying across the nation.
Australia was not unique in this respect, with most countries manifesting concerns about
how their reliance on imports would jeopardise their ability to meet their population’s needs
during the COVID-19 pandemic.
The COVID-19 pandemic also highlighted how many countries rely on China for many
goods and services. The lockdown in Wuhan led to shortages for some goods. One of the
biggest shortages was in face masks (box 1.1).
Box 1.1 Face masks and the COVID-19 pandemic
The COVID-19 pandemic led to a surge in the global demand for face masks. This increase in
demand and limitations on expanding supply, due to interruptions in production in Wuhan and
limited exports out of China, led to a global shortage of face masks. That said, it was not face
masks that were in shortage, but an input into their manufacturing — non-woven polypropylene,
or ‘meltblown’. Only a few firms produce meltblown due to the high initial investment required.
This high initial investment meant that firms could not easily or quickly start producing meltblown.
At the beginning of the pandemic, the Chinese government compulsorily purchased all locally
produced masks in January and February, but exports resumed in March. From January to March
2020, Chinese output of face masks had expanded by a factor of 10. An OECD study estimated
that the demand surge was a much larger contributor to shortages than any export restrictions.
Source: OECD (2020).
The global shortage in face masks and other goods produced abroad, combined with
increased awareness and sensitivity to risk, has led some to argue that Australia should
develop a stronger domestic manufacturing capability (box 1.2).

12 VULNERABLE SUPPLY CHAINS
INTERIM REPORT
Box 1.2 The COVID-19 pandemic prompted calls for increased onshoring — but not everyone agrees
Andrew Liveris, former special adviser to the National COVID-19 Commission, is a strong
advocate for onshoring:
Australia drank the free-trade juice and decided that off-shoring was OK. Well, that era is gone … We’ve
got to now realise we’ve got to really look at on-shoring key capabilities. (Greber 2020)
Similar sentiments were expressed by the Secretary of the Department of Home Affairs:
… I think COVID has created a circumstance where we need to seriously think about both domestic
manufacturing in limited and targeted ways, sovereign capability and, yes, stockpiles for those
geo-strategic and geo-economic reasons. (Royal Commission into National Natural Disaster
Arrangements 2020b, p. 2739)
In a report detailing how the Australian manufacturing sector could contribute to the Australian
economy in the future, Stanford (2020, pp. 5–6) said:
… this is an opportune moment to launch a new, multi-faceted effort to revitalise Australian
manufacturing:
• There is new public awareness of the importance of domestic manufacturing capability.
• Previous global supply chains have been disrupted by health measures, trade policy interventions,
and other factors, forcing us to re-learn how to produce more things at home.
• The depth and speed of the economic contraction associated with the COVID-19 pandemic requires
an ambitious strategy to rebuild national production and employment after the health emergency, and
manufacturing could play a central role in that effort.
• Global economic adjustments, including declines in resource prices and the exchange value of the
Australian currency, have enhanced the cost-competitiveness of Australian manufacturing.
• Continuing revolution in the technology and economics of energy is creating a new source of
competitive advantage for Australian manufacturing: namely, our abundant resources of renewable
energy, unmatched in the industrialised world.
But not everyone is calling for increased onshoring. Former Minister Craig Emerson argued that
when thinking about improving the Australian economy, there are a few reform ideas worth
considering and others that are not worth considering. The latter include:
… tariffs to protect so-called strategic industries which, by the time the rent-seekers are finished, would
be every industry under the sun. (2020b)
He also argued that:
Trump-like tariff shelters for ‘strategic industries’ would shrink the economy and make genuine reform
impossible to achieve. (2020a)
John Denton, the Australian Secretary-General of the International Chamber of Commerce argued:
This policy distortion [increased protectionism], coupled with a resurgent discussion on industrial
self-reliance, will if unchecked dramatically alter the landscape of global trade for the worse. It will lead
to overall higher prices, reduced production and increased product scarcity. (2020)
Other countries are considering onshoring some manufacturing processes in response to the
COVID-19 pandemic. Beyond that, firms and governments are looking to diversify
production processes across regions and international borders.

ABOUT THIS STUDY
INTERIM REPORT
13
Governments and firms responded to the COVID-19 pandemic in a variety of ways — some
countries prevented the exports of goods and prioritised their own consumption. In Australia,
some firms pivoted their production toward goods and services in shortage (box 1.3).
Box 1.3 Some Australian businesses were nimble in responding to shortages
Some Australian businesses increased their production of personal protective equipment and other
products required to manage the COVID-19 pandemic, or pivoted production towards these products.
Domestic production was important in resolving shortages in hand sanitiser, but played a much smaller
role in personal protective equipment.
Company Usual products COVID-19 products
Free 3D Hands Prosthetic hands for children with
disabilities
Face shields for healthcare workers
Detmold Food packaging Surgical masks
Textor Materials for nappies, sanitary pads
and baby wipes
Personal protective equipment
Ford Australia Automotive Face shields for healthcare workers
Axiom Precision
Manufacturing
Components, tooling and inspection
services for defence, aerospace and
other industries
Face shields for healthcare workers
Fella Hamilton Women’s clothing Face masks, scrubs and gowns
Four Pillars,
Archie Rose
Distilling Co, Cape
Byron Distillery
Gin Hand sanitiser
Sources: Barndon (2020); Business News Australia (2020); DISER (2020c); Keating (2020); Knaus (2020);
Marshall (2020); Masige (2020).
1.2 What was the Commission asked to do?
Against this backdrop, the Australian Government asked the Productivity Commission to
examine the nature and source of risks to the effective functioning of the Australian economy
and Australians’ wellbeing associated with disruptions to global supply chains, identifying
any significant vulnerabilities and possible approaches to managing them.
The terms of reference asked the Commission to consider Australia’s part in global supply
chains as an importer and exporter, and:
• consider the factors that make supply chains vulnerable

14 VULNERABLE SUPPLY CHAINS
INTERIM REPORT
• develop a framework for identifying supply chains that are vulnerable to the risk of
disruption and also critical to the effective functioning of the economy, national security
and Australians’ wellbeing
• use trade and other relevant data to identify supply chain vulnerabilities
• explore risk management strategies, including the roles of, and options for, government
and businesses to manage supply chain risks.
The project has focused on a conceptual framework and data analysis, consisting of three
main outputs:
• an analytical framework designed to identify goods and services that are critical to the
functioning of the economy and to wellbeing. Part of this framework involves an outline
of a methodology and process that could be used to identify goods and services that are
vulnerable, essential and critical
– the project outlines both data-driven and consultative approaches to identifying inputs
that are critical to the functioning of the economy and to wellbeing (The consultative
approach requires significant input from industry experts.)
• data analysis that operationalises the framework to identify imports of goods that might
be vulnerable
• possible strategies involved in managing risks at the national level, rather than strategies
that might be applied to specific firm-level supply chains or disruptions.
The final report will include additional data analysis to identify export markets that might
be vulnerable to short-term threats such as reduced demand due to natural disasters,
geopolitical reasons, or transport disruptions.
Due to security concerns and access to data, the report does not comment or analyse supply
chains that relate to defence activities, beyond what is available in ABS data. That said, many
of the principles discussed are likely to be transferrable to any sector of the economy.
1.3 How does this study relate to other reviews and
government initiatives?
This study is designed to complement a number of current initiatives and studies:
• the Department of Industry, Science, Energy and Resources’ Modern Manufacturing
Strategy, which seeks to make supply chains more resilient to external shocks
(DISER 2020d)
• Department of Home Affairs’ Critical Technology Supply Chains Principles, which seek
to assist government and businesses in making decisions about their suppliers and
transparency of their own products (DoHA 2020b, p. 2).
ABOUT THIS STUDY
INTERIM REPORT
15
The Commission has drawn on evidence from Australian and international sources and is
based entirely on publicly available information. Recent Australian-based work that
complements this report, includes:
• reviews by the Australian Competition and Consumer Commission’s Agricultural Unit
such as the Cattle and beef market study, the Wine grape market study, and the Perishable
agricultural goods inquiry (ACCC 2017, 2019, 2020b)
• the Inquiry into National Freight and Supply Chain Priorities (DIRDC 2018)
• the Royal Commission into National Natural Disaster Arrangements (Royal Commission
into National Natural Disaster Arrangements 2020a)
• the Critical Infrastructure Resilience Strategy: Plan and other resources from the Critical
Infrastructure Centre (DoHA 2015)
• Profiling Australia’s Vulnerability by the Department of Home Affairs (DoHA 2018)
• Guidance for Strategic Decisions on Climate and Disaster Risk from the Australian
Institute for Disaster Resilience (AIDR 2021).


SUPPLY CHAINS AND RISKS
INTERIM REPORT
17
2 Supply chains and risks
Key points
• Supply chains are often complex networks across many firms and economies: they are not
always a simple, single flow of goods, and can cross many borders across the globe. This
increases the complexity of supply chains and decreases their transparency. Market-level
supply chains (comprised of all the firms that supply similar goods) are even more complex.
• Improvements in technology and trade liberalisation have made it easier and cheaper to
source goods and services from overseas. Increases in global trade bring large benefits such
as cheaper and greater choice of goods and services for consumers. Industries also gain from
specialisation and economies of scale.
• Supply chains are subject to many types of shocks, including:
− geopolitical shocks, such as a trade war that might affect regional or global trade
− environmental shocks, such as the 2019–2020 bushfires in Australia that affected transport
and communication
− economic shocks, such as the 1973 oil crisis that changed how firms and households use
energy
− societal shocks, such as labour disputes or pandemics that affect labour supply and
demand
− infrastructure-related shocks, such as cyberattacks or disruptions at a port or along a road.
• Characteristics of supply chains that increase firm-level risk include:
− lack of flexibility (dependency on one firm for a critical input)
− geographic clustering (if all the firms in an industry are in one location)
− long supply chains (how many times goods change hands and countries).
• Policymakers are primarily concerned with market-level risk, rather than firm-level risk.
Market-level risk is the risk that the supply of a whole category of goods is disrupted. A lack of
flexibility and geographic clustering contribute to market-level risk.
• Risks have two components: the probability of an event occurring; and the effects of the event.
Firms often underestimate the probability of negative events, and recent events tend to lead
firms to overestimate the probability of them re-occurring. The effects of an event are
summarised as changes in costs — an interruption in supply is equivalent to a very large or
infinite increase in its cost.
• Risk management strategies aim to reduce the probability of an event occurring or the effects
and cost of an event, including the costs of any recovery.
In 2020, bushfires and the COVID-19 pandemic tested Australia’s supply chains. But there
are many other scenarios that could disrupt Australia’s supply chains, ranging from
economic events, such as a global economic financial crisis or a trade war, to domestic

18 VULNERABLE SUPPLY CHAINS
INTERIM REPORT
events, such as the recent labour dispute in the port of Port Botany or natural disasters such
as bushfires and floods.
This chapter describes concepts in supply chain analysis and how characteristics of supply
chains make them susceptible to risks and disruptions. The chapter also introduces the notion
of market-level risk.
2.1 Supply chains are complex, and becoming more so
Supply ‘chains’ are actually networks
A supply chain is the process of transforming raw materials into goods that are delivered to
final users, whether industries or consumers (figure 2.1). Although the concept of a supply
chain is thought of mainly in the context of manufacturing, all industries, including services
such as utilities, construction and hospitals, rely on networks of suppliers.
The term ‘supply chain’ implies a movement of physical goods along a simple path from the
supplier to the user (figure 2.1). The reality is that most supply chains are networks of firms
(Christopher 2018, p. 6) (figure 2.2, box 2.1). One reason for this is that several different
types of inputs are combined in one stage of the production process; for example, making
steel involves combining iron ore, coal and limestone. The other reason is that a firm might
source the same input from several different firms (possibly for risk mitigation).
Box 2.1 Supply chain terminology
• Node — a node represents a stage in the production process occurring in one firm, in one
geographic location. For example, if parts are manufactured in a plant and then assembled
with other parts, these processes are all represented by the same node.
• Link — a link connects two nodes. It represents the process of transporting the input from one
production site to another. For example, a link between a factory in Malaysia to an assembly
plant in Melbourne might involve driving the part to the port, shipping through the Port of
Singapore and the Port of Melbourne and rail transport to the assembly plant.
• Downstream/upstream — upstream refers to the part of the supply chain that is further from
the end user. Downstream is the part of the supply chain that is closer to the end user,
including the final distributor or retailer.
• Length — the length of a supply chain refers to the number of nodes that raw materials pass
through before reaching customers.
There can also be multiple tiers in a supply chain. For example, a ‘tier 1’ supplier might
supply Toyota directly, while a tier 2 supplier supplies a tier 1 supplier, and so on.

SUPPLY CHAINS AND RISKS
INTERIM REPORT
19
Figure 2.1 From raw materials to the user
Supply chains can be very complex. Modern supply chains rely on inputs from across the
globe, and can consist of thousands of firms. The Toyota supply chain is estimated to consist
of 2192 suppliers (Kito et al. 2014, p. 7). Some supply chains are even larger: General
Motors had 35 000 suppliers by 1986 (Milgrom and Roberts 1992, p. 566).
Even more complex are market-level supply chains (figure 2.2). This is the set of supply chains
that supply a set of end product firms that sell competing end products in a market (firms U,
V and W in figure 2.2). For example, there is a market-level supply chain for automobiles (the
set of end product firms), which includes the global supply chains that produce all automobiles
for sale in Australia. Some firms might have exclusive suppliers and exclusive dealers, keeping
their supply chain separate from that of other firms. But more often in today’s economy, firms
share suppliers. For example, Dell and Lenovo are estimated to share more than 2250 tier 1
and tier 2 suppliers (Lund et al. 2020, p. 9). A disruption among any of these suppliers can
affect the supply of the end products of both brands.
From an economy-wide perspective, it does not matter which downstream firm supplies a
particular good or service. And if one brand is not available, the societal cost is not serious.
So if the supply chain for a particular downstream firm is disrupted, this is not a serious cost
to society; rather, it is costly if the entire system that supplies downstream firms is disrupted.
For example, one brand of paracetamol disappearing from pharmacy shelves would not be a
Supplier
Manufacturer
Distributor
User
Product flowsInformation flows

20 VULNERABLE SUPPLY CHAINS
INTERIM REPORT
problem; but the absence of all brands of paracetamol would be a significant problem for
some health conditions.
Figure 2.2 Market-level supply chain
Note: Some firms can supply to firms within their own tier, and in tiers before their own. Suppliers in each
tier may also supply firms outside of the supply chain. A supply chain is not always a simple flow of goods;
for example, M in tier 2 supplies firm S in tier 1, but also supplies firm N in tier 2. Therefore, a disruption to
firm M in tier 2 not only tier 1, but also tier 2.
Data source: based on a firm-level supply chain from Chandra and Kamrani (2004, p. 573).
Other inputs to a supply chain
Supply chains are more than just intermediate goods and have other key inputs into
production, any of which could be disrupted. Components of supply chains include:
• labour:
– a firm’s workforce can be very diverse and more or less substitutable. For example,
a pharmaceutical company might employ many technical assistants who might be
easily substitutable, and researchers with specialised skills who are not easily
A B C D Tier 3 (raw material suppliers)E F G H I
Tier 2 suppliersJ K L M N O
Tier 1 suppliersQ R S
Customers
Manufacturer(Toyota, Volvo and
BMW for example)V
DistributorsX Y Z
U W
P T

SUPPLY CHAINS AND RISKS
INTERIM REPORT
21
substitutable. Global transport, a key part of supply chains, relies on a large, relatively
low-skilled workforce of drivers, but also on more skilled workers such as air and
marine pilots and logisticians and on a few workers with highly specialised skills,
such as helicopter pilots who ferry marine pilots to bulk carriers
– customer support and administrative workers may be working in different locations
to where goods are produced. Thus, for example, a lockdown in the Philippines could
disrupt the functioning of an automobile dealership in Sydney, if their back-office
functions take place in the Philippines
• services (produced from labour and other inputs), such as data processing and storage
services, accounting and back-office services for financial institutions and
communications, and call centre and other client services
• domestic and imported goods including:
– raw materials, such as iron ore
– intermediate goods, such as iron, steel, fertiliser, agrochemicals and seeds,
manufactured goods and other inputs
– final goods that have been produced from intermediate goods, and then are shipped
to retailers and finally reach customers
• capital goods such as machinery
• logistics
• infrastructure, such as buildings, telecommunications, electricity, and road and rail
networks. Infrastructure is crucial for both production at each node, and transporting
goods and services to customers (adapted from WBCSD (2015, p. 9)).
If there is a shortage of any of these components, then most firms in the industry are likely
to be vulnerable to a disruption.
How trade and technology are transforming supply chains
Global trade has increased steadily over the last three decades (figure 2.3). And since the
1990s, the share of inputs (by value added) that cross international borders has greatly
increased (Timmer et al. 2014, p. 100). For example, the iPhone X is assembled in Shenzen,
China, with inputs sourced from Germany, the United States, Switzerland, and Japan
(figure 2.4) (Costello 2020). That said, after 2008, the time of the global financial crisis, the
growth in trade has slowed (figure 2.3).

22 VULNERABLE SUPPLY CHAINS
INTERIM REPORT
Figure 2.3 Trade has grown over the last three decades
World exports of goods and services, as a percentage of GDP, 1988-2018
Data source: World Integrated Trade Solution (World Experts of goods and services, in % of GDP, 1988–2018).
Figure 2.4 The iPhone uses components from across the globe
a Supplier locations are where each firm is based. They may have production sites across many other countries.
Data source: Costello (2020).
Exports of goods and services
15
20
25
30
35
1988 1993 1998 2003 2008 2013 2018
Pe
r c
en
t o
f G
DP
USA: Design,
glass screen,
Wi-Fi,
audio chipsChina:
Battery
Japan: Camera,
compass, LCD
screen
South Korea:
Battery,
LCD Screen
Switzerland:
Gyroscope
Germany:
Accelerometer
SUPPLY CHAINS AND RISKS
INTERIM REPORT
23
There are several forces acting on these developments: including declines in tariffs, quotas
and other trade restrictions, driven by trade agreements between groups of countries
(Krugman 1995, pp. 337–341).
Another cause is technological improvements in transportation and logistics that have
resulted in cheap, fast and reliable transport, particularly containerisation. Improvements in
computer systems and telecommunications have also led to large increases in services trade,
such as financial services and customer support. Outsourcing these activities to overseas
firms has become gradually more feasible (Krugman 1995, pp. 341–343; McKinsey &
Company 2019, p. 34; Phillips 2014).
Finally, improvements in many technologies, both physical and managerial, have increased
the reliability of supply chains and reduced delays and the amount of inventory that firms
hold to keep production processes going. (In the extreme, these are just-in-time (JIT)
production processes, where inventory is at an absolute minimum.) These improvements
mean that a product can be moved across manufacturing sites several times, and even across
countries, without too much time or expense. As a result, supply chains have been getting
‘longer’: a product will be transformed in several different locations (which may be in
different countries) before the product reaches customers. That said, supply chains seem to
have shrunk since the global financial crisis (McKinsey & Company 2019, p. 36).
Increases in global trade bring large benefits. A 2018 study argues that trade has strong
dynamic effects on competition, which increases the purchasing power of consumers,
reallocates resources toward more productive firms and encourages innovation (Impullitti
and Licandro 2018b, p. 221). Conducting simulations based on data for the US economy,
the authors conclude that:
Due to the combination of these competition, selection and innovation responses to trade, the
present value of long-run per-capita consumption (our measure of welfare) under trade is 50%
higher than in autarky. (Impullitti and Licandro 2018a)
Trade contributes so much to income because each country has its own efficiencies and
inefficiencies, and each country has abundant and scarce resources. Trade allows countries
to specialise in producing the goods and services best suited to their resources and their
capabilities. For example, India has an abundance of workers who are fluent in English, and
faces some regulatory constraints in manufacturing, hence the development of its IT industry
(Fernandes and Pakes 2009, p. 143; Pack 2009, pp. 66–68). The result is cheaper goods and
services for consumers, and higher per capita income from exporting valuable goods and
services. The expansion of trade with China, India and other countries in Asia has raised
average income in both these and in Western countries (Krugman 2019).
Another benefit of trade is that countries gain from specialisation and economies of scale.
By specialising in some goods and services, and producing for more than just their own
country, firms can produce large quantities and become more efficient. And firms in the
same industry tend to locate close together, which allows firms to have the same access to
industry-relevant infrastructure, a specialised workforce and specialised suppliers; this is

24 VULNERABLE SUPPLY CHAINS
INTERIM REPORT
known as an industry cluster. Importantly, proximity helps firms share knowledge and drives
innovation (Roberts 2018). An example of the benefits of industry clusters is the
technological advancements coming from the Silicon Valley, or the highly efficient
automobile industry in Germany. Much of the gains from trade from the 1960s to the 1980s
were from wealthy industrialised countries trading more with each other, achieving efficient
scale and developing industry clusters (Leigh 2017, pp. 44–46).
At the same time, commentators have questioned whether long supply chains that cross
international borders create too many vulnerabilities. A failure anywhere along a supply
chain can jeopardise final output. And if most firms rely on one industry cluster for their
supply, because it is the lowest-cost or highest-quality source of supply, a disaster in that
location could jeopardise everyone’s supply. For example, Wuhan, the epicentre of China’s
COVID-19 lockdown, is the world’s largest producer of fibre optics (Clarke 2020).
2.2 Supply chain vulnerabilities
There is no consensus on how to classify supply chain risks, partly because of how complex
risks are. However, some categorisation is useful, for understanding which risks threaten the
functioning of a specific firm’s supply chain, and which risks threaten the entire market.
Risk can be categorised as internal or external. Internal risks can be broken down into which
internal processes are affected; such as supply, manufacturing, transportation, financial and
information (Ho et al. 2015, pp. 5034–5035). External risks are any outside events that
impinge on the functioning of the firm’s supply chain.
All internal processes within a firm face risks of disruptions and poor performance. For
example, a breakdown in an important machine might disrupt the manufacturing process, or
a fault in the accounting software used might disrupt financial processes. Negotiations with
a labour union could break down, or the firm could face delays when seeking to replace
workers with unusual or different skill sets (specialist repair people, for example, or
scientists). Quality control could fail and lead to faulty or dangerous products, causing
serious reputational damage to the firm.
Categorising external supply chain risks
The following external risk categories have been adopted as they cover sources of risk
identified in the literature:
• geopolitical
• environmental
• economic
• societal
• infrastructure-related (Ho et al. 2015, p. 5039; WEF 2020, pp. 86–87).

SUPPLY CHAINS AND RISKS
INTERIM REPORT
25
Geopolitical risks include trade wars, armed and other types of conflict, acts of terrorism and
failures of political governance (WEF 2020, p. 87). There are a number of geopolitical risks
facing the global economy and Australia, including: a trade war between China and the
United States; Brexit; and an escalation of trade tensions between Australia and China
(Alicke and Strigel 2020).
Environmental risks include natural disasters and weather events. Examples of significant
natural disasters that have caused disruptions to supply chains, include:
• a volcanic eruption in Iceland in 2010 that grounded planes across large parts of Europe
for nearly a month causing upheaval in supply chains across Europe and beyond
(Choi 2012)
• an earthquake and tsunami in Japan in 2011 — among many other disastrous effects,
this event disrupted a number of companies’ supply chains including Toyota who
experienced a 99 per cent drop in quarterly profits, and Apple who experienced a
shortage of lithium-ion batteries produced in a factory damaged by the disasters (BBC
News 2011; Sanchanta 2011).
Domestically, insurance losses from natural disasters have been increasing. This trend has
been driven by severe weather events (PC 2014c, p. 279).
Experts also consider that environmental risks such as a geospatial event or a volcanic eruption
are likely to cause significant global disruptions (The Economist 2020). Such events could be
a threat to telecommunication networks and the global positioning system, both of which are
critical to data transmission and freight, which in turn are critical to the smooth operation of
supply chains — as well as to many other functions in modern societies.
Economic risks include fiscal crises, asset bubbles, severe inflation and energy price shocks
(WEF 2020, p. 86). One of the biggest economic events to disrupt global supply chains was
the 1973 oil crisis, which affected many aspects of life in the short term and long term as
economies adapted to new conditions. More recently, the 1997 Asian financial crisis and the
2008 global financial crisis illustrate the types of economic disruptions that can occur;
although they had a relatively small effect on Australia, they affected economies that play
an important part in global supply chains.
Societal risks include social unrest, labour disputes, labour shortages due to an ageing
population and epidemics. Epidemics and pandemics can lead to disruptions due to the
workforce becoming sick, lockdowns and other major restrictions on operations or transport.
Epidemics and pandemics can also lead to a surge in demand for specific goods (such as
personal protective equipment), or a collapse in demand for specific goods (such as work
clothing) if patterns of life change dramatically. There is evidence that demand shocks have
been far more disruptive than supply shocks in the COVID-19 pandemic (Lynch 2021).
Infrastructure-related risks include any disruptions to critical infrastructure such as IT
systems, transport systems and electricity. The 2016 South Australian blackout is an example
of an infrastructure disruption.
26 VULNERABLE SUPPLY CHAINS
INTERIM REPORT
Cyber security is also an infrastructure-related risk. One survey reported that concerns over
data security were growing — 30 per cent of 1409 respondents in 2016 reported to be very
concerned by this threat; the figure grew to 44 per cent of 1193 respondents in 2017 (SCM
World 2016, p. 22, 2017, p. 46). Another survey showed that many are ill-prepared — of
400 managers surveyed from around the globe, about 75 per cent said cybersecurity was
either a top priority or important, but only 16 per cent thought their company was well
prepared (McKinsey & Company 2017, p. 5).
Importantly, although supply chain risks might be more evident in supply chains that rely on
imports and global trade, some of the examples above illustrate that domestic supply chains
are also at risk of disruptions. For example, the effects of bushfires and blackouts are
reminders that parts of supply chains are also vulnerable to domestic infrastructure risk;
however, supply chains that rely on overseas inputs are often highly dependent on a small
number of ports, which increases vulnerability.
Firm-level risk and vulnerability to market-level risk
All supply chains are vulnerable to some form of risk. But there is an important distinction
to draw between firm-level risk and market-level risk. Market-level risks are risks that can
disrupt an entire market for a good or service; for example, a disaster could affect the supply
chain of one automobile producer, for example Toyota in 2011; but if other automobile
producers are unaffected, and can expand their supply, consumers will still be able to
purchase automobiles. Other shocks could affect parts of a supply chain that affect all
automobile producers. Policymakers should be concerned about vulnerability to
market-level risk, rather than firm-level risk, and then only market-level risk for essential
goods (chapter 3).
Firms and industries are vulnerable to different risks based on their characteristics and the
characteristics of its supply chain. For example, labour-intensive industries are exposed to
the effects of labour disputes, and industries that rely heavily on intellectual property,
sensitive information, IT systems and communications are more likely to experience and are
more sensitive to cyberattacks; agriculture is particularly susceptible to weather events.
Industries that rely on specialised skills are more susceptible to disruption because they can
be difficult to replace or substitute (Lund et al. 2020, pp. 27–30). But specialised skills are
unlikely to lead to market-level risk: a global shortage of a skill would be a gradual problem,
and one gradually resolved by education systems.
Different locations are more or less vulnerable to external risks. For example, a supplier from
New Zealand is more likely to experience an earthquake-related disruption than a supplier
in France. As will be discussed below, this only creates market-level vulnerability if most
firms are clustered in one location.
In addition to the natural environment, local regulations and government preparations for
natural risks will affect the likelihood of a disruption. Countries differed in their level of
preparedness for the risk of a pandemic. For example Singapore and Taiwan experienced the

SUPPLY CHAINS AND RISKS
INTERIM REPORT
27
swine flu and SARS crises and seemed to be better prepared and able to contend with the
COVID-19 pandemic (Lowy Institute 2021; Rogers 2020). Likewise, the level of
geopolitical risk is quite different from one country to another (Marsh 2019).
Even internal risks are likely to vary by location. Labour disputes are more common in some
countries. The risk of a serious failure in the quality or safety of inputs is more likely in an
environment with many firms, rapidly evolving markets, and regulatory weaknesses; for
example, in 2008 baby formula was contaminated in China (Puddy and Burnie 2018).
The architecture of the supply chain will also determine vulnerability to risk (figure 2.2).
Although all supply chains are vulnerable to infrastructure-related risks, because they rely
on transport systems, some supply chains characteristics can increase risks; such
characteristics include:
1. limited flexibility — a supply chain that depends on a node or a link that is not easily
substitutable
2. geographic clustering — if all the firms in one tier are geographically clustered, this
increases the exposure to localised environmental risk, localised geopolitical risks and
localised infrastructure-related risks
3. length — a long supply chain involving inputs changing hands between many firms.
The first two have the potential to create market-level vulnerabilities because they are more
likely to affect all firms within a market. Long supply chains can also cause market-level
vulnerabilities, but if there is flexibility in each supply chain and a spread in the location of
firms, this diversifies the market-level risk.
Finally, operational decisions affect risk. If firms choose to operate with JIT processes, there
is a lack of redundancy which increases vulnerability. JIT involves holding minimal
inventory to reduce costs and waste — and promptly resolving any problems. However, this
approach to cost minimisation does not leave much room for error, such as if a supplier
misses a shipment, transport is disrupted, or if the firm experiences a surge in demand. Firms
face trade-offs between efficiency and resilience (chapter 5). Lack of redundancy, if adopted
by most firms in a market because of competitive pressure, raises market-level vulnerability.
Limited flexibility
Relying on a single supplier, a single production site, or depending on a particular supply
route, a unique infrastructure (such as a port or IT system), or on a high-skilled workforce
can contribute to inflexibility in a supply chain. Relying on a single supplier reduces costs
and complexity. But in the event of a disruption, it can be difficult or impossible for such
supply chains to replace that component of the supply chain in a short period of time.
If there are a small number of firms in the market and one supplier is disrupted, then others
may not be able to replace the disrupted firm’s output rapidly, because of capacity
constraints. Market concentration (and capacity constraints) increase firm-level risk, and

28 VULNERABLE SUPPLY CHAINS
INTERIM REPORT
create some market-level risk; there is a risk that a subset of market supply cannot be quickly
replaced. In the extreme, there is substantial market-level risk if all firms have the same
source. If there is a monopoly supplier for a critical input (one which cannot be easily
substituted) there are no options if the monopolist is disrupted. Market concentration is a
major source of market-level vulnerability.
Some supply chains can be thought of as being ‘diamond’ shaped, with the manufacturer at
one end of the chain, multiple firms supplying the manufacturer, but the entire chain relying
on a single firm upstream. Some pharmaceutical supply chains are thought to be diamond
shaped, relying on a single producer for their active ingredients; and many of these producers
are in China or India (Horner 2020). A firm may not be aware of how concentrated the
market truly is, and may assume it has diversified its risk if it chooses several suppliers.
Likewise, it can be challenging for policymakers to identify this market-level vulnerability,
due to data constraints.
Lack of flexibility is also an issue in transport. Bottlenecks in transport links also increase
the vulnerability of a supply chain as there may be limited substitute routes in the event of a
disruption. Bottlenecks include reliance on a port or a specific maritime, land or air route.
During the COVID-19 pandemic, some ports around the world experienced significant
delays as they struggled with shortages of workers due to illness (Lynch 2021), and
introduced infection-control protocols to ensure goods continued to move (UN
ESCAP 2020, p. 5). In the case of air transport, the use of airspace is regulated through a
network of mostly bilateral ‘freedom of the air’ agreements that define how airlines can use
airspace for both passenger and freight transport, and therefore constrain flexibility in
responding to changed conditions.
In terms of vulnerability to market-level risk, the closer the bottleneck infrastructure is to
Australia, the more likely it is to affect most firms in the market. Imports into Australia are
dependent on a small number of domestic ports, each with limited capacity, and thus are at
risk of significant delay in the event of a natural disaster or infrastructure failure.
Geographic clustering
If all the firms that supply a critical input are clustered in the same location, any risks to that
location become much more serious.
In 1999, an earthquake disrupted Taiwan’s semiconductor firms; these firms supplied
17 per cent of the world’s semiconductor chips which are used as inputs to electronic
equipment. The resulting price increase affected some (but not all) personal computer
producers, and their prices increased (Tomy 2020, p. 9). Had the earthquake been closer to
the centre of semiconductor manufacturing and had Taiwan been a larger share of the
industry, the computer industry would have been disrupted more seriously. Yet by 2017,
Taiwanese foundries accounted for 66 per cent of the global semiconductor market
(statista 2020).

SUPPLY CHAINS AND RISKS
INTERIM REPORT
29
Geographic clustering is a clear source of market-level vulnerability, because every firm in
the industry is affected. Chapter 4 illustrates how indices of geographic concentration can
be used as an indicator of vulnerability.
The length of a supply chain
When goods and services are transported across numerous regions, they are exposed to a
variety of environmental risks (Stecke and Kumar 2009, p. 203). If a supply chain crosses
many national borders, it is more susceptible to geopolitical and regulatory risks (changes in
policy and in the application of policies).
Increasing the number of tiers makes a supply chain more complex, decreases transparency
and increases the vulnerability of a supply chain. While a firm’s managers have strong
incentives to manage risk along its entire supply chain, they have less information about risk
at another site, or in another country. This information problem is exacerbated when the
other site is owned by a different firm. The supplier may have an incentive to hide
information about their costs or the risks they face from the firm that buys their products.
A survey of firms found that 43 per cent had good level of visibility within their tier 1
suppliers only, 46 per cent within tier 1 and 2, and only 11 per cent for all tiers of suppliers
(SCM World 2017, p. 46).
While this is a significant source of firm-level risk, it will not create market-level
vulnerability unless most firms in the market have long supply chains, and one of the other
two sources of risk also applies.
Dimensions of risk and risk management
Risk should be viewed along two dimensions: the probability of an event occurring; and the
consequences or effect of an event (Ritchie and Brindley 2007, p. 305).
The probability of a disruption is estimated based on historical information about the
occurrence of events. The likelihood of some external risks (environmental, geopolitical, and
so on) may be difficult for firms or policymakers to accurately assess. However, based on
historical information, it is still possible to assess the likelihood of a disruption at a particular
node or link, independent of the underlying cause of the disruption.
Determining the probability of a risk can be difficult, but it is important that risk management
includes events with low probability and with probabilities that are difficult to estimate as
these risks can have severe consequences.
The effect of an event can be viewed in terms of cost. An interruption in supply might force
a firm to find another, higher-cost source of supply; if no supply is available, the interruption
is similar to an infinite increase in costs. This conceptualisation also accounts for some
suppliers filling orders in the order that they are received, while others might sell to the

30 VULNERABLE SUPPLY CHAINS
INTERIM REPORT
highest bidder (Sheffi 2020). So risks can be quantified in terms of their effects on costs
along a supply chain. The duration of the cost increase is also relevant to firms and
policymakers.
Other ways firms consider risk and risk management strategies is by thinking about:
• the duration of the event, such as how long the effects may last for
• the lead time of the event, this refers to whether a firm can anticipate an event occurring
• the initial shock and contagion of the shock, which can be considered from both a
geographical perspective and an industry perspective. For example, the initial shock of
the COVID-19 pandemic was felt by China, then spread to other countries. Likewise, for
industries, initially only a few industries were affected (those that relied on production
in the area of Wuhan) then this spread as the virus spread. (Lund et al. 2020, pp. 23–24)
Firms’ risk management strategies aim to reduce the effects of a disruption. Firms can reduce
the probability of some events occurring, for example, a cyberattack or poor supplier
relations, but firms have little control over external risks. Management of these risks instead
aims to prepare a firm to better respond or mitigate damage to a firm’s supply chain.
Chapter 5 discusses risk management strategies in more detail and where government might
play a complementary role.

THE FRAMEWORK
INTERIM REPORT
31
3 A framework to identify vulnerable
supply chains
Key points
• This chapter outlines a framework that is designed to identify supply chains that are vulnerable
to disruptions and whose absence would jeopardise the functioning of the economy and hence
Australians’ wellbeing.
− A distinguishing feature of the framework is the adoption of a ‘wide net’ by first identifying
vulnerable product categories using a data-driven approach. Then it identifies which of
these vulnerable products are used in essential industries, and then relies on expert
assessment and other methods to determine which products are critical.
− The framework is complementary to other approaches that begin with expert assessment.
• The approach embodies the notion of a resilient supply chain, as one that continues to function
when exposed to disruption and adapts to changes.
− Resilient supply chains are part of a well-functioning economy, which produces the income
and goods and services that are the basis for Australians’ wellbeing.
• The framework focuses on the short-term period after a supply chain disruption — a period of
up to six months. This time frame was selected because in the long-run, well-functioning
markets allow prices and quantities to adjust and supply chains to adapt.
• The notions of vulnerable, essential and critical goods and services are at the core of the
framework.
• A vulnerable market-level supply chain is one that has characteristics which makes it
susceptible to risk. These characteristics include: a lack of flexibility (where a supply chain
depends on something not easily substitutable); geographic clustering; and having many
nodes within a supply chain.
− A market-level supply chain with a lack of flexibility is typically a highly vulnerable supply
chain, and if a supply chain has more than one characteristic that makes it susceptible to
risk this increases the vulnerability of the supply chain.
− Data availability will shape the data exercise. No dataset can capture all dimensions of
vulnerability.
• Essential goods and services meet the basic needs of Australians, and are part of the output
of numerous industries, including food, water, health, communications, energy, transport,
finance and government.
− There are two views of essential — a narrow view which includes goods and services that
meet Australians’ primary needs, and a broad view which includes the list of goods and
services from the narrow view, and any goods and services that provide income security to
Australians.
• Goods and services that are deemed critical to the functioning of the economy and to the
wellbeing of Australians cannot be substituted and are critical to the supply of an essential
good or service.
32 VULNERABLE SUPPLY CHAINS
INTERIM REPORT
This chapter outlines a framework that first uses a scan of data to identify supply chains that
are vulnerable to disruptions and whose absence would jeopardise the functioning of the
economy and hence Australians’ wellbeing. The framework is applied to Australian imports
in chapter 4 and will also be applied to Australian exports in the final report. It is also capable
of being applied to whole supply chains, whether international or within Australia.
The framework is best thought of as a tool to gain insights into supply chain risks and to
identify strategies to manage those risks (discussed in chapter 5). Typically firms apply a
combination of strategies to insure against the risks of disruption, according to the costs of
the strategies and their benefits in the case of a disruption.
3.1 The links between wellbeing and supply chains
As outlined in chapter 2, goods and services are produced through supply chains, and all
supply chains are subject to risk, to a greater or lesser extent. However, not all supply chains
are essential to Australians’ wellbeing. A disruption to the supply of American peaches, to
Australia for example, is unlikely to have any marked effect on the wellbeing of Australians.
(From this point onwards, we are discussing market-level supply chains, and the risk of
disruption to an entire market.)
Figure 3.1 represents the role of supply chains in the functioning of the economy and the
production of material wellbeing for Australians. Put simply, material wellbeing is a function
of goods and services consumed, and some of these goods and services are essential. In turn,
essential goods and services are those that support the basic needs of Australians; these needs
are physiological, ‘vital to survival’, and take priority over other needs (‘all needs become
secondary until these physiological needs are met’ (Maslow 1943; Mawere et al. 2016, p. 5)).
This implies that essential goods and services are those that support the provision of health,
water, food and shelter. That said, there are different views about what specific goods and
services are essential, as discussed in detail below.
In the context of this study, distinguishing between essentials and non-essentials means that
basic needs can be prioritised and risk management is focused on the resilience of the supply
chains of essentials.

THE FRAMEWORK
INTERIM REPORT
33
Figure 3.1 The relationship between wellbeing, the functioning of the economy and supply chains
Note: The green box surrounding goods and services and income represents the macroeconomic links
between income (𝐺𝐷𝑃𝐼) and expenditure on goods and services (𝐺𝐷𝑃𝐸).
A well-functioning economy produces income that is used to buy essential and non-essential
goods and services, and relies on resilient supply chains within the country and
internationally. A resilient supply chain is one that continues to function when exposed to
shocks and adapts to changes. Supply chains are comprised of many components which are
Australians’ wellbeing
Functioning economy (essential and non-essential)
Goods and services Non-essentialsEssentials
Income
Resilient supply chains
Labour
(skills) and
capital
Domestic and
imported
inputs (goods
and services)
Medication in
hospitals,
accounting
Domestic and
imported final
goods and
services
Medication,
defence,
police
Infrastructure and
logistics
(domestic and
international)
Road, rail and air
transport,
communications,
wholesale, retail
Purchases
Components
of supply
chains
Examples
Produces
Produce

34 VULNERABLE SUPPLY CHAINS
INTERIM REPORT
all vulnerable to shocks (chapter 2). As highlighted in chapter 2, some supply chains are
more vulnerable than others, in that they have characteristics that make them more
susceptible to risks. Chapter 5 explores how supply chain resilience can be improved and the
role of governments.
3.2 The approach to identifying goods and services
that are vulnerable, essential and critical
Consistent with this broader wellbeing framework, the Commission’s analytical approach is
designed to identify goods:
1. whose supply chains might be vulnerable to the risk of disruption
2. are essential to the wellbeing of Australians
3. are critical to the production of an essential good or service.
Identifying which goods and services are essential is the most subjective component of the
approach. The formal analysis of supply chains in chapter 2 highlighted the sources of risk
and characteristics of supply chains that render them more vulnerable. The notion of critical
defines an input as critical when there is no available substitute for that input, and if it is not
available, it would shut down a supply chain of an essential good or service.
Many analyses of country-level risk begin by reversing steps 1 and 2 above and using,
instead of a data scan, a process of expert consultation. The consultation approach engages
with experts to identify the essential sectors and key inputs that may be at risk (box 3.1).
Box 3.1 The expert consultation approach — a recent example
The Department of Defence recently used an expert consultation approach to identify the
effects of a collapse of global governance (Engineers Australia 2019). The report, based on a
workshop with 17 engineers, outlines a timeline of effects from the collapse and the experts
determine that the majority of effects, including an increase in cyberattacks, failure of water
treatment systems, fuel shortages, food shortages, social unrest and wide-spread
unemployment, would occur within three months.
The Commission’s approach combines the use of data and experts. It starts with a broad scan
of supply chains to identify those that might be vulnerable to shocks and uses filters to
identify those goods and services that might be vulnerable and essential to the wellbeing of
Australians (figure 3.2). This approach may be viewed as a data-with-experts approach.

THE FRAMEWORK
INTERIM REPORT
35
Figure 3.2 Analytical framework
The scan is data-driven, and thus can only identify those vulnerabilities that will show up in
the available datasets. The list of vulnerable supply chains is subsequently separated into
those that are part of supplying goods and services that are considered to be essential. The
resulting list of goods and services can then be used as a starting point to identify whether
any of the vulnerable and essential items are critical to the supply of essentials. This stage
of the approach is based on expert consultation.1
This data-based and relatively mechanical sorting can occur before exercising judgement as to
what is an essential good. By first identifying vulnerabilities across supply chains that might
affect parts of the economy, including essential and non-essential goods and services, the
framework captures a large set of goods and services. The initial broad scan for vulnerability
1 The third step of the framework has not been implemented in this report due to time constraints.
1.Vulnerable
2. Vulnerable
and essential
3. Vulnerable,
essential
and critical
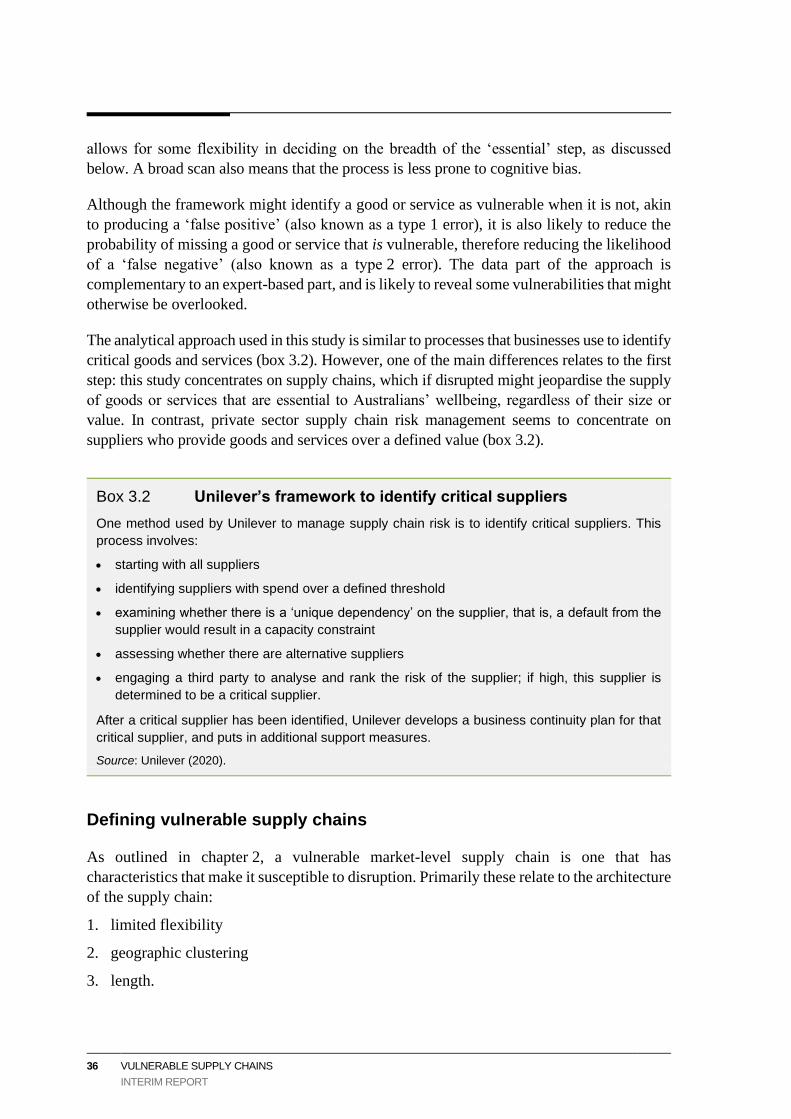
36 VULNERABLE SUPPLY CHAINS
INTERIM REPORT
allows for some flexibility in deciding on the breadth of the ‘essential’ step, as discussed
below. A broad scan also means that the process is less prone to cognitive bias.
Although the framework might identify a good or service as vulnerable when it is not, akin
to producing a ‘false positive’ (also known as a type 1 error), it is also likely to reduce the
probability of missing a good or service that is vulnerable, therefore reducing the likelihood
of a ‘false negative’ (also known as a type 2 error). The data part of the approach is
complementary to an expert-based part, and is likely to reveal some vulnerabilities that might
otherwise be overlooked.
The analytical approach used in this study is similar to processes that businesses use to identify
critical goods and services (box 3.2). However, one of the main differences relates to the first
step: this study concentrates on supply chains, which if disrupted might jeopardise the supply
of goods or services that are essential to Australians’ wellbeing, regardless of their size or
value. In contrast, private sector supply chain risk management seems to concentrate on
suppliers who provide goods and services over a defined value (box 3.2).
Box 3.2 Unilever’s framework to identify critical suppliers
One method used by Unilever to manage supply chain risk is to identify critical suppliers. This
process involves:
• starting with all suppliers
• identifying suppliers with spend over a defined threshold
• examining whether there is a ‘unique dependency’ on the supplier, that is, a default from the
supplier would result in a capacity constraint
• assessing whether there are alternative suppliers
• engaging a third party to analyse and rank the risk of the supplier; if high, this supplier is
determined to be a critical supplier.
After a critical supplier has been identified, Unilever develops a business continuity plan for that
critical supplier, and puts in additional support measures.
Source: Unilever (2020).
Defining vulnerable supply chains
As outlined in chapter 2, a vulnerable market-level supply chain is one that has
characteristics that make it susceptible to disruption. Primarily these relate to the architecture
of the supply chain:
1. limited flexibility
2. geographic clustering
3. length.

THE FRAMEWORK
INTERIM REPORT
37
Which of these vulnerabilities can be identified from data will depend on what data is
available. In chapter 4 we outline an example using trade data.
Import and export data can help identify geographic clustering. If most imports in a category
are sourced from the same country, that means that suppliers are geographically clustered. It
may also mean that the imports are from a small number of firms, which is another source of
limited flexibility. (The number of supplier firms could be verified with more detailed customs
data.) But data on Australian imports and exports cannot identify where products were sourced
further up the supply chain, or whether flexibility upstream is limited.
Defining essential goods and services
The second step of the framework is to separate essential goods and services from
non-essential ones.
Not all vulnerable supply chains are essential for Australians’ wellbeing (figure 3.2). As
noted earlier, essential goods and services can be defined as those that support the basic
needs of Australians such as food, shelter, water and health, but there are many ways to
define essential.
Some jurisdictions within Australia define essential services in legislation (table 3.1). Typically
the lists include electricity, gas, water and logistics services, but there are also notable
differences, with NSW including health and more services generally than the other states.
Commonwealth departments and the Royal Commission into National Natural Disaster
Arrangements have other definitions (table 3.2). Again, electricity, water and logistics
services are included and there are other differences:
• the Critical Infrastructure Centre includes the Commonwealth Government (though
interestingly, not state and territory governments)
• the COVID-19 critical sector list includes aged care
• the Royal Commission report did not explicitly list essential goods and services. Those
shown in the table are the main goods and services mentioned in the Commission’s
report. The report has a section devoted to fire retardant being an essential good and the
strain on its supply chain during the 2019–2020 bushfires (Royal Commission into
National Natural Disaster Arrangements 2020a, p. 233) (appendix B).

38 VULNERABLE SUPPLY CHAINS
INTERIM REPORT
Table 3.1 State-level definitions of ‘essential’ vary
Essential Services Act 1988 (NSW) Essential Services Commission Act 2001 (Vic)
Essential Services Commission Act 2002 (SA)
The production, supply or distribution of any form of energy, power or fuel or of energy, power or fuel resources
Electricity industry Electricity services
Public transportation of persons or the transportation of freight
Gas industry Gas services
Provision of fire-fighting services Ports industry Water and sewerage services
Provision of public health services Grain handling industry
Maritime services
Provision of ambulance services Rail industry Rail services
Conduct of a welfare institution Water industry
Conduct of a prison Non-cash payment transaction industry
Provision of garbage, sanitary cleaning or sewerage services
Commercial passenger vehicle industry
Production, supply or distribution of pharmaceutical products
Supply or distribution of water
The scope of essential goods and services is affected by the time frame being considered and
by their role in supporting the basic needs of Australians. If the time frame was longer than
just the immediate response to a supply chain disruption, then other needs of Australians may
be considered and the definition of ‘essential’ broadened. This study focuses on short-term
disruptions to supply chains (up to six months) and their implications for the broader economy.
A shock creates a large initial increase in price, reducing demand and providing incentives to
increase supply. The reduction in demand reduces Australians’ wellbeing. During the
subsequent adjustments, supply increases and reducing prices return Australians’ wellbeing to
at or near the initial situation/equilibrium. In many markets for essential goods or commodities,
such adjustments are likely to occur within a period of six months.
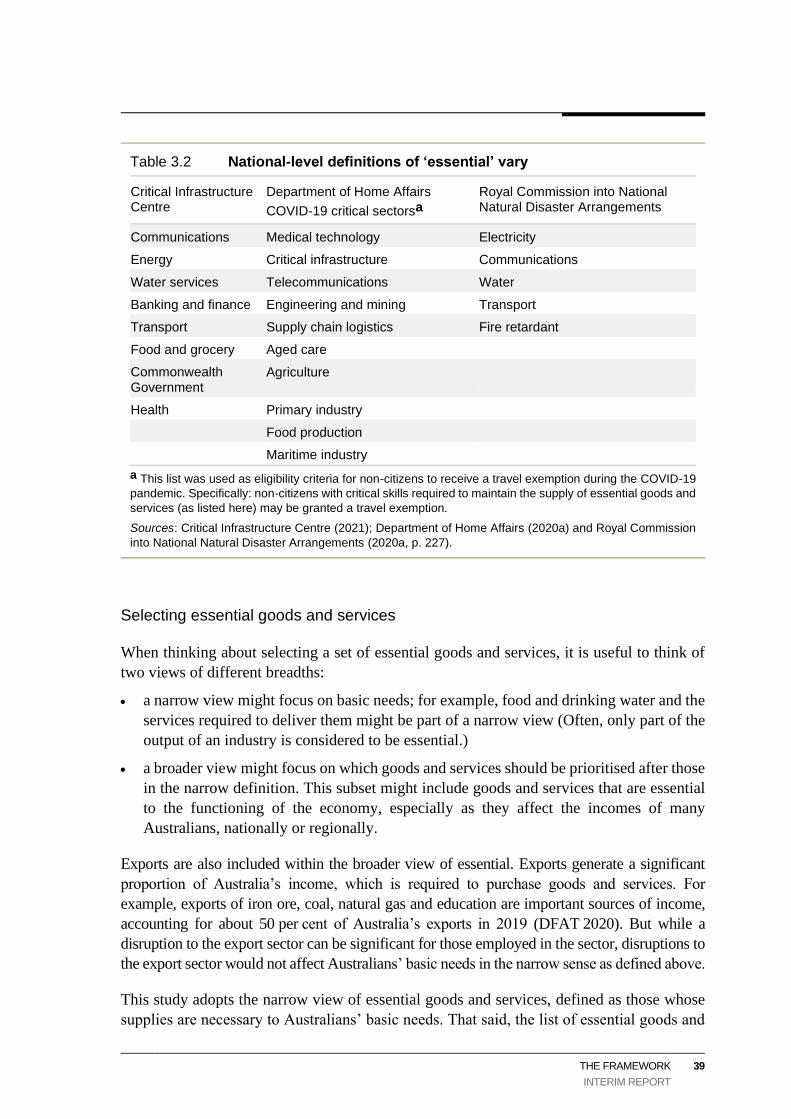
THE FRAMEWORK
INTERIM REPORT
39
Table 3.2 National-level definitions of ‘essential’ vary
Critical Infrastructure Centre
Department of Home Affairs
COVID-19 critical sectorsa
Royal Commission into National Natural Disaster Arrangements
Communications Medical technology Electricity
Energy Critical infrastructure Communications
Water services Telecommunications Water
Banking and finance Engineering and mining Transport
Transport Supply chain logistics Fire retardant
Food and grocery Aged care
Commonwealth Government
Agriculture
Health Primary industry
Food production
Maritime industry
a This list was used as eligibility criteria for non-citizens to receive a travel exemption during the COVID-19
pandemic. Specifically: non-citizens with critical skills required to maintain the supply of essential goods and
services (as listed here) may be granted a travel exemption.
Sources: Critical Infrastructure Centre (2021); Department of Home Affairs (2020a) and Royal Commission
into National Natural Disaster Arrangements (2020a, p. 227).
Selecting essential goods and services
When thinking about selecting a set of essential goods and services, it is useful to think of
two views of different breadths:
• a narrow view might focus on basic needs; for example, food and drinking water and the
services required to deliver them might be part of a narrow view (Often, only part of the
output of an industry is considered to be essential.)
• a broader view might focus on which goods and services should be prioritised after those
in the narrow definition. This subset might include goods and services that are essential
to the functioning of the economy, especially as they affect the incomes of many
Australians, nationally or regionally.
Exports are also included within the broader view of essential. Exports generate a significant
proportion of Australia’s income, which is required to purchase goods and services. For
example, exports of iron ore, coal, natural gas and education are important sources of income,
accounting for about 50 per cent of Australia’s exports in 2019 (DFAT 2020). But while a
disruption to the export sector can be significant for those employed in the sector, disruptions to
the export sector would not affect Australians’ basic needs in the narrow sense as defined above.
This study adopts the narrow view of essential goods and services, defined as those whose
supplies are necessary to Australians’ basic needs. That said, the list of essential goods and

40 VULNERABLE SUPPLY CHAINS
INTERIM REPORT
services is broader than most of the lists reviewed above, because those lists reflect the focus
of the study or institution that made them. The list in this study needs to cover all goods and
services that are essential to the wellbeing of Australians. Some elements of the list are
obvious in that Australians could not live without them for even a few weeks (water and
medicines), while others are necessary to facilitate the transport and distribution of those
types of goods (communications, energy, and transport). And some services support the
functioning of the economy by providing essential services to firms (such as the payment
system parts of the banking and finance sectors). Among government services, defence
needs to be always operational and maintain a state of readiness to respond to security and
safety emergencies. Further, most health infrastructure, social and related services, and
services that support the tax and transfer system, ensure that Australians’ basic needs are
met. Supply chains that are part of the production of all these types of services need to be
maintained to ensure the continued delivery of these essential goods and services. The list
adopted for this study is found in chapter 4.2
While defence is essential to the wellbeing of Australians, it is not in scope for this study
because the Commission does not have access to the information required due to national
security reasons. That said, some of the economic and risk management principles in this
study are relevant to the management of supply chains that support defence.
In the final analysis, the set of goods and services that are essential to the wellbeing of
Australians is a matter of society’s choice. That said, in the context of a study of this type,
the set to be used is likely to vary depending on the purpose of the analysis. The potential
for narrower or broader definitions of sets of essential goods and services illustrates the value
of starting with a scan of supply chains and following that first step by a screen of varying
‘size’, depending on the focus of the analysis. For example, a study concentrating on the
risks to Australians’ health would have a very narrow focus, whereas a study on the risks to
the Australian economy would have a broader focus.
Defining critical goods and services
The third step of the framework is to identify goods and services that are critical, in that they
are required in supplying a good or service, cannot be substituted easily and cannot be designed
out of the production process (within six months). This last screening relies on consulting with
experts to identify (from the list of vulnerable inputs into the supply of essential goods and
services) which ones might be critical. A good or service is substitutable if it:
• can be sourced from an alternative supplier
• can be replaced by another good or service.
2 Food is considered essential. That said, in Australia no disruptions to global supply chains are likely to affect
access to food within the six month time frame under consideration so the remainder of the report excludes food.

THE FRAMEWORK
INTERIM REPORT
41
Identifying such inputs requires consultation with experts who are familiar with the relevant
production processes, such as engineers and warehouse managers. Experts can identify
which goods and services are critical by answering the following questions.
• Are alternate sources of supply for the good readily available or can supply be increased
quickly — from foreign or domestic sources?
• Can the input or good be substituted relatively easily by another (that is, with relatively
little need to redesign)?
There are also data-driven approaches to identifying critical inputs. One is to measure the
elasticity of demand for the input within the industry: if the world price of the input has
undergone a large change, how did demand from the industry respond? A lack of
responsiveness to changes in the price of an input is an indication that it is very difficult to
substitute away from this input. That said, this approach would not fully capture the critical
criterion: that is, if the good or service were unavailable, the supply of an essential good or
service would be shut down. Appendix D shows how elasticities may be used to identify
critical goods.
Once goods and services that are critical to production are identified, the next step in the
framework is to identify appropriate risk management strategies; chapter 5 reviews such
strategies. There are some conditions under which governments might intervene or facilitate
some risk management strategies. Conditions under which that might be required are
investigated in chapter 5.
Before that, chapter 4 applies the first two steps of the general framework developed here to
Australian imports as an illustration of how it works.


APPLYING THE FRAMEWORK
INTERIM REPORT
43
4 Applying the framework to
Australian imports
Key points
• The analytical framework developed in chapter 3 can complement existing processes for
identifying supply chain risks. It also provides a methodology for suggesting whether inputs
are likely to be critical, but criticality is best determined together with industry experts.
• The Commission has applied this framework using detailed data for goods trade. Applying the
first step of the framework revealed that:
− one-in-five imports is predominantly sourced from one country
− global trade data suggest that for many of these products, alternative sources of supply
exist and could be utilised should the need arise
− one-in-twenty Australian imports (292 products) might be vulnerable to concentrated
sources of global supply (worth A$20 billion)
− the main supplier of vulnerable imports is China, accounting for about two thirds of those
products.
• The second step of the framework examined how reliant the Australian supply of essential
goods and services is on vulnerable imports. Applying this step revealed that:
− essential industries used 130 of the 281 vulnerable imports in production
− use of essential goods and services account for almost half of total household and
government final consumption. Most of these goods and services are produced locally.
Vulnerable imports play a limited role in meeting final demand either directly (as final goods)
or indirectly (as inputs into production).
• Taken together, the results suggest that the main supply chain disruption risks arise from
relying on concentrated imports of some basic chemical products and some personal
protective equipment.
• Vulnerable imports are a small proportion of the cost of inputs for producing essential goods
and services, which suggests that in many cases they may not be critical. But this evidence is
not conclusive and industry experts are required to determine criticality.

44 VULNERABLE SUPPLY CHAINS
INTERIM REPORT
The analytical framework developed in chapter 3 is intended for scanning data as a first step
in identifying supply chains that are vulnerable to disruption and where their absence would
jeopardise the functioning of the economy and, hence, the wellbeing of Australians.
This chapter applies the first two steps of the analytical framework to Australian imports to
identify:
• which Australian imports are more vulnerable to disruption
• whether these imports play a material role in the delivery of essential goods and services
in Australia.
It does not apply the third step in the framework to identify whether these imports are critical
to the delivery of essential goods and services, although some of the evidence used in
assessing whether vulnerable imports are essential does point towards factors that may be
important in determining their criticality. Industry experts are best placed to determine
criticality using their knowledge of production processes and the extent to which substitute
products can be used in the event of any disruption (chapter 3).
The chapter begins by outlining the importance of imported goods to Australian economic
activity (section 4.1). It then applies the first step of the analytical framework to ascertain
how vulnerable Australian imports are to disruption (section 4.2). It then applies the second
step of the analytical framework to examine how reliant the Australian production of
essential goods and services is on vulnerable imports (section 4.3) and how reliant the use
(that is, final demand by households and government) of essential goods and services is on
vulnerable imports (section 4.4). The chapter then identifies some extensions that could be
made to this work (section 4.5).
Applying the framework involves linking data on Australian imports, global trade, and
Australian production to determine which industries use each product (appendix C). The
analysis focuses on data from 2016-17, the latest year from which data are available from all
three sources, to enable their linking.
No comparable dataset exists on Australian imports of services, and therefore it is not
possible to assess the vulnerability of supply of imported services.1 However, imports of
services are susceptible to disruption in much the same manner as imports of goods. The
COVID-19 pandemic, for example, has restricted the movement of people across domestic
and international borders. Supply chain disruptions may occur where these people have
specialist skills that Australia or its particular states may lack. Supply chain vulnerability to
imported services and the movement of skilled labour should also be assessed using the best
available information.
1 Hereafter, imports refers to merchandise (goods) imports. It does not include imports of services. Services
trade is inherently more complex to record than goods trade. The OECD-WTO Balanced Trade in Services
dataset (BaTIS) collects global trade flows of services, but only records flows in 12 broad categories.
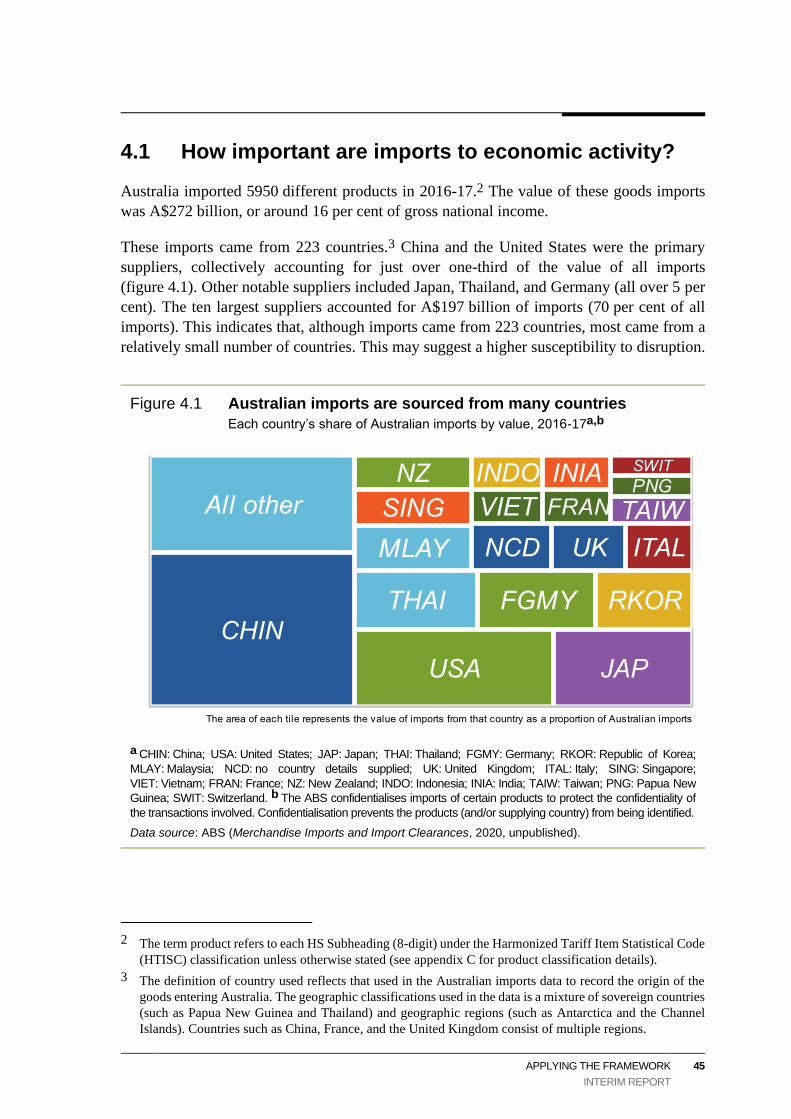
APPLYING THE FRAMEWORK
INTERIM REPORT
45
4.1 How important are imports to economic activity?
Australia imported 5950 different products in 2016-17.2 The value of these goods imports
was A$272 billion, or around 16 per cent of gross national income.
These imports came from 223 countries.3 China and the United States were the primary
suppliers, collectively accounting for just over one-third of the value of all imports
(figure 4.1). Other notable suppliers included Japan, Thailand, and Germany (all over 5 per
cent). The ten largest suppliers accounted for A$197 billion of imports (70 per cent of all
imports). This indicates that, although imports came from 223 countries, most came from a
relatively small number of countries. This may suggest a higher susceptibility to disruption.
Figure 4.1 Australian imports are sourced from many countries
Each country’s share of Australian imports by value, 2016-17a,b
a CHIN: China; USA: United States; JAP: Japan; THAI: Thailand; FGMY: Germany; RKOR: Republic of Korea;
MLAY: Malaysia; NCD: no country details supplied; UK: United Kingdom; ITAL: Italy; SING: Singapore;
VIET: Vietnam; FRAN: France; NZ: New Zealand; INDO: Indonesia; INIA: India; TAIW: Taiwan; PNG: Papua New
Guinea; SWIT: Switzerland. b The ABS confidentialises imports of certain products to protect the confidentiality of
the transactions involved. Confidentialisation prevents the products (and/or supplying country) from being identified.
Data source: ABS (Merchandise Imports and Import Clearances, 2020, unpublished).
2 The term product refers to each HS Subheading (8-digit) under the Harmonized Tariff Item Statistical Code
(HTISC) classification unless otherwise stated (see appendix C for product classification details).
3 The definition of country used reflects that used in the Australian imports data to record the origin of the
goods entering Australia. The geographic classifications used in the data is a mixture of sovereign countries
(such as Papua New Guinea and Thailand) and geographic regions (such as Antarctica and the Channel
Islands). Countries such as China, France, and the United Kingdom consist of multiple regions.
The area of each tile represents the value of imports from that country as a proportion of Australian imports .

46 VULNERABLE SUPPLY CHAINS
INTERIM REPORT
The main imports by value were: motor vehicles and parts; electrical, optical and other
specialised equipment; fuel; pharmaceuticals; and chemicals (figure 4.2).
Figure 4.2 Imports are dominated by vehicles, machinery, and fuels
Top imports by value, 2016-17a
a The ABS confidentialises imports of certain products to protect the confidentiality of the transactions
involved. Confidentialisation prevents the products (and/or supplying country) from being identified.
Data source: ABS (Merchandise Imports and Import Clearances, 2020, unpublished).
Not all imports are of similar importance to Australian industry, the Australian economy,
and the national interest. The consequences of any disruption to imports of clothing apparel,
for example, would be less than the consequences of a disruption to the imports of fuels and
pharmaceuticals.
4.2 How vulnerable are Australian imports to disruption?
Supply chain vulnerability may arise from the reliance of Australian producers (and
consumers) on goods sourced from overseas, as their supply chains will be more
susceptible to certain sources of disruption than those sourced locally. Imported goods are,
for example, more susceptible to geopolitical events (such as trade disputes), and
disruptions to transport corridors that they may pass through (such as the Strait of Hormuz).
If most of the supply is from one location, vulnerability is greater: a natural disaster or
other shock in that location can disrupt supply. The degree of vulnerability would generally
increase when the number of actual and potential suppliers decrease, and when suppliers
have market power. In the language of chapter 2, vulnerability is greater if there is
geographic clustering, or limited flexibility.
37.5
37.3
28.1
27.9
10.6
10.4
9.5
7.7
7.6
5.9
5.5
4.1
4.1
3.9
3.329-Organic chemicals
40-Rubber
61-Non-knitted clothing
62-Knitted clothing
73-Iron & steel
94-Furniture
99-Confidential items
39-Plastics
71-Precious stones
90-Optical equipment
30-Pharmaceutical products
27-Mineral fuels
85-Electrical equipment
84-Machinery
87-Vehicles
0 10 20 30 40 50
Value of imports (A$ billion)
HT
ISC
Ch
ap
ter
(2-d
igit
)

APPLYING THE FRAMEWORK
INTERIM REPORT
47
As an extreme case, some Australian industries may cease production if there were to be a
sustained disruption to the supply of a critical imported input. Consumers may also suffer if
products that are integral to their welfare are unavailable, for example some medicines or
chemicals for water treatment.
This section assesses supply chain vulnerability arising from sourcing imports from
concentrated global markets. That is, it focuses on imports with high levels of market
concentration. By implication, well-developed and diversified trading networks (networks
of supply from multiple countries) are one way of mitigating any such risks.
Applying the framework to determine potential import vulnerability
As described in chapter 3, the process for identifying vulnerable imports is mechanical and
data driven. The mechanical sorting involves progressively applying filters to assess whether:
• a single country accounts for a large share of Australian imports. This considers
vulnerability arising from existing suppliers and trade flows, which provides an
indication of actual supply risk
• there are limited alternative suppliers that Australia could access in the event of any
disruption to existing suppliers. This considers vulnerability in terms of possible sources
of supply, which provides an indication of potential supply risk.
The imported products that remain after applying these filters may be more susceptible to
disruption, as Australia is reliant on limited sources of supply.
Australian imports data and global trade data for 2017 are used in the application of these
filters (box 4.1).
Box 4.1 Trade data and classifications
The trade data used in this chapter is classified according to the international Harmonized System
(HS), or its Australian extension known as the Harmonized Tariff Item Statistical Code (HTISC)
(appendix C).
All trade data classify products at different levels of detail, ranging from highly aggregated to
highly disaggregated categories (with more digits indicating progressively more disaggregated
data). The analysis in this chapter assesses:
• Australian imports at the 8-digit level (known as the HS Subheading level). This level of detail
is fine enough to enable vulnerable products to be identified, but not so fine that many
substitute products are separately classified
• the global trade data at the 6-digit HS (which is the same as the 6-digit HTISC). This is the
most disaggregated product classification available in global trade data.

48 VULNERABLE SUPPLY CHAINS
INTERIM REPORT
Filtering process and results
Three filters are applied to the trade data to identify vulnerable imports, with supply chain
risks progressively increasing with the application of each filter.
Filter one: Concentrated Australian imports
The first filter determines whether the market for each product that Australia imports is
highly concentrated, as concentrated sources of supply entail additional risk. Australian
imports are considered concentrated when the main supplying country accounted for over
80 per cent of imports of a product (appendix C).
The first filter indicates that 1327 products (worth A$30 billion) of the 5862 products
(A$287 billion) that Australia imported in 2017 came from concentrated local import
markets (figure 4.3). That is, the market was concentrated for one-in-five imports.
The number of concentrated imports identified is sensitive to a number of decisions made
during the analysis including the threshold used to identify concentrated imports (80 per
cent), the level of analysis (product aggregation), possible minimum value thresholds, and
the exclusion of product groups (2-digit Chapters) that are less likely to be critical to national
activities. (Sensitivity testing to gauge the robustness of the analysis to these assumptions is
reported in appendix C.)
Figure 4.3 The filtering process to identify vulnerable imports
Number and value of products at each stage of the filtering process
Data sources: ABS (Merchandise Imports and Import Clearances, 2020, unpublished) and UN Comtrade.
5862 imported products (8-digit)
[A$287b]
1327 concentrated imports
[A$30b]
518 with few global
suppliers [A$21b]
Filter one:
The main supplying economy
accounted for > 80% of Australian
imports
Filter two:
Products sourced from a concentrated
global market:
• the Herfindahl-Hirschman Index
> 3100, or
• highest market share > 50%
292 sourced from the
main global supplier
[A$20b]
Filter three:
Australia sources its supply from the
main global supplier
APPLYING THE FRAMEWORK
INTERIM REPORT
49
Most concentrated imports relate to chemicals (both organic and inorganic), iron and steel,
and different types of equipment. Imports of some other products, such as seafood and
particular types of clothing apparel, were also highly concentrated. Agricultural products
also accounted for many of the concentrated imports. These imports often complement
Australian production by maintaining year-round supply out of the Australian growing
season (such as imports of peaches from the United States).4
Concentrated products are found across many product groups, including: chemicals, fuels,
pharmaceuticals, minerals, metals, fertilisers, plastics, transport parts and equipment, and
military equipment.5
Other products might be vulnerable but may be missed in the analysis due to limitations
inherent to trade classifications (box 4.2).
Box 4.2 Limitations with trade classifications
There are limitations in the trade data that may point to areas of vulnerability that cannot be
identified in the present analysis.
• Import data is confidentialised for some products, suggesting that a product might be sourced
from a limited number of suppliers. It is likely that products that are under patent (such as
some medicines) are confidentialised given there are few producers, or one producer in the
extreme case.
• The coarseness of product classifications may lead to groupings of vulnerable and
non-vulnerable products. Active ingredients, for example, may be grouped with other
chemicals that are not critical to the production of medicines that might be essential to the
material wellbeing of some Australians.
These limitations also apply to production data, which has even coarser product classifications
than the imports data. For example, the more aggregated nature of production data makes it
difficult to determine the exact local and imported sales shares for each of the products covered
in the trade data.
Filter two: Concentrated global markets
The second filter determines whether global trade in a product is also concentrated, as fewer
potential sources of supply exist that could be utilised in the event of any disruption to
existing supplies. Global markets are considered highly concentrated when the main
supplying country accounted for over 50 per cent of global exports or when the
Herfindahl-Hirschman Index (HHI) is greater than 3100 points (box 4.3).
4 The number of concentrated agricultural imports also reflects the fine-grained categories used to classify
imports that differentiate between effectively similar products.
5 Although some military equipment appear in the imports data, it is only a partial view as other items are
not recorded. This study does not analyse supply chains that relate to defence activities in depth (chapter 1).

50 VULNERABLE SUPPLY CHAINS
INTERIM REPORT
Box 4.3 The Herfindahl-Hirschman Index
The HHI is the most commonly used measure of market concentration. It is popular because it
summarises information about both the number of exporters and their respective market shares. It
is calculated as the sum of the square of the market shares of each exporter (limited to the largest
50 exporters). The HHI ranges from 0 (not concentrated) to 10 000 (extreme concentration).
In US antitrust law dealing with firm-based concentration, a HHI between 1500 and 2500 is
interpreted as moderate concentration and over 2500 indicates high concentration (US
Department of Justice and Federal Trade Commission 2010).
Since the global trade data describe flows between countries, rather than firms, a HHI above 3100
is used to indicate that a global market is concentrated (appendix C).
The second filter reduces the number of concentrated imports from 1327 to 518.6 This
represents 9 per cent of the total number of products imported and about A$21 billion of
value. This reduces the number of imports sourced from concentrated markets to one-in-ten.
This indicates that alternate sources of supply exist for well over half of all concentrated
imports that could be utilised in the event of any disruption to existing supplies. For example,
Australia sources chlorine primarily from China, but the global market for chlorine is not
concentrated and China is not the leading exporter of chlorine. This suggests that Australia
could source chlorine from another country in the event of a disruption to Chinese supply.
The 809 products removed by the second filter indicate that many agricultural, food, wood,
chemical, textile, and mineral products (such as fuel) have alternative sources of supply that
could be utilised if the need arises (figure 4.4). However, the presence of biosecurity and
other domestic restrictions may reduce the number of markets potentially accessible to
Australia, such that they may, in reality, be effectively more concentrated than the
mechanical data processing indicates.
6 Since the global trade data are available at a higher product aggregation than the Australian imports data
(6-digit versus 8-digit), each concentrated import is linked to measures of global market concentration
which are constructed at more aggregated product levels.
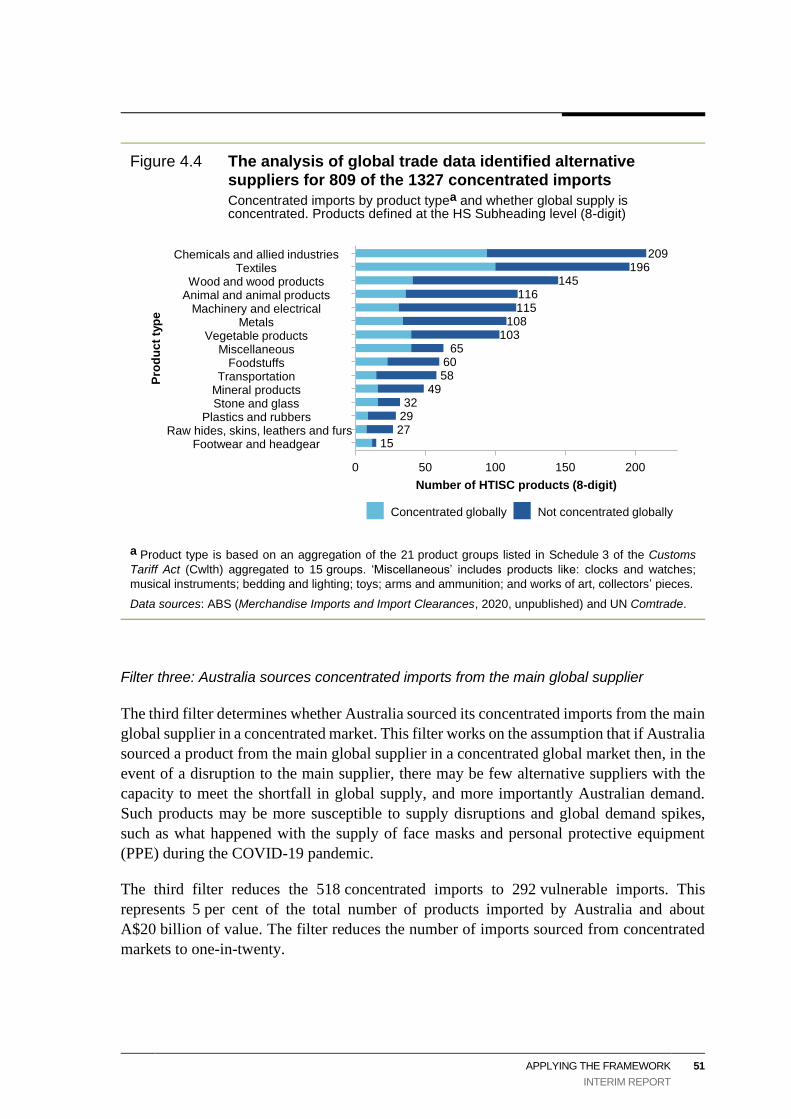
APPLYING THE FRAMEWORK
INTERIM REPORT
51
Figure 4.4 The analysis of global trade data identified alternative suppliers for 809 of the 1327 concentrated imports
Concentrated imports by product typea and whether global supply is concentrated. Products defined at the HS Subheading level (8-digit)
a Product type is based on an aggregation of the 21 product groups listed in Schedule 3 of the Customs
Tariff Act (Cwlth) aggregated to 15 groups. ‘Miscellaneous’ includes products like: clocks and watches;
musical instruments; bedding and lighting; toys; arms and ammunition; and works of art, collectors’ pieces.
Data sources: ABS (Merchandise Imports and Import Clearances, 2020, unpublished) and UN Comtrade.
Filter three: Australia sources concentrated imports from the main global supplier
The third filter determines whether Australia sourced its concentrated imports from the main
global supplier in a concentrated market. This filter works on the assumption that if Australia
sourced a product from the main global supplier in a concentrated global market then, in the
event of a disruption to the main supplier, there may be few alternative suppliers with the
capacity to meet the shortfall in global supply, and more importantly Australian demand.
Such products may be more susceptible to supply disruptions and global demand spikes,
such as what happened with the supply of face masks and personal protective equipment
(PPE) during the COVID-19 pandemic.
The third filter reduces the 518 concentrated imports to 292 vulnerable imports. This
represents 5 per cent of the total number of products imported by Australia and about
A$20 billion of value. The filter reduces the number of imports sourced from concentrated
markets to one-in-twenty.
116
209
60
15
115108
49
65
2927
32
196
58
103
145
Footwear and headgearRaw hides, skins, leathers and furs
Plastics and rubbersStone and glassMineral productsTransportation
FoodstuffsMiscellaneous
Vegetable productsMetals
Machinery and electricalAnimal and animal productsWood and wood products
TextilesChemicals and allied industries
0 50 100 150 200
Number of HTISC products (8-digit)
Pro
du
ct
typ
e
Concentrated globally Not concentrated globally

52 VULNERABLE SUPPLY CHAINS
INTERIM REPORT
FINDING 4.1
One-in-five products imported by Australia is considered highly concentrated; however,
the global trade data suggest that for many of these products alternative sources of
supply exist and could be utilised should the need arise. The result is that one-in-twenty
Australian imports might be vulnerable to concentrated sources of global supply.
Characteristics of the vulnerable imports
Vulnerable imports are classified by their main end-use, notwithstanding that some products
are likely to have multiple end-uses. Most vulnerable imports are classified as either
consumption or intermediate goods, with fewer capital goods (figure 4.5).
Consumption goods comprise of mostly textile, miscellaneous, food, and clothing products
(figure 4.5a). A closer inspection of textile, and plastic and rubber products reveals that PPE
(which suffered some supply chain disruptions during the COVID-19 pandemic) is included.
While this provides some validation of the filtering approach, the labelling of products in
trade data makes it difficult to precisely identify where the PPE products are in the HTISC
product classification without detailed knowledge of the HTISC.7 Further, there are products
within textiles that are unlikely to materially affect the wellbeing of Australians if imports
were disrupted (such as other clothing items).
Intermediate goods are likely to be inputs into Australian production and tend to encompass
chemical, wood, metal, machinery and electrical, stone and glass, and mineral products. Many
imports of chemicals and those from allied industries (such as fertilisers, pharmaceuticals,
explosives, and soaps) were used as intermediate inputs. For example, disodium carbonate is
identified as a vulnerable import used in the treatment of drinking water.8
Capital goods typically form the highest share of vulnerable imports by value. These goods
include transportation equipment (for which the value changes year-to-year depending on
economic activity and infrastructure projects) and machinery and electrical equipment
(primarily laptops and computers) (figure 4.5b). Imports of natural gas drilling platforms
accounted for A$8.1 billion of the transportation category. This is an example of an irregular
import; removing this product would reduce the value of vulnerable imports by almost half
to A$12 billion.
7 PPE products that are identified as vulnerable imports are classified under HTISC codes 39262029 and
62101090.
8 That said, analysis in appendix D suggests that there are several alternatives to disodium carbonate; and
there are many non-essential uses from which it could be diverted for some time.
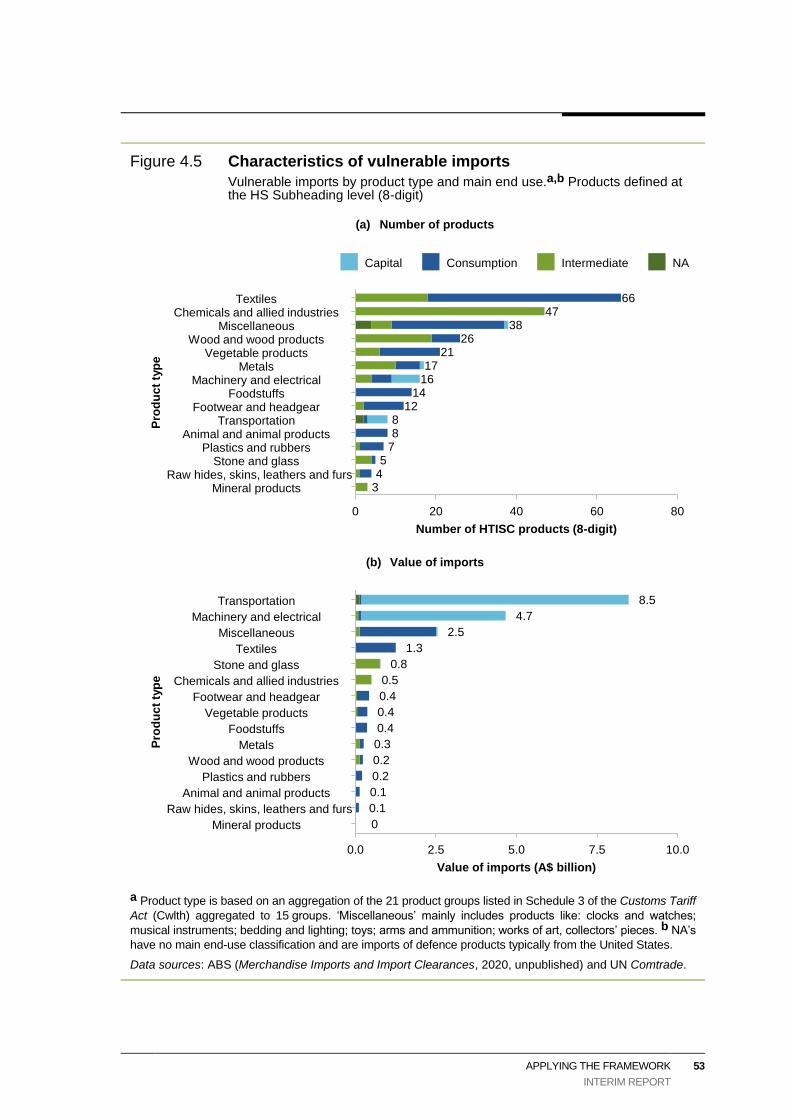
APPLYING THE FRAMEWORK
INTERIM REPORT
53
Figure 4.5 Characteristics of vulnerable imports
Vulnerable imports by product type and main end use.a,b Products defined at the HS Subheading level (8-digit)
(a) Number of products
(b) Value of imports
a Product type is based on an aggregation of the 21 product groups listed in Schedule 3 of the Customs Tariff
Act (Cwlth) aggregated to 15 groups. ‘Miscellaneous’ mainly includes products like: clocks and watches;
musical instruments; bedding and lighting; toys; arms and ammunition; works of art, collectors’ pieces. b NA’s
have no main end-use classification and are imports of defence products typically from the United States.
Data sources: ABS (Merchandise Imports and Import Clearances, 2020, unpublished) and UN Comtrade.
8
47
1412
1617
3
38
7
45
66
8
2126
Mineral productsRaw hides, skins, leathers and furs
Stone and glassPlastics and rubbers
Animal and animal productsTransportation
Footwear and headgearFoodstuffs
Machinery and electricalMetals
Vegetable productsWood and wood products
MiscellaneousChemicals and allied industries
Textiles
0 20 40 60 80
Number of HTISC products (8-digit)
Pro
du
ct
typ
e
Capital Consumption Intermediate NA
0.1
0.5
0.4
0.4
4.7
0.3
0
2.5
0.2
0.1
0.8
1.3
8.5
0.4
0.2
Mineral products
Raw hides, skins, leathers and furs
Animal and animal products
Plastics and rubbers
Wood and wood products
Metals
Foodstuffs
Vegetable products
Footwear and headgear
Chemicals and allied industries
Stone and glass
Textiles
Miscellaneous
Machinery and electrical
Transportation
0.0 2.5 5.0 7.5 10.0
Value of imports (A$ billion)
Pro
du
ct
typ
e
54 VULNERABLE SUPPLY CHAINS
INTERIM REPORT
The value of chemical imports is generally small, but chemicals are likely to be important in
the production of goods that rely on imports of active ingredients (such as those used in
domestic production of pharmaceutical products). The value of such imports may not be a
good indicator of the importance of these products in production. Nevertheless, the value
used does provide a natural way to rank the relative importance of products and for flagging
the starting point for further investigation.
FINDING 4.2
Most vulnerable imports are classified as either consumption or intermediate goods, with
fewer capital goods. But by value, capital goods typically form the highest share of
vulnerable imports. Though important in the long run, disruptions to the supply of capital
goods that might appear vulnerable are unlikely to affect wellbeing in the short run.
The majority of vulnerable imported products are sourced from China (68 per cent of
vulnerable imports) (figure 4.6). China was the main supplier of most vulnerable textile
(which includes PPE), chemical, metal, and machinery and equipment products to Australia
in 2017 (worth a total of A$9.6 billion). The United States and India were the next largest
suppliers of concentrated imports, many of which are not involved in the supply of essential
goods and services.
FINDING 4.3
For many products, the main supplier of vulnerable imports is China, accounting for
roughly two-thirds of those products. Notwithstanding this, the main source of supply
varies by product.
The broad-based data scan identifies many products that, while having high import
concentrations, are unlikely to be essential — either directly or as an input into the
production of essential goods and services — for the material wellbeing of Australians.
Examples of such products include festive decorations, certain types of alcohol, clothing
items, and toys.
However, numerous other products are more likely to be inputs into essential industries.
These include laptops, some chemicals, some PPE, and some products used in drilling for
oil and refining iron and steel. A supply shock to laptops may not result in any short-term
(six months) supply chain disruptions, but a supply shock to chemicals used in water
treatment or in pharmaceuticals could have severe short-term impacts on supply chains (if
no substitutes are available and no reallocation of supplies is possible).

APPLYING THE FRAMEWORK
INTERIM REPORT
55
Figure 4.6 Most vulnerable imports come from China
Number of products, defined at the HS Subheading level (8-digit)
(a) By country of origin
(b) By product type and country of origina,b
a CHIN: China; USA: United States; INIA: India; FRAN: France; SWIT: Switzerland; ITAL: Italy. b Product
types based on an aggregation of the 21 product groups listed in Schedule 3 of the Customs Tariff Act
(Cwlth) aggregated to 15 groups.
Data sources: ABS (Merchandise Imports and Import Clearances, 2020, unpublished) and UN Comtrade.
FINDING 4.4
The list of vulnerable imports consists of a variety of products that are used in production
or consumption, but many of them are not essential to the wellbeing of Australians.
199
7
9
4
39
6
28
Italy
Switzerland
France
India
USA
Other
China
0 50 100 150 200 250
Number of HTISC products (8-digit)
Ec
on
om
y
8
47
14
12
16
17
38
7
4
5
66
8
21
26
3Mineral products
Raw hides, skins, leathers and furs
Stone and glass
Plastics and rubbers
Animal and animal products
Transportation
Footwear and headgear
Foodstuffs
Machinery and electrical
Metals
Vegetable products
Wood and wood products
Miscellaneous
Chemicals and allied industries
Textiles
0 20 40 60 80
Number of HTISC products (8-digit)
Pro
du
ct
typ
e
CHIN
USA
INIA
FRAN
SWIT
ITAL
Other

56 VULNERABLE SUPPLY CHAINS
INTERIM REPORT
4.3 How reliant is the production of essential goods
and services on vulnerable imports?
The narrow definition of essential goods and services captures the basic needs of Australians,
as defined in chapter 3: the provision of water, communications, energy, defence, health,
medicines, logistics, transaction banking services, and government services. The essential
goods and services are linked to the industries that produce them (table 4.1). The production
of these goods and services account for roughly one third of all Australian production (in
value-added terms).
Table 4.1 Mapping of essential goods and services to Australian production data
Essential good or service Input-Output groupa
Banking Finance
Health Human Pharmaceutical and Medicinal Product Manufacturing
Veterinary Pharmaceutical and Medicinal Product Manufacturing
Health Care Services
Residential Care and Social Assistance Services
Water services Water Supply, Drainage and Drainage Services
Communications Broadcasting (exc Internet)
Internet Service Providers, Internet Publishing and Broadcasting, Websearch Portals and Data Processing
Telecommunication Services
Energy Coal Mining
Oil and Gas Extraction
Petroleum and Coal Product Manufacturing
Electricity Generation
Electricity Transition, Distribution, On Selling and Electricity Market Operation
Gas Supply
Logistics Road Transport
Rail Transport
Water, Pipeline and Other Transport
Air and Space Transport
Transport Support Services and Storage
Wholesale Trade
Retail Trade
Government Public Administration and Regulatory Services
Defence
Public Order and Safety
a These industries form part of the 114 industries categorised in the Input-Output tables (see appendix C).

APPLYING THE FRAMEWORK
INTERIM REPORT
57
Australian production of these goods and services are potentially susceptible to disruption
where vulnerable imports play a significant role in their delivery or are a critical input to
their production.
This section focuses on the application of step two of the framework to assess whether any
of the vulnerable imports identified in section 4.2 are inputs into the Australian production
of essential goods and services.
Applying the framework to the production of essential goods and services
Australian producers of essential goods and services may source their inputs locally or from
imports. Some of those imports will be vulnerable.
This section links trade data with data on production to ascertain the extent to which the
production of essential goods and services relies on vulnerable imports.
Conceptually, this process involves:
1. identifying those industries that produce essential goods and services
2. assessing whether any vulnerable imports are inputs into the production of these
industries
3. assessing the degree to which these industries rely on vulnerable inputs, as a share of
total inputs.
Linking the datasets indicates which vulnerable imports are used in which industry but it
does not indicate whether the vulnerable imports are critical to the functioning of the
industry. As a preliminary step toward assessing criticality, the share of inputs to an industry
that are imports is measured, and what share of those imports is vulnerable. (An industry
that primarily uses imports, and vulnerable imports, is more likely to be significantly affected
by a disruption in the supply of imports.)
Data used
The analysis draws on Australian production data from the ABS Input-Output (I–O) tables.
The I–O tables provide detail on the production and final use of goods and services in the
Australian economy in 2016-17, covering 114 industry and product groups.
The list of essential goods and services (as defined in chapter 3) are mapped to the
114 industry and product groups (table 4.1). These include: health, energy, water, logistics,
communications, banking, and government. Generally, multiple industry classifications
make up an ‘essential industry’ (similarly, multiple products make up an ‘essential good or
service’). For example, ‘communications’ is comprised of three detailed industry
classifications: broadcasting, internet, and telecommunications.

58 VULNERABLE SUPPLY CHAINS
INTERIM REPORT
The Commission used the published I–O tables to separate the use of imported products in
production and final use from those sourced locally (appendix C). This disaggregation enables
the identification of whether inputs into essential industries are mostly sourced locally or from
imports. Industries that source the same input locally and from imports will be less susceptible
to any disruption in the supply of imports. The Australian imports data (5950 products) are
then mapped to the more aggregated products used in the Australian production data
(114 products) to indicate the use of vulnerable imports by essential industries.
The ABS does not publish a concordance or mapping from the HTISC classifications used
in the trade data to the classifications used in the I–O tables. The absence of such a
concordance impedes the analysis of supply chain vulnerability. To overcome this, the
Commission has used publicly available and historical mappings (for 2004-05) to construct
a concordance from the trade data (HTISC) to the I–O tables. This process is not
straightforward, and hampered by widespread changes to the trade and production
classifications over time (appendix C).9
How reliant are essential industries on imported inputs?
For each industry, the I–O tables indicate the value of each input into production, including
goods, services, and payments to labour (wages) and to capital owners. For example, the I-O
tables list the value of basic chemicals (domestic and imported, separately) used by each
industry. Given that disodium carbonate is identified as a vulnerable import and classified
as a basic chemical (according to the concordance), an essential industry that uses disodium
carbonate will be assigned a share of the value of the import (from the 2016-17 trade data)
based on the shares of imported basic chemicals that each industry uses. So only part of the
value of the imported basic chemicals product group will be classified as vulnerable — the
part that corresponds to disodium carbonate imports.
Imported inputs form a very small part of the cost structures of the essential industries that
produce essential goods and services (figure 4.7). Payments to domestically-sourced labour
and capital (primary factors) were generally significantly larger than essential industries’ use
of all goods and services in 2016-17. Inputs of domestically-sourced services were also
substantial. Imported products, especially those that are vulnerable, played a very small role
in the production of essential goods and services. For example, the health industry had the
greatest use by value: almost A$2 billion of vulnerable imports, but all other industries used
less than A$800 million each.
9 Timing differences between the global trade (2017) and Australian imports and production data (both
2016-17) meant that 11 vulnerable imports could not be mapped to the I–O tables. The primary reason for
this is that roughly A$8 billion of vulnerable imports occurred in the second half of 2017. This meant that
vulnerable imports in 2016-17 were in the order of A$12 billion, and indicates that irregular imports can
have a material impact on the magnitudes involved.

APPLYING THE FRAMEWORK
INTERIM REPORT
59
Figure 4.7 Imported inputs form a small part of essential industries’ cost structures
Input use by essential industries, 2016-17a,b
a Primary factors are domestic and include payments to labour, the owners of capital, and taxes on
production. b The value (in billions) of vulnerable imports used by each industry are in parentheses.
Data sources: ABS (Merchandise Imports and Import Clearances, 2020, unpublished); ABS (Australian
National Accounts: Input-Output Tables, 2016-17, Cat. no. 5209.0.55.001); and UN Comtrade.
Inputs of goods were the smallest component in the production of essential goods and
services, but varied across industries (figure 4.7). This is because the essential industries
largely consist of service industries, rather than manufacturing industries that use relatively
more goods. For example, health is predominantly a service industry; it is comprised of
health care and residential care, which are both large service industries, and the much smaller
human and veterinary medicine manufacturing industries.
The cost of goods was largest for energy, health, and logistics industries when compared
with communications, government, and water industries (figure 4.8a).
Typically, around half of the goods used in production by an essential industry were sourced
from within Australia, but the relative importance of imported goods varies across industries
(figure 4.8a). For example, the domestic production of petroleum products (such as crude
oil, diesel, and petrol), human medicine manufacturing, and air transport were relatively
more reliant on the use of imported inputs than the production of other essential goods and
services. This makes these industries potentially more susceptible to disruption if the supply
of these imports were disrupted, particularly if the goods are also vulnerable and critical
inputs (that is, there are no substitutes).
137
82
196
149
183
425
21Water
Communications
Banking
Government
Health
Energy
Logistics
0 100 200 300 400 500
Inputs (A$ billion)
Es
se
nti
al in
du
str
ies
Domestic goods Domestic services Non-vulnerable imports
Primary factors Vulnerable imports
(1.9)
(0.72)
(0.16)
(0.28)
(0.01)
(0.48)
(0.03)

60 VULNERABLE SUPPLY CHAINS
INTERIM REPORT
Figure 4.8 Vulnerable imports are a fraction of essential industries’ costs
The use of goods inputs, 2016-17a
(a) By essential industry (aggregated)
(b) By detailed industries in health and logistics aggregates
a Imports may include some services as a result of the mapping of HTISC imports to I–O industries.
Data sources: ABS (Merchandise Imports and Import Clearances, 2020, unpublished); ABS (Australian
National Accounts: Input-Output Tables, 2016-17, Cat. no. 5209.0.55.001); and UN Comtrade.
1
5
28
7
17
37
1
Banking
Water
Communications
Government
Health
Energy
Logistics
0 10 20 30 40
Inputs (A$ billion)
Es
se
nti
al in
du
str
ies
Domestic goods Non-vulnerable imports
Vulnerable imports
6.9
9
2.5
2
4.7
8.9
7
0.8
0.4
1.1
10.5
Transport support
Water transport
Rail transport
Air transport
Road transport
Retail trade
Wholesale trade
Veterinary pharmaceutical
Human pharmaceutical
Residential care
Health care
0 3 6 9 12
Inputs (A$ billion)
Lo
gis
tic
s
H
ea
lth

APPLYING THE FRAMEWORK
INTERIM REPORT
61
Further, the industries of health, logistics, and to some extent communications, energy, and
government, used vulnerable imports in their production — although these imports represent
a fraction of the cost of all imported inputs (figure 4.8a). A more detailed inspection of the
industries that make up health and logistics reveals that health services, residential care, and
wholesale trade use the highest value of vulnerable imports (figure 4.8b).
The finding that vulnerable imports are a very small share of the goods used in essential
industries is significant, but not conclusive. If the results had shown that 99 per cent of goods
used in the health industry were vulnerable imports, this would suggest a significant
vulnerability, but the results show the opposite. The small share of vulnerable imports is
suggestive evidence that vulnerable imports may not be critical to the production of essential
goods and services. That said, the analysis used very broad industry categories, and it is still
possible that, for example, an active ingredient for the production of medicine critical for the
treatment of one condition is vulnerable (see box 5.3 for a discussion of medicine shortages).
FINDING 4.5
Vulnerable imports are a small share of the goods used in essential industries, by value.
This is suggestive, but not conclusive, evidence that vulnerable imports may not be
critical to the production of essential goods and services.
While essential industries used imported goods as inputs into production, many products
could be sourced domestically (figure 4.9). There were 15 products for which imports
accounted for over 60 per cent of Australian supply. If products within this product group
were vulnerable, their supply chain would be more susceptible to disruption, as there is
limited local supply to alleviate disruptions. (These product groups are much broader than
those used to assess vulnerability in the trade data.)

62 VULNERABLE SUPPLY CHAINS
INTERIM REPORT
Figure 4.9 Most inputs used by essential industries are locally sourced
Share of Australian use of each product sourced from imports, 2016-17. Products defined using Input-Output Product Group (IOPG) classification.
Data source: ABS (Australian National Accounts: Input-Output Tables, 2016-17, Cat. no. 5209.0.55.001).
Which vulnerable imports were used in production by essential industries?
Returning to the finer-grained import categories used in the trade data (HTISC), essential
industries used 130 of the 281 potentially vulnerable imports10 identified using the
mechanical processing.11 The remaining vulnerable imports were used by ‘non-essential’
industries.
Use of vulnerable products varied widely across essential industries (figure 4.10). Health
and logistics used more than all other essential industries, with each using around
100 products. In contrast, banking and water used the least.
Many of the 130 products identified by the mechanical processing are unlikely to constitute
critical inputs into these (or other) industries. Examples of such products include women’s
swimwear from China and watches from Switzerland.
10 Only 281 of the 292 vulnerable imports identified in section 4.2 could be mapped to product groups in the
production data (IOPGs).
11 A minimum value filter of A$1 million is used here to screen out products that otherwise met the criteria for
being considered a ‘vulnerable import used by essential industries’. Very small import values arise for some
products as a result of the coarser nature of the mapping of imports and production classification changes over
time (as the I–O products are at a higher level of aggregation than the imports data). Given the small values
involved, these products are unlikely to constitute critical inputs even if they are used by the industry.
Most products are
sourced domestically
Products mostly
sourced from imports

APPLYING THE FRAMEWORK
INTERIM REPORT
63
Figure 4.10 Health and logistics are the greatest users of vulnerable imports
Number of vulnerable imports used in essential industries, 2016-17a
a Products identified as vulnerable if the imports used by an industry were more than A$1 million.
Data sources: ABS (Merchandise Imports and Import Clearances, 2020, unpublished); ABS (Australian
National Accounts: Input-Output Tables, 2016-17, Cat. no. 5209.0.55.001); and UN Comtrade.
Laptops and computer equipment were common inputs across most essential industries. Some
products (such as disodium carbonate) were used by a handful of industries (such as water,
health, and energy). Others were only used by a single essential industry. An example of a
vulnerable product used by a single industry is the use of some PPE by the health industry.
Disaggregating the vulnerable imports used in the production of essential goods and services
by product type reveals that essential industries use many vulnerable imports of textiles and
miscellaneous products (table 4.2). Most of these products, however, are unlikely to be
critical inputs (such as electric blankets, camping gear, and toys). This suggests that the
number of vulnerable imports used by an essential industry does not always reflect a higher
degree of vulnerability to supply chain disruptions.
The analysis of import vulnerability presented here is based on past production data.
Changes to Australian production capabilities may make Australia more or less vulnerable
to supply chain disruption than is currently the case. This implies that the analysis needs to
be periodically updated.
10
1
2
2
anking
Water
Communications
Energy
Government
ealth
ogistics
0 0 60 0 120
umber of S products digit
ssential industries

64 VULNERABLE SUPPLY CHAINS
INTERIM REPORT
Table 4.2 Essential industries use many vulnerable imports of textiles and
miscellaneous products
Number of vulnerable imports used in essential industries, by product type. Products defined at the HS Subheading level (8-digit)
Product typea Logistics Health Govern-ment
Energy Commu-nications
Water Banking
Animal and animal products
4 3 1 0 0 0 0
Chemicals and allied industries
4 7 0 5 0 3 0
Foodstuffs 4 1 2 0 0 0 1
Footwear and headgear
5 8 2 3 1 0 0
Machinery and electrical
6 4 2 8 5 2 1
Metals 3 1 2 3 0 2 0
Mineral products 0 0 0 0 0 0 0
Miscellaneous 23 20 16 4 6 1 0
Plastics and rubbers
4 4 2 2 0 0 0
Raw hides, skins, leathers and furs
3 2 3 0 0 0 0
Stone and glass 5 4 1 1 0 0 0
Textiles 31 36 16 7 5 0 0
Transportation 4 2 2 2 0 0 0
Vegetable products 4 5 1 0 0 0 0
Wood and wood products
4 0 2 0 2 0 0
Total 104 97 52 35 19 8 2
a Product types based on an aggregation of the 21 product groups listed in Schedule 3 of the Customs Tariff
Act (Cwlth) aggregated to 15 groups.
Sources: ABS (Merchandise Imports and Import Clearances, 2020, unpublished); ABS (Australian National
Accounts: Input-Output Tables, 2016-17, Cat. no. 5209.0.55.001); and UN Comtrade.
FINDING 4.6
Since the narrow definition of essential industries used in this study comprises mainly
service producing industries, locally-sourced services are primarily used in their
production, rather than locally-sourced or imported goods. Consequently, vulnerable
imports are a small share in their production costs. Furthermore, many of the vulnerable
products identified, such as textile products, are unlikely to be critical to the production
of these services.
Vulnerable imports that are inputs into the goods-producing industries of petrol refining
and medicine manufacturing are more likely to be critical.
APPLYING THE FRAMEWORK
INTERIM REPORT
65
4.4 Direct and indirect contribution of vulnerable imports
to the consumption of essential goods and services
The narrow definition of essential goods and services are those that are necessary to meet
the basic needs of Australians (chapter 3).
Meeting the basic needs of Australians is about the final consumption of essential products
by Australians (households) or by government (which provides goods and services on behalf
of households). That is, it is about the use of essential goods and services by, or on behalf
of, consumers.
The wellbeing of Australian consumers will be materially impacted by a sustained disruption
to the supply of imports if:
• they directly consume imports of essential goods and services (that is, imports form part
of final demand) or
• they consume Australian-produced essential goods and services whose production relies
on imported inputs (imports are consumed indirectly).
The I–O tables enable the users of essential goods and services to be identified at a relatively
high level (such as individual industries, households, and government).
Importance of essential goods and services in meeting the wellbeing
of Australian consumers
Australian households and government used A$600 billion in essential goods and services
in 2016-17, collectively accounting for almost 56 per cent of the use of all essential goods
and services.12,13
Put another way, household and government consumption of these essential products
accounted for almost half of their consumption of all products (which was A$1.3 trillion).
Health and government services accounted for almost half of household and government
consumption of essential products (figure 4.11). Households and government accounted for
the bulk of the use of these products, in contrast to banking, communications, and energy,
where industry was the main user. The use of water and logistics was evenly divided between
household/government and industry use.
12 The coarse nature of these product categories, however, overstates their importance for the wellbeing of
Australians, as the categories also implicitly include other goods and services that go beyond those needed
to meet the basic needs of Australians.
13 Total use of each product is the total supply of that product in the I–O tables less exports.

66 VULNERABLE SUPPLY CHAINS
INTERIM REPORT
Figure 4.11 The vast majority of essential goods and services used in Australia were produced in Australia
Household and government use of essential products by source, 2016-17a
a Essential products are either produced domestically or sourced from imports. The value of vulnerable
imports used in the domestic production of essential products is shown in red (covered in section 4.3). The
value of vulnerable imports used to directly meet final demand for essential products is shown in yellow.
Data sources: ABS (Merchandise Imports and Import Clearances, 2020, unpublished); ABS (Australian
National Accounts: Input-Output Tables, 2016-17, Cat. no. 5209.0.55.001); and UN Comtrade.
The vast majority of essential goods and services used in Australia in 2016-17 were produced
in Australia — 96 per cent of total use (figure 4.11). This high share reflected, among other
things, the high proportion of services among the list of essential products. Imported final
goods and services played a small role in meeting household and government demand for
essential goods and services, and vulnerable imports played an even smaller role.
Households directly consumed some imports of energy, health, and logistics products. For
example, some households filled their car using petrol refined in Singapore and consumed
medicines manufactured in Belgium and the United States. Notwithstanding this, the share
of these imports found to be vulnerable in 2016-17 was tiny (A$20 million).
As outlined in section 4.3, the indirect use of vulnerable imports in Australian production in
2016-17 was also found to be very small (figure 4.11). As Australian households used only
a share of this Australian production, their indirect use of vulnerable imports is A$2.7 billion.
While the shares of expenditure on vulnerable imports in aggregate Australian consumption
might be tiny, this does not mean that a disruption to their supply would necessarily result
in a negligible impact on wellbeing. For example, the absence of lifesaving medicines
jeopardises the wellbeing of Australians whatever the value of these medicines or their share
in consumption or production.
0 50 100 150 200
Water
Communications
Energy
Banking
Government
Health
Logistics
Use (A$ billion)
Es
se
nti
al
pro
du
cts
Non-vulnerable domestic Vulnerable domestic
Non-vulnerable imports Vulnerable imports
187
185
120
39
31
21
11

APPLYING THE FRAMEWORK
INTERIM REPORT
67
Overall, the low share of essential goods and services that Australians use and that are sourced
from imports is suggestive evidence that most supply chain disruptions may not have a
material and sustained impact on the basic wellbeing of Australians. Moreover, the fact that
most essential products — whether used by households or by industry — were produced
locally points to alternative (domestic) sources of supply that could be accessed in the event
of a disruption to imports, or whose production could be ramped up (if not immediately, then
over time). This is not, however, conclusive evidence because the industry categories and
products considered are broad; in some very narrowly defined essential industries, imports
could be critical. Further, where an import is critical, and its absence would jeopardise the
supply of an essential good or service, then wellbeing would be affected.
FINDING 4.7
Combining imports and production data suggests that the supply of essential goods and
services in Australia is not highly susceptible to a short-term disruption to the supply of
imported goods. Vulnerable imports represent a small fraction of the value of essential
goods and services consumed by Australians — whether that consumption be direct
(final goods, A$20 million out of total consumption of essential goods and services of
A$593 billion) or indirect (as inputs into Australian production, A$2.7 billion). But this
evidence is not conclusive and industry experts are required to determine criticality.
4.5 Possible extensions to this work
The application of the framework presented here could be extended in a number of ways.
First, and most importantly, further work is needed to conclusively determine which
vulnerable imports are critical to essential industries. Industry experts are best placed to
determine which of the concentrated inputs identified and used by essential industries are
critical in the sense that production would not occur without them. These experts have
detailed knowledge of the production processes involved and what substitute products, if
any, could be used in the event of a disruption. There are data-driven methods that could
complement experts’ advice if suitable data is available (appendix D).
Second, the analysis could be improved with a closer inspection of product classifications to
ensure substitute products are grouped together. For example, for some agricultural products
a higher product aggregation is adequate, but for specific chemicals a finer classification
would improve the analysis.
Third, extending the analysis to other years would improve the robustness of the analysis.
Imports in any one year will be influenced by factors specific to that year, and can affect the
analysis. This may particularly be an issue where the items are large and ad hoc in nature.
Examples of such imports may include aeroplanes, ships, trains, military equipment, and

68 VULNERABLE SUPPLY CHAINS
INTERIM REPORT
natural gas platforms. Preliminary analysis suggests that 2016-17 appears to be a reasonably
representative year, but confirming this requires additional work.
Fourth, the analysis only considers tier 1 suppliers (that is, countries that directly supply a
good to Australia, chapter 2), but it could be linked into work on global supply chains. This
would help to better gauge the potential for supply chain disruption arising from our foreign
suppliers being at risk of disruption themselves (that is, consider tier 2 suppliers and above).
These risks could arise from many sources, including:
• disruption to their own input suppliers (whether local or from a third country)
• when different stages of production are located in different countries
• where our suppliers are owned by another firm in a third country, such that, if the parent
firm experiences financial or other difficulties, it may flow through to the subsidiary that
supplies Australia
• where global supply comes from similar parts of the world (such as from the Middle
East, South East Asia, North America or Europe).
Finally, the fact that the ABS confidentialises production and import details for numerous
products suggests limited sources of supply and, hence, may indicate potential vulnerability
to disruption. These products should be investigated further.

SUPPLY CHAIN RISK MANAGEMENT
INTERIM REPORT
69
5 Supply chain risk management
Key points
• Supply chain risk management balances the trade-off between the costs of a disruption — that
is, a potential increase in the cost of purchasing goods and services upstream — with the
opportunity cost of investing in risk management. Risk management is costly, much like buying
insurance to protect against other types of risks is costly.
• To make an effective decision on the level of risk to manage, firms need to understand the
nature of the potential disruption (likelihood, size etc.), and its potential impact to their supply
chains. But this is not always straightforward. Supply chains can be long, complex and opaque,
and information on a firm’s supply chain can be difficult to obtain.
• Biases can also affect the decisions of firms to invest in risk management. For example,
because of their experience with the COVID-19 pandemic, firms focusing on the risks to their
supply chains from a future pandemic, may over-invest in strategies that seek to mitigate this
risk, when other risks may be more probable and imminent.
• Firms will employ risk management strategies, such that the perceived net benefit of their
mitigation exceeds the potential costs of a disruption. Key mitigation strategies used to prepare
for supply chain risks include: no action, stockpiling, supplier diversification, contingent
contracting, and developing domestic capability. These strategies complement other actions
firms take to prevent the risks of a disruption, or respond and recover from one. Different
strategies will perform better under different types of disruptions and contexts, and firms will
likely have to employ a range of strategies to effectively manage risk.
• Risks are best managed by those who have direct incentives to mitigate against them.
Government has responsibility, like any firm, to manage risks in supply chains for which they
purchase and deliver goods and services directly.
• There may be conditions where government intervention in private sector risk management is
justified, such as where the private and public net benefits of risk management diverge. In
these cases government could implement a range of options — from providing better
information to taking more direct ownership of risk management (such as maintaining
government stockpiles, mandating or subsidising private stockpiles, or maintaining domestic
production capacity). But higher levels of government intervention impose higher costs on the
community, and also decrease firms’ incentives to invest in risk mitigation. Even where an
in-principle case for government intervention exists, any case for intervention needs to
demonstrate that the benefits of intervention outweigh the costs.
• Governments should also focus on ensuring firms do not face unnecessary constraints in how
they plan and respond to disruptions. This includes maintaining a respected, rules-based and
low-cost trading system, and a responsive regulatory environment.

70 VULNERABLE SUPPLY CHAINS
INTERIM REPORT
Firms operate in a world of uncertainty, taking risks to pursue their objectives. With risks
come the possibility of success but also failure, and adverse events can have significant cost
implications for firms and the community. This chapter establishes a framework to better
understand risk management of a firm’s supply chain (section 5.1), and then explores the
key elements to managing risks, including:
• understanding risk (section 5.2)
• identifying how to best manage supply chain risks (section 5.3)
• identifying who should manage risk, including the role of government in managing
supply chain risks (section 5.4).
5.1 A framework for managing risks
Many firms rely on complex supply chains made up of many products, customers, channels,
and geographies. While these firms decide to operate this way to improve supply chain
efficiency and drive higher revenues, this also carries risks (chapter 2).
Risks of a disruption can be characterised by the probability of an event occurring and its
consequences. There is uncertainty about what, when and where disruptions will occur (for
example, they could be geopolitical events, natural disasters or economic crises), as well as
their intensity and impact. Firms manage routine disruptions that cause small impacts
through hedging, forward and other contract types, and by maintaining small inventories.
For example, Dell Inc. keeps some inventory of low-cost components in the United States
in an effort to minimise the effects of delays in the deliveries of some components to the
United States (Chopra and Sodhi 2004, p. 55).
Other disruptions can have larger impacts on a firm’s operations if not managed effectively,
and some will have market-level implications that threaten the supply of essential goods and
services to the community. This study focuses on these latter types of disruptions that could
impact the functioning of the economy, national security and Australians’ wellbeing.
Managing risks in a supply chain
Risk management can be used to mitigate the costs of disruptions, and better manage their
consequences once they occur. Broadly, risk management involves three steps:
• understanding risk — identifying which risks are faced and their likely consequences
(section 5.2)
• treating risk — making decisions on how to best manage risks, such as reducing exposure
to risks through diversification or investing in capacity to recover from a disruption
(section 5.3 and box 5.1)

SUPPLY CHAIN RISK MANAGEMENT
INTERIM REPORT
71
• owning risk — determining who is responsible for managing risks that affect a supply
chain; as well as monitoring and reviewing risks — regularly reassessing risk
management arrangements to ensure they are still fit for purpose (section 5.4).
The impacts of certain disruptions can be lessened by improving how a firm anticipates, reacts
to and recovers from a disruption. It is useful to think about the various stages of building
supply chain resilience — from prevention through to recovery (box 5.1) — although many
risks will likely be treated in multiple stages and strategies. Some risks (or impacts from certain
disruptions) will not be managed because they cannot be foreseen. Others will not be managed
because the cost of mitigation is too high relative to the potential impact. (Risk mitigation
strategies are covered in section 5.3.)
Risk management does not mean that all disruptions identified by a firm can be avoided, but
their effects can be reduced. Earthquake proofing a building does not mean that it would be
completely protected from earthquake damage, but will likely reduce the amount of damage
that occurs in the event of an earthquake. The initial cost of risk mitigation would be borne
regardless of whether an earthquake occurs, but this form of physical insurance (and minor
repairs) would be chosen when it is cheaper than the expected costs of major building repairs
if an earthquake occurs and no mitigation activities are undertaken.
Trade-offs must be made
A supply chain disruption effectively causes a sudden increase in the cost of supply. When
a source of supply disappears completely, its cost can be thought of as having increased
prohibitively. Although it might be possible to obtain supply from another source, it is likely
to be at a much higher cost.
But managing risks also has costs. People take steps to protect their health, income and assets
against risks by buying insurance but have to pay a premium based on what is insured and
the risks being insured against. Likewise, investing in strategies to manage supply chain risks
(such as diversifying supply, stockpiling, or bringing manufacturing onshore) involves
costs — the investment is equivalent to paying insurance premiums. Thus, firms accept
higher costs in good times in order to lower costs in the event of a shock.
Resources, such as the time, money or effort needed to understand, manage and deal with
risks, have opportunity costs — that is, they cannot be devoted to other uses. These costs are
part of all the other costs of supplying goods and services; they contribute to the price of
goods and services, and fall eventually to households and taxpayers.

72 VULNERABLE SUPPLY CHAINS
INTERIM REPORT
Box 5.1 Stages of supply chain risk management
Risk management strategies can be thought of in a prevention, preparedness, response and
recovery (PPRR) paradigm, sometimes used in emergency and disaster management. In the
context of this study, strategies seek to improve supply chain resilience by:
• preventing a disruption (or lowering the likelihood of a disruption occurring)
• preparing the rest of the supply chain to avoid the costs of the disruption
• improving the speed and effectiveness of the firm’s response
• facilitating a firm’s recovery from a disruption.
Firms make decisions about investing in each of these stages before a disruption, but naturally
some strategies will only come into effect after a disruption has occurred (response and recovery).
Different risks are better treated in different stages. For example, a predictable risk (such as the
potential impacts of the United Kingdom withdrawing from the European Union) might best be
treated in the prevention stage. However, an unknown, highly uncertain risk (such as a large
storm) might be better treated through response and recovery (or in preparatory actions that will
help more effective response or recovery after a disruption). A combination of different strategies
used at different stages is likely the most effective approach to managing risks.
The figure below outlines some of the different strategies available to firms.
Sources: Hopp et al. (2012, pp. 24–26) and PC (2014b).
Effective risk management involves purchasing the right amount and type of insurance
given: the benefits of the different strategies; the probability of a disruption; the estimated
costs of a disruption; the firm’s degree of risk aversion; and the opportunity costs of the
resources needed to manage risks.
A key part of making the appropriate trade-off is to identify an acceptable degree of risk
aversion — the willingness to bear some risk of loss rather than devoting additional
Locate factories,
suppliers or
warehouses in areas
that are less prone to
disruption
Choose suppliers that are less vulnerable to disruptions
Invest in risk management for critical suppliers
Prevention
Reduce the
likelihood of a
disruption
Hold additional
buffer stock
Have additional
capacity among other
suppliers
Diversify supply
network and
geographic footprint
Delayed product differentiation
Use contingent contracting
Take out insurance
Preparedness
Prepare the rest of the supply chain to mitigate costs of the disruption
Invest in early
detection systems
Have contingency
plans in place ahead
of a disruption
Have flexible
manufacturing
processes
Use dynamic pricing
and promotion
Response
Improve the speed and effectiveness of the firm’s response
Develop post-disruption recovery plans
Recovery
Recover from the disruption

SUPPLY CHAIN RISK MANAGEMENT
INTERIM REPORT
73
resources to reduce the risk. At some point, people choose to live with some exposure to risk
so that they can continue to use their resources in other ways. Where that point is depends
on a firm’s aversion to risk, the cost of risk management, and the probability and cost of
disruptions. It also depends on firms being able to understand their risks. However, firms
operate in an environment of uncertainty, where they have imperfect knowledge of future
events, or where it may be impossible or too costly to estimate the probability or consequence
of such events occurring. In this environment, it may not always be possible for firms to
make effective trade-offs in managing supply chains risks. That said, firms still manage this
type of uncertainty by making provisions for contingencies about which they might have
little information on.
In the context of this study, we care about effective risk management from a community
perspective — that is, balancing trade-offs given the impact of a disruption to the community
and society’s degree of risk aversion. This means choosing the balance of risk management
strategies that maximises community wellbeing over time.
While ‘insurance’ provides a useful analogy to highlight the costs of risk management
strategies that need to be traded off against an uncertain benefit if a disruption occurs, there
are some important distinctions between risk management strategies covered in this study
relative to a common insurance product. First, this chapter focuses on risk management
strategies that provide firms physical restoration of their supply chains, rather than a pure
financial compensation in the event of a disruption. Firms can purchase business continuity
insurance to protect themselves financially from supply chain risks, but this form of
insurance does not protect the community from losing access to essential goods or services
when a disruption occurs. Second, while pooling of risks is commonly used by insurers to
manage risks, some firm-level risk management strategies (such as stockpiles or domestic
production) do not involve diversification of risk.
Effective risk management is hard to do in practice. First there are a broad range of supply
chain risks (chapter 2); and second supply chains are complex and opaque to assess for risk,
and there are many possible strategies available that are suitable to address different types
of risks. That said, some principles can help. In particular, management strategies are best
implemented by those who are close to the risk, have the best information required to manage
it, have incentives to do so, and face few impediments.
5.2 Understanding risk
For firms to manage risks effectively, they need to understand their supply chains and how
risks make them vulnerable. Things that may make a supply chain vulnerable (and therefore
should be understood) include: its flexibility, its length, and its geographic clustering
(chapter 3).
Gathering information to better understand risks is not costless. This may be particularly
problematic for small firms, who lack scale to benefit from large investments required to

74 VULNERABLE SUPPLY CHAINS
INTERIM REPORT
better understand the full set of their upstream suppliers. Survey data indicate that small
firms were far less likely to ‘assess and record’ changes in their supply chain as part of their
supply chain risk management activities (17 per cent for businesses with 0-4 employees,
compared with 42 per cent for businesses with 200 or more employees) (ABS 2017).
Understanding supply chain risks can be difficult. For example, for Unilever’s network of
nearly 60 000 suppliers (Unilever 2020), the costs of understanding what each supplier does
and what risks they face rises with each additional node. Firms may only have a murky view
of their supply chain beyond the first tier of suppliers. This can lead to problems when
disruptions occur further upstream. For example, in 2007 Menu Foods Corp., a producer of
pet food, had to recall more than 60 million cans and pouches of dog and cat foods, following
a number of reported deaths. The deaths were linked to contaminated wheat gluten, which was
procured from ChemNutra, who, unbeknownst to Menu Foods, had outsourced its production
to Xuzhou Anying Biologic Technology Development Co. Ltd (Yang et al. 2009, p. 192).
A firm may not necessarily need to understand their entire supply chain to effectively manage
their risk. If each firm in a chain recognises the risk from ‘one level up’ and takes appropriate
action, then the need to understand risks deeper into a firm’s supply chain may be unnecessary.
For example, if Menu Foods was reasonably assured that ChemNutra was managing their
supply chain risks, they would not have to worry about understanding risks beyond their first
tier of suppliers. Well-designed contracts (with damages, for example) can encourage suppliers
to manage and share information about their risk. However, this is not always possible in
practice. One reason for this is asymmetric information — that is, where a supplier has access
to private knowledge of their own financial status, state of operations, or input sources that is
not known by the purchaser (Yang et al. 2009). The supplier may not be willing to share the
information where it is proprietary or would hurt their commercial interests, such as appearing
riskier to prospective purchasers. This risk was highlighted in the case where Land Rover was
unaware of, and therefore unprepared for, the looming bankruptcy of UPFThompson — the
sole provider of chassis for their Discovery model (Yang 2009, p. 5).
Finally, cognitive and behavioural biases can affect how people and firms perceive risks.
Cognitive biases mean that firms can underprepare for low probability events, and
overprepare for events that have occurred recently. During a long period of relative stability,
the probability assigned to disruptions declines. This can lead to firms under-investing in
risk management strategies. Cognitive biases also mean that firms can over-estimate the
probability of a disruption for a period following the occurrence of an event, leading to firms
over-investing in strategies designed to deal with that specific type of disruption (to the
detriment of investing in strategies to deal with other types of disruptions). Such biases mean
that firms may not always make full use of available information, or may evaluate the
information inadequately.
Many firms, especially large ones, have sophisticated structures to overcome such biases,
such as risk governance committees, and frameworks to systematically assess, plan for, and
manage risks. Despite this, there is evidence that firms do not always respond rationally to
risk. For example, a number of studies have shown that investments to guard against

SUPPLY CHAIN RISK MANAGEMENT
INTERIM REPORT
75
cyber- and IT-security threats have declined just as these threats have become more frequent
and severe (Gaudenzi and Siciliano 2018, p. 87).The pharmaceutical industry showcases
how different factors can impact an industry’s understanding of a single supply chain
(box 5.2), for example:
• pharmaceutical supply chains are becoming longer and more complex as manufacturers
source ingredients offshore from cheaper sources of production (mainly China and India)
• asymmetric information exists between manufacturers and wholesale purchasers, where
manufacturers have more detailed knowledge of their quality control and risk
management processes
• smaller pharmacists may lack scale to understand supply chains in depth
• the COVID-19 pandemic’s effect on the supply chain has likely been overemphasised,
making it difficult to determine what is a normal shortage and what is caused by the
COVID-19 pandemic.
How do firms understand supply chain risks?
Firms, as part of their usual risk management practices, gather information on risks facing
their supply chains. To better understand risks, firms work collaboratively with suppliers to
understand, and regularly report and review potential risks, and invest in technology and
data analytics to help identify risks deeper into their chain of suppliers. For example:
Unilever has developed a systematic approach to identify critical suppliers (Unilever 2020);
Toyota has developed a supply chain database that maintains information on parts and
identifies vulnerabilities across its 650 000 supplier sites (Webb 2016); and GM has an
information system combining information from suppliers and logistics hubs to monitor
incidents (Lund et al. 2020, p. 77).
The Critical Infrastructure Centre, within the Australian Government Department of Home
Affairs, also conducts risk assessments to monitor market-level vulnerabilities of key assets
to espionage, sabotage and coercion risks. They consult with state and territory governments,
regulators, and private owners and operators to understand:
• a company’s cyber security and physical security
• security audits undertaken by a company
• emergency management plans
• redundancies
• offshoring and outsourcing of operations
• existing regulatory regimes and controls (DoHA 2020c).

76 VULNERABLE SUPPLY CHAINS
INTERIM REPORT
Box 5.2 Pharmaceutical supply chains
Pharmaceutical manufacturing involves two main stages. First the production of active
pharmaceutical ingredients (APIs), and second, formulations production — where the APIs are
transformed to turn the drug into tablets, capsules, creams, etc. (Horner 2020). Once the drug is
manufactured, pharmacies buy medication from wholesalers, sell them to consumers, and are
then (in many cases) reimbursed by the government under the Pharmaceutical Benefit Scheme
(as well as receiving a nominal mark-up and dispensing fee).
At the beginning of the COVID-1 pandemic, many raised concerns about Australia’s reliance on
imports for APIs and other pharmaceutical inputs. Australia imports most of its pharmaceutical
goods from Europe and the United States. However, the United States and Europe are
increasingly relying on APIs manufactured in India and China (Butler and Sorrell 2020). As of
2017, China produced 40 per cent of global APIs and India supplied 20 per cent of global exports
of generic medicines by volume (UK MHRA 2017, p. 10).
During the COVID-19 pandemic, disruptions to Indian and Chinese production of APIs led to
concerns of shortages in Australia (ABC 2020). Panic buying and stockpiling ensued and the
Australian Government implemented purchasing limits to ensure equitable access to medicines
(PSA 2020, p. 6). Despite concerns, the pharmaceutical supply chain functioned well and
‘demonstrated significant resilience’, according to Medicines Australia (Davey 2021). This was
helped by Chinese manufacturing recovering quickly and India removing export bans. However,
many companies also had risk management strategies in place, such as emergency stocks of
ingredients, and had manufacturing capacity in multiple locations (Mullin 2020). The Therapeutic
Goods Administration also worked with industry through the Medicine Shortage Working Party to
manage medicine shortages (TGA 2020a, p. 5).
However, a lack of transparency did lead to confusion about whether there were actual shortages
of medicines. As noted by the Pharmaceutical Society of Australia (2020, p. 6) in their submission
to the Senate Committee on COVID-19:
While pharmaceutical wholesalers may have been in contact with the Therapeutic Goods Administration
about supply issues, [information on shortages and wholesale limits] were often not shared more broadly
with practitioners at the coalface, such as pharmacists and doctors.
Shortages of other medicines caused by the COVID-19 pandemic have also been reported, such
as some hormone replacement therapies and antidepressants (Ross 2021). However, this does
not appear to be out of the ordinary. According to the Therapeutic Goods Administration, the
average monthly total of national medicine shortages published on the Therapeutic Goods
Administration website in late 2020 was comparable with the average in 2019 (Davey 2021).
Medicine shortages were common even before the COVID-19 pandemic, affecting patients,
doctors and pharmacists (Tan, Moles and Chaar 2016). The combination of intense price
competition (especially in the generics market) and a lack of transparency in supply chains
hampers the ability of firms to accurately assess (and therefore reward) good quality management
and supply chain resilience, leading to shortages. The pharmaceuticals industry is also highly
regulated, making entering the market, or modifying existing facilities to respond to a crisis, a slow
and costly process (US FDA 2019).
Technological advances have made it easier for firms to understand their supply chains
(box 5.3). Advances in tracking technologies, data analytics and machine learning have
made it easier to predict where and when disruptions might occur. These advances have also
made it easier to access real time information about disruptions, facilitating a quicker

SUPPLY CHAIN RISK MANAGEMENT
INTERIM REPORT
77
response and recovery. For example, consumer goods manufacturer Procter & Gamble has
integrated multiple types of real-time data for its suppliers and distributors, including
inventory levels, road delays and weather forecasts. It also runs scenarios in the event of a
disruption to identify effective solutions (Lund et al. 2020, p. 76).
Box 5.3 Supply chain technological advancements
The internet of things (IoT)
IoT allows for the tracking of location, weather conditions, environmental status, traffic patterns
and more. This allows supply chain managers to monitor assets throughout the logistics journey,
track shipments and inventories, and whether anything needs to be remedied. One of the risks
and costs associated with the use of IoT is the increased vulnerability of a chain to cyber-attacks.
Blockchain
Blockchain is a distributed ledger technology, in which a record of an asset or transaction is
maintained in multiple locations. Records of transactions can be used to track the origin of goods
and establish trust in shared supplier information.
AI, machine learning and analytics
AI, machine learning and analytics are increasingly used to automate many aspects of supply chain
management, including warehouse operations, transport and logistics, and inventory management.
These technologies are particularly useful: as supply chains become more complex, as data
processing capacity increases, and to the extent that decision-making can be automated.
Source: Stackpole (2020).
FINDING 5.1
Effective risk management requires a good understanding of a firm’s risks to ensure that
the net benefits of any investment to mitigate the costs of disruptions is matched by their
potential effects and costs.
Supply chain risk management is similar to buying insurance for any other types of risk.
In effect, a firm pays an insurance premium upfront to invest in a range of strategies such
as, stockpiling, supplier diversification, contingent contracting, and domestic capability, to
insure itself against potentially large cost increases if a disruption occurs. The focus of
these risk management strategies is on the physical restoration of supply chains, rather
than taking out insurance for a pure financial compensation in the event of a disruption.

78 VULNERABLE SUPPLY CHAINS
INTERIM REPORT
5.3 Managing supply chain risks
Risk management strategies
While it may not be possible to foresee all potential risks facing a firm, those that take action
to understand their supply chain risks will work to effectively mitigate their impacts — that
is, firms use risk management strategies, such that the net benefit of their mitigation activities
outweighs the expected costs of potentially foreseeable disruptions.
This section focusses on supply-side risk management strategies that firms use to mitigate
the impact of a shock that has the potential to disrupt their supply chain. (Particularly focused
on strategies that physically restore access to goods and services, rather than provide
financial compensation to secure a firm’s future operations.) In the typology of box 5.1, these
are prevention/preparedness strategies, which support the ability of firms and economies to
respond and recover following a disruption. These strategies complement those that firms
use to prepare for a more predictable disruptive event affecting their supply chain.
Firms are more adept at handling the ‘uncertainties that businesses face on a day-to-day
basis, such as delays in product deliveries, fluctuations in consumer demands, and product
shortages’ (O’Neil 2016). For example, at its Kooragang Island ammonia plant, Orica
maintains stockpiles of ammonium nitrate that it uses primarily to manufacture explosives
for mining, which it describes as ‘just-in-time inventory’. That is, it maintains a small
stockpile of about 6000 to 12 000 tonnes of ammonium nitrate, while mining operations take
about 8000 tonnes from its site every seven to ten days (Orica 2020).
The rest of this section focuses on the costs and benefits of efforts to deal with unexpected
but highly disruptive supply chain events.
Supply-side strategies for unexpected (and large) disruptions
No action
As a baseline for our analysis of risk management strategies, it is important to recognise that
‘no action’ can be an effective strategy. This is where firms accept that some residual risk is
always present, and that it would be too costly to mitigate its effects. In other words, where
the upfront investment needed to mitigate is too high given the expected cost of the
disruption (and the relative risk appetite of the firm), the firm will adapt its operations and
live with some risk. For example, McKinsey & Company noted that many firms have
accepted the likely impacts from the United Kingdom leaving the European Union (‘Brexit’).
For many companies, the UK market is simply not large enough to dedicate significant resources
to prepare for Brexit. They believe that the consequences of Brexit will be short-lived operational
issues that will ease within a few weeks or months. … Other companies are simply ready to accept
the risk of longer lead times due to customs, stating that they ‘don’t care; customers will simply
have to wait longer and pay a bit more; it affects the entire industry.’ (Alicke and Strigel 2020)

SUPPLY CHAIN RISK MANAGEMENT
INTERIM REPORT
79
This shows that when firms assess mitigation actions to be too costly relative to the expected
size of the disruption, they will accept the potential consequences and adapt their business
accordingly.
Decisions on whether to mitigate (and to what extent) rely on firms being able to understand
their risks and estimate their consequences. In most circumstances, firms operate in an
environment of uncertainty, where they have imperfect knowledge of future events. In
others, it can be impossible or too costly to estimate the probability or consequence of such
an event occurring. In these situations it is difficult for a firm to undertake effective
mitigation at reasonable cost.
Accepting risk, however, may not be an effective strategy where better information would
have predicted large impacts or identified a more cost-effective mitigation strategy.
Stockpiling
Stockpiling refers to firms holding inventories of goods in storage that can be made available
when supply chains are disrupted. Stockpiling here refers to inventories larger than would
otherwise be maintained under purely cost-minimising, just-in-time sourcing practices (as
per the Orica example above). Stockpiles can be part of an alternative to just-in-time that is
sometimes referred to as a ‘just-in-case’ approach to production and inventory management.
Stockpiles are best suited to address shorter-term interruptions to the supply of critical goods,
while other sources of supply are found or existing supply chains are restored.
The costs of maintaining a stockpile can vary depending on the good, but in general includes
storage and maintenance costs, such as rotating materials and disposing of expired products.
For goods with a relatively short shelf life, stockpiling is either not possible or very
expensive. For example, the Australian Government acquired over 10 million units of a
COVID-19 testing kit (the acquisition was funded by the private Minderoo Foundation),
which has a shelf life of only six months. Given the slower than expected need for testing in
Australia and the availability of a number of other testing kits, there was a risk that some of
those kits subsequently might be wasted (Knaus and Smee 2020). Swabs used for RT-PCR
testing (one of the most accurate laboratory methods for detecting, tracking and studying the
COVID-19 coronavirus) have a relatively short shelf life of 15-36 months, which may also
make them costly to stockpile (Johnson 2020).
In order to be effective, a stockpiling strategy relies on firms making good assessments of
future vulnerabilities to their supply chains. For example, prior to the COVID-19 pandemic,
the National Medical Stockpile (NMS) held very limited stocks of personal protective
equipment (PPE). The ANAO noted that pre-pandemic replenishment planning for the NMS
‘set out procurement priorities that were focused on chemical, biological, radiological or
nuclear (CBRN) threats and an influenza pandemic and did not address other potential health
threats’ (ANAO 2020, p. 8). The ANAO also noted that procurement planning was not
adequately coordinated with states and territories, who have primary responsibility for the
supply of PPE (ANAO 2020, p. 8). Stockpiles provide limited capacity to respond to an

80 VULNERABLE SUPPLY CHAINS
INTERIM REPORT
unexpected disruption. In effect, a small stockpile provides a small amount of insurance,
which might be an effective part of a strategy that relies on a stockpile in the very short term,
while responses are put in place. In the case of the COVID-19 pandemic, the NMS stockpiles
could not meet Australia’s needs for PPE beyond the very short term, but it was quickly able
to use its contacts and knowledge of suppliers to source more PPE (box 5.4).
Box 5.4 The National Medical Stockpile
The Australian Government National Medical Stockpile (NMS), managed by the Department of
Health, provides strategic reserves of pharmaceuticals, vaccines, antidotes and personal
protective equipment (PPE) for use during the national response to a public health emergency
which could arise from natural causes (risks) or terrorist activities (threats). It is intended to
supplement state and territory supplies in a health emergency.
Prior to the COVID-19 pandemic the NMS held a small stock of PPE (12 million P2 masks and
9 million surgical masks) because state and territory health agencies have primary responsibility for
equipping public hospitals and other health facilities. By 30 September 2020, the NMS had
significantly increased its purchasing of PPE equipment, including 166 million P2/N95 and
595 million surgical masks, and distributed around 21 and 56 million of these masks respectively.
(Previously, around 3.5 million P2 masks were distributed during the bushfire emergency in January
2020, and around 2.1 million pieces of PPE were distributed during the 2009 swine flu pandemic.)
Procurement was guided by estimates of expected usage of PPE and other medical products.
This was based on assumptions about the rate of spread of the virus, the level of interventions,
hospitalisation rates and how products are used. This information changed. The ANAO (2020,
p. 58) for example, noted ‘an initial estimated demand of 00 million to 1.2 billion surgical masks
was reduced in April to less than 200 million due to the status of COVID-1 at that time.’
The quantities held prior to the pandemic needed to be expanded significantly beyond the small
initial stockpile to meet expected demands, and the NMS (working closely with other government
agencies) demonstrated strong capability as a bulk purchaser of these essential products by
being able to secure supplies during a period of high international demand. The Australian
Government’s contracts (as at 31 August 2020) secured sufficient PPE, medical equipment
and COVID-19 test kits to complement the small stockpile that could not meet Australia’s needs,
but offered a short term buffer.
At the outset of the COVID-19 pandemic, the NMS was valued at $123 million. The Australian
Government provided around $3.23 billion to the Department of Health to bolster reserves of PPE
and other medical equipment between March and May 2020.
Sources: ANAO (2020, pp. 6–7; 58; 61); Department of Health (2020, p. 1); Doggett (2020).
Supplier diversification — sourcing goods from a range of suppliers across firms
and around the globe
Diversifying suppliers is about improving the reliability of supply by spreading risks across
many possible sources. Different suppliers are exposed to different risks and disruptions, and
respond to them differently, so relying on a range of suppliers — not just on the lowest-cost
supplier — will likely mitigate the cost of disruptions affecting certain suppliers.
SUPPLY CHAIN RISK MANAGEMENT
INTERIM REPORT
81
Diversification also helps firms deal with uncertainty. Where risks are difficult to anticipate
and probabilities of disruption difficult to estimate, having access to a range of suppliers is
likely to cover firms against a wide range of potential risks (essentially pooling risks). For
example, if there is an unexpected geopolitical event between Australia and another country,
access to goods from a third country supplier could be ramped up to make up any shortfalls
from this disruption.
Cochlear, for example, used outsourcing to solve potential capacity constraints in its
manufacturing of hearing implants. According to Raz and Stonecash (2004, p. 2):
[Cochlear] undertook to enter into a number of outsourcing arrangements with various firms around
the globe. At one stage, the company had over 250 outsourcing contracts. To ensure security of
supply, the company often outsources each component from two or three different suppliers.
Investing in relationships with several suppliers means that they can be available to bolster
supplies when disruptions to other suppliers occur. The level of investment will likely
depend on the confidence firms have about the suppliers in their chains, or the limited risks
in not having full transparency. Greater confidence can also be developed with contractual
obligations set on suppliers along the chain.
The importance of diversifying suppliers was highlighted in 2000, when a fire at a Philips
semiconductor plant in the United States disrupted supplies of a crucial component in the
production of Nokia and Ericsson mobile phones. Nokia officials noticed a glitch in supply
even before Philips told the company and acted quickly to find alternative sources across
Europe, Asia and the United States. ‘They redesigned chips on the fly, sped up a project to
boost production, and flexed the company’s muscle to squeeze more out of other suppliers
in a hurry’ (Latour 2001). Ericsson moved more slowly.
Unlike Nokia, [Ericsson] didn’t have other suppliers of the same chips, known as RFCs, for radio
frequency chips. In the end, Ericsson came up millions of chips short of what it needed for a key
new product. Company officials say they lost at least $400 million in potential revenue, although
an insurance claim against the fire may make up some of it. (Latour 2001)
The effectiveness of a diversification (or any other mitigation) strategy is limited when it applies
to a ‘diamond-shaped’ chain. This is where ‘a firm uses multiple tier 1 suppliers who in turn use
a limited number of tier 2 suppliers, who all use the same upstream source … From the firm’s
point of view, the supply chain may appear to be composed of a diverse set of suppliers, often
in different countries. However, the reality is that one firm, or a limited number of firms, provides
critical materials to all the suppliers’ (Slowinski, Latimer and Mehlman 2013, p. 21) This
reinforces the importance of understanding the supply chain (section 5.2).
The costs of diversifying suppliers include developing and maintaining commercial
relationships across multiple potential supplying firms or countries; and where multiple
suppliers are established before a disruption, incurring average costs that are higher than if
using the minimum cost provider. Diversification typically forgoes economies of scale in
production and in shipping. Purchasing larger quantities, more consistently, from a single

82 VULNERABLE SUPPLY CHAINS
INTERIM REPORT
supplier can also increase a firms’ ability to influence the supplying firms’ risk management
strategies and ability to recover from disruptions.
Robust supplier relationships
In 1997, Toyota (and its suppliers) relied on just-in-time production, and maintained limited
inventory of each of the over 30 000 components used in the production of a vehicle. While such
inventory management was sufficient to deal with a minor supply chain disruption, it was not
adequate to mitigate the impacts of a major fire to its sole supplier of a small but crucial
brake-related part. This event threatened to halt production for several weeks as Toyota only
held 2 to 3 days’ worth of stock of this part. Toyota was, however, able to overcome that
disruption by collaborating with over 200 firms in its established network of suppliers to produce
the crucial component (around 70 firms took direct responsibility for production — some
producing the part for the first time) (Nishiguchi and Beaudet 1997, pp. 1–2; 15).
Toyota’s strong relationship with its suppliers has been extensively studied as a source of
strength for Toyota. Suppliers demonstrate flexibility and commitment to Toyota, because
Toyota is committed to retaining and rewarding its suppliers (Nishiguchi and Beaudet 1997).
The experience of Toyota in 1997 showed how its investment in its supplier networks was
crucial in overcoming a supply chain disruption. The various capabilities Toyota developed
through institutionalised problem-solving activities within its group of suppliers also helped
ensure the effectiveness and rapidity of the collaboration effort across its supplier networks,
including the sharing of intellectual property, and human and physical capital (Nishiguchi
and Beaudet 1997, p. 2).
While it may be possible to establish new relationships when a disruption occurs, a crisis
makes this more difficult and more costly than if the relationship exists already. For example,
during the pandemic, travel restrictions made it difficult to meet with new suppliers.
Moreover, firms were unable to inspect products or the supplier to assess quality, and were
competing with other firms seeking to repair their own supply chains. Further, alternative
suppliers may not have capacity to expand production for new customers.
Contingent sourcing
Firms can enter into option contracts with alternative suppliers. This type of contract
specifies the cost of reserving a number of units of a good that the firm would have the option
to purchase. Under an option contract, the price of the reserved units is higher than the price
of committed units under a regular purchasing contract. This means that rather than bearing
a higher average cost of supply from relying on many suppliers, a firm would only bear
additional marginal costs when disruptions occur (Tomlin 2006, p. 642).
Many countries have entered into advanced purchasing agreements to secure access to
vaccines against COVID-19, some of which stipulate an option to buy additional units of a
vaccine. For example, the United States signed a supply agreement with Moderna to provide

SUPPLY CHAIN RISK MANAGEMENT
INTERIM REPORT
83
100 million doses of their vaccine candidate for US$1.525 billion (which includes a
US$300 million incentive payment if emergency use authorisation is obtained by 31 January
2021). The U.S. Government also has the option to ‘purchase up to an additional 400 million
doses at a fixed price of US$1.65 billion per 100 million doses by specified dates in the
agreement’(Moderna, Inc 2020, p. 30).
This form of contracting is particularly common in high-tech industries that face price
fluctuations as demand and technology change rapidly. Hewlett-Packard, for example, has
designed a customised option contract for memory chips, where the firm pays suppliers a
premium for the option to buy a fixed quantity of memory devices at a fixed price, and will
exercise this option if the market price increases above the fixed price, but would let the option
lapse and buy in the open market when the market price is lower (Fu, Lee and Teo 2010, p. 2).
This strategy requires upstream firms to be flexible, that is, to have the capability and capacity
to expand or contract their production volumes to meet changing demands. It may also require
the firm to have some flexibility to be able to adapt to critical inputs that might not be exactly
the same as those from the primary supplier. These arrangements involve additional costs, for
example, requiring changes to machinery to be able to use parts of different dimensions. Firms
can reduce these costs by postponing the point of product differentiation (that is, keeping
production in a generic form as far down the production line as possible) to ensure they can
use different components from other suppliers (as Nokia could, in the example above, by
reconfiguring its generic mobile phone quickly so it could accept a slightly different
component from other suppliers in the United States and Japan (Tang 2006, p. 38)).
Contingent sourcing also relies on the enforceability of contracts. If the shock is sufficiently
disruptive, it may raise other issues that interfere with the normal enforcement of contracts.
For example, in early 2021, the European Union disputed whether AstraZeneca was meeting
its contractual ‘Best Reasonable Efforts’ over obligations in manufacturing and delivering
the required number of doses of COVID-19 vaccines. AstraZeneca underdelivered on the
number of doses it was contracted to produce for the European Union as it dealt with
operational issues in some of its EU plants and faced large demands for its vaccines from
around the world (O’Connor and Kirton 2021). Other contracts may stipulate force majeure
conditions, which recognise that some events might be outside the supplier’s control, and
sufficient cause to relieve them from their contractual obligations (such as ‘acts of God’ or
‘government actions or interference’) (Borgese et al. 2020).
Domestic capability
Firms may choose to build their own domestic factory for a critical input, or to pay a
premium to be supplied by an Australian firm. This insulates firms from supply chain
disruptions that might affect overseas suppliers, causing shortages or large (and sometimes
prohibitive) increases in costs.
For example, as a result of the COVID-19 pandemic, many telecommunications providers
and some banks had to reassess their reliance on call centres located mainly in India and the

84 VULNERABLE SUPPLY CHAINS
INTERIM REPORT
Philippines after they were unable to meet customer demand when these centres closed due
to lockdowns. Crummy (2020, p. 1) observed that:
In many cases, businesses had to quickly decide whether to replace now-defunct South-East
Asian [call] centre operations with another offshore provider or provide additional resources to
over-stretched Australian [call] centre teams while concurrently migrating agents to a
working-from-home (WFH) scenario, or urgently find a new local [call] centre partner to move
customer conversations onshore.
In July 2020, Westpac announced it would be reshoring up to 1000 call centre jobs back to
Australia, at a cost of $45 million a year (although it expects productivity gains would help
mitigate some of this cost increase) (Yates 2020).
An onshoring strategy does not necessarily involve moving an entire supply chain but rather
assessing the parts of the supply chain that are most vulnerable to disruption, and onshoring
those parts that still allow firms to remain competitive. Realistically, onshoring cannot
eliminate risks associated with exposure to global supply chain disruptions. Complete
insulation from disruptions is unlikely because most domestic production also relies on some
imported inputs.1
In addition, onshoring does not eliminate all supply chain risks, as domestic production
facilities and transport networks are vulnerable to onshore risks. Recent natural disasters and
state-based health regulations during the COVID-19 crisis slowed and jeopardised the
movement of goods around Australia. Moreover, large disruptions to global supply chains
may still mean domestic production capacities are insufficient to meet demand. For example,
despite producing half of the world’s protective face masks before the pandemic, even China
found itself importing masks during the pandemic, as it was unable to meet its initial needs
despite its large local production (OECD 2020, pp. 5–6).
The costs of onshoring include maintaining higher costs of production, due to higher input
(particularly labour) costs and to foregoing economies of scale. According to Logistics
Bureau (2020), production in China results in significant savings for some industries:
With significant reductions in labour and capital investment expenditure, production costs can
be slashed by some 20 to 40 percent, and for labour-intensive products, up to 50 percent and
beyond. The main reason for these savings is the availability of cheaper labour — manufacturing
labour costs in China average US$5.5 per hour against the Australian average of US$15 per hour.
An added factor is that Chinese companies produce in bulk for global consumer markets and
therefore import raw materials, e.g. plastics and resins, in quantities so vast that they attract
significant discounts from suppliers.
This local production cost premium was also identified by manufacturers of motor vehicles
in Australia. For example, Ford and Holden/GM’s manufacturing costs in Australia were
approximately twice as high as those in Europe and four times greater than in Asia for a
1 For example, across the veterinary pharmaceuticals and medicinal production manufacturing sector as a
whole, every $100 of domestic output is associated with $50 of imports (ABS 2020).
SUPPLY CHAIN RISK MANAGEMENT
INTERIM REPORT
85
comparable manufacturing operation. Holden noted that $2000 of this cost gap was due to
Australian input costs (of which approximately 80 per cent was due to labour costs), $1500
was due to buying components from local suppliers, and $250 was due to the logistics costs
for imported components (PC 2014a, p. 61).
Depending on the industry, demand in Australia (and any potential export demands) may be
well below what could support a factory of efficient scale domestically. For example, much
of the world’s fire retardant is produced by one American factory (appendix B). Australian
demand for fire retardant would also be highly variable (depending on how severe the
bushfire season was), but country-level spikes in demand will smooth out for a global
producer. This applies particularly to goods and services likely to be identified as essential
under the Commission’s proposed framework (chapter 3). Given the potentially narrow list
of goods that would be identified under the framework, it may be that the goods cannot be
produced locally (such as oil), or that Australia does not have the expertise or scale to
produce them well or competitively relative to the rest of the world (such as chemicals).
But this does not mean there are no opportunities for firms to consider onshoring to improve
resilience in their supply chains. Labour and other costs in some traditional offshore
manufacturing centres have increased (including in some sites in China), and technology and
automation have reduced labour-intensity and labour costs in many industries; these trends
present opportunities for business to recalibrate their production choices.
The COVID-19 pandemic also provided a limited number of examples of firms pivoting
their production to high-demand medical goods and services, where previously they may
have found it difficult to overcome higher costs of production (box 1.3). For example, some
craft breweries and distilleries pivoted their production to hand sanitisers during the
beginning of the COVID-19 pandemic to help meet higher domestic needs. By April 2020,
domestic production as a share of Australia’s total hand sanitiser supply had grown from 50
per cent to around 70 per cent, with total domestic production capacity increasing from
approximately 10 to 54 million litres per year (DISER 2020c, p. 4).
How the strategies compare
Firms have a number of risk management strategies to choose from, and some strategies will
be more suitable than others depending on the disruptions that firms are likely to face and
the nature of the vulnerabilities in the supply chain. A combination of strategies will likely
be needed to mitigate the costs of potential supply chain disruptions.
Table 5.1 outlines some of the key elements that these strategies can be assessed against, and
shows the relative strengths and weaknesses of each. For example:
• the less frequently a disruption is expected to occur, the worse a stockpiling or domestic
capability strategy would likely perform relative to other strategies
• contingent contracting with alternative suppliers and supplier diversification share some
of the same advantages, except if the more reliable (likely higher cost) suppliers have

86 VULNERABLE SUPPLY CHAINS
INTERIM REPORT
more limited capacity to expand or contract production. In this scenario, contingent
contracting would likely perform less well than a diversification strategy
• the longer the duration of a disruption, the less reliably we would expect stockpiling to
perform, relative to other strategies. We see this, for example, in the performance of the
NMS in supplying P2 masks for the 2020 Australian bushfires, relative to the pandemic.
In the case of the pandemic there were millions more masks required than were held by
the stockpile, and other strategies needed to be deployed.
This table is not exhaustive, and does not indicate the magnitude of strength and weakness
of each strategy relative to others. Each disruption (such as a natural disaster, logistic failure,
or pandemic) will have its own unique set of circumstances — and each will present
opportunities or difficulties for different risk mitigation strategies.
Table 5.1 Indicative impact of supply-side mitigation strategies
Performance of strategy against nature of disruption and suppliera
Do nothing Stockpiling
Supplier diversification
Contingent contracts
Domestic capability
Nature of disruption
Infrequent + − + + − Longer duration − − + + + Impact localised
domesticallyb ? + + + − Nature of disrupted supply
Less flexible in productionc − + + − − Goods are more perishable ? − ? ? + Lower reliability of preferred supplier − + + + +
a + Strategy likely to perform better than other strategies; − Strategy likely to perform worse than other
strategies; ? Unclear how the strategy would perform under this characteristic. b Localised disruption
affecting domestic supplies, rather than localised overseas or global disruptions. c Difficult for producers to
respond quickly due to obstacles, such as capacity constraints or large investment requirements.
5.4 Risk ownership and the role of government
Firms are mainly responsible for managing risks in their supply chains
‘Good risk management allocates risk … to the party best able to manage it’ (OECD 2008,
p. 49), where ‘best able’ relates to parties with the incentives and capabilities to reduce,

SUPPLY CHAIN RISK MANAGEMENT
INTERIM REPORT
87
respond to and deal with residual risk. Supply chain disruptions can result in lost sales,
profits and reputational damage, and possibly closure; firms thus have strong incentives to
manage and respond to risks in their supply chains.
Firms up and down the supply chain can also share in managing risks. For example, a supplier
may be reliant on the final producer for a majority of their revenue, which would be an incentive
for them to help respond to any disruption in the supply chain (for example, as happened with
suppliers of Toyota and Nokia discussed earlier). And contracts can be structured to give
suppliers strong incentives for reliability, such as by including damages clauses.
While firms will not always manage supply chain risks effectively — due to unforeseen risks
or inadequate preparation or response to a disruption — this does not mean government
should take ownership of private sector supply chain risks. Governments make mistakes too.
And all government interventions involve some combination of making: firms undertake
certain activities; taxpayers fund firms’ risk management; or the community as a whole bear
certain risks. Such interventions thus need to be justified to ensure the benefits of the
intervention outweigh the costs.
Government is directly responsible for managing supply chain risks where they deliver or
procure goods and services on the community’s behalf, including in delivering health
services, national security and many other public services. Governments have a direct
responsibility in many of the supply chains that would be considered essential as part of the
framework proposed in this study — such as water, health, communications (provision of
broadband internet and the telecommunications universal service obligation), and
government (chapter 3). In doing so, governments, like any firm, invest in risk management
strategies (as described in section 5.3).
The rest of this section explores whether there is a case for government involvement in the
private sector’s risk management, and if so, how it might be involved without crowding out
the sector’s investment in risk management.
FINDING 5.2
Risks are best managed by those who have direct incentives to mitigate against them.
Firms are primarily responsible for managing risks in their supply chain.
Governments have responsibility, like any firm, to manage risks in supply chains for
which they purchase and/or deliver goods and services directly, particularly when these
are essential goods and services.
Each strategy has costs and some will perform better under different types of disruptions
and contexts. Firms will employ a range of strategies to effectively manage risk.

88 VULNERABLE SUPPLY CHAINS
INTERIM REPORT
Where might direct government intervention be justified?
Government intervention could be justified where private firms might under-invest in supply
chain risk management or might otherwise be unable to effectively respond to disruptions,
whether due to government or other impediments. It might also be justified where the amount
of residual risk that results from the market exceeds the amount of risk that the community
might be willing to accept, that is, where firms’ risk appetite exceeds that of the community.
This implies that a socially optimal level of investment in risk management might diverge
from what private firms deliver (that is, where the social cost or benefit of mitigation does
not align with the firm’s private cost or benefit). This divergence could come about for
several reasons.
• Disruptions could have ‘contagion’ effects. Even if each firm individually managed the
disruption effectively, these firms (and the community) may still be left exposed to large
disruption costs. If firms understood the potential impacts of contagion to their business,
they may seek to reach agreements with each other to internalise its effects, or
governments may impose such measures. Bank deposit guarantees partially fulfil this
role as a form of insurance to prevent large-scale bank failure that could spread to the
banking system, and consequently, the broader economy.
• Consuming certain goods and services at times of disruption, such as face masks during
the COVID-19 pandemic, may provide benefits to a broader group than those who
directly consume them. This could lead to private undervaluation in the need to secure
the supply of such goods and services.
• In some essential industries (such as in utilities or health provision), regulated prices may
not provide sufficient financial incentives for firms to invest in risk management despite
their importance to society. For example, pharmacies might choose not to stockpile
additional amoxycillin to prevent a shortage, if they could not charge a premium when a
shortage occurred. (Some providers of essential goods and services, such as
supermarkets, can face social pressures that also limit their ability to charge more when
there is scarce supply.)
• Even in markets with unregulated prices, firms may under-invest in risk management.
For example:
– a monopoly will take into account potential loss of profits from a disruption, but the
damage to profits would be less than the damage to wellbeing.2
2 Firms in a perfectly competitive market will make the socially efficient investment in risk management.
However, firms with limited market power may under- or over-invest in risk management. The intuition is
derived from Mankiw and Whinston (1986), who showed that an oligopoly market with free entry can lead
to excess entry because a new firm does not take into account that it is stealing market share from existing
firms. Investing in risk management is equivalent to investing to ‘enter’ the market in a state in which many
firms are disrupted. A firm is insufficiently incentivised to invest in case it might be the only firm operating
(the monopoly effect) but has a strong incentive to invest if many firms might be operating (the
market-stealing effect). Either effect can dominate.

SUPPLY CHAIN RISK MANAGEMENT
INTERIM REPORT
89
– if risks are large but infrequent, firms that do not invest in risk mitigation will gain a
cost advantage. In a highly competitive market, firms that make this investment could
be driven out. While firms may be able to credibly signal their risk management
activities, customers might buy from cheaper providers and plan to switch providers
when a disruption occurs (although this would only be a concern where individual
private valuation diverges from social valuation).
Even where investment in risk management may not be adequate (and this itself is difficult
to measure) due to government or other impediments, this is not sufficient to warrant
government intervention (other than maybe correcting the impediment). Government taking
over ownership of risk from firms could reduce private incentives to invest in risk
management. Governments may also not have access to information held by private firms,
which may make them less effective at managing risk for any given level of risk appetite.
To ensure government intervention is effective, governments need to demonstrate that the
expected benefits of government investment in mitigating private sector supply chain risks
outweigh the expected costs, and that the intervention is the best solution to the identified
problem. (A potential assessment framework is outlined in figure 5.1.)
What role could government play in prevention and preparation?
Helping to better understand risk through the provision of information and expertise
Firms are usually in the best position to understand risks in their supply chains (even if they
are unaware of details in all tiers of a chain). But governments also hold certain expertise
and knowledge which can make them well placed to disseminate information that would
improve a firm’s understanding of risks in their supply chain.
The Australian Government, for instance, has science and research agencies that can directly
support firms to improve the understanding of risks in their supply chains. The Bureau of
Meteorology offers expertise in forecasts, warnings, monitoring and advice that assists
Australians to deal with ‘the harsh realities of their natural environment, including drought,
floods, fires, storms, tsunami and tropical cyclones’ (BOM 2021). The Commonwealth
Scientific and Industrial Research Organisation (CSIRO) has expertise in science and
technology, and can collaborate with government and industry to improve resilience in
supply chains (box 5.5).

90 VULNERABLE SUPPLY CHAINS
INTERIM REPORT
Box 5.5 CSIRO work relating to supply chains
• The CSIRO, supported by industry and state and territory governments, developed the
Transport Network Strategic Investment Tool (TraNSIT). TraNSIT is a model that maps
millions of vehicle trips across thousands of supply chains between production and domestic
and export markets. It has been used to analyse the sensitivity of the road and rail network to
natural disasters or other disruptions and their impact on freight access to markets.
• Through the Science and Industry Endowment Fund (which is supported by the CSIRO),
researchers have developed a prototype of an automated system for fish species identification,
counting, size estimation, colour measurement and tagging of catch to provide information to
improve traceability along the supply chain.
• The Australian Department of Agriculture funded work by the CSIRO and academics to
investigate how climate change might impact different agrifood supply chains in Australia, and
how they can adapt.
• The CSIRO has other partnerships with industry to support supply chains via imaging and
sensor technologies, autonomous robotics, new materials, and manufacturing processes.
Sources: CSIRO (2018, 2020); Lim-Camacho (2016); Science and Industry Endowment Fund (2020).
Several government agencies offer trade and international relations expertise by leveraging
off the Australian Government’s extensive diplomatic, trade and security networks (such as
Austrade, and the departments of Foreign Affairs and Trade, Defence, and Home Affairs).
These agencies gather information on geopolitical and security threats that might affect
global supply chains, and identify and establish opportunities for trade links. While some
firms will have access to some of this information through their own networks, governments
may have greater access and reach to foreign governments and their security agencies.
As a regulator, governments also gather critical information, which can help identify risk in
specific supply chains. For example, the Therapeutic Goods Administration (TGA)
coordinates the national Medicines Shortages Working Group, which comprises key medical
peak bodies and organisations, in addition to Department of Health staff.
In Australia, medicines sponsors (companies) are required by law to report current and
anticipated shortages of prescription medicines and certain over-the-counter medicines. The
TGA publishes shortage notifications for the information of health professionals and consumers.
If there are any medicine shortages relating to COVID-19, including information about expected
duration and the supply of potential alternative products, details will be published on the TGA
web page and also communicated more widely to healthcare professionals. (TGA 2020b)
Gathering this information and expertise is not costless for governments, and such initiatives
to support firms need to demonstrate a net benefit to the community. Governments may often
face economies of scale in obtaining expertise and insights, relative to individual firms. They
may also have access to information in the course of providing a public good or service,
which is of value to the community but would otherwise be under-produced if not delivered
by government.

SUPPLY CHAIN RISK MANAGEMENT
INTERIM REPORT
91
Mandating or subsidising investment in risk mitigation
Governments can compel or support firms to invest in risk mitigation to reduce the impacts
of supply chain disruptions. In terms of supply-side risk mitigation strategies, governments
could require firms in essential industries to hold stockpiles, compel or support firms to
diversify their supply links, and/or subsidise local production or onshoring.
The most prominent example of direct government intervention in private firms’ mitigation
of supply chain risks in Australia is the minimum stockholding requirements for liquid fuels
— although this requirement also supports the Australian Government in meeting its
international stockpiling obligations (box 5.6).
While not specifically aimed at protecting firms from disruptions to global supply chains,
some regulations require firms to invest in understanding their supply chains; for example,
the Australian Government requires firms to report on how they monitor and manage other
forms of risks through legislation:
• under the Modern Slavery Act 2018 (Cwlth), entities with consolidated revenue of at least
$100 million per financial year are required to report annually on the risks of modern
slavery in their operations and supply chains, and the steps taken to address those risks
• under the Security of Critical Infrastructure Act 2018 (Cwlth) owners and operators of
critical infrastructure assets are required to provide information to the Register of Critical
Infrastructure Assets to help the Australian Government work with them to identify and
manage the national security risks of espionage, sabotage and coercion.
Other jurisdictions have provided direct subsidies to support firms to diversify their sources
of production. For example, Japan, and later South Korea, introduced subsidies to onshore
manufacturing and to diversify supply chains (primarily relocating production away from
China to other economies across Asia). Japan provided subsidies of US$2 billion to onshore
manufacturing and US$200 million to expand supply chains to South Asia (Editorial Board,
East Asia Forum 2020). As Denton and Bruckard (2020) noted, nativist policies are likely
to undercut competitiveness, raise consumer prices, concentrate risk and make industries
‘more vulnerable to smaller, localised and more frequent shocks like floods, blackouts or
social upheaval.’ Moreover, it is unclear whether these subsidies facilitated additional
investment, as noted by the Editorial Board, East Asia Forum (2020):
Many Japanese multinationals have been reorganising their supply chains in Asia regardless of
the ‘China-exit’ subsidy. Japanese companies have been restructuring their supply chains in Asia
and investments over time due to rising labour costs in China. The ‘China plus one’ strategy of
diversifying investment has been common practice for years. The subsidies may distort decisions
and concentrate risk, or simply be a form of corporate welfare or privileging.
Setting requirements on firms to invest in supply chain risk mitigation raises the question on
whether some form of taxpayer subsidy is appropriate, particularly if the additional
investment supports a community-wide objective, rather than purely a private one. This may
be relevant, for example, in regulated industries, which may be subject to price, rate of return

92 VULNERABLE SUPPLY CHAINS
INTERIM REPORT
or similar regulation. There is a risk that regulation sets the price (or rate of return) too low
to account for the costs of risk management.
Box 5.6 Minimum stockholding requirements for liquid fuel
Australia, as a member of the International Energy Agency, is a party to the International Energy
Program and treaty that requires that member states maintain oil stocks equivalent to at least
90 days of the previous year’s daily net oil imports. The purpose of this requirement is to ensure
that oil-importing countries can withstand disruptions to supply by releasing stockpiled oil.
Oil supplies face many geopolitical and natural risks. For example, members of the Organization
of the Petroleum Exporting Countries (OPEC) can work together to decrease oil production and
create supply risks, but these efforts require members to co-operate with OPEC directions, which
does not always occur (Iraq, for example, supplied record volumes of oil in August and September
2019, which went against an earlier OPEC decision to decrease production). And, although OPEC
covered a large proportion of global oil production in the 20th century, it now accounts for only
some 40 per cent of production.
The issue of how disruptions in global oil supplies could impact Australia was addressed in the
Liquid Fuel Security — Interim report:
Initial findings from testing of disruption scenarios show that the global market is generally robust enough
to balance out supply and demand. The global oil price will spike in response to a disruption, and this
will be an incentive for companies to bring new supplies of oil to the international market. (Department
of the Environment and Energy 2019, p. 43)
Even so, in 2020 the Australian Government bought $94 million worth of oil to store in the United
States’ Strategic Petroleum Reserve for an initial period of 10 years. By storing crude oil in the
United States, Australia meets some of its international treaty obligations, but its role in supporting
Australia’s physical or strategic oil reserve is less clear. In addition to possible geopolitical risks,
time delays in shipping and refining the oil once in Australia are also a risk.
The Australian Government also created minimum stockholding obligations on industry for key
transport fuels, to be accompanied by a $200 million grant for the construction of new storage facilities.
Sources: DISER (2020a); Department of the Environment and Energy (2019, pp. 25; 43); Laidlaw (2020,
pp. 4–5); Turak (2019).
There are limited circumstances in which governments might take greater ownership of risk
mitigation, for example by maintaining their own stockpiles, such as the National Medical
Stockpile, in which the Australian Government maintains a national stockpile of PPE to be
used by private medical practitioners and state-run health systems. The main advantage of a
central stockpile (relative to directing firms to hold stockpiles) is the ability to rapidly direct
supplies in the event of an emergency. If firms do not all experience shortages at the same
time a central stockpile could be more efficient — smaller than if each firm had to maintain
its own stockpile, because a pool of resources would be used to accommodate the shortages,
similar to pooled insurance.
As with the many risk management strategies available to firms, governments have the
choice of investing in one strategy or many, depending on the type of risk facing the supply

SUPPLY CHAIN RISK MANAGEMENT
INTERIM REPORT
93
chain. For example, Australia relies on private and public stockpiles of liquid fuels. Japan,
facing risks to rare earths supplies, has also opted for a multi-pronged strategy, involving:
• expanding the stockpile of most minerals from 60 days of domestic consumption to 180 days
• extending debt guarantees to firms to purchase existing refineries or to build their own
facilities (for oil and other minerals), as well as to aid firms that wish to invest in mining
operations overseas
• investing in the search for rare earth minerals in waters off Japan. (In late 2018, scientists
from the University of Tokyo and the Japan Agency for Marine-Earth Science and
Technology announced that an area of seabed 2000 km south of Tokyo contained
millions of tons of rare earths.) (Ryall 2018, 2020)
Direct taxpayer assistance to help private firms invest in risk mitigation can be costly. For
example, as noted in section 5.3, local cost premiums to produce domestically can be
significant. But beyond the financial costs, there could be other costs.
• Setting expectations of taxpayer support, and with government acting like an insurer who
charges no premiums, reducing the incentive for business to manage their own risks (i.e.
crowding out). For example, drought assistance programs have been found to benefit
recipients, but not to help farmers improve their self-reliance, preparedness and climate
change management (PC 2009, p. XX).
• Government project financing instruments can distort the allocation of resources, and
impose hidden costs on taxpayers, for example through risks of non-repayment of debt
and concessional financing subsidies (that extend loans to firms on terms substantially
more generous than are available through the market) (PC 2020, p. 20).
• Costs on other sectors of the economy, that do not directly benefit from government
assistance. For instance, to fund the subsidies, governments must increase taxes and
charges, cut back on other spending, or borrow additional funds. Funding provided to a
single firm can also discriminate against its competitors (PC 2018, p. 2). Moreover,
investment and economic activity could be diverted away from more highly-valued uses
and sectors of the economy, due to an artificial increase in rates of return in the sector of
the economy that received the industry assistance (PC 2014a, p. 94). And this could
exacerbate supply chains risks in those industries that miss out on assistance.
• Resources that firms waste on rent-seeking behaviour to secure government assistance,
rather than focusing on things that they could do themselves to improve the reliability of
their supply chains (PC 2014a, p. 94).
These costs do not preclude government intervention, but any case for taxpayer-funded risk
mitigation needs to demonstrate how the associated costs are outweighed by the benefits to
the public, and that the intervention is the best solution to the identified policy problem
(PC 2020, p. 20).
Direct government intervention in risk mitigation to protect the supply of essential goods
and services should not be used to support broad industry policy objectives, unless the link

94 VULNERABLE SUPPLY CHAINS
INTERIM REPORT
can be clearly established (and the intervention is found to be a net benefit to the
community). Government supporting advanced manufacturing capacity in 3D printing or
advanced robotics could be seen as important to allow firms to pivot when faced with a
supply chain disruption. And indeed, there were a few examples where this capacity assisted
in government and firms working together to pivot domestic production to produce essential
PPE during the COVID-19 pandemic (box 1.1), although it is worth noting that many firms
did not pivot. But government support in establishing general manufacturing capacity will
not be suitable in mitigating many types of disruptions (for example, disruptions in fuel
supplies), and the investment will likely crowd out more profitable forms of private
investment in these technologies.
Government should also be cautious about intervening in private sector risk mitigation
because firms’ preparations for, and responses to, disruptions are usually effective. These
responses are why most people are completely unaware of the myriad supply chain
disruptions that happen every year. As McCloskey (2020) pointed out, ‘you can depend on
it that businesspeople will think up methods of insurance against future plagues better than
government-imposed restrictions on whom you can buy from.’ Although no system is likely
to be foolproof, and disruptions in vaccine production in Europe have occurred
(Goenka 2021), Australia’s pharmaceutical supply chains were able to take measures to
manage disruptions as they arose — box 5.2:
Pharma and biotech companies with manufacturing facilities in Australia such as CSL, GSK and
AstraZeneca have diverse supply chains and redundancies built-in to be able to accommodate a
pandemic. As a result, there was not a significant interruption to the ability to either export
medicines to international markets or import medicines from offshore manufacturing.
(MTPConnect 2020b, p. 14)
What role might government play in response and recovery?
Ideally, governments would anticipate and prepare for future disruptions to ensure that policy
responses during a crisis are measured and outcomes focused. The reality, however, is that it
is not possible to anticipate all eventualities, and governments will be required to develop
policy responses after a crisis occurs. Below are several principles to guide such a response.
First, as noted earlier, if a government is responsible for directly providing or purchasing
essential goods or services, then it should manage risks in the supply chain. If that supply
chain fails, then the responsibility for resolving a shortfall in supply belongs to the
government. Disruptions may also require new policy priorities for governments to support
communities respond to unanticipated cost increases. (Under circumstances where risks have
not been effectively mitigated prior to a disruption, the community is likely to bear the higher
costs associated with responding to and reducing the impacts.)
Many facets of the COVID-19 pandemic required rapid action from governments to
understand and respond to new developments as part of their responsibilities in providing
public health services. For example, governments secured supplies of PPE to hospitals and
SUPPLY CHAIN RISK MANAGEMENT
INTERIM REPORT
95
government-owned aged care facilities, as well procuring vaccines, and testing supplies. In
terms of vaccine procurement, the Australian Government decided that, for a premium, it
would fund domestic production capacity to help secure access, in addition to making
purchasing arrangements with overseas manufacturers of other vaccine candidates. Having
a domestic manufacturing capacity seeks to avoid relying on global supply chains, some of
which were assessed to be at greater risk of disruption than local supply chains:
Both [AstraZeneca and Pfizer] have experienced global supply challenges but we are in a
fortunate position as a country because of the decisions that have been taken … [including] the
decision to pay a pay premium for an onshore, secure, sovereign vaccine manufacturing capacity
via CSL. (Morrison 2020)
Local production, however, is not the only approach to overcoming potential barriers to
supply such as export bans and spikes in global demand. In fact, it can raise other issues if
domestic supply risks are not effectively managed, such as where local vaccines fail or
prove to be less effective. This is why Australia and other countries have signed supply
agreements with multiple manufacturers and through global collaboration efforts,
including the COVAX Facility.
Governments can also have an important coordinating role in the aftermath of major
disruptions to insulate the community from its worst effects. With respect to protecting
vulnerable supply chains during the COVID-19 pandemic, several government agencies
established taskforces and initiatives to coordinate a response to supply chain disruptions
affecting essential industries (box 5.7).
Regulators can also play a key role in helping the community respond to unexpected
disruptions. As the Medical Technology Association of Australia noted, the TGA:
… has been a key partner in the government-industry collaboration, providing rapid engagement
with the sector and developing an accelerated approvals process. As an example, rapid approval of
ventilator design variations allowed Australia to get earlier access to new products on the
production line which may have otherwise gone to other countries. In addition to rapid approvals,
the TGA took on a heavy workload around preparing and publishing regulatory and non-regulatory
advice and guidance to industry. The TGA reports that over 2200 new manufacturers entered the
market from February to April this year, all requiring guidance. (MTPConnect 2020a, p. 8)
The Australian Competition and Consumer Commission also made determinations to
temporarily allow conduct that would normally be considered anti-competitive. This
included allowing the Australian Institute of Petroleum and major oil refiners to coordinate
with one another to ‘facilitate the efficient use of refining and fuel storage capacity during
the pandemic’ (ACCC 2020a). It also authorised supermarkets to take a coordinated
approach to best ensure grocery supply. And the Australian Pesticides and Veterinary
Medicines Authority provided support and guidance to holders and manufacturers of
veterinary medicines to demonstrate compliance with Good Manufacturing Practice, while
scheduled inspections and audits could not take place due to COVID-19 social distancing
measures and travel restrictions.
96 VULNERABLE SUPPLY CHAINS
INTERIM REPORT
Box 5.7 Examples of government responding to the COVID-19 pandemic
The Department of Industry, Science, Energy and Resources worked with industry and the
Department of Health to secure supplies of personal protective equipment to the National Medical
Stockpile:
The Government supported local manufacturers by providing grants (such as $4 million to
Shepparton-based company Med-Con to increase its production of face masks), reducing regulatory
barriers, facilitating supply chain connections, and purchasing equipment for the [National Medical
Stockpile] (such as the contract with a consortium of over 30 companies led by Grey Innovation to supply
ventilators). (DISER 2020b, p. 4)
In collaboration with the Advanced Manufacturing Growth Centre, the Department of Industry,
Science, Energy and Resources also supported Australian manufacturers and suppliers of critical
medical and protective products to identify collaboration and market opportunities through the
Growth Centre’s COVID-19 Manufacturer Response Register.
The Department of Defence provided defence personnel to support domestic manufacturing of
medical personal protective equipment under Defence Assistance to the Civil Community
arrangements. For example, around a dozen engineering maintenance specialists were deployed
to Med-Con Pty Ltd to assist the company’s existing staff on production, maintenance and
warehousing tasks. The Department’s Defence Science and Technology Group helped to design
new face shields, and worked with South Australian defence industry company Axiom Precision
Manufacturing to assist with rapid production.
AUSTRADE administered the International Freight Assistance Mechanism to help accelerate
delivery of agricultural and fisheries exports and re-establish global supply chains during the
COVID-19 pandemic. A network of 15 air freight service providers were established to deliver
regular freight services in the absence of commercial passenger flights.
The Department of Foreign Affairs and Trade established a COVID-19 Coordination Unit, which
became the principal point for: coordinating the Department’s COVID-19 response;
whole-of-government policy coordination on implementing COVID-19 policy responses; and
facilitating the delivery of personal protective equipment and other medical imports to Australia.
The National COVID-19 Coordination Commission was established to coordinate advice to the
Australian Government on actions to anticipate and mitigate the economic and social effects of
the global coronavirus pandemic. It formed a working group to work with manufacturers ‘to ensure
supply of essential products, such as personal protective equipment, and solve supply chain
issues to keep critical goods flowing to Australian communities.’
The Prime Minister established the National Cabinet to ensure a ‘coordinated response across
the country to the many issues that relate to the management of the coronavirus’. It comprises
the Prime Minister and the leaders of the states and territories, and is advised by the Australian
Health Protection Principal Committee.
Sources: DISER (2020b, p. 4); DPS (2020); Reynolds and Andrews (2020).
In making these decisions, governments make an assessment that the net benefits of certain
policy objectives, such as avoiding collusion or having greater certainty over the quality of
regulated goods, are lower than the cost of major disruption.

SUPPLY CHAIN RISK MANAGEMENT
INTERIM REPORT
97
Second, a government could also assist firms respond to disruptions in private sector supply
chains but, as noted earlier, this runs the risk of crowding out more effective responses by
private firms and dulling their incentives for future preparedness. For example, taxpayers
supported firms to overcome disruptions in their freight channels through the International
Freight Assistance Mechanism. While this support would have provided relief to many firms
that faced fewer (and higher cost) freight options given the reduced availability of passenger
flights as a result of border closures, it may also affect a firm’s incentive to invest in
managing for this risk in the future. Although there might be calls for governments to support
the economy during a crisis, the costs of government intervention need to be considered. As
with natural disaster funding, governments should not create a cycle of under-investing in
mitigation and insurance, and over-investing in post-disaster recovery, which reduces
incentives for firms to manage risks ex ante (PC 2014b, p. 2).
Providing an open trading environment is vital
Most fundamentally, governments can facilitate more effective responses to supply chain
disruptions by creating a regulatory and policy environment that avoids unnecessary
impediments to domestic and international trade. An open trading environment in particular
allows firms to deal with operating uncertainties or unanticipated risks in their supply chains,
as they face lower costs in adapting their production or their supply chains in response to a
major disruption.
Trade is beneficial for managing and responding to supply chain disruptions
The Australian Government plays a critical role in supporting a rules-based global trading
system. It signs up to these rules of trade between nations (based on the principles of
non-discrimination, transparency and reciprocity) primarily through the World Trade
Organisation (WTO).
The system provides predictability and mechanisms to avert or resolve trade disputes and gives
all nations and businesses regardless of their size the confidence that success in international
trade depends on the merits and competitiveness of the goods and services they provide, not their
political clout. It has proven effective in progressively lowering trade barriers, which has been a
source of economic growth, lifted living standards and contributed to poverty reduction within
and across nations. (PC 2019, p. 38)
The Australian Government supports this rules-based trading system by ensuring markets
are open to trade and investment. The Commission has previously identified three areas that
could continue to drive this, including: periodically reviewing the design and adequacy of
foreign investment screening processes; bolstering government efforts to explain how and
why the community benefits from trade liberalisation; and lowering remaining trade barriers
(PC 2019, p. 51). Opportunities to free up trade barriers are found in box 5.8.
The Australian Government can also support the rules-based trading system by working with
other countries to resolve long-standing and escalating challenges facing the WTO. This

98 VULNERABLE SUPPLY CHAINS
INTERIM REPORT
includes reinvigorating its negotiation function, strengthening compliance with notification
procedures, and refreshing the rules to handle issues relating to state-owned enterprises,
regulatory co-operation, digital trade and intellectual property, amongst others.
Having minimal constraints on international trade allows firms to diversify their suppliers in
preparation for global supply chain disruptions, and to find alternative suppliers when a
disruption affects a specific location in a firm’s supply chain.
A strong and reliable trading system is particularly important during a crisis. By April 2020,
around 80 countries had introduced export prohibitions and restrictions to mitigate shortages
at the national level of medical supplies (facemasks and shields), pharmaceuticals and
medical equipment (ventilators), and other products, such as foodstuffs and toilet paper
(WTO 2020, p. 1).
Agreements under the WTO (based on the General Agreement on Tariffs and Trade 1994)
broadly prohibit the use of export bans and restrictions, unless the member country can
justify that a measure is required to prevent or relieve critical shortages of foodstuffs or other
essential products, or to protect human, animal or plant life and health (WTO 2020, p. 4).3
These provisions regulate how the measures can be applied (for example, they cannot be
discriminatory), and establish notification and dispute resolution mechanisms. (That said,
few countries were transparent in how they implemented the measures during the COVID-19
pandemic (WTO 2020, p. 2).)
The WTO noted that such actions are not costless. For example, exporters risk losing out in
the long run:
… lower domestic prices will reduce the incentive to produce the good domestically, and the
higher foreign price creates an incentive to smuggle it out of the country, both of which may
reduce domestic availability of the product. On the other hand, restrictions initiated by one
country may end-up triggering a domino effect. If trade does not provide secure, predictable
access to essential goods, countries may feel they have to close themselves from imports and
pursue domestic production instead, even at much higher prices. Such a scenario would likely
result in lower supply and higher prices for much-needed merchandise. The long-term effects
could be significant (WTO 2020, pp. 1–2).
3 The General Agreement on Tariffs and Trade 1994 sets out carve outs and exceptions to the general
prohibition to export bans and restrictions under Articles XI:2(a) and XX:b respectively (WTO 2020, p. 4).

SUPPLY CHAIN RISK MANAGEMENT
INTERIM REPORT
99
Box 5.8 Potential areas to remove barriers to trade
• Address the ‘noodle bowl’ of rule of origin requirements that need to be navigated to benefit
from tariff and quota preferences in preferential trade agreements.
• Undertake a targeted review of certain technical barriers to trade (usually erected for product
safety or biosecurity reasons). Evaluating these barriers can take time so is better suited for
prevention against the impacts of supply chain disruptions and for building preparedness to
respond to disruptions. Local businesses that buy grains, for example, have been seeking
access to imported product for decades, but it can still take upwards of six months for import
permits to be granted.
• Review domestic laws, regulations and practices that can restrict trade in services. For
example, burdensome licensing requirements in sectors such as architectural and engineering
services can increase administrative costs on foreign companies or prevent them from
practicing in Australia.
• Reform Australia’s anti-dumping system. The Commission has previously identified specific
ways to improve the system (for example, de minimis margins), which has been used to protect
certain firms at the expense of the broader community, but also suggested that consideration
be given to whether the system should be retained at all.
Sources: Crook and Gordon (2017); Centre for International Economics and Sydney Centre for International
Economics (1997); PC (2010, p. x, 2016, p. 2, 2019, p. 51); Sullivan (2018, 2019).
Regulations should not unnecessarily impede risk management and response
All levels of government have a role to ensure regulations achieve their outcomes, without
unnecessarily impeding risk management and response by firms. Particularly pertinent to
regulatory impacts on supply chains, better regulation should ensure that it is:
• outcomes focused, that is, not unduly prescriptive. This allows firms to have flexibility
in finding the best way to comply with regulatory outcomes and adapt their operations,
if required, during a disruption. For example, if a regulation prescribes a particular risk
management approach, the firm does not have flexibility to assess what approach is most
effective for their operations
• integrated and consistent with other laws, agreements and international obligations. This
is particularly important, for example, to ensure domestic regulations do not impede
international trade that could support a more diversified supply chain
• enforceable and embody the minimum incentives needed for effective compliance. This
requires regulators to be resourced and empowered to enforce regulation in a manner that
allows them to be responsive to changing circumstances, while ensuring that regulatory
outcomes are achieved.
Regulation should be reviewed regularly to ensure it is fit for purpose, and while good
regulatory systems should be set up to deal with changing conditions, temporary, ad hoc
changes, such as those mentioned above about competition regulation, may be required to
respond to unexpected disruptions. Such responses can be a good opportunity to review

100 VULNERABLE SUPPLY CHAINS
INTERIM REPORT
regulatory systems, in line with a ‘stewardship’ approach to regulation. For example, the
Corporations (Coronavirus Economic Response) Determination (No. 1) 2020 (Cwlth)
temporarily allowed companies to execute documents electronically. This option had long
been sought by stakeholders, and was already permitted in comparable jurisdictions
including New Zealand, the United Kingdom and the United States (Department of the
Treasury 2020, p. 20). The Australian Government has since released an Exposure Draft Bill
that would permanently allow the use of electronic signatures (the Corporations Amendment
(Virtual Meetings and Electronic Communications) Bill 2020).
A framework for government action
With hindsight, it is easy to identify actions that governments might have taken to better
support firms’ preparation for the global supply chain disruptions wrought by the COVID-19
pandemic. And lessons have been learnt. But when looking forward, governments should bring
a disruption-agnostic and principles-based approach to deciding how they support preparation
for, and response to, disruptions to global supply chains that might threaten access to essential
goods and services, in line with good policy process principles outlined in box 5.9.
Box 5.9 Good policy process principles where government intervention is appropriate
• Transparency: Governments should inform taxpayers about where and how public funds are
being used. Where assistance involves mutual obligation, this should be clear and measurable
by all parties.
• Accountability: Governments and the recipients of public assistance should both be
accountable to the public for their actions. In terms of government accountability, the
conditions under which industry assistance measures are established should be clearly
articulated upfront, and it should be demonstrated to taxpayers that the benefits to the
community from government intervention are expected to exceed the costs.
• Long-term sustainability: Where industry-specific assistance can be justified — given the
presence of a government or other impediment, and the costs and benefits of policy
intervention — it should not be regarded as a permanent lifeline. Well-designed assistance
measures should seek to provide a sound footing for industries to achieve commercial viability,
free of specific government funding or other advantage.
Source: PC (2014a, pp. 83–84).
Moreover, drawing on the principles of supply chain risk management outlined in this
chapter, figure 5.1 outlines a framework that governments could use to decide whether and
how to intervene in managing supply chain risks. Table 5.2 poses questions that are designed
to clarify each step in the framework. The questions are directed at ensuring the continuity
of supply for those goods and services that are essential to Australians’ wellbeing.
It begins with understanding the problem. Governments need to identify the good or service
that they care about, including whether it is vulnerable, essential and critical (based on the

SUPPLY CHAIN RISK MANAGEMENT
INTERIM REPORT
101
framework outlined in chapter 3); how well firms manage the risk; and what strategies firms
use to manage the risk.
Second, governments needs to establish their role, and identify all potential options for
intervention. This includes understanding whether firms face any impediments to managing
risks and whether government is best placed to address those impediments. It is important to
clearly identify and articulate the objectives of any intervention here (that is, what barrier is
being addressed) and canvas widely for options that might achieve that objective.
Third, governments need to assess the costs and benefits of intervention against no
government action. In this step it is important to consider the market response during a
disruption and whether government intervention will crowd out firm investment in risk
management. Governments could decide to intervene if the benefits of intervention outweigh
the costs. And finally, monitor and evaluate the effectiveness of its decision.
The Commission considers the number of goods and services likely to be identified by the
proposed analytical framework in this study (chapter 3) is likely to be small and change over
time. This means that it is important to regularly review the list of goods and services that
are vulnerable to disruptions and essential and critical for the wellbeing of Australians, and
whether government interventions are effectively addressing supply chain risks. The
framework developed in chapter 3 provides a means to repeat such reviews relatively easily.
FINDING 5.3
There are conditions where government intervention in private sector risk management
may be justified — specifically, if society’s tolerance for a residual risk is lower than the
residual risk that results from the market. Another situation is where government or other
impediments prevent firms from effectively managing their risks.
That said, government intervention could crowd out private investment in risk management.
The net benefit of any intervention would have to outweigh the possible costs.
The Australian Government also has responsibility for maintaining and promoting a
respected and rules-based international trading system which promotes low-cost trading
and firms’ ability to insure themselves and respond to disruption. And all levels of
government have responsibility for ensuring regulations are fit for purpose, including
making temporary changes that let firms adjust to temporary disruptions.

102 VULNERABLE SUPPLY CHAINS
INTERIM REPORT
Figure 5.1 A framework for government intervention
Is the good or service vulnerable, essential and critical?
Yes
Are there government or other impediments to firms managing risks effectively?
What feasible options exist to help better manage risks?
- Information provision
- Removing trade/regulatory barriers
- Subsidies to stockpiling or local production
Do any of these options provide net benefit relative to ‘no government action’?
Implement risk management
strategies and
accept residual risk
Monitor and evaluate intervention
Are firms effectively managing supply chain risk? (stockpiling, alternative suppliers, etc.)
No
Yes
Yes No
Identify relevant supply chains
Examine possible role for government
Assess net benefit of options
Accept greater residual risk
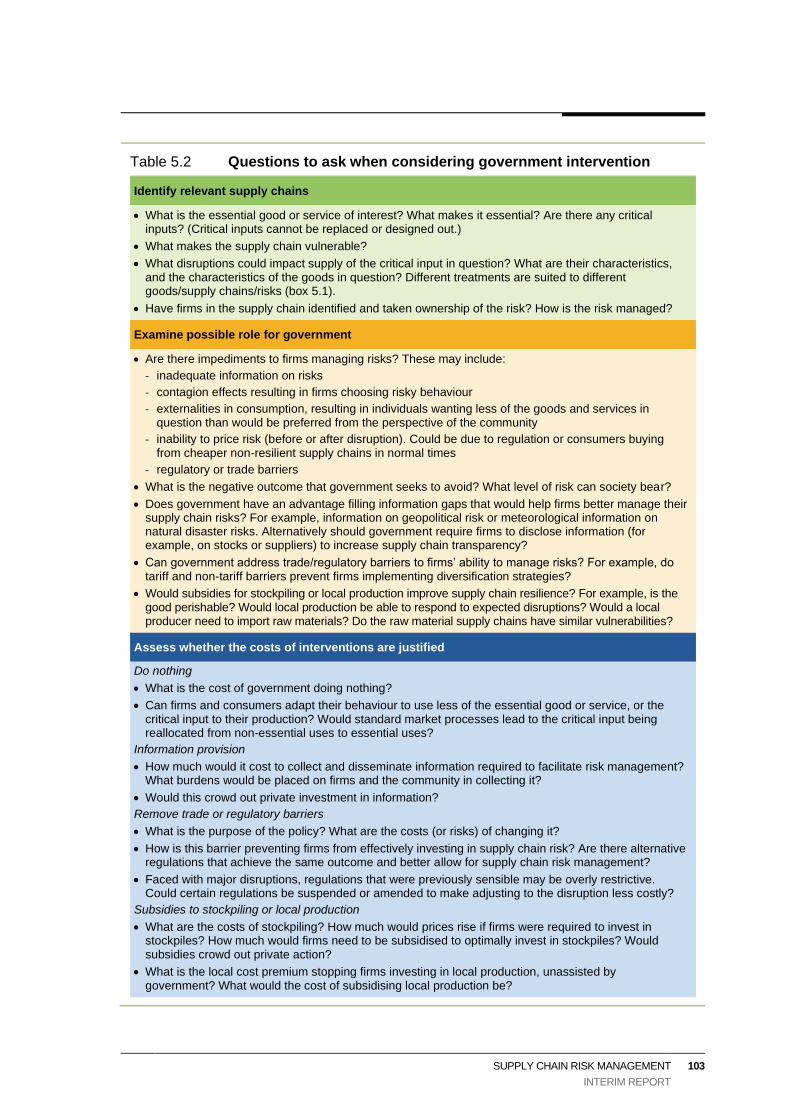
SUPPLY CHAIN RISK MANAGEMENT
INTERIM REPORT
103
Table 5.2 Questions to ask when considering government intervention
Identify relevant supply chains
• What is the essential good or service of interest? What makes it essential? Are there any critical inputs? (Critical inputs cannot be replaced or designed out.)
• What makes the supply chain vulnerable?
• What disruptions could impact supply of the critical input in question? What are their characteristics, and the characteristics of the goods in question? Different treatments are suited to different goods/supply chains/risks (box 5.1).
• Have firms in the supply chain identified and taken ownership of the risk? How is the risk managed?
Examine possible role for government
• Are there impediments to firms managing risks? These may include:
- inadequate information on risks
- contagion effects resulting in firms choosing risky behaviour
- externalities in consumption, resulting in individuals wanting less of the goods and services in question than would be preferred from the perspective of the community
- inability to price risk (before or after disruption). Could be due to regulation or consumers buying from cheaper non-resilient supply chains in normal times
- regulatory or trade barriers
• What is the negative outcome that government seeks to avoid? What level of risk can society bear?
• Does government have an advantage filling information gaps that would help firms better manage their supply chain risks? For example, information on geopolitical risk or meteorological information on natural disaster risks. Alternatively should government require firms to disclose information (for example, on stocks or suppliers) to increase supply chain transparency?
• Can government address trade/regulatory barriers to firms’ ability to manage risks? For example, do tariff and non-tariff barriers prevent firms implementing diversification strategies?
• Would subsidies for stockpiling or local production improve supply chain resilience? For example, is the good perishable? Would local production be able to respond to expected disruptions? Would a local producer need to import raw materials? Do the raw material supply chains have similar vulnerabilities?
Assess whether the costs of interventions are justified
Do nothing
• What is the cost of government doing nothing?
• Can firms and consumers adapt their behaviour to use less of the essential good or service, or the critical input to their production? Would standard market processes lead to the critical input being reallocated from non-essential uses to essential uses?
Information provision
• How much would it cost to collect and disseminate information required to facilitate risk management? What burdens would be placed on firms and the community in collecting it?
• Would this crowd out private investment in information?
Remove trade or regulatory barriers
• What is the purpose of the policy? What are the costs (or risks) of changing it?
• How is this barrier preventing firms from effectively investing in supply chain risk? Are there alternative regulations that achieve the same outcome and better allow for supply chain risk management?
• Faced with major disruptions, regulations that were previously sensible may be overly restrictive. Could certain regulations be suspended or amended to make adjusting to the disruption less costly?
Subsidies to stockpiling or local production
• What are the costs of stockpiling? How much would prices rise if firms were required to invest in stockpiles? How much would firms need to be subsidised to optimally invest in stockpiles? Would subsidies crowd out private action?
• What is the local cost premium stopping firms investing in local production, unassisted by government? What would the cost of subsidising local production be?


CONSULTATION
INTERIM REPORT
105
A Consultation
Consultation to inform the preparation of the interim report comprised three workshops and
bilateral meetings with representatives from Australian Government agencies. The workshops
were held on 17 November 2020, 17 December 2020 and 2 February 2021. Table A.1 lists the
agencies that were involved. Given the timelines of the study, the Commission has been
constrained in its ability to consult more widely.
Table A.1 Agencies that attended workshops or bilateral meetings
Austrade
Commonwealth Scientific and Industrial Research Organisation (CSIRO)
Department of Agriculture, Water and the Environment
Department of Defence
Department of Foreign Affairs and Trade
Department of Health
Department of Home Affairs
Department of Industry, Science, Energy and Resources
Department of Infrastructure, Transport, Regional Development and Communications
Department of the Prime Minister and Cabinet
Department of the Treasury
National COVID-19 Commission


CASE STUDIES IN VULNERABILITY
INTERIM REPORT
107
B Case studies in vulnerability
This appendix presents three case studies of essential goods to describe some of their
properties and possible reasons for their vulnerabilities. The goods are: rare earths, water
treatment chemicals and long-term fire retardant.
B.1 Estimating global supply concentrations
The first part of the framework developed for this study is to identify vulnerable goods. In
chapter 4 three filters are applied to identify potentially vulnerable imports.
• The first ascertains whether the sources for each Australian import are highly
concentrated. An import is deemed to be concentrated when more than 80 per cent
originates from a single origin.
• The second filter ascertains whether the products are sourced from a concentrated global
market. Global markets are considered highly concentrated when the main supplying
country accounted for over 50 per cent of global exports or when the
Herfindahl-Hirschman Index (HHI) is greater than 3100 points.
• The third filter determines whether Australia sourced its concentrated imports from the
main global supplier in a globally concentrated market.
These filters are used to examine the supply chains of goods and inputs for rare earths, water
purification and fire retardant.
B.2 Case studies
Rare earths
Rare earths (HS code 280530) are a group of 17 elements composed of scandium, yttrium, and
lanthanides, which feature unique catalytic, metallurgical, nuclear, electrical, magnetic, or
luminescent properties. Rare earth compounds are critical inputs in the manufacture of a
number of essential technologies and industries such as electronics, renewable energy, medical
and defence (Dushyantha et al. 2020). Rare earth elements are relatively abundant in the
Earth’s crust but rarely cluster in exploitable ore bodies (Haxel, Hendrick and Orris 2002).

108 VULNERABLE SUPPLY CHAINS
INTERIM REPORT
Australian imports of rare earths in 2018 were virtually nil19, reflecting the small size of the
Australian manufacturing sector that uses these materials. Using the framework (chapters 3
and 4), imports of rare earths are not deemed to be vulnerable since the main supplying
economy accounts for less than 80 per cent of imports. However, global trade data do not
identify the 17 individual elements separately, and determining Australia’s vulnerability in
each would require more detailed data.
As of 2018, the global market for rare earths was not highly concentrated: as a group, rare
earths had a HHI of 2555. Globally, the largest exporter was Vietnam (34.9 per cent),
followed by China (31.6 per cent), and then Australia (16.3 per cent).
However China’s role in rare earths is more important than the export data suggests. As the
world’s dominant supplier, it produces about 90 per cent of all output (Dushyantha et
al. 2020). Before 2010 this was reflected in the trade data (figure B.1) but the period since
has seen China’s market share drop away as export quotas were tightened to ‘ensure
sustainability and curb environmental damage’ (Branigan 2010).
Australian imports may be small, but rare earths are critical components of machinery, and
electronic and medical equipment, some of which is likely to be essential. Disruption in the
supply of rare earth would affect Australia as an end user of such equipment. Some of these
goods have been identified in chapter 4 as being vulnerable, including laptops.
19 Significant differences exist between global trade data sources for rare earths, particularly in Australia’s
contribution to the world market. Analysis presented here is drawn from the BACI database provided by
Centre d'Etudes Prospectives et d'Informations Internationales (CEPII).

CASE STUDIES IN VULNERABILITY
INTERIM REPORT
109
Figure B.1 Market concentration has declined following hina’s export restrictions
Data source: Observatory of Economic Complexity (2018).
Water treatment chemicals
A continuous, stable and reliable supply of drinking water is essential. While water itself is
sourced locally, making it drinkable is a multi-step process that involves a number of
chemical inputs whose supply might be vulnerable.
In Australia, drinking water quality is governed by state authorities following national
guidelines that outline a number of chemicals that can be used in the treatment process.
Water treatment chemicals are distributed across several HS codes and most chemicals
appear to are not vulnerable when the first two filters are applied. In most cases where import
concentrations of products have been greater than 80 per cent, the HHI for those products
have shown the global market to be competitive (table B.1).
One exception, however, is disodium carbonate, where 93 per cent of Australia’s imports are
sourced from a dominant world supplier which possesses a market share in excess of
50 per cent. Although the world market appears relatively competitive (HHI 2314), Australia’s
concentrated buying patterns mean the supply chain for disodium carbonate is vulnerable.
That said, disodium carbonate is not critical as its role in pH correction appears to be
substitutable. In the pH correction process, lime can be used instead of disodium carbonate and
is applied by adding either slaked lime or quicklime; both are not vulnerable (table B.1).
China
Vietnam
Australia
0
10
20
30
40
50
60
70
80
2006 2008 2010 2012 2014 2016 2018
Year
Pe
rce
nta
ge
sh
are
of
rare
ea
rth
ex
po
rts

110 VULNERABLE SUPPLY CHAINS
INTERIM REPORT
Likewise, sodium hydroxide can also be used as a substitute for disodium carbonate and is traded
in a large, competitive market with imports to Australia also being relatively unconcentrated.
Table B.1 Water treatment chemicals are not vulnerable
Product HS code Use Concentration
of Australian imports (%)
HHI by valuea
Export share of main global
suppliera
Aluminium sulphate 283322 Coagulation 91.9 780.5 18.9
Water filtering or purifying machinery or apparatus
842121 Filtration 25.4
Calcium hypochloriteb 282810 Disinfection 73.0
Potassium permanganate 284161 Disinfection 38.7
Ammonium sulphatec 310221 Disinfection 66.4
Copper sulphate 283325 Disinfection 40.5
Parts for lamps (including UV)
853990 Disinfection 35.1
Includes UV lamps 853949 Disinfection 34.6
Chlorine 280110 Disinfection 83.7 1251.3 27.0
Hydrogen peroxide 284700 Disinfection 100.0 1243.2 23.9
UV or IR apparatus 901820 Disinfection 30.9
Granulated activated carbon 380210 Disinfection 22.1
Hydrochloric acid 280610 Disinfection 36.0
Anhydrous ammonia 281410 Disinfection 69.8
Disodium carbonate 283620 pH Correction 90.9 2885.8 50.7
Phosphoric acidd 280920 pH Correction 96.3 1703.5 35.3
Sodium tripolyphosphate 283531 pH Correction 65.7
Sodium hydroxide 281511 pH Correction 47.9
Sodium bicarbonate 283630 pH Correction 54.6
Sulphuric acid 280700 pH Correction 54.7
Quicklime 252210 pH Correction 36.7
Slaked lime 252220 pH Correction 41.7
a Calculated for products with import concentration in excess of 80 per cent. b Generally used in small
systems only. c Used in the manufacture of chloramine. d For making sodium hexametaphosphate.
Sources: ABS (Merchandise Imports and Import Clearances, 2020, unpublished), UN Comtrade data,
Melbourne Water (2020), NHMRC (2011).
Long-term fire retardant
There are two types of fire retardants. Short-term fire retardants are added to water and
applied directly to a fire, enhancing the extinguishing ability of water itself. These typically
take the form of liquids or foams. Long-term fire retardant is usually delivered from the air,
mostly by fixed-wing aircraft to create fire breaks. It can be applied to slow or stop the
progress of a fire, or as a preventative measure to protect property or strategic infrastructure

CASE STUDIES IN VULNERABILITY
INTERIM REPORT
111
(DHHS (Vic) 2017). Long-term fire retardant was used extensively during Australia’s
2019-20 bushfire season with large air tankers applying over 24 million tonnes across
Australia (Royal Commission into National Natural Disaster Arrangements 2020a, p. 210).
Australia is reliant on a single supplier of retardant and only acquires enough in advance to
cover a ‘standard’ bushfire season (Royal Commission into National Natural Disaster
Arrangements 2020a, p. 233). The report suggested procurement plans should match
‘anticipated requirements’ and if that proved impossible, consideration should be given to
domestic production.
The long-term fire retardant referred to in the Royal Commission report is the PHOS-CHeK
range, manufactured by Perimeter Solutions in the United States. Perimeter Solutions
supplies PHOS-CHeK to both Australian and North American fire and forestry services.
Perimeter Solutions appears to be the only supplier of long-term fire retardant.
Trade in these products is not recorded under a standalone HTISC category. Given this lack
of detail it is difficult to use trade data to assess its vulnerability. That said, sourcing this
product from a single firm and plant makes it vulnerable to disruption.


TECHNICAL APPLICATION
INTERIM REPORT
113
C Technical application of the
analytical framework
This appendix provides details on the application of the analytical framework developed in
chapter 3 to Australian imports data presented in chapter 4.
• Section C.1 describes how the vulnerability of Australian imports data to supply risks
arising from limited sources of supply was assessed.
• Section C.2 describes how Australian production data were used to assess the role that
vulnerable imports played in the domestic production of essential goods and services.
The annexes to this appendix provide supporting information about the data sources and the
product classifications used.
C.1 Assessing import vulnerability
The mechanical sorting undertaken in chapter 4 identified Australian imports that were
sourced from the main global suppliers in concentrated markets (step 1 of the framework
outlined in chapter 3).
This approach considered vulnerability arising from two perspectives:
1. from reliance on existing suppliers and trade flows to provide an indication of actual
supply risks
2. from possible sources of supply to provide an indication of potential supply risk.
To illustrate the difference, while Australia may source all its imports of a particular product
from a single country, other countries may be able to supply the product in the event of a
disruption to supply.
The mechanical sorting involved progressively applying three filters to ascertain whether:
1. the main supplier of each product accounts for a large share of Australian imports
2. Australia sources its imports of each product from a concentrated global market
3. Australia sources it its imports from the main supplier in a concentrated global market.
The first filter relates to Australian imports, while the second and third filters relate to global
markets. Given this, the analysis used two trade data sets — Australian imports data sourced

114 VULNERABLE SUPPLY CHAINS
INTERIM REPORT
from the Australian Bureau of Statistics (ABS); and the United Nation’s Comtrade database
of global trade (annex A).1
The products that remain after applying all three filters are sourced from the main supplier
in a highly concentrated global market with limited, if any, alternative sources of supply in
the event of a disruption to existing suppliers. Such products are likely to be more susceptible
to disruption than products sourced from more diversified markets.2
Approach used
Assessing import vulnerability involved linking Australian imports and global trade data at
the same point in time. Linking trade data raised a series of questions:
1. As trade data come in different levels of product aggregation, what level of product
disaggregation is appropriate for analysing supply chain risks?
2. Trade data relate to specific periods of time (such as monthly, and calendar and financial
years), what time period is appropriate for the analysis?
3. As some trade is irregular and lumpy (such as imports of civilian aircraft and natural gas
drilling platforms), should the analysis focus on a single year or span several years?
Level of analysis
Trade and economic data are invariably aggregated to some extent (see annex B for details
on product classifications). The trade data used in chapter 4 are classified according to the
international Harmonized System (HS), or its Australian extension known as the
Harmonized Tariff Item Statistical Code (HTISC). The HTISC has five levels of product
aggregation, ranging from highly aggregated (known as the 2-digit Chapter) to highly
disaggregated (Statistical codes, 10-digit). The number of products imported by Australia in
2016-17 differed by product classification (figure C.1).
Finer levels of product disaggregation enable a closer alignment with the specific products
that may give rise to supply chain vulnerability, while higher levels of aggregation group
products with broadly similar characteristics to reduce the volume of data. Some very fine
levels of disaggregation add additional detail that is unnecessary for most purposes (such as
differentiating the same product based on its thickness).
1 The use of global trade data to identify alternative potential suppliers may understate the number of
concentrated products, as it implicitly assumes that all sources of potential supply are open to Australia,
which may not actually be the case. Australian biosecurity restrictions, for example, prohibit the
importation of certain agricultural products from potential suppliers even if supplies of these products were
available on the world market.
2 The interest in potential suppliers means that the focus in the global trade analysis is on countries that export
each product (even though the chapter focuses on Australian imports).
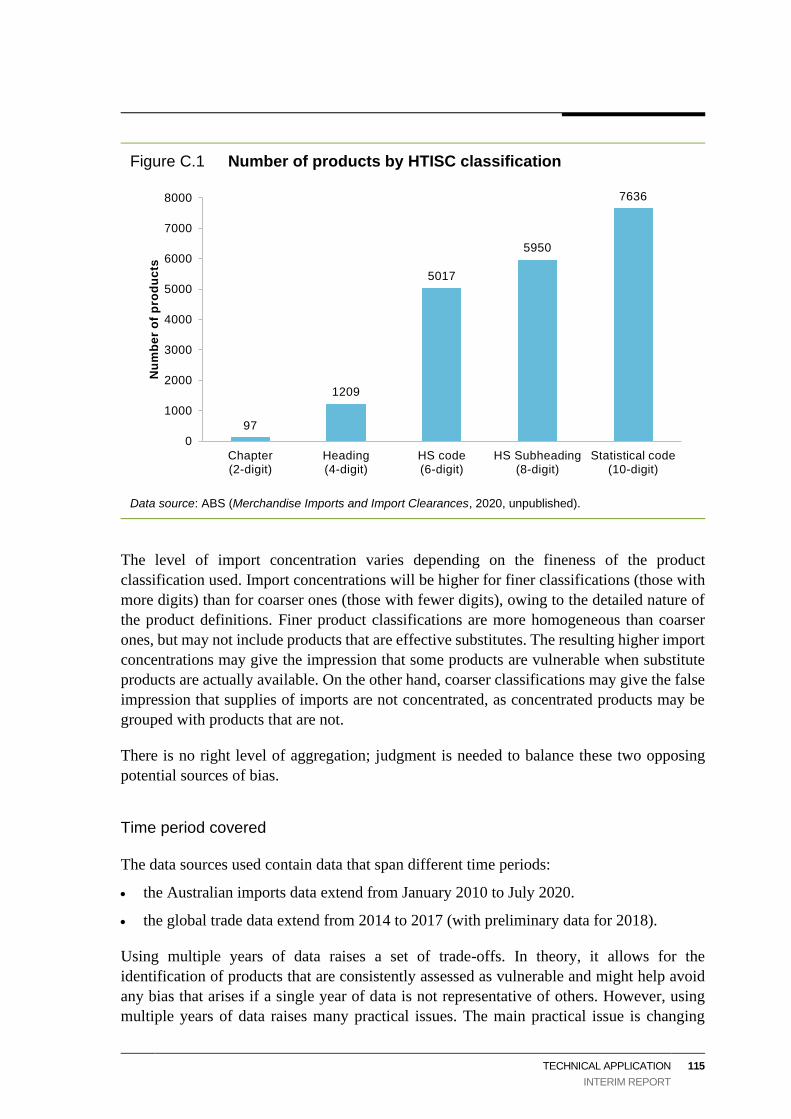
TECHNICAL APPLICATION
INTERIM REPORT
115
Figure C.1 Number of products by HTISC classification
Data source: ABS (Merchandise Imports and Import Clearances, 2020, unpublished).
The level of import concentration varies depending on the fineness of the product
classification used. Import concentrations will be higher for finer classifications (those with
more digits) than for coarser ones (those with fewer digits), owing to the detailed nature of
the product definitions. Finer product classifications are more homogeneous than coarser
ones, but may not include products that are effective substitutes. The resulting higher import
concentrations may give the impression that some products are vulnerable when substitute
products are actually available. On the other hand, coarser classifications may give the false
impression that supplies of imports are not concentrated, as concentrated products may be
grouped with products that are not.
There is no right level of aggregation; judgment is needed to balance these two opposing
potential sources of bias.
Time period covered
The data sources used contain data that span different time periods:
• the Australian imports data extend from January 2010 to July 2020.
• the global trade data extend from 2014 to 2017 (with preliminary data for 2018).
Using multiple years of data raises a set of trade-offs. In theory, it allows for the
identification of products that are consistently assessed as vulnerable and might help avoid
any bias that arises if a single year of data is not representative of others. However, using
multiple years of data raises many practical issues. The main practical issue is changing
97
1209
5017
5950
7636
0
1000
2000
3000
4000
5000
6000
7000
8000
Chapter (2-digit)
Heading (4-digit)
HS code (6-digit)
HS Subheading (8-digit)
Statistical code (10-digit)
Nu
mb
er
of
pro
du
cts

116 VULNERABLE SUPPLY CHAINS
INTERIM REPORT
product classifications which render the data inconsistent over time and which complicate
the linking of multiple years of data. The process becomes more challenging when linking
across the different product classifications used in trade data and production data.
The time period selected should reflect the current (or most recent) state of affairs. For
example, in the past 10 years, Australia’s main supplier for a product may have changed,
there may be new product technologies that replaced older ones, or the composition of the
global trade market may have changed (such as, entries and exits of exporting countries or
changes in the main exporter of a product). Using data that is not timely may result in out of
date findings.
The Australian imports data span the beginning of the COVID-19 pandemic which may not
reflect a typical year. The pandemic disrupted many trade flows, causing surges in imports
of some products (such as personal protective equipment) and a drop in imports of others
(such as manufactured products). Therefore, imports data for 2020 would not reflect a typical
year or the usual functioning of the Australian economy.
The approach taken was to focus on trade flows in 2016-17, as it reflects the latest full year
of the global trade data (2017) and the latest year of detailed production data. Given product
classifications change over time, using a similar reference year facilitated the linking across
multiple data sources (trade and production).
Thresholds used to assess concentration
Measures of concentration were used to ascertain the degree to which a product had a limited
source of supply, and was, therefore, identified as vulnerable to disruption.
The trade data capture trade flows at the country level, not the firm level.3 Thus, ‘supplier’
refers to a supplying country. This also means that measures of concentration may be
overstated, as there may be many firms within a country who supply a product.
Australian import data
The concentration of imports was determined by assessing:
• the share of imports that each supplying country accounted for (referred to as ‘import
concentration’)
3 The geographic classifications used in the data is a mixture of sovereign countries (such as Papua New
Guinea and Thailand) and geographic regions (such as Antarctica and the Channel Islands). Countries such
as China, France, and the United Kingdom consist of multiple regions. For simplicity, the analysis talks in
terms of ‘countries’ rather than ‘economies’.

TECHNICAL APPLICATION
INTERIM REPORT
117
• the share of imports accounted for by the largest supplying country. Shares are based on
the value of imports.4
The share of Australian imports accounted for by the largest supplying country varied
markedly across products in 2016-17 (figure C2).
Figure C.2 Distribution of the share of Australian imports accounted for by the largest supplying country, 2017a
a Share of imports from the largest supplying country.
Data source: ABS (Merchandise Imports and Import Clearances, 2020, unpublished).
Nevertheless, most imported products came from markets with high levels of concentration.
Roughly, one-in-seven imported products in 2016-17 (13.9 per cent) came from markets
where the main supplying country accounted for 90 to 100 per cent of all imports by value. An
additional one-in-five products (17.8 per cent) came from markets where the main supplier
accounted for 70 to 90 per cent of imports. Indeed, over half of all products came from markets
where one country accounted for more than 50 per cent of imports of that product.
Judgement is required when choosing a threshold to classify an import as ‘concentrated’.
The number of concentrated imports identified is sensitive to the threshold selected (see
sensitivity analysis below). A threshold of over 80 per cent was selected. As with any
selected threshold, there might be products with high import concentrations (such as 79 per
cent) that will be excluded but may potentially be an input into an essential industry that a
policy maker might be concerned about. However, a threshold of 80 per cent provides a more
4 The free on board (FOB) value is used because the alternative (the commercial invoice value, insurance costs,
and freight, CIF value) includes freight and insurance costs which may distort the measure of concentration.
0%1.3%
9.9%
15.4%16%
14.1%
11.6%
9.1% 8.7%
13.9%
0
5
10
15
20
0-10 10-20 20-30 30-40 40-50 50-60 60-70 70-80 80-90 90-100
Maximum import share
Pe
r c
en
t o
f p
rod
uc
ts

118 VULNERABLE SUPPLY CHAINS
INTERIM REPORT
conservative approach than a threshold of 90 per cent (which might appear to be the natural
threshold choice given, in figure C.2, the distribution increases at the 90 per cent threshold).
Global trade data
Concentration in global market supply was assessed in terms of:
• the main exporter’s share of global trade
• the Herfindahl-Hirschman Index (HHI).
Most empirical studies of market concentration calculate market shares based on financial
values (such as the value of trade). However, market shares can also be calculated using the
quantities traded. The two measures are generally highly correlated, but need not be.
Diamonds are an example where a value share may differ materially from a quantity share,
given the importance of quality (such as cut, colour, and clarity) in determining value.
Differences can also occur for other reasons, such as differences in production concentration
implying different unit prices.
The UN Comtrade database includes data on trade flows in both value and quantity terms,
such that the market share could be calculated using either measure.5
Choosing whether to calculate market shares based on quantity or value is not
straightforward. If products within a product group are substitutes — even though their price
and quality may differ — then quantity-based market shares indicate potential sources of
supply are available from another supplier (regardless of the price or quality). However,
quantity data is sometimes missing from the global trade data for some products and,
therefore, need to be imputed.
The most comprehensive approach to identify all concentrated global markets is to calculate
concentration measures using both a value-based market share and a quantity-based market
share. The use of both measures errs on the side of caution by flagging the largest set of
products for further investigation.
The share of global supply (exports) accounted for by the largest supplier of a product is
presented in figure C.3. For only 1.6 per cent of products, the highest share was between 90
and 100 per cent. This means that, although there were other suppliers of the product, one
country accounted for over 90 per cent of global exports. For a quarter of all products, the
highest export share was greater than 50 per cent (that is, one supplier accounted for over
half of a product’s exports). The supply of these products may be vulnerable because of few
potential suppliers and the potential for abuse of any market dominance (such as when China
put quotas on exports of rare earth metals (Shen, Moomy and Eggert 2020, p. 127).
5 Quantity is reported in net weight in kilograms for most products and the value reported as the FOB value.
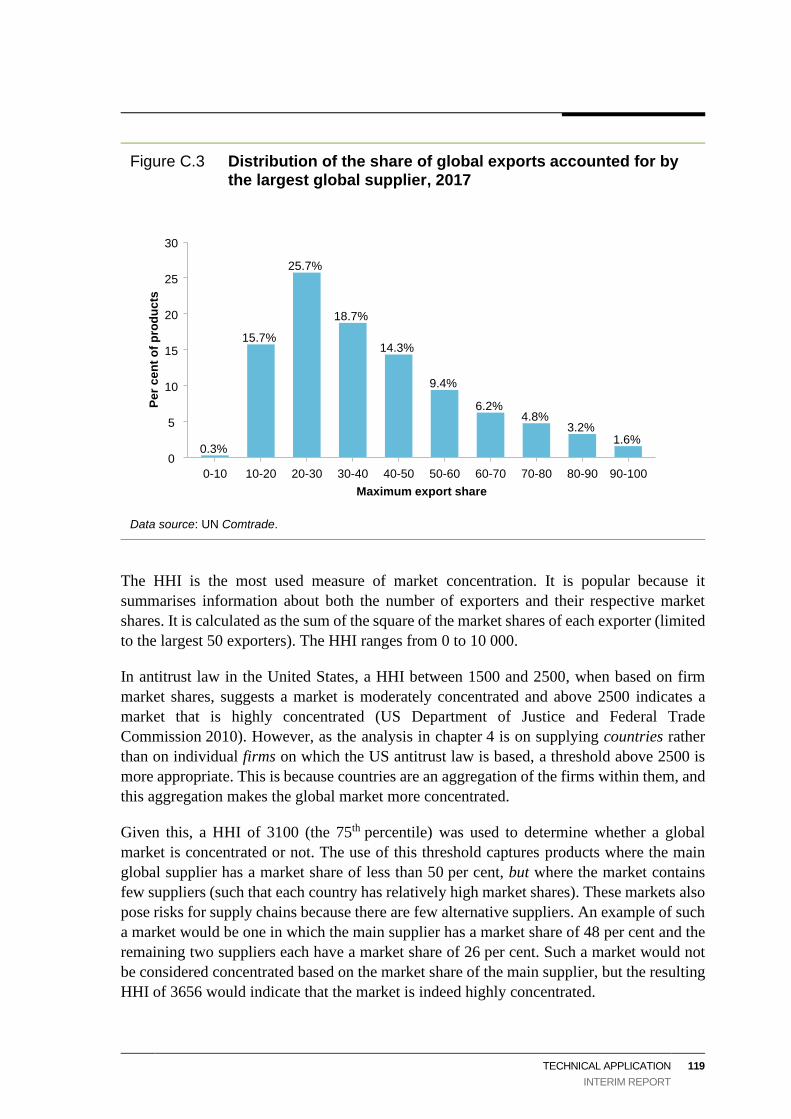
TECHNICAL APPLICATION
INTERIM REPORT
119
Figure C.3 Distribution of the share of global exports accounted for by the largest global supplier, 2017
Data source: UN Comtrade.
The HHI is the most used measure of market concentration. It is popular because it
summarises information about both the number of exporters and their respective market
shares. It is calculated as the sum of the square of the market shares of each exporter (limited
to the largest 50 exporters). The HHI ranges from 0 to 10 000.
In antitrust law in the United States, a HHI between 1500 and 2500, when based on firm
market shares, suggests a market is moderately concentrated and above 2500 indicates a
market that is highly concentrated (US Department of Justice and Federal Trade
Commission 2010). However, as the analysis in chapter 4 is on supplying countries rather
than on individual firms on which the US antitrust law is based, a threshold above 2500 is
more appropriate. This is because countries are an aggregation of the firms within them, and
this aggregation makes the global market more concentrated.
Given this, a HHI of 3100 (the 75th percentile) was used to determine whether a global
market is concentrated or not. The use of this threshold captures products where the main
global supplier has a market share of less than 50 per cent, but where the market contains
few suppliers (such that each country has relatively high market shares). These markets also
pose risks for supply chains because there are few alternative suppliers. An example of such
a market would be one in which the main supplier has a market share of 48 per cent and the
remaining two suppliers each have a market share of 26 per cent. Such a market would not
be considered concentrated based on the market share of the main supplier, but the resulting
HHI of 3656 would indicate that the market is indeed highly concentrated.
0.3%
15.7%
25.7%
18.7%
14.3%
9.4%
6.2%4.8%
3.2%1.6%
0
5
10
15
20
25
30
0-10 10-20 20-30 30-40 40-50 50-60 60-70 70-80 80-90 90-100
Maximum export share
Pe
r c
en
t o
f p
rod
uc
ts

120 VULNERABLE SUPPLY CHAINS
INTERIM REPORT
Linking global trade data to Australian imports data
The Australian imports and global trade data were linked at the product level.
The World Customs Organization (WCO) revises the HS every five years, which makes
linking by product classifications more challenging for the years in which the HS is revised.
All of the global trade data use the 4th HS revision, which was implemented in 2012. As the
Australian HTISC is based on the international HS classification, the Australian
classifications also change, such that imports data between 2012 and 2016 use the 4th HS
revision, but data after 2016 use the 5th revision that was implemented in 2017, which
requires additional concordance work.
Sensitivity analysis
Sensitivity testing was undertaken to gauge the robustness of the import vulnerability
analysis to:
• the level of product aggregation and concentration threshold selected
• the minimum value needed for a product to be considered potentially vulnerable
• whether imports of all products are likely to be essential.
Using a different concentration threshold and level of analysis
The number of imports identified is sensitive to the selection of product classification and
the threshold for classifying imports as concentrated (table C.1). The use of coarser
aggregated product classifications (those with fewer digits) results in fewer concentrated
imports. Here, the concentration measures are typically lower because they reflect the
average concentration for a large group of products — some of which may not be substitutes.
For coarser product aggregations, a lower concentration threshold is appropriate. The use of
highly disaggregated product classifications (those with more digits) results in many
concentrated imports, especially if the threshold is set low. For finer product aggregations,
a higher concentration threshold is appropriate.

TECHNICAL APPLICATION
INTERIM REPORT
121
Table C.1 Number of imports identified as concentrated by threshold and
product classification, 2016-17
HTISC classification
2-digit
(97 products)
4-digit
(1209 products)
6-digit
(5017 products)
8-digit
(5950 products)
10-digit
(7636 products)
90 per cent 0 83 625 826 1 072
80 per cent 1 141 1 051 1 342 1 733
70 per cent 3 239 1 514 1 885 2 442
60 per cent 16 386 2 122 2 573 3 327
50 per cent 24 534 2 805 3 412 4 402
Source: ABS (Merchandise Imports and Import Clearances, 2020, unpublished).
Using different value thresholds
The analysis in chapter 4 included all imports regardless of the values involved. This resulted
in many small trade flows being assessed as vulnerable. However, small import values are
generally unlikely to cause material consequences for the Australian economy if imports
were to be disrupted, irrespective of whether they come from concentrated markets or not.
To test the sensitivity of the results to the absence of any minimum value threshold, the
analysis was repeated using four alternative thresholds: A$400 000, A$1 million,
A$10 million, and A$50 million (table C.2).
Using different sectoral coverage
The analysis in chapter 4 included imports from all sectors of the Australian economy. This
resulted in many imports being identified as vulnerable, even though any disruption to their
supply is unlikely to cause any significant impact on activities of national significance (such
as wrist watches, Christmas decorations, and sparkling wine). These products are unlikely
to be essential, even if they are identified as vulnerable.
To test the sensitivity of the results to the inclusion of imports from all sectors, the analysis
was repeated excluding those 2-digit HTISC Chapters that are less likely to be critical to
national activities (primarily imports of many agricultural items, some foods and many
non-essential consumer-orientated manufacturing products).
Simultaneously imposing a minimum value threshold and restricting the sectoral coverage
reduces the number of potentially susceptible imports (table C.2). The restricted sectoral
coverage, coupled with a A$50 million value threshold, reduces the number of products to 35.
These sensitivity tests indicate that the approach taken to defining and assessing import
vulnerability has a material impact on the number and type of products identified as vulnerable.

122 VULNERABLE SUPPLY CHAINS
INTERIM REPORT
Table C.2 Sensitivity testing of the number of most concentrated imports, 2017
Minimum value threshold Restricted HTISC Chaptersa
0 550
$400 000 318
$1 million 252
$10 million 105
$50 million 35
a Excluding HTISC Chapters 1 to 24, 33, 39 to 71, 92, and 94 to 99.
Data source: ABS (Merchandise Imports and Import Clearances, 2020, unpublished).
C.2 Assessing essential goods and services
The application of step 2 of the framework involved assessing whether any of the vulnerable
imports identified in step 1 are:
• used as inputs in domestic production by essential industries, and whether the output of
these industries are vital for meeting the basic needs of Australians (these imports are
indirectly vital, as they form part of the local production of goods and services that meet
the basic needs of Australians)
• vital for directly meeting the basic needs of Australians (these imports are directly
consumed by Australian households).
Ascertaining the importance of vulnerable imports in the Australian economy — in terms of
both their role in Australian production and their use in meeting the basic needs of
Australians — required the linking of Australian imports data with Australian data on the
production and consumption of different products.
The I–O tables
The analysis used Australian production data from the ABS Input-Output (I–O) tables for
2016-17 (ABS Cat. no. 5209.0.55.001). A summary of this data is outlined in annex A.
The I–O tables, which are contained in a series of excel spreadsheets, contain the most
detailed production and consumption data available for the Australian economy that shows
the interlinkages between products and industries in a given reference year (in this case, the
financial year 2016-17). The tables cover:
• 114 products classified according to the ‘Input-Output Product Groups’, or IOPGs,
which are generally listed in the rows
• 114 industries classified according to the ‘Input-Output Industry Groups’, IOIGs, which
are generally listed in the columns.

TECHNICAL APPLICATION
INTERIM REPORT
123
Some additional product information is supplied, with a lag, in the supporting ABS
Input-Output Product Details according to the more detailed Input-Output Product
Classification (ABS Cat. no 5215.0.55.001). Even in its most disaggregated form, the
products in the I–O tables are far more aggregated than those in the imports data used.
The key I–O tables that are relevant to the application of the analytical framework reported
in chapter 4 are:
• the ‘use table’, which details the use of each product by each industry and category of
final demand (I–O table 2)
• the ‘imports table’, which details the use of each imported product by each industry and
category of final demand (I–O table 3).
The use of domestic products by industries and category of final demand was derived by
subtracting the use of imports from total use (that is, quadrants 1 and 2 in the use table less
quadrants 1 and 2 from the imports table).
The basic structure of each of the key I–O tables is depicted in figure C.4.
• Quadrants 1 and 2 together show the total use of products. This includes the use of
products as intermediate inputs into production by industries (quadrant 1) and final
demand of households, government, gross fixed capital formation, changes in
inventories, and exports (quadrant 2).
• Quadrants 1 and 3 together show the use or primary factors (labour and capital) and taxes
used in production of each industry and by each category of final demand.
Quadrants 1 and 3 detail the cost structure of each industry (covering intermediate inputs
use, primary factors use, and taxes).

124 VULNERABLE SUPPLY CHAINS
INTERIM REPORT
Figure C.4 Structure of an I–O table spreadsheet
Classifying IOIG/IOPGs as essential
The narrow definition of essential goods and services outlined in chapter 3 are those that ‘meet
the basic needs of Australians’, and include: the provision of water, medicines, communications,
energy, defence, health, logistics, transactional banking, and government services.
This conceptualisation of essential goods and services is mapped to the products and
industries that produce them in the I–O tables (table C.3).
Essential industries relate to the Australian production of essential products by each of the
relevant IOIG industries. Essential products relate to the consumption (use) of each
corresponding IOPG by each industry and category of final demand.
The industry and product labels in the I–O tables are identical, thus giving the appearance
that the tables are symmetric. However, the products and industries are conceptually
different. Typically, an industry (IOIG) is the largest producer of their corresponding product
(IOPG). However, many industries may also produce products that are the primary to another
industry — this is known as secondary production (shown in the I–O ‘supply table’, table 1).
The approach used here implicitly defines an industry as essential which means that every
product that an industry produces is considered essential. However, in practice there may be
outputs of an industry that are more essential than others. For example, the ‘Human
Pharmaceuticals and Medicinal Product Manufacturing’ (IOIG 1801) industry predominately
Inte
rme
dia
te in
pu
ts
(11
4 IO
PG
)
Intermediate demand (114 IOIGs) Final demand
Pri
ma
ry i
np
uts
Quadrant 1
Intermediate usage
Quadrant 2
Final demand
Quadrant 3
Primary inputs into production
Quadrant 4
Primary inputs into final demand
To
tal s
up
ply
Australian production

TECHNICAL APPLICATION
INTERIM REPORT
125
produces human pharmaceuticals and medicines (IOPG 1801) but they also produce some
amount of basic chemical manufacturing (IOPG 1803), which may not be as essential in meeting
the basic material needs of Australians.
Table C.3 Mapping of essential goods and services to Australian production data
Essential good or service Input-Output Product/Industry Group (IOIG/IOPG)
Banking (1) Finance (6201)
Health (4) Human Pharmaceutical and Medicinal Product Manufacturing (1801)
Veterinary Pharmaceutical and Medicinal Product Manufacturing (1802)
Health Care Services (8401)
Residential Care and Social Assistance Services (8601)
Water services (1) Water Supply, Drainage and Drainage Services (2801)
Communications (3) Broadcasting (exc Internet) (5601)
Internet Service Providers, Internet Publishing and Broadcasting, Websearch Portals and Data Processing (5701)
Telecommunication Services (5801)
Energy (7) Coal Mining (0601)
Oil and Gas Extraction (0701)
Petroleum and Coal Product Manufacturing (1701)
Electricity Generation (2601)
Electricity Transition, Distribution, On Selling and Electricity Market Operation (2605)
Gas Supply (2701)
Logistics (7) Road Transport (4601)
Rail Transport (4701)
Water, Pipeline and Other Transport (4801)
Air and Space Transport (4901)
Transport Support Services and Storage (5201)
Wholesale Trade (3301)
Retail Trade (3901)
Government (3) Public Administration and Regulatory Services (7501)
Defence (7601)
Public Order and Safety (7701)
Aligning the trade and production data
The ABS does not publish a concordance or mapping from the HTISC classifications used
in the trade data to the classifications used in the I-O tables. The absence of such a
concordance impedes the analysis of supply chain vulnerability.
To overcome this, the Commission constructed a concordance to link the HTISC to the I-O
tables. This process is not straightforward, and hampered by widespread changes to the trade
and production classifications over time (annex B).

126 VULNERABLE SUPPLY CHAINS
INTERIM REPORT
Annex A: Data sources
Australian imports data
The Australian imports data were sourced directly from the ABS.
The Australian Customs and Border Protection Service (ACBPS) collects detailed
information on the value of imports for customs purposes. Among other things, this
information includes:
• a description of the product imported
• the quantity imported
• the value of the imports
• the economy of origin for the imports
• numerous statistical classifications.
The ABS uses the ACBPS data as the basis for its merchandise imports statistics. The
ACBPS classifies all imported products according to the HTISC (annex B).
The Commission used existing concordances to link the ABS import data to industry
classifications.
Data confidentiality
The ABS confidentialises imports of certain products to protect the confidentiality of the
transactions involved. Confidentialisation also extends to suppressing the identity of some
supplying economies. Confidentialisation prevents the products (and/or supplying economy)
from being identified.
Data cleaning
The imports data were cleaned to make it suitable for use. First, the monthly data were
aggregated to yearly data. Second, goods that were imported into Australia that were
re-exported were removed (the ABS refers to these transactions as ‘re-exports’). Third,
imports to Australia from Australia were removed. Finally, transactions that involved
negative values (CIF, FOB, or customs value) were removed.
Global trade data
The global trade data were sourced from United Nation’s international trade UN Comtrade
database (https://comtrade.un.org/data/).

TECHNICAL APPLICATION
INTERIM REPORT
127
UN Comtrade is the largest and most comprehensive depository of international trade data.
Over 170 reporter economies provide their annual international trade statistics. At the
international level, the most detailed product classification available is the 6-digit HS code
(annex B). The data collected use the HS revision implemented in January 2012 (also known
as the 4th revision), and capture each reporting economy’s exports of a product to the world
(rather than to trading partners). Among other things, this information includes:
• a description of the product
• the exporting economy
• the quantity of the exported product
• the value of the exported product.
Trade data are typically messy and incomplete. An alternative global trade dataset was
investigated — BACI data6 (‘Base pour l’Analyse du Commerce International’: Database
for International Trade Analysis) which is built directly from UN Comtrade data and
includes bilateral trade flows for more than 5000 products and 200 countries. The BACI data
are intended to show trade flows between trade partners and so only retain trade observations
in which both trading partners are specified (that is, the importer and exporter). Whereas the
UN Comtrade data sourced here records a country’s exports of products without specifying
its trading partners. This results in some data discrepancies between the databases.
Input-Output tables
The Australian production data were sourced from the ABS for the year 2016-17.
The I–O tables form part of the Australian national accounts, complementing the quarterly
and annual series of national income, expenditure and product aggregates. They provide
detailed information about the supply and use of products in the Australian economy, and
the structure of and inter-relationships between Australian industries. Among other things,
this information includes:
• intermediate inputs into production
• final demand
• primary inputs into production
• primary inputs into final demand.
The I–O tables contain information for 114 industry and product groups, which are classified
using the IOIG and IOPG (annex B).
6 Publicly available for download: http://www.cepii.fr/cepii/en/bdd_modele/presentation.asp?id=37.

128 VULNERABLE SUPPLY CHAINS
INTERIM REPORT
Annex B: Classifications
Harmonized System and Harmonized Tariff Item Statistical Code
The HS is a 6-digit code that is maintained by the WCO. The code is reviewed every five
years and updated to ensure it remains relevant given developments in technology and
changes in patterns of international trade. There have been five revisions to the HS since the
first edition was implemented in January 1988, with the latest revision being implemented
by Australia on 1 January 2017. The previous revisions to the HS by the WCO were
implemented in Australia in 1996, 2002, 2007, 2012, and 2017. There were minor
amendments in 1992. The next revised edition is scheduled for implementation in January
2022. The ABS create non-HS chapters 98 and 99.
Under the HS, each product is assigned to a six-digit product group. The classifications are
hierarchical and arranged on a logical basis under specific Chapters (indicated by the first
two digits), Headings (indicated by the third and fourth digits) and Subheadings (indicated
by the fifth and sixth digits) (table C.4). The HS generally groups commodities according to
their degree of manufacture, the material of which they are composed, and by similar generic
descriptions. For example, live animals are classified within Chapter 1, animal hides and
skins within Chapter 41 and leather footwear within Chapter 64.
Table C.4 An example of the hierarchical structure of the HTISC
Level Code Description
Chapter 61 Articles of apparel and clothing accessories, knitted or crocheted
Heading 61.10 Jerseys, pullovers, cardigans, waistcoats and similar articles, knitted or crocheted
HS code 61.10.30 Jerseys, pullovers, cardigans, waistcoats and similar articles, of man-made fibres, knitted or crocheted
HS subheading 61.10.30.00 Jerseys, pullovers, cardigans, waistcoats & similar articles of man-made fibres, knitted or crocheted
Statistical code 61.10.30.00.53 Women’s or girls’ jerseys, pullovers, cardigans, waistcoats and similar articles (excl. sweat shirts or the like) of man-made fibres, knitted or crocheted
Australia uses an extended version of the HS known as the HTISC to classify its international
merchandise trade. The HTISC adds an additional four digits to the international six-digit
HS code to give a 10-digit code. Consequently, the first six digits of the HTISC are the same
as the first six digits of HS. The Department of Home Affairs adds the seventh and eighth
digits to allow the application of different rates of import duty (the inclusion of these two
additional digits give subheadings). The ABS adds the ninth and tenth digits for statistical
purposes (giving rise to the statistical code) (table C.4).

TECHNICAL APPLICATION
INTERIM REPORT
129
Broad Economic Classification
The BEC was introduced by the United Nations in the early 1970s. The BEC groups
commodities according to their main end-use, which align, as far as practicable, with the
System of National Accounts (SNA) framework.
The 3-digit BEC classification groups goods into nineteen basic economic categories.
Sixteen of these basic categories make up the broad end-use categories: consumption goods,
capital goods and intermediate goods. A fourth category (other goods) includes the three
remaining basic economic categories, which are difficult to assign to a single main-end use
category. These are motor spirit (321), passenger motor cars (51) and goods not elsewhere
specified (7). For example, motor spirit and passenger motor cars are used by both industry
(as intermediate consumption and capital goods respectively) and households (as
consumption goods).
An example of the different levels of aggregation for the BEC codes is presented in table C.5.
The 3-digit BEC codes can be linked to the 10-digit HTISC codes.
Table C.5 An example of the hierarchical structure of the BEC
Level Code Description SNA
Category 1 Food and Beverages
Sub-category 11 Primary
Basic category 111 Mainly for industry Intermediate goods
Basic category 112 Mainly for household consumption Consumption goods
Australian Input-Output table classifications (IOPC/IOPG/IOIG)
Input-Output Product Classification (IOPC)
The IOPC is a product classification that has been specifically developed for the compilation
and application of Australian I–O tables. Because the I–O system describes the production
and subsequent use of all goods and services, an I–O product is defined in terms of the
characteristic products of industry sectors that produce the product. The IOPC has over 900
individual product items, which are represented by an 8-digit code (these codes are unrelated
to the 8-digit HTISC codes).
Additional product information support the release of each I–O table with a lag
(Cat. no. 5215.0.55.001). The additional information enables the number of products to be
expanded from 114 IOPG to 900-odd IOPC. There is no additional industry information.
The ABS periodically revises the IOPCs. There have been five versions of the IOPC since
2005. There are publicly available concordance files between these IOPC classifications.

130 VULNERABLE SUPPLY CHAINS
INTERIM REPORT
The ABS confidentialises production and consumption information for a number of IOPC
classifications on confidentiality grounds. Two of these confidentialised products that are
particularly pertinent for the analysis of import supply chain vulnerability are air transport
and water transport.
Input-Output Product Group (IOPG)
Input-Output Product Groups (IOPG) are groups of related IOPCs that are aggregated in the
published I–O tables. There were 114 product groups (4-digit codes) in 2016-17.
Input-Output Industry Group (IOIG)
Industries in the I–O tables are classified according to Input-Output Industry Groups (IOIG),
which are based on the Australian and New Zealand Standard Industrial Classification
(ANZSIC). There were 114 industry categories (4-digit codes) in 2016-17.
The ABS has revised the IOIGs, with three versions since 2005.

IMPORT DEMAND ELASTICITIES
INTERIM REPORT
131
D Import demand elasticities
The last step of the analytical framework proposed in chapter 3 is to identify goods that are
critical to the functioning of the economy and to the wellbeing of Australians. A good is
critical if it is required for the supply of an essential good or service and cannot be substituted
easily. This appendix tests whether a data-driven approach can be used to determine the
criticality of a good. It does this by estimating demand elasticities for chemicals that are
assessed as vulnerable and essential in the import data.
D.1 What is elasticity of demand and why is it useful?
The price elasticity of demand measures how the quantity demanded of a good changes in
response to a change in price (box D.1). For most goods, if the quantity demanded decreases
significantly when its price increases, their demand is said to be elastic. A demand that is
not responsive is inelastic.
The elasticity of demand can be interpreted as an indication that the corresponding good is
critical, because it reflects both the necessity of the good and the availability of substitutes.
An inelastic demand indicates that users of the product cannot easily substitute away from it
and must absorb price increases. For example, if the price of a lifesaving medicine were to
increase, most people would still purchase it, and the quantity demanded would not decline
much in response to the price increase. However, if the medicine could be substituted, a price
increase would likely push users to purchase the alternative, decreasing the quantity
demanded for the product whose price has increased.
Timeframes affect elasticities. In the short term, a good such as petrol for vehicles might be
inelastic as alternatives are not available. But in the long term, the purchase of electric
vehicles may mean people can substitute away from petrol, making the good more elastic.
Estimating elasticities
The simplest estimate of an elasticity requires (at least) two points where the price and
quantity have changed (and other factors affecting the market remain unchanged). Statistical
methods, such as regression techniques, can be used to isolate the effect of price changes
from the effects of other influences on price — that is, by controlling for observed variables.
For example, the demand for peaches might increase with income and decrease with price;
including data on income in a regression isolates the effect of price changes from the effect
of changes in income.

132 VULNERABLE SUPPLY CHAINS
INTERIM REPORT
Box D.1 Elasticities — a primer
An elasticity is an estimate of the effect of a change in one variable from a change in another,
related variable. The price elasticity of demand (𝐸𝑝) is expressed as the percentage change in
quantity demanded of a good (%Δ𝑄), divided by the percentage change in price (%Δ𝑃) over the
same period:
𝐸𝑝 =%Δ𝑄
%Δ𝑃
Because quantity demanded declines when price increases, the price elasticity of demand is
negative. Demand is considered inelastic if the price elasticity of demand is between zero and
negative one — that is, the change in quantity demanded is less than the change in price. Demand
is elastic if its elasticity is less than negative one.
As highlighted in the diagram below, an identical price increase can have different effects on the
quantity demanded of a product depending on its elasticity — with smaller quantity changes
resulting for the product with the more inelastic demand.
While statistical methods can control for some factors, unobservable factors can affect the
accuracy of an estimate. For example, an increase to the price of iron ore is likely to increase
its output, which would increase the quantity demanded of key inputs, such as bentonite
(used as a binding agent in making iron ore pellets). An increase in the quantity of bentonite
demanded due to the increase in the production of iron ore will likely drive higher prices of
bentonite, but would not blunt demand, as these higher input prices would be offset by
increasing iron ore prices. As a result, we might observe an increase in bentonite’s price and
quantity demanded and conclude that bentonite is very inelastic, failing to take into account
the effect of the rising iron ore price on both price and quantity changes. Again, if there are
data on the price or quantity of iron ore, either variable can be used as a control variable
when estimating the demand for bentonite. But in many cases the data required will not be
available, which will reduce the quality of estimates.
Quantity
decrease
Price
in
cre
ase
Q2 Q1
P2
P1
Elastic demand
Q2 Q1
Inelastic demand
Quantity
decrease

IMPORT DEMAND ELASTICITIES
INTERIM REPORT
133
To estimate the demand elasticities of vulnerable and essential imports, the challenge is to
find a price change that is independent of other factors that affect demand. One potential
solution is to assume that Australia faces world prices and therefore price is independent of
unobservable factors affecting Australian demand. The logic is that Australia is a small
participant in the world market and so changes to Australian demand should not affect world
prices. For example, if Japan normally imports little iodine, but for some unobserved reason
increases its iodine imports, this would cause the price to increase. But this is unlikely to
affect the iodine market in Australia. The Australian market’s response to the price increase
in iodine could then be used to estimate elasticity.
This will not always be true. For example, if Japan increased its imports of iodine due to a
technological advancement that also affected Australia, then the Australian, Japanese and
world demand will be affected. In this exercise, we assume that world prices are independent
of Australian demand to estimate the elasticities of vulnerable and essential chemicals. The
reasonableness of that assumption would need to be verified in each case.
D.2 Estimating elasticities for chemicals
Using ABS import data (chapter 4 and appendix C), we estimate elasticities for five
chemicals — one of the main categories of essential and vulnerable goods identified in chapter 4.
Chemicals are likely to be more homogenous within a category than many other types of
vulnerable and essential goods, such as the various clothing categories that include personal
protective equipment among many other items. This is important because differentiated goods
each have a different price. If the goods are not homogenous, then the estimates will be affected
by changes in the composition of what is imported, rather than changes in prices.
We aggregate the monthly ABS imports data into quarters to estimate elasticities at the
8-digit HTISC level. We derive unit values (prices) by dividing the good’s value (including
insurance and freight) by its quantity. We then construct a weighted average price using
quantity as the weights to create a price variable that reflects the dominant price that the
goods are purchased at. As a robustness check we estimated the elasticities using the median
price and the results largely do not change.
To estimate the elasticity, we regress the log of the quantity on the log of the weighted average
price, including dummy variables for the year and quarter to control for annual and seasonal
effects. We do this for five chemicals1, including disodium carbonate and citric acid.
The results are presented in figure D.1. These results indicate that:
• the demand for disodium carbonate is highly elastic
• results for citric acid are inconclusive
• demands for the other chemicals are inelastic.
1 To avoid identifying specific products, three chemicals are identified as chemical 1, chemical 2 and chemical 3.

134 VULNERABLE SUPPLY CHAINS
INTERIM REPORT
Figure D.1 Demand for some chemicals is elastic and demand for others is inelastic
Regression coefficients with 95 per cent confidence intervalsa,b
a Dots indicate the value of the coefficient. Whiskers represent the 95 per cent confidence intervals. We
tested whether the results were statistically significantly different from negative one. Results for disodium
carbonate (are significantly less than negative one at the five per cent level); citric acid (not statistically
significant); chemical 1 (significantly greater than negative one at the ten per cent level), chemical 2
(significantly greater than negative one at the five per cent level), and chemical 3 (significantly greater than
negative one at the one per cent level) b Shaded area indicates region with estimates less than negative
one (elastic demand).
Source: Commission estimates.
What can this tell us about criticality?
As noted earlier, the estimates of elasticity can provide an indication of a chemical’s
criticality. The results of our regression analysis show that the demand for some chemicals
are inelastic, which suggests they might be critical inputs.
However, criticality is also determined by a chemical’s potential uses (box D.2), and whether
it is an input into essential production. As shown in figure D.2, the data used to construct the
elasticities for the chosen chemicals could reflect their uses in a number of different
industries, which are mainly not essential. It is therefore difficult to make firm conclusions
on criticality based on these results. More precise demand data are needed on prices and
quantities for the specific products used in the essential industry only.
The estimates from the regressions on disodium carbonate broadly accord with analysis in
appendix B, which indicates that many alternative pH correctors can be used to treat water.
But again, the regression results are limited by the fact that the water industry accounts for
-6
-4
-2
0
2
4
Disodiumcarbonate
Citricacid
Chemical 1 Chemical 2 Chemical 3
Chemicals
Es
tim
ate
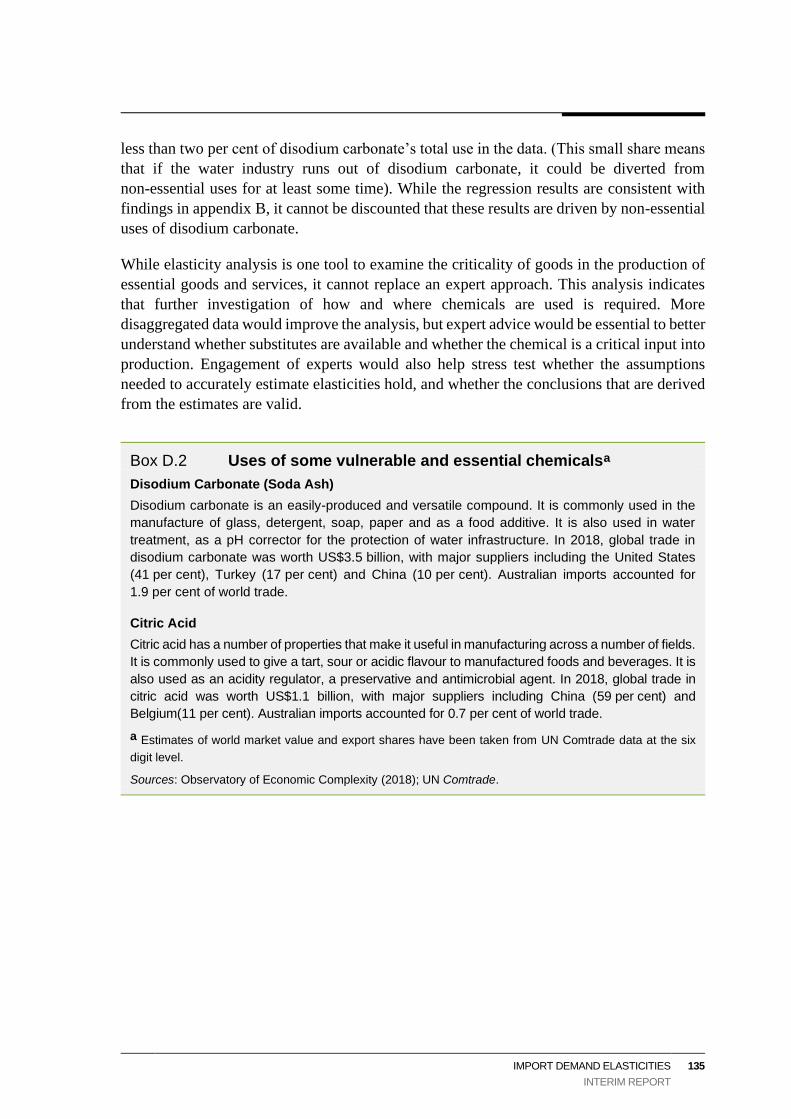
IMPORT DEMAND ELASTICITIES
INTERIM REPORT
135
less than two per cent of disodium carbonate’s total use in the data. (This small share means
that if the water industry runs out of disodium carbonate, it could be diverted from
non-essential uses for at least some time). While the regression results are consistent with
findings in appendix B, it cannot be discounted that these results are driven by non-essential
uses of disodium carbonate.
While elasticity analysis is one tool to examine the criticality of goods in the production of
essential goods and services, it cannot replace an expert approach. This analysis indicates
that further investigation of how and where chemicals are used is required. More
disaggregated data would improve the analysis, but expert advice would be essential to better
understand whether substitutes are available and whether the chemical is a critical input into
production. Engagement of experts would also help stress test whether the assumptions
needed to accurately estimate elasticities hold, and whether the conclusions that are derived
from the estimates are valid.
Box D.2 Uses of some vulnerable and essential chemicalsa
Disodium Carbonate (Soda Ash)
Disodium carbonate is an easily-produced and versatile compound. It is commonly used in the
manufacture of glass, detergent, soap, paper and as a food additive. It is also used in water
treatment, as a pH corrector for the protection of water infrastructure. In 2018, global trade in
disodium carbonate was worth US$3.5 billion, with major suppliers including the United States
(41 per cent), Turkey (17 per cent) and China (10 per cent). Australian imports accounted for
1.9 per cent of world trade.
Citric Acid
Citric acid has a number of properties that make it useful in manufacturing across a number of fields.
It is commonly used to give a tart, sour or acidic flavour to manufactured foods and beverages. It is
also used as an acidity regulator, a preservative and antimicrobial agent. In 2018, global trade in
citric acid was worth US$1.1 billion, with major suppliers including China (59 per cent) and
Belgium(11 per cent). Australian imports accounted for 0.7 per cent of world trade.
a Estimates of world market value and export shares have been taken from UN Comtrade data at the six
digit level.
Sources: Observatory of Economic Complexity (2018); UN Comtrade.

136 VULNERABLE SUPPLY CHAINS
INTERIM REPORT
Figure D.2 The biggest users of chemicals are not essential industries
Essential and non-essential industriesa using chemicals, percentage by valueb
a Banking, communications and government do not use these chemicals and are omitted from the chart.
Non-essential industries are all other industries. b Value includes insurance and freight. Appendix C contains
more detail on apportioning methodology.
Source: Commission estimates.
Other possible limitations
In addition to challenges in identifying the essential uses of these chemicals, the results
should also be interpreted with caution due to other limitations.
The regression includes quarterly and yearly dummy variables to control for seasonal and
annual effects. Results are sensitive to the inclusion of these dummy variables (table D.1).
The adjusted R-squared is highest (in most cases) where the dummy variables are included,
indicating that the dummy variables have some explanatory power and should be included
in the regression. The data show seasonal and annual patterns, consistent with the
explanatory power of the dummy variables (figure D.3). For example, imports of chemical 3
tend to dip in the second quarter, and the quantities of disodium carbonate and citric acid
seem to grow year-on-year, especially after 2014.
Relevant variables that might be driving demand in Australia could be missing from the
regressions. As outlined in the iron ore example above, an increase in the price of an output
might raise the prices of inputs and simultaneously increase the quantity demanded of inputs
(or dull a decrease in demand for them), resulting in an estimate that is more inelastic than
the effect we are trying to measure. Quarterly and yearly dummy variables control for some
of these unobserved factors (such as growth in demand relating to population and economic
0
25
50
75
100
Disodium
carbonate
Citric acid Chemical 1 Chemical 2 Chemical 3
Chemicals
Pro
po
rtio
n
All Other Energy Health Logistics Water

IMPORT DEMAND ELASTICITIES
INTERIM REPORT
137
growth), but there are many other possible influences on demand. For example, there could
be technological changes that increase efficiency and could therefore decrease demand.
Other technological changes could create new uses for a product, thus increasing demand
for it. These effects could bias estimates.
Finally, estimates might reflect changes in the import mix, rather than a response to a price
change. One way to assess this is by looking at prices of individual transactions. Variation
in prices might indicate some heterogeneity in the products recorded. For example, a
chemical could be sold in different concentrations, which would be reflected in their prices.
While there is clustering around the weighted average price for some chemicals (figure D.4),
there is still a lot of variation for what is assumed to be a homogenous group of products —
or at least a group whose mix does not change markedly. Changes to the HTISC over time
might also affect the import mix (for example, products might be reclassified into other
HTISC codes or new codes might be created).
Summary
Given these limitations, the elasticities estimated in this appendix should be treated with
caution. The results show that demand elasticities can give some indication about whether a
product is critical to a production process, but data limitations make it difficult to apply the
technique across a large number of products and be confident that the technique will
accurately identify critical products. These limitations reinforce the need to stress-test both
the approach and any conclusions with experts as outlined in the framework (chapter 3).

138 VULNERABLE SUPPLY CHAINS
INTERIM REPORT
Table D.1 Regression results
No dummies Year dummies Quarter dummies Year and quarter dummies
Disodium carbonate
Estimate 0.53 -4.40 0.80 -4.05
Standard error 0.81 1.14 0.82 1.25
Adjusted R-squared -0.01 0.48 0.00 0.46
N 40 40 40 40
Citric acid
Estimate -0.47 -2.03 -0.10 -1.28
Standard error 0.44 0.60 0.42 0.61
Adjusted R-squared 0.00 0.32 0.18 0.44
N 40 40 40 40
Chemical 1
Estimate -0.64 1.68 -0.91 1.14
Standard error 0.79 1.33 0.70 1.20
Adjusted R-squared -0.01 0.07 0.23 0.34
N 32 32 32 32
Chemical 2
Estimate 0.56 0.29 0.63 0.49
Standard error 0.44 0.82 0.34 0.61
Adjusted R-squared 0.02 -0.10 0.43 0.43
N 36 36 36 36
Chemical 3
Estimate -0.51 -0.69 -0.15 -0.30
Standard error 0.16 0.18 0.14 0.13
Adjusted R-squared 0.18 0.26 0.65 0.79
N 40 40 40 40
Source: Commission Estimates.
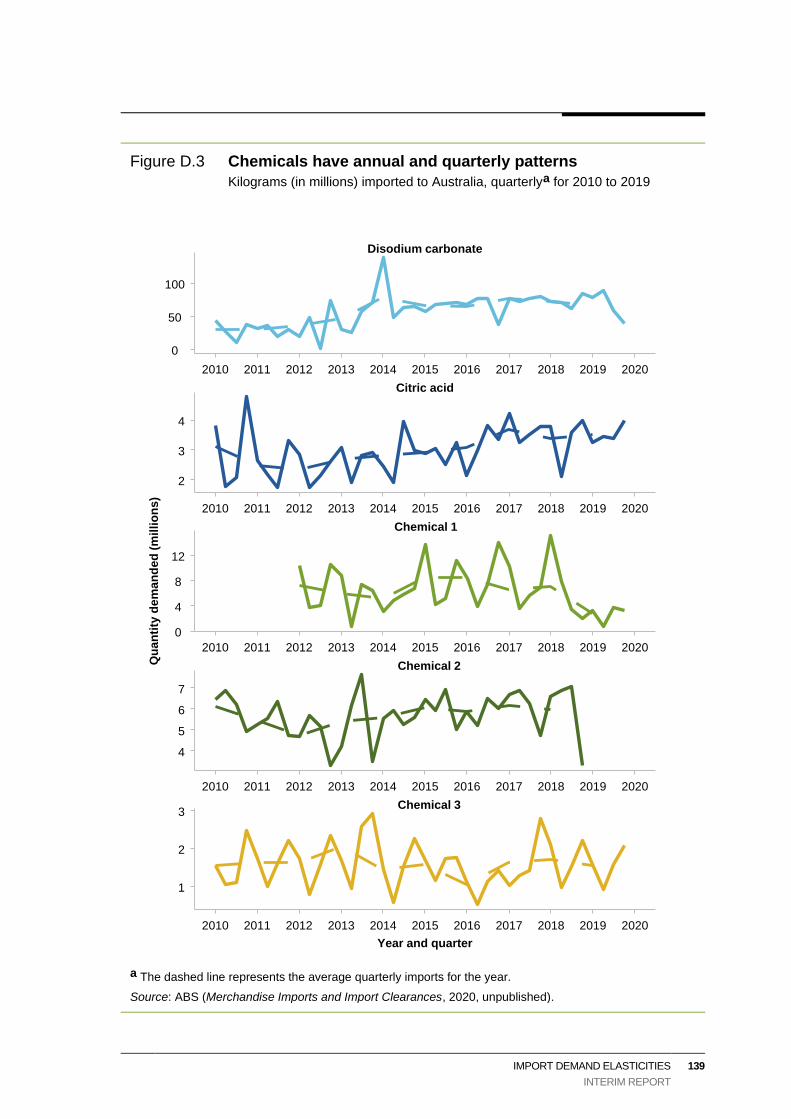
IMPORT DEMAND ELASTICITIES
INTERIM REPORT
139
Figure D.3 Chemicals have annual and quarterly patterns
Kilograms (in millions) imported to Australia, quarterlya for 2010 to 2019
a The dashed line represents the average quarterly imports for the year.
Source: ABS (Merchandise Imports and Import Clearances, 2020, unpublished).
Chemical 3
Chemical 2
Chemical 1
Citric acid
Disodium carbonate
2010 2011 2012 2013 2014 2015 2016 2017 2018 2019 2020
2010 2011 2012 2013 2014 2015 2016 2017 2018 2019 2020
2010 2011 2012 2013 2014 2015 2016 2017 2018 2019 2020
2010 2011 2012 2013 2014 2015 2016 2017 2018 2019 2020
2010 2011 2012 2013 2014 2015 2016 2017 2018 2019 2020
0
50
100
2
3
4
0
4
8
12
4
5
6
7
1
2
3
Year and quarter
Qu
an
tity
de
ma
nd
ed
(m
illi
on
s)

140 VULNERABLE SUPPLY CHAINS
INTERIM REPORT
Figure D.4 Prices of chemicals vary
Jitter plota of pricesb,c and weighted average priced ($AUD) from 2010 to 2019
a Jitter plots slightly perturb each point. b Prices are unit values, derived from values (cost including
insurance and freight) divided by quantity. c Prices presented on a log scale and outliers over $AUD1000
have been removed for readability. d Weighted average price is denoted by the solid line.
Source: ABS (Merchandise Imports and Import Clearances, 2020, unpublished).
Chemical 3
Chemical 2
Chemical 1
Citric acid
Disodium carbonate
2010 2011 2012 2013 2014 2015 2016 2017 2018 2019 2020
2010 2011 2012 2013 2014 2015 2016 2017 2018 2019 2020
2010 2011 2012 2013 2014 2015 2016 2017 2018 2019 2020
2010 2011 2012 2013 2014 2015 2016 2017 2018 2019 2020
2010 2011 2012 2013 2014 2015 2016 2017 2018 2019 2020
0.1
1.0
10.0
100.0
0.1
1.0
10.0
100.0
1
10
100
1
10
100
1
10
100
1000
Year and quarter
Pri
ce (
A$)

REFERENCES
INTERIM REPORT
141
References
ABC (Australian Broadcasting Corporation) 2020, ‘Medicine shortage fears as India limits exports amid
spreading coronavirus outbreak’, ABC News, https://www.abc.net.au/news/2020-03-05/fear-of-medicine-
shortage-spreads-as-india-limits-exports/12026762 (accessed 17 February 2021).
ABS (Australian Bureau of Statistics) 2017, Management and Organisation Capabilities of Australian
Business 2015-16, 81720DO005_201516, ABS, Canberra.
—— 2020, Australian National Accounts: Input-Output Tables, 2017-18 - Table 17, 5209.0.55.001, ABS, Canberra.
ACCC (Australian Competition and Consumer Commission) 2017, Cattle and beef market study - Final report,
March, ACCC, Canberra.
—— 2019, Wine grape market study - Final report, September, ACCC, Canberra.
—— 2020a, Oil companies authorised to cooperate to secure fuel supplies during COVID-19, Media release,
ACCC, Canberra.
—— 2020b, Perishable agricultural goods inquiry, November, ACCC, Canberra.AIDR (Australian Institute for
Disaster Resilience) 2021, Guidance for Strategic Decisions on Climate and Disaster Risk,
https://knowledge.aidr.org.au/resources/strategic-disaster-risk-assessment-guidance/ (accessed 3 February 2021).
Alicke, K. and Strigel, A. 2020, Supply chain risk management is back, McKinsey & Company,
https://www.mckinsey.com/business-functions/operations/our-insights/supply-chain-risk-management-
is-back# (accessed 10 September 2020).
ANAO (Ausralian National Audit Office) 2020, Planning and Governance of COVID-19 Procurements to Increase
the National Medical Stockpile, Auditor-General Report No.22 2020–21, Canberra, https://www.anao.gov.au/
sites/default/files/Auditor-General_Report_2020-21_22.pdf (accessed 17 February 2021).
Barndon, K. 2020, Axiom faces up to virus, https://www.miningmonthly.com/covid-19/news/1385407/axiom-
faces-up-to-virus (accessed 10 January 2020).
BBC News 2011, ‘Toyota profits plunge after earthquake disruption’, BBC News, 2 August.
BOM (Bureau of Meteorology) 2021, About Us, http://www.bom.gov.au/inside/index.shtml?ref=hdr (accessed
28 January 2021).
Borgese, A., Newbold, B., Lloyd, K., Scamps-Goodman, A. and Findlay, M. 2020, COVID-19: Force majeure
and frustration of your contracts, MinterEllison: Business Insights, https://www.minterellison.com/
articles/covid-19-force-majeure-and-frustration-contract (accessed 16 February 2021).
Branigan, T. 2010, Chinese moves to limit mineral supplies sparks struggle over rare earths, The Guardian,
http://www.theguardian.com/business/2010/oct/25/china-cuts-rare-earths-exports (accessed 19 February 2021).
Business News Australia 2020, Fella Hamilton gets green light to make sustainable PPE gear,
https://www.businessnewsaus.com.au/articles/fella-hamilton-gets-green-light-to-make-sustainable-ppe-
gear.html (accessed 5 October 2020).

142 VULNERABLE SUPPLY CHAINS
INTERIM REPORT
Butler, S. and Sorrell, T. 2020, Strengthening Australia’s life sciences sector and medical supply chain beyond
COVID-19, https://www.pwc.com.au/health/health-matters/strengthening-australias-life-sciences-sector-
and-medical-supply-chain-beyond-covid-19.html (accessed 29 January 2021).
Centre for International Economics and Sydney Centre for International Economics 1997, The beef feedlot
industry’s access to imported feed grains, Report prepared for Meat and Livestock Australia.
Chandra, C. and Kamrani, A. 2004, ‘Knowledge Management for Consumer-Focused Product Design’,
Journal of Intelligent Manufacturing, vol. 14, pp. 557–580.
Choi, C.Q. 2012, Why Iceland Volcano’s Eruption Caused So Much Trouble, Live Science.
Chopra, S. and Sodhi, M.S. 2004, ‘Managing Risk to Avoid Supply-Chain Breakdown’, MIT Sloan
Management Review, Fall, pp. 53–61.
Christopher, M. 2018, The Mitigation of Risk in Resilient Supply Chains, International Transport Forum
Discussion Papers, OECD Publishing, Paris.
Clarke, P. 2020, Wuhan fiber dominance spells trouble for 5G, eenews analog, https://www.eenewsanalog.com
/news/wuhan-fiber-dominance-spells-trouble-5g#:~:text=More%20than%2050%20percent
%20of,to%20market%20analysis%20firm%20TrendForce. (accessed 17 February 2021).
Costello, S. 2020, Where is the iPhone made?, https://www.lifewire.com/where-is-the-iphone-made-1999503
(accessed 27 January 2021).
Critical Infrastructure Centre 2021, What is the Critical Infrastructure Centre?, Critical Infrastructure Centre,
Canberra.
Crook, W. and Gordon, J. 2017, Rules of Origin: can the noodle bowl of trade agreements be untangled?,
Productivity Commission Staff Research Note, Canberra.
Crummy, P. 2020, The Impact of COVID-19 on the Australian Contact Centre Outsourcing Industry, CPM
Australia, Melbourne.
CSIRO 2018, Supporting supply chains, https://www.csiro.au/en/Research/Astronomy/Supporting-supply-
chains (accessed 28 January 2021).
—— 2020, Transport logistics-TraNSIT, https://www.csiro.au/en/Research/LWF/Areas/Landscapes/
Transport-logistics-TRANSIT (accessed 28 January 2021).
Davey, M. 2021, ‘Australian drug shortage sparks calls to loosen prescription rules’, The Guardian,
https://www.theguardian.com/science/2021/jan/23/australian-drug-shortage-sparks-calls-to-loosen-
prescription-rules (accessed 18 February 2021).
Denton, J. 2020, ‘ICC Secretary General delivers the 2020 Brookes Oration’.
—— and Bruckard, D. 2020, Resilient supply chains can inoculate against vaccine nationalism, East Asia
Forum, https://www.eastasiaforum.org/2020/10/11/resilient-supply-chains-can-inoculate-against-
vaccine-nationalism/ (accessed 9 February 2021).
Department of the Environment and Energy 2019, Liquid Fuels Security Review-Interim report,
https://www.energy.gov.au/sites/default/files/liquid-fuel-security-review-interim-report.pdf (accessed 15
February 2021).

REFERENCES
INTERIM REPORT
143
Department of the Treasury 2020, Modernising Business Communications: Improving the Technology
Neutrality of Treasury Portfolio Laws, Canberra, https://treasury.gov.au/sites/default/files/2020-12/c2020-
129713-cp.pdf (accessed 23 February 2021).
DFAT (Department of Foreign Affairs and Trade) 2020, Australia’s top 25 exports, goods and services,
Department of Foreign Affairs and Trade, Canberra.
DHHS (Vic) (Department of Health & Human Services (Vic)) 2017, Fire retardants and health, health.vic,
https://www2.health.vic.gov.au/public-health/environmental-health/environmental-health-in-the-
community/fire-retardants-and-health (accessed 19 February 2021).
DIRDC (Department of Infrastructure, Regional Development and Cities) 2018, Inquiry into National Freight and
Supply Chain Priorities, March, Department of Infrastructure, Regional Development and Cities, Canberra.
DISER (Department of Industry, Science, Energy and Resources) 2020a, Australia’s fuel security package,
Canberra.
—— 2020b, Department of Industry, Science, Energy and Resources Annual Report 2019–20, Canberra.
—— 2020c, Hand Sanitiser in Australia: Market Insights, Canberra.
—— 2020d, Our Modern Manufacturing Strategy, Department of Industry, Science, Energy and Resources.
Doggett, J. 2020, The National Medical Stockpile – a timely explainer, https://www.croakey.org/the-national-
medical-stockpile-an-explainer/ (accessed 28 January 2021).
DoH (Department of Health) 2020, Budget 2020-21: Supporting our hospitals - COVID-19 National Medical
Stockpile, Canberra, https://www.health.gov.au/sites/default/files/documents/2020/10/budget-2020-21-
supporting-our-hospitals-covid-19-national-medical-stockpile.pdf (accessed 17 February 2021).
DoHA (Department of Home Affairs) 2015, Critical Infrastructure Resilience Strategy: Plan, Australian
Government, Canberra.
—— 2018, Profiling Australian’s Vulnerability: The Interconnected Causes and Cascading Effects of Systemic
Disaster Risk, Australian Government, Canberra.
—— 2020a, COVID-19 and the border: Critical skills and sectors, https://covid19.homeaffairs.gov.au/critical-
skills-and-sectors (accessed 10 September 2020).
—— 2020b, Critical Technology Supply Chain Principles: A call for views, Australian Government, Canberra.
—— 2020c, Security coordination: Critical infrastructure resilience, https://www.homeaffairs.gov.au/about-
us/our-portfolios/national-security/security-coordination/critical-infrastructure-resilience (accessed 16
February 2021).
DPS (Department of Parliamentary Services) 2020, COVID-19 Australian Government roles and
responsibilities: an overview, Research Paper Series 2019-20, Canberra.
Dushyantha, N., Batapola, N., Ilankoon, I.M.S.K., Rohtitha, S., Premasiri, R., Abeysinghe, B., Ratnayake, N.
and Dissanayake, K. 2020, ‘The story of rare earth elements (REEs): Occurrences, global distribution,
genesis, geology, mineralogy and global production’, Ore Geology Reviews, vol. 122, art 103521.
Economist Intelligence Unit 2020, The Great Unwinding: Covid-19 and the regionalisation of global supply chains,
Economist Intelligence Unit.

144 VULNERABLE SUPPLY CHAINS
INTERIM REPORT
Editorial Board, East Asia Forum 2020, Making supply chains great again, East Asia Forum,
https://www.eastasiaforum.org/2020/10/12/making-supply-chains-great-again/ (accessed 9 February 2021).
Emerson, C. 2020a, ‘Protectionism won’t make Australia great again’, Australian Financial Review, 4 May.
—— 2020b, ‘Road out leads back to productivity’, Australian Financial Review, 21 April.
Engineers Australia 2019, Industry Responses in a Collapse of Global Governance: Workshop report for
attendees, February, Engineers Australia, Melbourne.
Fernandes, A.M. and Pakes, A. 2009, ‘Evidence of Underemployment of Labour and Capital in India
Manufacturing’, Accelerating Growth and Job Creation in South Asia, Oxford University Press, India,
pp. 141–175.
Fu, Q., Lee, C.-Y. and Teo, C.-P. 2010, ‘Procurement Management using Option Contracts: Random Spot
Price and The Portfolio Effect’, IIE Transactions, vol. 42, no. 11, pp. 793–811.
GATT 1994, General Agreement on Tariffs and Trade 1994: Article XXI Security Exceptions.
Gaudenzi, B. and Siciliano, G. 2018, ‘Managing IT and Cyber Risks in Supply Chains’, in Khojasteh, Y. (ed), Supply
Chain Risk Management: Advanced Tools, Models, and Developments, Springer, Singapore, pp. 85–96.
Goenka, A. 2021, ‘What is behind the EU’s dispute with AstraZeneca over COVID-19 vaccines?’, Melbourne,
The Conversation, 29 January.
Greber, J. 2020, ‘Liveris calls the start of the on-shoring era’, Australian Financial Review, 9 April.
Haxel, G., Hendrick, J. and Orris, G. 2002, Rare Earth Elements—Critical Resources for High Technology,
https://pubs.usgs.gov/fs/2002/fs087-02/ (accessed 19 February 2021).
Ho, W., Zheng, T., Yildiz, H. and Talluri, S. 2015, ‘Supply Chain Risk Management: A Literature Review’,
International Journal of Operations and Production Management, vol. 16, no. 53, pp. 5031–5069.
Hopp, W.J., Iravani, S.M.R. and Liu, Z. 2012, ‘Mitigating the Impact of Disruptions in Supply Chains’, Supply
Chain Disruptions: Theory and Practice of Managing Risk, Springer, London.
Horner, R. 2020, The world needs pharmaceuticals from China and India to beat coronavirus,
https://theconversation.com/the-world-needs-pharmaceuticals-from-china-and-india-to-beat-coronavirus-
138388 (accessed 3 February 2021).
Impullitti, G. and Licandro, O. 2018a, Quantifying the gains from trade, VOX EU CEPR.
—— and —— 2018b, ‘Trade, firm selection and innovation: the competition channel’, The Economic Journal,
vol. 128, no. 608, pp. 189–229.
Johnson, M. 2020, ‘Shortage of COVID-19 sample collection tools will be short-lived, suppliers say’, Modern
Healthcare, 22 March, https://www.modernhealthcare.com/supply-chain/shortage-covid-19-sample-
collection-tools-will-be-short-lived-suppliers-say (accessed 17 February 2021).
Keating, E. 2020, These Aussie gin distilleries are producing hand sanitiser to help meet national demand, and
keep their staff in work, https://www.smartcompany.com.au/coronavirus/australian-gin-distilleries-hand-
sanitiser-covid19/ (accessed 10 January 2020).
Kito, T., Brintrup, A., New, S. and Reed-Tsochas, F. 2014, The Structure of the Toyota Supply Network: An
Empirical Analysis, Research Papers, March, 2014–03, Saïd Business School.

REFERENCES
INTERIM REPORT
145
Knaus, C. 2020, ‘Manufacturing face shields within days: how Australian industry is pivoting to fight
coronavirus’, The Guardian, 5 April.
—— and Smee, B. 2020, ‘Fears millions of Covid-19 testing kits Australia bought from Andrew Forrest could
go to waste’, The Guardian, 1 July, https://www.theguardian.com/australia-news/2020/jul/01/fears-
millions-of-covid-19-testing-kits-australia-bought-from-andrew-forrest-could-go-to-wasted (accessed 17
February 2021).
Krugman, P. 1995, ‘Growing World Trade: Causes and Consequences’, Brookings Papers on Economic
Activity, pp. 329–377.
—— 2019, ‘What Economists (Including Me) Got Wrong About Globalization’, Bloomberg, 10 October.
Laidlaw, H. 2020, Liquid fuel security: a quick guide–May 2020 update, Research Paper Series, 8 May, 2019–
20, Department of Parliamentary Services, Canberra.
Latour, A. 2001, ‘A Fire in Albuquerque Sparks Crisis For European Cell-Phone Giants’, The Wall Street Journal,
29 January, https://www.wsj.com/articles/SB980720939804883010#:~:text=As%20Ericsson%20of%
20Sweden%20Gets%20Burned&text=Caused%20by%20a%20lightning%20bolt,just%2010%20minutes%20l
ast%20March.&text=The%20flow%20of%20those%20chips,around%20the%20world%2C%20suddenly%20
stopped. (accessed 17 February 2021).
Leigh, A. 2017, Choosing Openness: A Lowy Institute Paper: Penguin Special Why global engagement is best
for Australia, Paperback, Penguin.
Lim-Camacho, L., Crimp, S., Ridoutt, B. and Ariyawardana, A. 2016, Adaptive value chain approaches,
https://research.csiro.au/climatesmartagriculture/wp-content/uploads/sites/248/2019/07/CSIRO_AVC_FInal-
Report_v1.4_single.pdf (accessed 15 February 2021).
Logistics Bureau 2020, Can Australian Manufacturing be Brought Back Home from China?,
www.logisticsbureau.com/can-australian-manufacturing-be-brought-back-home-from-china/ (accessed
29 January 2021).
Lowy Institute 2021, Covid Performance Index, https://interactives.lowyinstitute.org/features/covid-
performance/#rankings (accessed 1 February 2021).
Lund, S., Woetzel, J., Barriball, E., Krishnan, M., Alicke, K., Birshan, M., George, K., Smit, S., Swan, D.,
Smit, S. and Swan, D. 2020, Risk, resilience, and rebalancing in global value chains, August, McKinsey
Global Institute.
Lynch, D. 2021, ‘Pandemic aftershocks overwhelm global supply lines’, The Wahington Post, 25 January.
Mankiw, N.G. and Whinston, M. 1986, ‘Free entry and social inefficiency’, Rand Journal of Economics,
vol. 17`, no. 1, pp. 48–58.
Marsh 2019, Political Risk Map 2019, https://www.marsh.com/au/campaigns/political-risk-map-2019.html
(accessed 1 February 2021).
Marshall, S. 2020, SA company to make life-saving face masks in the fight against COVID-19, Media release,
31 March.
Masige, S. 2020, ‘Our team has been able to quickly pivot’: Ford Australia has been manufacturing face
shields for the fight against the coronavirus, https://www.businessinsider.com.au/our-team-has-been-able-

146 VULNERABLE SUPPLY CHAINS
INTERIM REPORT
to-quickly-pivot-ford-australia-has-been-making-face-shields-for-the-fight-against-the-coronavirus-
2020-5 (accessed 10 January 2020).
Maslow, A. 1943, ‘A theory of human motivation’, Psychological Review, vol. 50, no. 4, pp. 370–396.
Mawere, M., Mubaya, T., Reisen, M. and van Stam, G. 2016, ‘Maslow’s Theory of Human Motivation and its
Deep Roots in Individualism: Interrogating Maslow’s Applicability in Africa’, Theory, Knowledge,
Development and Politics: What Role for the Academy in the Sustainability of Africa?, Langaa RPCIG.
McCloskey, D.N. 2020, Interview on the Economy and Covid-19 in Brazil, Interviewed by Francisco de
Azeredo for the Brazilian cultural project, Porto Alegre, Brazil.
McKinsey & Company 2017, How CEOs can tackle the challenge of cybersecurity in the age of the Internet
of Things, June, McKinsey & Company.
—— 2019, Globalization in transition: the future of trade and value chains, January, McKinsey Global Institute.
Melbourne Water 2020, Drinking water treatment, https://www.melbournewater.com.au/water-data-and-
education/water-facts-and-history/why-melbournes-water-tastes-great/water-treatment (accessed 16
November 2020).
Milgrom, P. and Roberts, J. 1992, Economics, Organization and Management, 1st edn, Englewood Cliffs.
Moderna, Inc 2020, United States Securities and Exchnage Commission Form 10Q, Delaware.
Morrison, S. 2020, Transcript, 25 January 2021, Press Conference, Canberra.
MTPConnect 2020a, Collaborating in the Public Interest: How Australia’s Medical Technology Sector joined
with Government to fight COVID-19: Supplementary Report to the MTPConnect COVID-19 Impact
Report, Melbourne, https://www.mtpconnect.org.au/images/MTPConnect_How%20Australia%27s%
20Medical%20Technology%20Sector%20joined%20with%20the%20Government%20to%20fight%20C
OVID-19%20FINAL.pdf (accessed 17 February 2021).
—— 2020b, MTPConnect COVID-19 Impact Report: The Impact of COVID-19 on the Australian Medical
Technology, Biotechnology & Pharmaceutical Sector, https://www.mtpconnect.org.au/images/
MTPConnect_COVID-19%20Impact%20Report%20FINAL.pdf (accessed 17 February 2021).
Mullin, R. 2020, COVID-19 is reshaping the pharmaceutical supply chain, https://cen.acs.org/business/
outsourcing/COVID-19-reshaping-pharmaceutical-supply/98/i16 (accessed 3 February 2021).
NHMRC (National Health and Medical Research Council) 2011, Australian Drinking Water Guidelines,
National Water Management Strategy, 6.
Nishiguchi, T. and Beaudet, A. 1997, Self-Organization and Clustered Control in the Toyota Group: Lessons
from the Aisin Fire, Massachusetts Institute of Technology International Motor Vehicle Program, Tokyo.
Observatory of Economic Complexity 2018, Observatory of Economic Complexity, https://oec.world/
(accessed 16 February 2021).
O’Connor, J. and Kirton, D. 2021, Vaccine supply row highlights the need to inject certainty into ‘best efforts’
obligations, William Fry: News Article, https://www.williamfry.com/newsandinsights/news-
article/2021/02/05/vaccine-supply-row-highlights-the-need-to-inject-certainty-into-best-efforts-
obligations (accessed 16 February 2021).

REFERENCES
INTERIM REPORT
147
OECD (Organisation for Economic Co-Operation and Development) 2008, Public-Private Partnerships: In
pursuit of risk sharing and value for money.
—— 2020, The face mask global value chain in the COVID-19 outbreak: Evidence and policy lessons.
O’Neil, S. 2016, Managing the Unpredictable Risks in Supply Chains, 15 September,
https://www.cfr.org/blog/managing-unpredictable-risks-supply-chains (accessed 26 January 2021).
Orica 2020, ‘Ammonium Nitrate Q and A’, Community News: Kooragang Island, no. 3.
Pack, H. 2009, ‘Should South Asia Emulate East Asian Tigers?’, Accelerating Growth and Job Creation in
South Asia, Oxford University Press, New Delhi, pp. 59–81.
PC (Productivity Commission) 2009, Government Drought Support, Report no. 46, Canberra.
—— 2010, Australia’s Anti-dumping and Countervailing System, Report no. 48, Canberra.
—— 2014a, Australia’s Automotive Manufacturing Industry, Report no. 70, Canberra.
—— 2014b, Natural Disaster Funding Arrangements - Vol. 1, Report no. 74, Canberra.
—— 2014c, Natural Disaster Funding Arrangements - Vol. 2, Report no. 74, Canberra.
—— 2016, Developments in Anti-Dumping Arrangements, Commission Research Paper, Canberra.
—— 2018, Trade and Assistance Review 2016-17, Annual Report Series, Canberra.
—— 2019, Trade and Assistance Review 2017-18, Annual Report Series.
—— 2020, Trade and Assistance Review 2018-19, Annual Report Series.
Phillips, K. 2014, ‘How container shipping changed the world through globalisation’, Web, ABC News, 20 August.
PSA (Pharmaceutical Society of Australia) 2020, Submission to the Senate Select Committee on Covid-19 Inquiry into
the Australian Government’s Response to the Covid-19 Pandemic, https://www.aph.gov.au/
DocumentStore.ashx?id=886e14d7-dbb4-4915-b9be-38aeff2e980a&subId=683096 (accessed 22 February 2021).
Puddy, R. and Burnie, R. 2018, ‘China’s thirst for baby formula creating problems for Australian shoppers and
staff’, ABC News, 11 December.
Raz, G. and Stonecash, R. 2004, ‘Managing supplier contracts: A case study of Cochlear’, presented at the
Proceedings of the 2nd Australia New Zealand Academy of Management (ANZAM) Operations
Management Symposium, Melbourne.
Reynolds, L. and Andrews, K. 2020, Increasing domestic manufacturing during COVID-19, Media Release,
17 March, Canberra.
Ritchie, B. and Brindley, C. 2007, ‘Supply Chain Risk Management and Performance: A Guiding Framework
for Future Development’, International Journal of Operations and Production Management, vol. 27, no. 3,
pp. 303–322.
Roberts, B.H. 2018, ‘The Role of Industry Clusters in Driving Innovation and Competitiveness of Regions’.
Rogers, A. 2020, ‘Singapore Was Ready for Covid-19—Other Countries, Take Note’, Wired.
Ross, A. 2021, ‘Health professionals warn Australia is struggling to deal with post-COVID-19 medication
shortage’, ABC News.

148 VULNERABLE SUPPLY CHAINS
INTERIM REPORT
Royal Commission into National Natural Disaster Arrangements 2020a, Royal Commission into National
Natural Disaster Arrangements: Report, 28 October, Commonwealth of Australia, Canberra.
—— 2020b, Transcript of proceedings, Commonwealth of Australia, Canberra.
Ryall, J. 2018, ‘Discovery of rare earth minerals off Japan coast secures 780 years of industrial demand: study’, Hong
Kong, South China Morning Post, 12 April, https://www.scmp.com/news/asia/east-asia/article/2141445/
discovery-rare-earth-minerals-japan-coast-secures-780-years (accessed 17 February 2021).
—— 2020, ‘Japan moves to secure rare earths to reduce dependence on China’, Hong Kong, South China
Morning Post, 17 August.
Sanchanta, M. 2011, ‘Chemical Reaction: iPod Is Short Key Material’, The Wall Street Journal, 29 March.
Saunders, I. 2020, Recalibrating international trade in the COVID-19 age, Australian National University, Canberra.
Science and Industry Endowment Fund 2020, Boat to Plate, https://sief.org.au/nicta-gift/future-national-ict-industry-
platform-program/digital-mission-supply-chain-integrity/boat-to-plate/ (accessed 15 February 2021).
SCM World 2016, Future of Supply Chain 2016, November, SCM World, London.
—— 2017, Future of Supply Chain 2017, October, SCM World, London.
Sheffi, Y. 2020, Who Gets What When Supply Chains Are Disrupted?, MITSloan Management Review.
Shen, Y., Moomy, R. and Eggert, R.G. 2020, ‘China’s public policies toward rare earths, 1975–2018’, Mineral
Economics, vol. 33, pp. 127–151.
Slowinski, G., Latimer, D. and Mehlman, S. 2013, ‘Research-on-Research: Dealing with Shortages of Critical
Materials’, Research Technology Management, vol. 56.
Stackpole, B. 2020, 5 supply chain technologies that deliver competitive advantage, https://mitsloan.mit.edu/
ideas-made-to-matter/5-supply-chain-technologies-deliver-competitive-advantage#:~:text=By%
20harnessing%20a%20combination%20of,increase%20satisfaction%20and%20boost%20sales.
(accessed 29 January 2021).
Stanford, J. 2020, A Fair Share for Australian Manufacturing: Manufacturing Renewal for the Post-COVID
Economy, July, The Centre for Future Work at the Australia Institute, Canberra.
statista 2020, Taiwan’s share in the global semiconductor market in 2013 and 2017, by operation,
https://www.statista.com/statistics/1037531/taiwan-global-semiconductor-market-share-by-operation/
(accessed 22 February 2021).
Stecke, K.E. and Kumar, S. 2009, ‘Sources of Supply Chain Disruptions, Factors That Breed Vulnerability,
and Mitigating Strategies’, Journal of Marketing Channels, vol. 16, no. 3, pp. 193–226.
Sullivan, K. 2018, ‘Grain imports on the cards as drought drives up prices and crop forecasts slashed’, ABC
News, 1 November.
—— 2019, ‘Australia approves foreign grain imports for the first time in over a decade’, ABC News.
Tan, Y.X.T., Moles, R.J. and Chaar, B.B. 2016, ‘Medicine shortages in Australia: causes, impact and
management strategies in the community setting’, International Journal of Clinical Pharmacy, vol. 38,
pp. 1133–1141.
Tang, C. 2006, ‘Robust strategies for mitigating supply chain disruptions’, International Journal of Logistics:
Research and Applications, vol. 9, no. 1, pp. 33–45.

REFERENCES
INTERIM REPORT
149
TGA (Therapeutic Goods Administration) 2020a, Regulator Performance Framework Self-assessment report
July 2019 to June 2020, Canberra.
—— 2020b, TGA response to coronavirus (COVID-19), Media release, August.
The Economist 2020, ‘What’s the worst that could happen? The world should think better about catastrophic
and existential risks’, The Economist, 25 June.
Timmer, M.P., Erumban, A.A., Los, B., Stehrer, R. and Vries, G.J. de 2014, ‘Slicing Up Global Value Chains’,
Journal of Economic Perspectives, vol. 28, no. 2, pp. 99–118.
Tomlin, B. 2006, ‘On the value of mitigation and contingency strategies for managing supply chain disruption
risks’, Management Science, vol. 52, no. 5, pp. 639–657.
Tomy, R.E. 2020, ‘Short-Term Cash Flow Shocks and R&D Investment: Evidence from the 1999 Taiwan
Earthquake’, SSRN.
Turak, N. 2019, Iraq, one of OPEC’s biggest over-producers, is urging deeper production cuts, 4 December
2019, CNBC, https://www.cnbc.com/2019/12/04/iraq-one-of-opecs-biggest-over-producers-is-urging-
deeper-production-cuts.html (accessed 15 February 2021).
UK MHRA (UK Medicines and Healthcare products Regulatory Agency) 2017, Medicines and Healthcare
products Regulatory Agency International Strategy, UK Government.
UN ESCAP (UN Economic and Social Commission for Asia and the Pacific) 2020, COVID-19 and its Impact
on Shipping and Port Sector in Asia and the Pacific, Technical Note, 30 September, UN.
Unilever 2020, Unilever’s supply chain, May, Unilever.
US Department of Justice and Federal Trade Commission 2010, Horizontal Merger Guidelines,
https://www.justice.gov/atr/horizontal-merger-guidelines-08192010 (accessed 19 January 2021).
US FDA (US Food and Drug Administration) 2019, Drug Shortages: Root Causes and Potential Solutions,
United States, https://www.fda.gov/media/131130/download (accessed 18 February 2021).
WBCSD (World Business Council for Sustainable Development) 2015, Building Resilience in Global Supply
Chains, World Business Concil for Sustainable Development.
Webb, J. 2016, ‘Toyota’s “Quake-Proof” Supply Chain That Never Was’, Reuters, https://www.forbes.com/
sites/jwebb/2016/04/26/toyotas-quake-proof-supply-chain-that-never-was/?sh=181310472101 (accessed
22 January 2021).
WEF (World Economic Forum) 2020, The Global Risks Report 2020, Insight Report, 15 January, 15th Edition,
World Economic Forum, Switzerland.
WTO (World Trade Organisation) 2020, Export Prohibitions and Restrictions: Information Note.
Yang, B., Aydin, G., Babich, V. and Beil, D.R. 2009, ‘Supply Disruptions, Asymmetric Information and a
Backup Production Option’, Management Science, vol. 55, no. 2, pp. 192–209.
Yang, Z. 2009, Supply Risks and Asymmetric Information, PhD Dissertation, Univeristy of Michigan.
Yates, C. 2020, ‘“Response rates have been too slow”: Westpac brings call centre jobs back to Australia’,
Sydney Morning Herald, 29 July.