Embed Size (px)
Citation preview

Vulnerable Plaque:Vulnerable Plaque: Anatomic Features Linked to
Future Events
Renu Virmani, MD,CVPath Institute,
Gaithersburg, MD, USAGaithersburg, MD, USA

Natural History of Atherosclerosis• Systemic factors –
dyslipidemia, diabetes mellitus, smoking, hypertension, age and gender, hsCRP, Lp‐PLA2, etc.
• Local factors –branch points, e.g. carotid bifurcation, abdominal aorta just
above bifurcation, coronary branch point, and arch vessels at take off are the sites of atherosclerosis manifestationtake off, are the sites of atherosclerosis manifestation.
• Thrombosis –occurs in the coronary arteries at focal points and is mostoccurs in the coronary arteries at focal points and is most
often seen in the proximal segments of the three main coronary arteries (systemic coagulation factors play a role), y ( y g p y ),and occur at sites where there are underlying plaque characteristic that result in thrombosis.

Branch points are the sites of atherosclerosis and occur in areas of low shearoccur in areas of low shear
Left Coronary arteryCarotid Artery
A CLow shear
High shearBlood flow

Non-Progressive and Progressive Coronary PlaquesCoronary Plaques
non-progressive progressive
adaptive intimalhi k i
Intimalh
pathologicintimalthi k i f
thin-capfibroatheroma
NC
thickening xanthoma thickening fibroatheroma fibroatheroma
NC FC
lipid pool necrotic corep p
early late necrosis

Lesions with ThrombiLesions with Thrombi
• Plaque Rupture• Plaque Rupture• Plaque ErosionPlaque Erosion• Calcified NoduleCalcified Nodule

Causes of Coronary ThrombosisCauses of Coronary ThrombosisCalcified noduleCalcified noduleRuptureRupture ErosionErosion
RuptureSite
NCTh
ThThNC
Site
ThTh NCTh
Th Th
Th
Th
Virmani R, et al. Arterioscler Thromb Vasc Biol 2000;20:1262

Gross and Light Microscopicf
ANC
Features of Plaque RuptureTh
60% of Thrombi in Sudden Coronary Death occur
NC D FB
form Plaque Rupture
ThTh
NC D F
T cells SMCs
ThTh
T cells SMCs
C E G
NC
ThMΦ HLA‐DR
Fig 3-1
Th

LDA
Thrombus Propagation in Plaque Rupture
1mmLD
LAD
Proximal fibrin-richpropagated thrombusPlatelet-rich
thrombusB thrombusB
Proximal
D
ProximalPropagated Thrombus
C
Platelet
Carstairs’
Platelet
FibrinPlatelets
Fig. 3‐15

Plaque erosion in a 33 year old female complaining of
Plaque Erosion: 30-35% of thrombi in SCD
Plaque erosion in a 33 year‐old female complaining of chest pain for two‐weeks and discharged from the emergencyroom with a diagnoses of anxiety.
A CB
NC
ED F
MΦSMCs
T‐cells PLT FibrinT cells PLT Fibrin

Calcified NoduleBA
Calcified NoduleBA
*
**
**NoduleNodule*
*
**
*
Fibrin
CalcifiedCalcifiedplate
Frequency 2-7% of SCD Older individuals usually Men Frequency 2-7% of SCD, Older individuals, usually Men, equally common in tortuous right and left coronary arteries

Clinical and Morphologic Difference in Plaques Associated Clinical and Morphologic Difference in Plaques Associated with Luminal Thrombiwith Luminal Thrombi
Plaque rupture Plaque erosion
Th
LumenLumen
ThTh
Necrotic coreTh
60% thrombi in SCDM>F, Older, Ca++Eccentric = concentricG % i
30-35% thrombi in SCDM=F, youngerUsually eccentricL % i
2-7% thrombi in SCD, calcified plates, M>F, older,
id RCA &LADGreater % stenosisMacs, T cells, HLA-DR
Lesser % stenosisSMC rich, proteoglycans
mid RCA &LADUsually eccentricStenosis variableNod les of calci mNodules of calcium

Plaque rupture with mild stenosis and nonPlaque rupture with mild stenosis and non‐‐
Proximal
Plaque rupture with mild stenosis and nonPlaque rupture with mild stenosis and non‐‐occlusive thrombus: a mechanism by which occlusive thrombus: a mechanism by which plaques progress from an asymptomatic to plaques progress from an asymptomatic to Th
symptomatic phasesymptomatic phase9mm
Rupture site
Th
Th
3mm6mm
Th
NC

Healed Healed lesions lead to plaque lesions lead to plaque progressionprogressionHealed plaque rupture
NC NC
Multiple healed rupturep p

Healed Rupture Causes “Luminal Narrowing”and “Negative Remodeling”
C
mm
2
Healed ruptureAcute rupture
IEL,
Burke, A P et al. Circulation.2001;103:9364-940

Remodeling in Varying CoronaryLesion MorphologiesLesion Morphologies
A.
5
4
NCMedial SMC loss
pected
IEL
ue area)
4
3
2
1
IEL‐Exp
(/plaq 0
‐1
‐2
osion
Stab
le
oma
hage
pture
pture
sion
‐3
Ero S
n cap athe
ro
que he
morrh
Acute rup
Healed rup
Total occlus
Medial SMCapoptosis
Thi
Pla q
Thi Fib th A Pl R
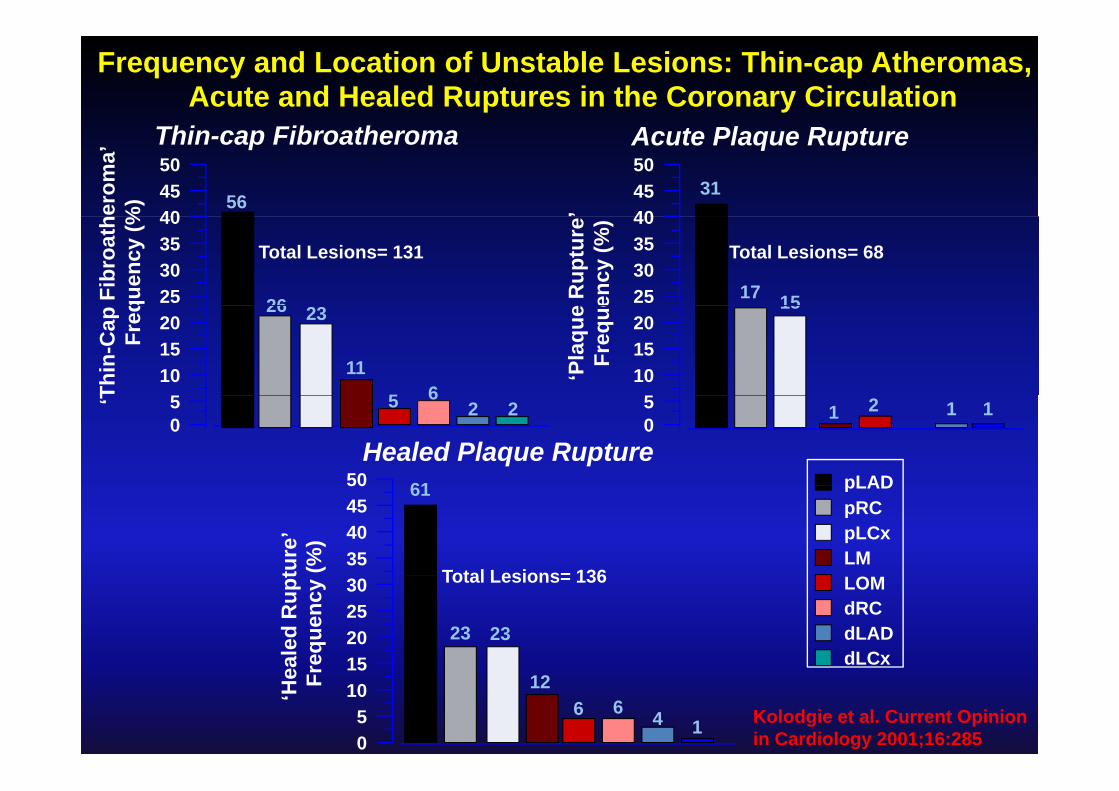
Frequency and Location of Unstable Lesions: Thin-cap Atheromas, Acute and Healed Ruptures in the Coronary Circulation
504540
Thin-cap Fibroatheromaer
oma’
%)
Acute Plaque Rupture
’
504540
3156
40353025Fi
broa
thqu
ency
(%
Rup
ture
’en
cy (%
) 40353025 17 1526
Total Lesions= 68Total Lesions= 131
2015105Th
in-C
ap
Freq
‘Pla
que
Freq
ue 2015105
1526 23
11
5 650
‘T
Healed Plaque Rupture
50
50 pLAD
1 2 1 15 62 2
61
ture
’(%
)
50454035
pLADpRCpLCxLM
Total Lesions= 136
61
aled
Rup
teq
uenc
y 30252015
LOMdRCdLADdLCx
Total Lesions= 136
23 23
‘Hea Fr
151050
126 6 4 1 Kolodgie et al. Current Opinion
in Cardiology 2001;16:285

Relationship of Fibrous Cap Thickness to Macrophage Infiltration
P = 0 03
MMP‐1MMP‐2MMP‐3
CollagenLamininFibronectinSIKVAV
5
6
Kp-
1
P 0.03P = 0.06 MMP‐7
MMP‐8MMP‐9
LPSIL‐1βTNFα
SIKVAVEMMPRIN
3
4
ean
for %
MMP‐10MMP‐12MMP‐14TIMP 1
1
2
Cel
l Me TIMP‐1
TIMP‐2TIMP‐3PS
0
5 μm
0 μm
0 μm 0 μm
MMP‐2MMP‐14TIMP‐2
s than
65
66 ‐20
0
201 ‐3
00
than
300
MMP‐2TIMP‐2
Less 2
More SMC death
Unstable plaqueModified from Newby AC. ATVB 2008
PS = P‐Selectin

Development of Necrotic Core

The Necrotic Core“graveyard of dead M s”graveyard of dead M s
Thr
NC
Ruptured plaque atRuptured plaque at area of thinned fibrous cap
inflammation
Necrotic Core
stress on fibrous coppCoagulation thrombosis
proteases
T
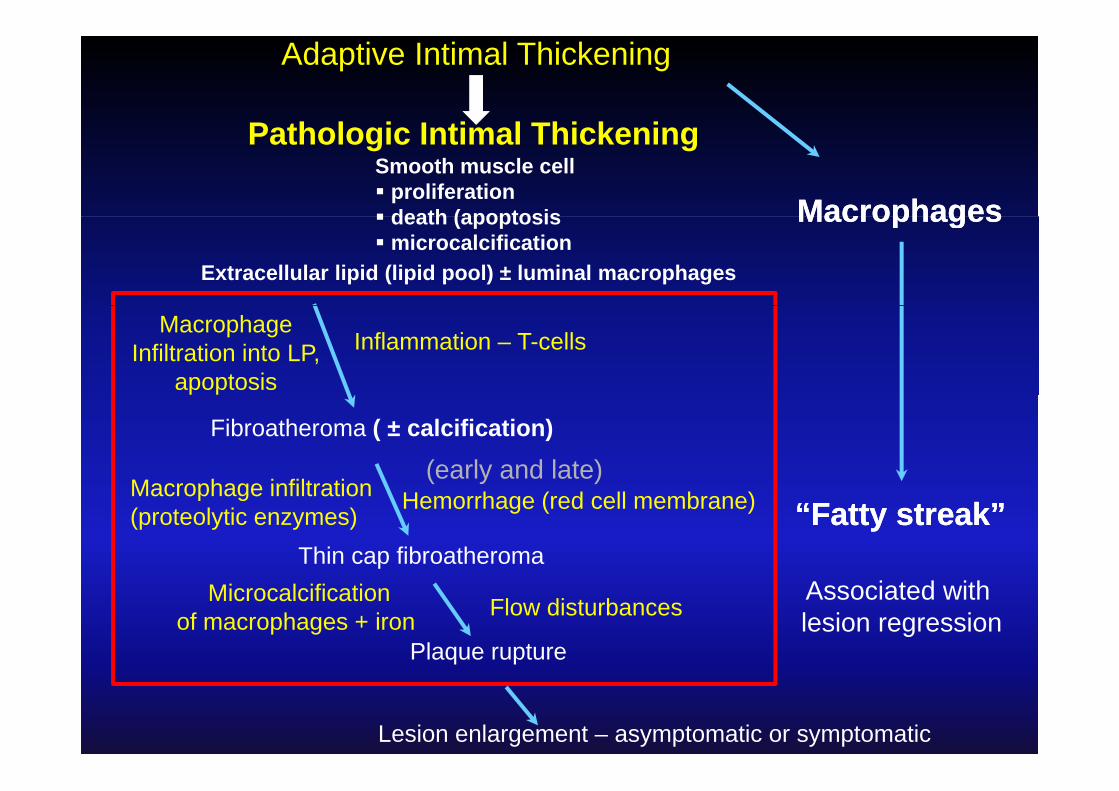
Adaptive Intimal Thickening
P th l i I ti l Thi k iSmooth muscle cell
proliferationdeath (apoptosis MacrophagesMacrophages
Pathologic Intimal Thickening
death (apoptosismicrocalcification
Extracellular lipid (lipid pool) ± luminal macrophages
MacrophagesMacrophages
Inflammation – T-cells Macrophage
Infiltration into LP,apoptosis
Fibroatheroma ( ± calcification)
(early and late)Macrophage infiltration
“Fatty streak”“Fatty streak”Thin cap fibroatheroma
Macrophage infiltration(proteolytic enzymes)
Hemorrhage (red cell membrane)
Plaque rupture
Associated with lesion regression
Microcalcificationof macrophages + iron Flow disturbances
Lesion enlargement – asymptomatic or symptomatic
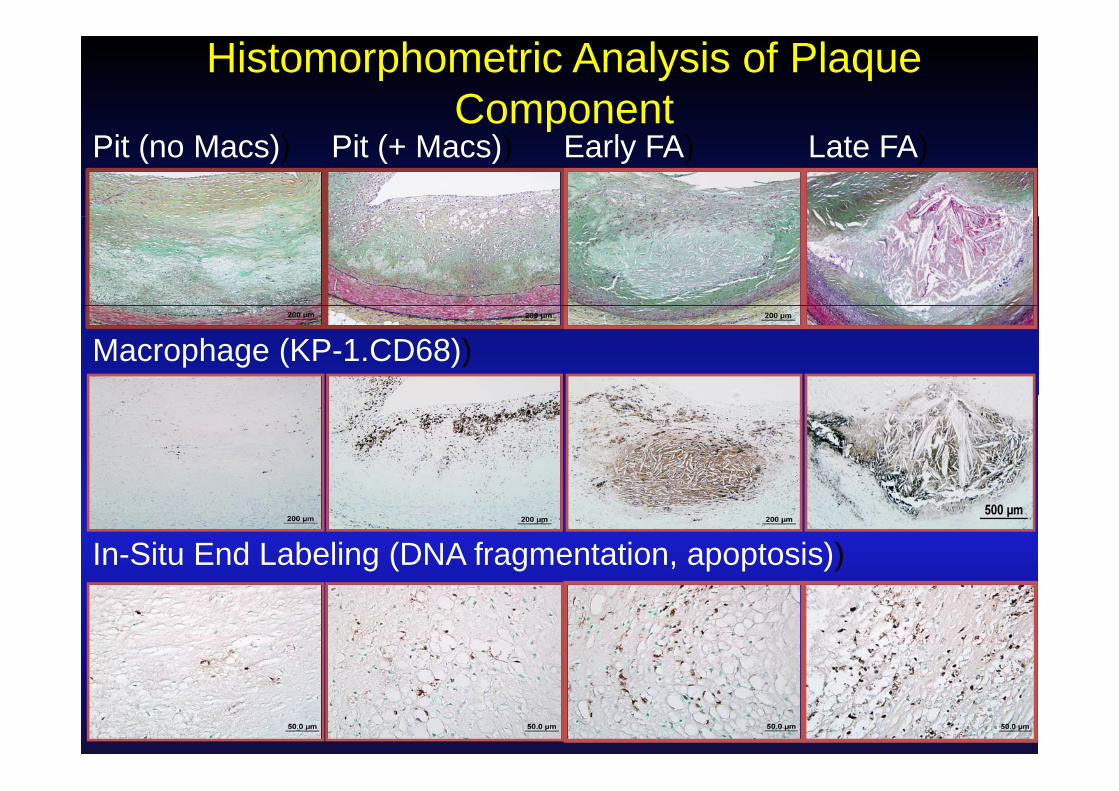
Histomorphometric Analysis of Plaque Componentp
Pit (no Macs)) Pit (+ Macs)) Early FA) Late FA)
Macrophage (KP-1.CD68))
In-Situ End Labeling (DNA fragmentation, apoptosis))

Phagocytosis efficiency of apoptotic cells (AC) in advanced atherosclerotic plaque and human tonsils
Carotid plaque Tonsil
TUNNEL (AC, red)
CD 68CD 68 (macrophages, blue)
TonsilAtherosclerotic plaque
100 The radio of free ACversus phagocytized AC was 19 timeshi h i th
100
80
60
100
80
60
tic cells
phages*
***
higher in athero‐sclerotic plaques as compared to human tonsil
40
20
40
20
0
% apo
ptot
% m
acrop
******
***
*
human tonsil
Free uptake 1AC 2AC >2AC
0 0
Schrijvers DM et al. ATVB,2007

Thin‐cap FibroatheromaRecent Intraplaque Hemorrhage is seen atRecent Intraplaque Hemorrhage is seen at
Multiple sites in Patients Dying SCDFrequency of Plaque
A BFrequency of Plaque
Hemorrhage
a bbrupture erosion Severe CAD
(>75%)

Morphometric Analysis of Hemorrhagic Events in Human
Hemorrhagic Pericarditis
GpA MΦVulnerable Plaque
WFFMΦNC
G A
Plaque TypeGpAScore Iron
Necrotic Core(mm2)
MΦ(mm2)
vWFFeMΦ GpA
PIT no core(n=129)FA early core(n 79)
( ) ( )0.09±0.04
0.23±0.07
0.07±0.05
0.17±0.08
0.0
0.06±0.02
0.002±0.001
0.018±0.004(n=79)FA late core(n=105)TCFA(n=52)
*0.94±0.11
*1 60±0 20
*0.41±0.09
*1 24±0 24
*0.84±0.08
*1 95±0 30
*0.059±0.007
*0 142±0 016(n=52) 1.60±0.20 1.24±0.24
Values are reported as the means±SE, *p<0.001 versus early core. The number in parenthesis represent thenumber of lesions examined;the total number= 365. MΦ = macrophages
1.95±0.30 0.142±0.016
Kolodgie FD, et al. New Engl J Med 2003

Gross pictures of Plaque RuptureGross pictures of Plaque Rupture and TCFA
Rupture TCFA Fibroatheroma
Thr LumenLumen
Lumen
Thr
NC
NC+Hemorrhage
Ca++NC Ca++

Can we better characterize the differences between these three types of plaques?
Plaque Rupture Thin cap fibroatheroma Fibroatheroma ‐SP
three types of plaques?
Ca2+

Histomophological Comparison of PR, TCFA and FARupture TCFA FARupture(N=100)
TCFA(N=101)
Rupture+TCFAFA
(N=105)P value
Prox/Mid 66/34 68/33 134/67 70/35 0.98
EEL, mm2 16.0 ± 6.1 14.0 ± 5.9 15.2 ± 6.3 11.6 ± 4.5 <0.0001
IEL, mm2 14.2 ± 5.9 12.4 ± 5.5 13.5 ± 6.0 10.1 ± 4.0 <0.0001
Lumen, mm2 3.2 ± 2.7 3.6 ± 2.4 3.5 ± 2.9 2.5 ± 1.8 0.0014
Plaque Area, mm2 11.0± 5.0 8.8 ± 4.4 10.0 ± 4.9 7.6 ± 3.3 <0.0001mm
%Stenosis 78 ± 14 71 ± 14 75 ± 15 76 ± 14 0.50
Total NC Area, 4 37± 4 09 2 26± 1 98 3 38± 3 43 1 33±1 00 0 0001
,mm2 4.37± 4.09 2.26± 1.98 3.38± 3.43 1.33±1.00 <0.0001
Total Cal Area, mm2 0.58 ±0.99 0.50±0.94 0.54±0.97 0.46±0.81 0.46mm2
Total Mφ Area, mm2 0.53± 0.44 0.31 ± 0.36 0.43 ± 0.42 0.12 ± 0.16 <0.0001
Cap thickness, mm
0.03 ± 0.01 0.04 ± 0.02 0.03 ± 0.02 0.40 ± 0.19 <0.0001

e
Mild stenosis Moderate stenosis Severe stenosis
Plaque Rupture and TCFA with Varying Luminal Stenosis
e R
uptu
re
NCNC
NCThr Thr Thr
A B C
Plaq
ueD E F
TCFA NC NC
NC
D E F
NC
80
50
60
70
80
41.0%
55.2%
51.1%
69.6%Rupture
10
20
30
40N
3.8%10.2%
38.6%
5.9%
24.5%
FA
TCFA
03.8%
<50% 50-75% >75% <50% 50-75% >75% <50% 50-75% >75%
FA TCFA PR
% Stenosis Categories within Plaque Type% Stenosis Categories
FA
% Stenosis
FA RuptureTCFA

Incidence of TCFA, Rupture, Stable Plaque Stratified by Remodeling (IEL)y g ( )
TCFA Rupture Fibroatheroma
NC Area (mm2)
0‐1.01.0‐2.5
50 50 50
ce (%
) 1.0 2.52.5‐
0 0 0
cide
nc
Mφ ( 2)
0 0 0
50 50 50
Inc Mφ (mm2)
0‐0.10.1‐0.30 3‐0.3
0 0 0
0‐9 9‐13 13‐ 0‐9 9‐13 13‐ 0‐9 9‐13 13‐
IEL (Remodeling)

Recursive Partitioning Analysis (RPA) of Coronary arteries by Fibrous cap thickness and % Stenosis
Fib hFibroatheromaVulnerable PlaqueRuptured Plaque
Narula J, Nakano M, et al. Submitted JACC

Recursive Partitioning Analysis (RPA) of Coronary arteries by Macrophage Infiltrationand Necrotic core
Fib hFibroatheromaVulnerable PlaqueRuptured Plaque
Narula J, Nakano M, et al. Submitted JACC

Partitioning Analysis : %Stenosis
Partitioning Analysis : %Stenosis 50‐
Plaque Type Area
y>75%
Plaque Type Area
y75%
q yp
Rupture 0.7977
TCFA 0.5790
Rupture 0.8484
TCFA 0.6979
SP 0.8363 SP 0.8133

Independent risk factors for “rupture”Independent Morphological Predictor of Rupture
50‐75% cross‐sectional stenosisMovat
D68
ropahge)
C(M
acr
P Value Odds Ratio 95% CI
Cap thickness 0.005 0.35 0.16 – 0.69p
%NC 0.02 2.0 1.1 – 3.7
%Macrophage 0.052 1.8 0.99 – 3.2

Post‐Statin
Imaging Strategies for the Assessment of High‐Risk Plaque Characteristics, including CapThickness (OCT), Necrotic Core (CT‐ low attenuation plaque [LAP]), and Inflammation (FDG‐PET)
Post‐Statin
Pre‐Statin
Motoyama S, et al JACC 2009; Courtesy Jagat Narula, MD, PhD

Summary: Atherosclerosis( )Plaque rupture is a main cause of thrombosis (65‐70%),
while other minor causes include erosion (30%) and calcified nodule (2 5%)calcified nodule (2‐5%).
Risk factors are predictive of specific plaque typesb d b l d lDiabetes and metabolic syndrome play an important
role in CAD l bl l ( ) l k l l fVulnerable plaques (TCFA) is a likely precursor lesions of
rupture. ib hi k i h b di i i fFibrous cap thickness is the best discriminator of
vulnerable plaque and plaque rupture from stable lesionsM h i fil i i d i iMacrophage infiltration, necrotic core, and positive
remodeling are important parameters to identify if we are to recognize these lesion prior to clinical manifestationto recognize these lesion prior to clinical manifestation.

AcknowledgmentsFunding
CVPath Instit te
FundingCVPath Institute Inc.
CVPath Institute, Inc.
CVPath InstituteMasataka Nakano, MDFumiyuki Otsuka, MD, PhD ,Saami Yazdani, PhDFrank D Kolodgie, PhDElena Ladich, MDS i Y d i PhDSaami Yazdani, PhDRuss JonesRobert Kutz, MSEd Acampado DVMEd Acampado, DVMYouhui Liang, MDAbebe Atiso, HTMichael Cooper
Washington DC
Michael CooperJinky BeyerGiselle MagsalinHedwig Avallone HTHedwig Avallone, HTLila Adams, HTHengying Ouyang, MD


![Pathophysiology of Atherosclerosis and Vulnerable Plaque[1].pdf](https://img.dokumen.tips/doc/110x75/55cf93f7550346f57b9eed83/pathophysiology-of-atherosclerosis-and-vulnerable-plaque1pdf.jpg)