Embed Size (px)
Citation preview

VTT Global (Pvt.) Ltd.

1
ACRONYMS
CC
Common Collective
DCE
Discrete Choice Experiment
DFC
District Food Controller
FFP
Food Fortification program
INGO
International Non-Governmental Organization
KP
Khyber Pakhtunkhwa
MM
Mott MacDonald
NGO
Non-Governmental Organization
NP
Northern Punjab
ODK Open Data Kit
PFMA
Pakistan Flour Mills Association
RYK
Rahim Yar Khan
SP
Southern Punjab

2
Contents
EXECUTIVE SUMMARY ......................................................................................................................................................... 4
SECTION 1: INTRODUCTION ............................................................................................................................................. 6
1.1 Background ......................................................................................................................................... 6
1.2 Scope of the Study .............................................................................................................................. 8
SECTION 2: STUDY DESIGN ............................................................................................................................................... 8
2.1 Discrete Choice Experiment .............................................................................................................. 9
2.2 Questionnaire .................................................................................................................................... 9
SECTION 3: METHODOLOGY ........................................................................................................................................... 11
3.1 Sampling ............................................................................................................................................ 11
SECTION 4: FIELD IMPLEMENTATION .............................................................................................................................. 14
4.1 Baluchistan ........................................................................................................................................ 14
4.2 Sindh ................................................................................................................................................. 15
4.3 Hazara Region KP .............................................................................................................................. 15
4.4 KP Central .......................................................................................................................................... 15
4.5 Central Punjab ................................................................................................................................... 15
4.6 South Punjab/ North Punjab ............................................................................................................. 16
SECTION 5: FINDINGS AND ANALYSIS ............................................................................................................................ 17
5.1 Discrete choice experiment .............................................................................................................. 19
5.1.1 Importance of Attributes ............................................................................................................... 20
5.2 What are the implications? ............................................................................................................... 20
5.3 Answers to research questions ......................................................................................................... 21
Additional Analysis .................................................................................................................................. 21
What are the implications? ................................................................................................................. 22
5.4 Behaviour change scorecard ............................................................................................................. 22
5.5 Direct preference questions ............................................................................................................. 24
Answers to research question: Importance of attributes ................................................................... 24
5.6 Demographics ............................................................................................................................. 26
SECTION 6: CHALLENGES ................................................................................................................................................. 27
6.1 Coordination Challenges ................................................................................................................... 27
6.2 Lack of proper Administrative Structure in Mills .............................................................................. 27
6.3 The complexity of DCE ...................................................................................................................... 27
6.4 Authority Letter................................................................................................................................. 27
SECTION 7: DISCUSSION................................................................................................................................................... 28
Appendix: ................................................................................................................................................ 29

3
3.2.1 Findings of pre-pilot ................................................................................................................... 29
3.2.2 Outcome .................................................................................................................................... 30
3.3 Pilot Findings ..................................................................................................................................... 31
3.3.1 Outcome .................................................................................................................................... 32
Annexures: .............................................................................................................................................. 33
4
Executive Summary
“Micronutrient deficiency poses a serious health risk to the population especially to the well-being of
mothers and children. According to the National Nutrition Survey of 2011, stunting among children
under age five, increased from 41.6 percent in 2001 to 43.7 percent in 2011. Wasting similarly
increased from 14.3 percent in 2001 to 15.1 percent in 2011. The percentage of underweight children
remained the same at 31.5 percent (Wasfi 2013).
To help combat this and other related issues, the Food Fortification Program (FFP), a UKAID funded
project, is aimed at addressing the extent of malnutrition amongst the general public by increasing
the availability of fortified food with additional minerals, vitamins and other important nutrients.
One of the major components of FFP is to target the supply side of most consumable edibles like flour
and oil for maximum outreach. FFP in Pakistan is being managed by Mott MacDonald in partnership
with Nutrition International for five years. For its proper execution in Pakistan, FFP required a detailed
study to understand the preferences of the flour millers and their perception regarding the program.
Common Collective (CC), a UK-based research firm, was commissioned to design the study while VTT
Global was responsible for its execution. The study required a survey of 100 mills across the four
provinces of Pakistan. The survey was designed in two parts: one being the Discrete Choice
Experiment; while the other was a Questionnaire including a behavioural scorecard, direct preference
questions and a demographics section.
The Discrete Choice Experiment (DCE) was intended to study and analyse the hypothetical choice
patterns of the respondents without disclosing the objective (to gain knowledge of the underlying
preferences of millers regarding incentives to be provided such as machinery, marketing and subsidy
on premix by FFP). The sample taken for this study included the four provinces with a total of 17
districts. The sample was constructed to ensure the diverse representation of each province. The DCE
part of the survey required the respondents to select from two options, where each option was an
incentive package. These choices had to be made repeatedly under two different scenarios; one being
under the Regulation scenario (when government has legislated the process of fortification) and the
other a Non-Regulation scenario (when government has not legislated process of fortification). The
second half of the survey included a behavioural scorecard which was aimed at finding out the
behavioural barriers or enablers that influence miller’s decision to fortify. It was followed by the direct
preference questions which asked for the ranking of different incentives. The survey also included a
demographics section containing information regarding location and other basic details of the mill,
followed by suggestions and comments from the millers. VTT successfully conducted surveys of 101
mills and provided data to VTT’s analysis team, in collaboration with CC, to deduce the final results.
In essence, following are some findings penned in this report.

5
● The level of importance that millers give to different attributes of incentive packages,
depends highly on whether the government regulates fortification or not
● In scenario where fortification is regulated, Millers prefer Marketing over Subsidy and
Equipment. However, in the non-regulated scenario, no strong ordering preference
exists
● Millers do not appear to differentiate between Subsidy levels, i.e. all subsidy levels
“look the same”
● Some of the major behavioural barriers to fortification were found to be: lack of the
necessary skills to fortify flour; lack of peer support around fortification; inability to fit
fortification into current routines; and lack of clarity in planning for fortification
● The sanctions for non-compliance perceived by the millers, from most to least effective,
were: Mills losing access to quota; mills that are shut down for 3 months; mills fined
equivalent to 10% of their annual turnover; and mills highlighted in the local press.
6
SECTION 1: INTRODUCTION
Micronutrient deficiency poses a serious risk to the population especially to the well-being of
mothers and children. Health and nutrition are the basic concerns of any society, especially in a
country such as Pakistan, where 170,000 children (under the age of 5-years) die every year. One of
the main reasons for this escalating mortality rate is the malnourishment of mothers, which
consequently affects the health of their new-born children. This creates a domino effect of 24 billion
USD per annum of workforce loss. Furthermore, half of the pregnant women in Pakistan suffer from
anaemia. This high prevalence of anaemia among women of reproductive age is an important reason
for underweight new-borns, and translates to anaemia among children under the age of 5, which are
9 million in total1. One-Fifth of the pregnant women and children under five also have severe Vitamin
deficiency2. The health of the population relies heavily upon the wealth of the people, the poorest
children are, hence, more likely to suffer from malnourishment than their wealthier counterparts.
Pakistan is one of the largest producers of wheat, and the third largest producer of wheat in Asia
with an annual production of 25,500,000 MT3 for fiscal year 2017-18. When it comes to the
consumption of wheat, wheat flour contributes to 72% of Pakistan’s daily caloric intake. With the
growing income of the population and a rising middle class, the consumers are gradually moving
towards a diet containing more dairy, meat and other highly nutritious food products. With the
increasing population per capita consumption of around 124 kg per year (est. 2012) will increase to
133.3 kg by 2024, which is 6th highest in the world4. However, this should be kept in mind that
Pakistan has been ranked as a country with serious hunger level with 22% of its population
undernourished5.Currently the consumption demand for wheat is being fulfilled by almost 1000 flour
mills across Pakistan. The disbursement of government-owned wheat to these flour mills is regulated
in an effort to ensure that sufficient wheat is available throughout the year6.
1.1 Background
‘Food fortification’ is the addition of vitamins and minerals to staple foods, to prevent micronutrient
deficiencies. Fortified foods provide a preventive benefit to consumers, and help in preventing
diseases, strengthen immune systems, and improve cognitive development. Under the Food
Fortification Programme, wheat flour was selected as a vehicle for providing essential micronutrients
– iron, folic acid, vitamin B12 and zinc – given it is a universally consumed staple in Pakistan.
1 https://data.worldbank.org/indicator/SH.PRG.ANEM?locations=PK&view=chart
2 https://www.unicef.org/pakistan/FINAL_UNICEF_Annual_Report_2015_.pdf
3 https://pabausa.org/1013/pakistans-wheat-production-in-2015-16-estimated-at-25-5-million-tons/
4 https://www.oecd-ilibrary.org/agriculture-and-food/oecd-fao-agricultural-outlook-2015/wheat-projections-consumption-food-use-per-
capita_agr_outlook-2015-table121-en
https://journals.plos.org/plosone/article?id=10.1371/journal.pone.0066428 5 https://www.dawn.com/news/1289693
6 https://gain.fas.usda.gov/Recent%20GAIN%20Publications/Grain%20and%20Feed%20Annual_Islamabad_Pakistan_4-3-2017.pdf

7
Keep the body
healthy and energetic
Protect against a
number of diseases
Prevent mental
and physical birth defects
Improve learning
and cognitive abilities of
children
Improve the work
performance of adults
Physical
development of children
A balanced diet is the main source of essential micronutrient. However, most of the people either
do not have access to a nutritious diet, or simply cannot afford it. Food fortification, therefore, is a
viable initiative and solution to this problem as it ensures a diet contains these micronutrients and
reduces micronutrient deficiencies.
Food fortification is obviously not a
treatment for malnutrition but it
rather helps act as a preventative
measure for malnutrition.
The Food Fortification Programme
(FFP), managed by Mott MacDonald in
partnership with Nutrition
International, is a five-year programme
funded by the UK Aid. Both
organizations have worked in Pakistan
for many years.
FFP has been established as a possible
solution to the major public health
challenges of micronutrient
malnutrition in Pakistan. FFP provides support to the Government of Pakistan to improve
fortification regulatory system as well as to assist the industry to adequately fortify wheat flour and
edible oil/ghee in Pakistan. Moreover, FFP has played a role in the process of creating awareness and
supporting generating evidence for the formulation of relevant policies to tackle the micronutrient
deficiencies in Pakistan. FFP has already registered 157 mills in Punjab, 25 in Islamabad and 10 in
Sindh with the program. It plans to expand its reach throughout the country. In these registered
mills FFP has successfully contributed in fortification of flour (27% in Sindh 10 % in Punjab and 8% in
Islamabad). FFP is continuing its efforts to get cognisant with the wheat and flour land scape of
Pakistan through investing in studies like the one on hand. The program is giving substantial
importance to the perception of millers of Pakistan regarding fortification and problem of nutrition.
The role of FFP in creating a synergy between the government, millers and influential private
organizations is commendable as future of fortification and a way forward strategy regarding the
nutritional strategy largely depends on the collaboration between these stakeholders.
The main objective of the programme is to contribute to the improvement of the
nutritional status of people in Pakistan, particularly women of childbearing age
and young children.
With the aim to make the fortification universal through changing laws and regulatory enforcement
mechanisms, and ensuring that the fortification is carried out effectively, FFP collaborates and
coordinates with Government institutions at Federal, Provincial and District levels. These
institutions include food departments, food authorities, health departments and education
departments. The FFP provides technical assistance to the public sector to develop fortification

8
standards, mandatory legislation, rules, and regulations and compliance mechanisms for food
fortification, as they are essential in making the concept of fortification universal.
In order to determine the importance of a premix subsidy, and other types of incentives for millers
across Pakistan, and accordingly determine if these incentives are framed and executed at the right
level, VTT Global (Private) Limited (hereinafter referred to as VTT) was commissioned by Mott
MacDonald to carry out a quantitative study with a sample size of 100 flour mill owners across
Pakistan. Common Collective, a UK based organization, served as a research consultant to the
project executing firm.
1.2 Scope of the Study
The Flour Milling Industry of Pakistan has a difference in terms of practices across the country
depending upon the type and quality of the wheat flour demanded in the local market. To state an
example, in Punjab Province, the Flour Mills extract between 12 percent to 18 percent bran for
chapatis (tortilla) while in case of urban areas, extraction of wheat flour for baking flat bread or Nan
lies at a higher percentage (between 55-60 percent) in order to produce wheat flour for baking
Naan. Whatever remains afterwards is then used to make Fine Flour (Maida) to fulfil the demand of
industrial bakers and Semolina (Suji) for confectionery products7. These local milling practices vary
across the country.
Such a wide range of changing practices across different areas, let alone the provinces, calls for a
research that could consider the opinions of each cluster of mills across the four provinces.
The research was aimed to assess the role and likely impact of temporary incentives for wheat flour
millers planned as part of the FFP and to inform the final incentive package offered, ensuring
resources are spent on the combinations of interventions most likely to change millers’ behaviour
(to fortify their flour), within both a mandatory and non-mandatory context. VTT conducted the
field research in order to answer the questions that help in achieving the aim of the research study
and to understand the underlying behaviour patterns of millers under varying scenarios to provide an
insight to FFP so they can prioritize the incentives.
The research consisted of 101 interviews across the four provinces of Pakistan; namely Punjab,
Sindh, Baluchistan and Khyber Pakhtunkhwa. Each interview included two parts; the first part
focused on the Discrete Choice Experiment (DCE) while the second part included a questionnaire.
The interviewees were either managers or mill owners and the length of each interview on average
was 20 minutes. It was made sure that every interview must take place at the respective mill and
respondent should be in a position of decision making. For a detailed discussion on the survey
instrument, please refer to the subsequent section of the report.
SECTION 2: STUDY DESIGN
The study, designed by Common Collective, consisted of two parts:
7 http://www.millermagazine.com/english/flour-milling-industry-of-pakistan/

9
To find out the relative importance of attributes (equipment, subsidy and marketing) that may have any
influence over the choice of packages, made by the millers.
Considering the two scenarios: regulation and no regulation, how much does a scenario affect the
choice of the miller regarding which package they prefer?
How much does the scenario affect the relative importance of the
attributes?
How much influence does a subsidy level have over the choices
of the millers? Can they identify and observe the different levels of
subsidy?
Aims
i. Discrete Choice Experiment
ii. Questionnaire
2.1 Discrete Choice Experiment
A Discrete Choice Experiment was conducted in order to evaluate the relative importance of the
different types of incentives offered to millers as factors in their decision making. The experiment
asked the respondents to choose between a set of options, making these choices repetitively. The
options covered different incentive packages which differed in a number of attributes. The study was
considered as an experiment as the attributes were controlled by the researcher.
The task consisted of a total
of 7 to 8 forced binary choice,
which each miller had to
make. Half of the choices
were made under the
scenario of government
regulation/enforcement,
while the other half were
made under the scenario of
no government regulation/
enforcement.
.
The three attributes considered for the study as part of the incentive package were:
a) A micro-feeder worth PKR 471,975 for which the mill owner was asked to contribute PKR
30,450 to the maintenance.
b) A marketing campaign to increase consumer demand for fortified foods.
c) A premix subsidy. The subsidy was to be offered at a diminishing rate for 2 years after which
the cost will be shifted on the consumers. The subsidy was to be given after every six
months. Following are the four different levels of subsidy.
i. 80%-60%-35%-20%
ii. 70%-50%-25%-10%
iii. 60%-40%-15%-10%
iv. 50%-30%-10%-5%
Once the respondents chose an option, they were then asked to decide whether they
would initiate the process of fortification or continue their current practices.
2.2 Questionnaire
The questionnaire aimed to answer the following questions:

10
1 and 2 above were addressed through the administration of 30 validated statements which
respondents were asked to rate on a five-point scale. The results from these statements were
consolidated in a Behaviour Change Scorecard. 3, 4 and 5 were addressed through preference-based
ranking questions. This was followed by demographics related questions.
1.
2.
3.
4.
5.
Which behavioral barriers affect the implementation of FFP?
Which of the non-financial incentives, engagement strategies or
penalties might support the implementation?
What is the relative importance of premix subsidies in the eyes of the
millers and how do they rank them?
Is this ranking any different from the one obtained through the
discreet choice experiment?
How personal activities and characteristics influence the results?

11
SECTION 3: METHODOLOGY
The following section expounds on the step by step methodology of the study. A sample of hundred
mills in four provinces was already decided by Mott MacDonald which was further segregated by
VTT into 7 regions and 17 districts.
3.1 Sampling
The sampling strategy used for this research was proportionate sampling. A total of 100 mills were
sampled where each province had its true representation. The mills were sampled based on the
clusters and adjacency in a given region. Hence, the total sample was not only a correct
representation of the country but also a correct representation of each region of each province.
The population size for this research was approximately 1000 mills but the study had to exclude the
mills that were already registered with the food fortification programme.
The following districts were excluded:
Sr. no Districts
1 Lahore 2 Islamabad 3 Faisalabad 4 Rawalpindi 5 Gujranwala 6 Gujrat 7 Sheikhpura 8 Toba Tek Singh 9 Sahiwal 10 Pak Pattan 11 Chiniot 12 Karachi
This consideration decreased the size of the population to a total of 762 mills. For the four
provinces, a sample of 100 mills had to be selected. Mott MacDonald provided a number of mills for
each province and Probability Proportional to Size (PPS) sampling was, thus, carried out.
Given that the Province of Punjab had the largest number of mills, therefore, a large sample i.e. 61%
was selected while the second largest sample was taken from KPK followed by Sindh and Baluchistan
as shown in the table below:
Province Number of mills Percentage Punjab 468 61.4% KPK 177 23.2% Baluchistan 45 5.9% Sindh 72 9.4% Total 762 100%
Each of the first two provinces was further divided into smaller regions and clusters in order to
draw an accurate sample. The Province of Punjab was divided into North Punjab (NP), South Punjab
(SP) and Central Punjab (CP) and the concentration of mills were taken into consideration to

12
identify districts for sampling. North Punjab, thus, had the smallest sample considering that most of
the region has already been registered while the largest sample was taken from South as illustrated
in the table below.
Punjab Areas # of Mills Percentage NP 71 15% CP 174 37% SP 223 48% Total 468 100%
The following table provides initially selected districts and mills within each district.
Province District Number
Northern Punjab Mianwali 2 Attock 7
Central Punjab Sargodha 8 Mandi Bahauddin 7 Khanewal 8
Southern Punjab Multan 10 Bahawalpur 7 Rahim Yar Khan 12
Northern KP Mansehra 2 Abbottabad 2 Haripur 2
Central KP Charsadda 3 Peshawar 7 Mardan 4
South-east KP Bannu 3
Sindh Sukkur 6 Ghotki 4
Baluchistan Quetta 6 Total 100
A few revisions had to be made in the initially selected sample because of FFP registering with the
mills from a few more districts. Mandi Bahauddin was in the process of registering and hence it was
selected for a pre-test. Due to these revisions made by Mott MacDonald, two districts were
replaced from the final sample. The districts of Attock and Mandi Bahauddin were excluded from the
final sample. The district of Attock was replaced by Jhelum, which is the closest district and exists in
the same cluster representing the same area while one mill for Attock had to be taken from
Northern KPK region for having a close proximity and also being part of the same cluster. Whereas
the sample of Mandi Bahauddin was divided into districts that were already selected. These districts
were from the same cluster and strata and followed the same sampling strategy. The Bannu district
on the other hand, was replaced by Nowshehra because of the accessibility, deployment of human
resources and time scarcity in the execution of data collection. Another determinant for the final
selection of flour mills for the research study was the operational status of the mills as it was found
that certain mills selected in the sample were either temporarily or permanently closed, and the
number of operational mills found to be less than the selected sample for each district. Therefore,
number of mills were either divided, as in the case of Mandi Bahaudin District, or
increased/decreased within districts keeping the total sample reasonably closer to initially selected
sample for a region. The final sample included the districts as shown in the table below:

13
Province District Number
Northern Punjab
Mianwali 4
Jhelum 4
Attock 0
Central Punjab
Sargodha 12
Mandi Bahauddin 0
Khanewal 9
Southern Punjab
Multan 10
Bahawalpur 12
Rahim Yar Khan 9
Northern KP
Mansehra 3
Abbottabad 1
Haripur 3
Central KP
Charsadda 1
Peshawar 12
Nowshehra 3
Mardan 1
South-east KP Bannu 0
Sindh Sukkur 6
Ghotki 5
Baluchistan Quetta 6
Total 101

14
SECTION 4: FIELD IMPLEMENTATION
After all the project stakeholders consented upon the way forward strategy and proposed changes in
instrument, fieldwork began from 4th July 2018. Since fieldwork was spread across the 4 provinces,
18 target districts were segmented in 7 broad regions as demonstrated in the figure below:
A team of 7 field researchers was provided training on the instrument to carry out the survey of
above-mentioned districts in their respective regions. The pre-test and earlier experience of VTT
with the mills helped the field managing team in envisaging potential hiccups during the field work
across the targeted regions. Due to diversification of target districts, it was anticipated that every
region will pose its own challenges. Every possible source of communication was analysed carefully
as it was significant to pitch the purpose of survey to the millers in an appropriate manner to get
desired results. The Common Collective Team was very specific about the “attention” of millers
during survey time to get required response to analyse their underlying preferences. To get their
undivided attention, it was decided that rather than scheduling an interview on call, a local influential
millers or respective District Food Controller Officers will be engaged. Mott MacDonald in this
regard, extended their support to get relevant personnel on board in numerous districts of Punjab
and Baluchistan.
On the whole, the field execution went smoothly, with some minor challenges (details are provided
in the Conclusion Section), and was completed before anticipated date of 20th July. It started on 4th
July and survey of 101 industries was completed before 14th July. The following section explicates a
brief overview of the region-wise field activity.
4.1 Baluchistan
Baluchistan was one of the most focused regions for project implementers as the sample for
province (region) was relatively low as compared to the other regions with only one target district;
Quetta. Rather than hiring an external resource for Quetta, VTT preferred in-house resource who
was cognizant with local language due to his Baloch background. Mr. Javaid Iqbal from Mott
MacDonald provided contact of Mr. Badrudin Kakar, Central Chairman, Pakistan Flour Mills
Association (PFMA) Baluchistan, for smooth execution of survey. Our researcher contacted him and
he scheduled interviews with 6 industries from 11th July to 14th July. Our field researcher successfully
conducted survey of schedule industries. The field went smoothly, however, millers generally
recorded their discontent about difficulties they face during regular course of their business. On the
whole, they understood the purpose of survey and attentively provided all the responses.
Central Punjab
Sargodha
Khanewal
South Punjab
Bahawalpur
Multan
Rahim Yaar Khan
North Punjab
Jhelum
Mianwali
Central KP
Peshawar
Charsadda
Mardan
Noshehra
Hazara KP
Abbotabad
Mansehra
Haripur
Sindh
Sukkur
Ghotki
Baluchistan
Quetta

15
4.2 Sindh
After Baluchistan, the Province of Sindh had the minimum sample of 10 mills with Sukkur (6) and
Ghotki (4) were two target districts for Sindh. As it was noticed in pre-test that in addition to Urdu,
the researcher must also be cognizant with local language of the region. For fulfilling the purpose, an
experienced resource form Sukkur was hired who has already worked with VTT in multiple
projects. As there was no District Food Controller engaged for Sukkur and Gotkhi, our field
researcher in collaboration with VTT’s coordination team contacted some members of local
associations and influential millers to get other target respondents on board.
VTT’s field researcher conducted 11 industries from 10th July to 14th July (7 from Sukkur, 4 from
Ghotki). Before start of the survey, our researcher took 2 to 3 days to get connected with relevant
people for interview scheduling.
4.3 Hazara Region KP
Hazara region was one of the toughest regions to conduct the survey as the District Food
Controller was not on board neither was any local influential or association member. VTT’s core
coordination team tried to obtain some preliminary information about Hazara region and it was
noted that there were numerous non-functional mills. The target was to survey 6 mills from Haripur,
Abbottabad and Mansehra. Despite a very manageable target, field researcher had to visit 24 mills to
survey 7 functional mills in all three target districts. However, millers of the region wholeheartedly
welcomed the field researcher and cooperated with him in every manner.
4.4 KP Central
KP central was also a tough region as our field researcher had to survey 17 industries in Peshawar,
Mardan, Charsadda and Nowshera. Initially, Bannu was also included from South KP but later it was
replaced by Nowshera, as a result of feedback from Mott McDonald. As there was no DFC on board
or any other influencer, VTT’s core coordination team extracted the contact information of millers
in KP central and started scheduling interviews through phone calls. Fortunately, some millers
responded and agreed for survey and from there, our field researcher relied on a word of mouth
approach whereby positive millers contacted with their peers to reach the target of surveying 17
mills..
4.5 Central Punjab
A majority of significant districts like Lahore, Gujranwala and Faisalabad were already registered
with FFP so were Mandi, Sargodha and Khanewal districts from central Punjab. Later on, Mandi was
excluded from the sample because pre-test was conducted there. So revised sample for CP was 12
industries from Sargodha and 9 from Khanewal. As DFC’s of both districts were on board, our field
researchers faced no major bottleneck in scheduling the interviews with millers. There were two
field researchers used for this region due to geographical limitations.

16
4.6 South Punjab/ North Punjab
South Punjab was significant because it had the largest survey sample. There were three targets
districts; Multan, Bahawalpur and Rahim Yar Khan and 31 industries were surveyed according to
revised sample. Because of the geographical restrictions, two field researchers were taken on board
to reach the target. DFC’s of all districts were on board and they assisted our field researchers in
coordinating and scheduling with millers. Field execution in South Punjab region went smooth and
researchers completed their target within allotted time and general response of millers was
heartening regarding nature of survey.
There was only one district to be covered in North Punjab. Initially, it was Attock but replaced with
Jhelum because FFP team already coordinated with millers of Attock for registration with the
programme. The revised sample of Jhelum was of 4 mills and covered by our field researcher in a
single day. As DFC from Jhelum was onboard, all millers cooperated with our researchers. They
appreciated the initiative of the survey and showed interest in the process.

17
SECTION 5: FINDINGS AND ANALYSIS
This section focuses on the findings of the survey. Each of the two parts of the survey are analysed in
detail and the implications of the results are discussed.
The discrete choice experiment was aimed at finding the relative importance of each attribute, and
the associated levels, and how the relative importance differs according to the scenarios (Regulation
versus non-regulation). When it came to the regulation scenario, the relative importance of these
attributes appeared very clear and the millers preferred marketing over subsidy and equipment.
While for the non-regulation scenario, there was no clear order between the attributes. Moreover,
the respondents were unable to differentiate between the different levels of Subsidy. The Millers
were equally likely to choose no matter which level they are being offered. From the study it can be
deduced that the millers will have a same behaviour towards fortification regardless of the level of
subsidy that they are being offered.
The second part of the survey was the questionnaire that was aimed at finding the different
behavioural barriers for millers to fortify their flour. The preference questions that followed the
behavioural questions focused on the millers’ ranking of the sanctions for non-compliance. The
second direct preference question focused on the incentives from the DCE and the results were
generally consistent with the results of DCE.
The demographics suggest that existing knowledge regarding the fortification process plays a key
role in determining the willingness of the millers to fortify.

18

19
5.1 Discrete choice experiment
The discrete choice experiment used a “Revealed Preference” approach as opposed to a “Stated
preference” approach, where millers were asked to make repeated choices in an experiment rather
than asked directly about their preferences. This technique attempts to reveal the hypothetical
behaviour of millers under a variety of scenarios when real world testing is not practical, and is
deemed more accurate that direct questioning. As already discussed the DCE involved two different
scenarios. The first scenario was Regulation while the second was Non-Regulation.
The data generated in the DCE flour fortification scenarios were analysed using a logistic regression,
in STATA. This model was used to determine the statistical significance of each attribute i.e.
marketing, subsidy and machinery. Choices from each scenario (regulation and non-regulation) were
analysed separately, and compared.
In the regulation scenario, the respondents were asked to assume a situation where the
government has legislated that millers must fortify flour and the non-compliance will result in the mill
being fined or shut down. The response of Millers in the given scenario can be seen in the table
below. This table shows two things: 1. That marketing is more important than the rest of the
attributes, and that there is no difference between the subsidy levels.
Attributes Coefficients P value Marketing .1009623 0.038* Machinery/equipment -.0148457 0.767 subsidy_80% .0288235 0.692 subsidy_70% -.097772 0.152 subsidy_60% -.0353085 0.598 * significant at p<0.05
The most important attribute in the regulation scenario is marketing as evident in the analysis table.
The p-value for marketing is less than 5% showing that the Millers gave significant importance to
marketing. This also shows that marketing has weighted preference within the responses of one
miller as well as across different millers. This is evident from the above-mentioned coefficient values,
where marketing has the highest positive value of the coefficient. A positive coefficient means that
millers are positively preferring marketing over no marketing. Whereas, the negative sign of
coefficient represents the negative preference. The Table shows that the Millers preferred no
machinery over machinery in the choice sets given. This might be because of the impression among
millers that a locally procured equipment will be less costly which was noted by the researchers.
However, the value of p is high along with a negative coefficient showing "a lack of a strong driver
behind the choices of millers. Same is the case with subsidy. The analysis showed no significant
difference between subsidy levels. This means that the millers' choices was not affected by the
different subsidy levels, which might be due to lack of understanding from the millers, or to a true
non-differentiation of these levels. This might be due to the lack of interest in the subsidy from the
millers or their lack of understanding thereof. The latter is less likely as it was tested for its
presentation and understanding with the millers during the pre-test, moreover, the ranking question
in the second half of the survey was correctly answered by the millers which show their clear
comprehension of the subsidy levels. In short, the presence or the absence of marketing drives the
choice of the millers with equipment having the least effect.
Hence, it can be said that if fortification is to be made mandatory, then the most effective way of
engaging millers would be to market the product (in addition of course to enforcement of
sanctions). This makes sense when we see it from the perspective of the millers as the general

20
awareness of the consumer is the key to making revenue which if done correctly can out value the
rest of the attributes.
The other scenario under DCE is non-regulation and the results are as shown in the table.
Attributes Coefficients P value Marketing .1784008 0.452 Machinery -.1247958 0.611 subsidy_80% .2265761 0.520 subsidy_70% -.2854813 0.371 subsidy_60% -.0129757 0.968
The results for this scenario are very different from the one with regulation as the model’s fit was
lower than the other, meaning that the millers had a diverse set of preferences under this scenario.
The above table shows an insignificance of the relationship between attributes and the choice. Just
like in the previous scenario there was a lack of differentiation between the levels of subsidy. Any
affects in the non-regulation scenario are not to be generalized as the inconsistencies were very high.
So, it can be said that the levels of subsidy did not matter to the respondents but importance of
subsidy itself was relatively high but not significant. Either Heterogeneous preferences or the small
sample size could be the reason why we did not get any relationship here.
5.1.1 Importance of Attributes
The relative importance of attributes can be found by analysing effect of each predictor (marketing,
equipment, and subsidy) on the log likelihood of the model.
SR No.
Regulation Non Regulation
1 Marketing Subsidy 2 Subsidy Marketing 3 Machinery Machinery
The results of the relative importance of attributes are aligned with the logistic model results of
DCE. The higher the value, the higher importance is given to the attribute. In the regulation
scenario, marketing is relatively most important then comes subsidy and machinery. Whereas, in the
non-regulation scenario, subsidy is relatively most important, then comes marketing and machinery.
5.2 What are the implications?
When talking about the development of the community, marketing can be regarded as the pivotal
factor of it. The development of the underdeveloped communities requires a spread of knowledge
regarding issues. These issues can only be brought up in the daylight through marketing. In countries
like Pakistan, issues like population control, education and child labour have all been addressed
through marketing campaigns in the form of social service messages. Marketing campaigns have been
used previously in promoting nutritional development among the population, take the example of
Iodized salt which was a solution to widespread iodine deficiency in Pakistan.
Food fortification programme has been appreciated through the survey. However, they have
expressed it through the comments and through the analysis that the marketing of this programme
and the product that they are providing will assist them in adapting to this process. At the end of the
day, businesses require profitability and that comes from sales. Millers want to make more profit

21
considering the current situation where many mills are being shut down because of the greater
competition and a decline in business.
In short, the incentive of free marketing carries more weight than the rest considering the lack of
knowledge consumers currently have regarding the programme. The second most important output
from the results is regarding the importance of regulation as millers have a fear that they will have to
compete with the other mills while taking a risk of introducing a new product that consumers have
no awareness of. This fear can only be overcome if there is legally binding enforcement, and a
properly executed marketing campaign.
5.3 Answers to research questions
1. To what extent does the relative importance of the attributes vary depending on
the scenario?
The relative importance of attributes is highly dependent on the scenario. In the regulation scenario,
there is a strong preference for Marketing over Subsidy and Equipment. In the non-regulation
scenario, there are fewer clear-cut preferences, with millers not showing a strong ordering between
attributes. This was further explored in the additional analysis (see below). In both scenarios, there
was no clear differentiation between the different subsidy levels.
2. To what extent does the scenario (regulation vs no regulation) affect which
incentive package, or not, millers choose?
The scenario is a key decision point for millers. In the regulation scenario, millers are significantly
more likely to prefer an incentive package which contains a strong Marketing element to it, while if
no regulation is in place, millers do not show a consistent preference.
3. To what extent does the subsidy level affect millers' choices differently, i.e. will
the different subsidies be differentiated for the millers or will they all just "look
the same" for them?
The results suggest that millers do not differentiate much between the different subsidy levels. While the presence of a subsidy is more important than equipment, the different levels of subsidy seem to “look the same”. This is despite having pretested the communication medium of the subsidy levels, to ensure this was clearly understood, ands millers were able to choose rationally between the levels when asked to compare directly.
Additional Analysis
After asking millers to choose between two different incentive packages, millers were always given a
third option which was to reject either incentive package and simply choose not to fortify. This was
to try to see how varying the attributes and levels was likely to influence the key behaviour of
interest – whether to fortify their product or not.
The statement was phrased neutrally to avoid courtesy bias and at the end of each choice task
millers were asked if they would select either package or continue the current practice.
42% of millers chose to initiate fortification consistently regardless of the scenarios given whereas,
25% chose to continue with the current practices and were not willing to initiate fortification in both
scenarios.

22
Regulation (with consistent choices) (%)
Non-Regulation (with consistent choices) (%)
Total Millers (with consistent choices) (%)
Millers who are completely willing to initiate fortification
68.3 44.5 40.6
Millers who are not willing to initiate fortification at all
8.7 50.5 25 24.7
97) 95 65.3
When choices of Millers regarding initiation of fortification were analysed separately for both
scenarios, results showed that in regulation scenario, 68% consistently chose to initiate fortification
and 29% chose to continue current practices.
Whereas, in a non-regulation scenario, 44% chose to initiate fortification and a higher percentage
(50%) chose not to initiate flour fortification.
These results are consistent with the results from the direct preference questions and they show a
higher percentage of millers who have shown a willingness to fortify. The results are outstanding in a
sense that they consider the percentage of millers and not the total choices made as each miller was
making choices for multiple choice tasks. The same ranking obtained from the DCE section and the
direct preference questions strengthens the results of this study.
What are the implications?
The frequencies mentioned above imply that overall there is a majority of millers willing to fortify if
it is mandatory, though less than half when it is not regulated, confirming that effective regulation is
key. Millers have an inherent fear that the adaptation of the new programme will take them behind
competition as any new process in a business brings an element of risk. The assurance that the
battleground is the same for the whole competition creates a positive attitude of the millers towards
the new programme.
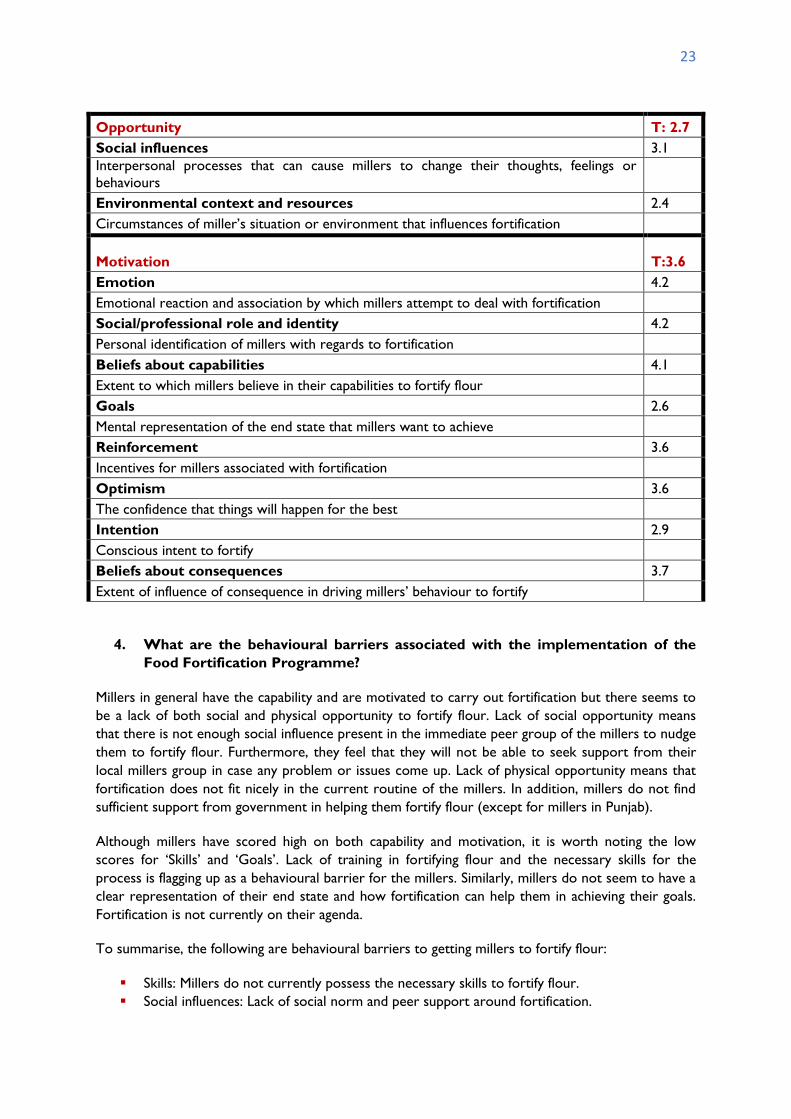
5.4 Behaviour change scorecard
This part of the Survey attempted to identify the behavioural barriers for millers to fortify. The
millers were asked to respond to a series of statements focusing on the behaviour and general
opinion of the millers with respect to the decision of fortification. The Analysis is segregated into
three sections; Capability, Opportunity and Motivation. These three sections are further divided into
sections. Total average score (out of 5) (1 is low and 5 is high) of main and subsections are given in
the table below:
Determinants of behaviour change Score
Capability T: 3.4
Knowledge 3.1
Awareness and knowledge of fortification Skills 2.8
Have necessary skills to fortify flour Memory, attention and decision process 4.2
Ability to maintain focus on fortification
23
Opportunity T: 2.7
Social influences 3.1 Interpersonal processes that can cause millers to change their thoughts, feelings or behaviours
Environmental context and resources 2.4
Circumstances of miller’s situation or environment that influences fortification
Motivation T:3.6
Emotion 4.2
Emotional reaction and association by which millers attempt to deal with fortification Social/professional role and identity 4.2
Personal identification of millers with regards to fortification Beliefs about capabilities 4.1
Extent to which millers believe in their capabilities to fortify flour Goals 2.6
Mental representation of the end state that millers want to achieve Reinforcement 3.6
Incentives for millers associated with fortification Optimism 3.6
The confidence that things will happen for the best Intention 2.9
Conscious intent to fortify Beliefs about consequences 3.7
Extent of influence of consequence in driving millers’ behaviour to fortify
4. What are the behavioural barriers associated with the implementation of the
Food Fortification Programme?
Millers in general have the capability and are motivated to carry out fortification but there seems to
be a lack of both social and physical opportunity to fortify flour. Lack of social opportunity means
that there is not enough social influence present in the immediate peer group of the millers to nudge
them to fortify flour. Furthermore, they feel that they will not be able to seek support from their
local millers group in case any problem or issues come up. Lack of physical opportunity means that
fortification does not fit nicely in the current routine of the millers. In addition, millers do not find
sufficient support from government in helping them fortify flour (except for millers in Punjab).
Although millers have scored high on both capability and motivation, it is worth noting the low
scores for ‘Skills’ and ‘Goals’. Lack of training in fortifying flour and the necessary skills for the
process is flagging up as a behavioural barrier for the millers. Similarly, millers do not seem to have a
clear representation of their end state and how fortification can help them in achieving their goals.
Fortification is not currently on their agenda.
To summarise, the following are behavioural barriers to getting millers to fortify flour:
Skills: Millers do not currently possess the necessary skills to fortify flour.
Social influences: Lack of social norm and peer support around fortification.

24
Environmental context and resources: Fortification does not fit nicely in current routine of
millers and insufficient support from government (except for millers in Punjab).
Goals - lack of clarity in planning for fortification and how it can help millers in achieving
their end goal.
5. What non-financial incentives or engagement strategies might support
implementation?
The following recommendations might support implementation:
Provide training to millers on food fortification. These are being conducted in Punjab and
other provinces may require the same.
Develop a buy-in at the provincial level for fortification. More importantly, establish and
strengthen it. Just like it is being done in Punjab.
Use a Local millers’ network in food fortification which can be developed from persuading a
local influential miller and to train him regarding basic concepts of fortification so he could
become a champion or an ambassador and provide a social influence in favour of
fortification.
Use social proof in marketing campaigns to develop social norms around food fortification.
Educating the millers in this regard through trainings and seminars can be a possible way.
Assist millers in setting short-term specific goals regarding fortification and highlight how
fortification links to millers’ end goals.
5.5 Direct preference questions
This section of the survey asked for the respondents to rank the certain items on the basis of their
preferences.
Answers to research question: Importance of attributes
6. What sanctions would support implementation (e.g. fines, loss of access to
subsidized wheat quota, name and shame etc.)
The millers were asked to rank the sanctions for non-compliance in the order of preference. The
results are presented in the table below.
Sanction Ranking
Average Rank Score (Rank) 1 (%) 2 (%) 3 (%) 4 f (%)
Mill loses access to quota of subsidized wheat for 1 year 32.7 28.7 15.8 22.8 2.29 (1)
Mill is fined equivalent to 10% annual turnover 19.8 30.7 35.5 13.9 2.44 (3)
Mill is shut down for 3 months or until it can demonstrate compliance 24.8 32.7 19.8 22.8 2.41 (2)
Mill is named in local press 22.8 7.9 28.7 40.6 2.83 (4)
The sanction of mill losing its access to a quota of subsidized wheat for 1 year was ranked by the
most respondents at 1. The number is shown in the frequency column of the above table. 32.7% of
the respondents gave it the first rank. The sanction stating the mill to be shut down for 3 months or
until it can demonstrate compliance was ranked by most of the people in the second place. The third
most important sanction was mill being fined equivalent to 10% annual turnover. Mill to be named in
the local press was the least important sanction according to 40.6% millers.

25
The table below shows the types of supports that the millers can be offered in order for them to
start fortifying.
7. How do millers rank the importance of the different attributes?
The millers were asked how important they thought each of the types of support (the attributes
from the DCE) were for them to start fortifying flour at their mill. The table below shows the
rankings for each type of support. Each cell shows the percentage (%) of millers who placed that
type of support at that rank. For example, 37.6% of millers placed ‘The government has legislated...’ at Rank 1.
Regulation Ranking Average Rank 1 f (%) 2 f (%) 3 f (%) 4 f (%)
The government has legislated that you must fortify your flour. Mills will be inspected and those that do not comply will be fined or shut down.
(37.6) (17.8) (13.9) (30.7) 2.38 (1)
You are provided with a micro-feeder worth PKR 471,975 and asked to contribute PKR 30,450 to the maintenance. You will be allowed to keep the micro-feeder after two years if you pass the inspections.
(22.8) (24.8) (32.7) (19.8) 2.50 (3)
You are given a premix subsidy. (9.9) (36.6) (25.7) (27.7) 2.71 (4) There will be a nation-wide marketing campaign to raise public awareness of the advantages of fortified food and increase consumer demand. The awareness messages will be spread through various channels such as television (cable and national), billboards, lady health workers, school health and nutrition supervisors etc.
(29.7) (20.8) (27.7) (21.8) 2.41 (2)
The direct ranking of the attributes, across all millers shows that the attributes, ranked from most to
least important are: Legislation, Marketing, Equipment and finally Subsidy. Some attributes were less
agreed on than others, such as Legislation which 30% of respondents mentioned was the least
important attribute, or Marketing which was rated as most important by 30% of respondents, and
third most important by 28%.
The attributes in the direct ranking questions were the same as the ones in DCE. The motivation
behind asking millers directly about their preferences in addition to the indirect way (through DCE)
was to explore whether millers had inconsistency in their stated and revealed preferences. The
direct rankings validate the results obtained from DCE.
8. How do millers rank the importance of the different premix subsidies?
The next statement regarding the rating was about ranking the different levels of subsidy. The table
shown below presents the average ranking of the levels of subsidy and also shows the frequency of
or number of times that subsidy was ranked at a certain position.
Subsidy level Ranking
1 f (%) 2 f (%) 3 f (%) 4 f(%) 80% subsidy (90.1) (5.9) (2.0) 2 (2.0) 70% subsidy (5.9) (86.1) (6.9) 1 (1.0) 60% subsidy (3.0) (4.0) (86.1) 7 (6.9) 50% subsidy (1.0) (4.0) (5.0) 91 (90.1)

26
This question was asked to check internal consistency and understanding of the millers. The correct
ranking of the levels of the subsidy shows that the millers correctly understood the presentation of
the levels of subsidy. This result suggests that miller’s indifference among different subsidy levels
found through DCE is not due to lack of understanding but their actual preference.
9. Do the findings from the direct preferences questions differ from the rankings
obtained from the discrete choice experiment?
The results of direct elicitation are generally in line with the results of the choice experiments. The
general attribute importance ordering is, in both cases: Legislation, Marketing, Equipment and
Subsidy (while equipment and subsidy are not very much differentiated in the discrete choice
experiment). An interesting distinction is the consistent ordering of the attribute levels of Subsidy in
the direct elicitation case, whereas when making choices it seemed that millers were not
differentiating between them much.
5.6 Demographics
10. Do any of these results vary depending on the selected personal characteristics
and activities of the miller?
Further analysis did not detect any differences in revealed preferences (i.e. results from the DCE)
between urban and rural millers. Millers who had fortified four in the past, or had been part of a
fortifying program in the past were generally more willing to fortify their flour in both scenarios,
compared to those who had not done so in the past or been part of a program. This refers to the
number of millers who consistently stated they will initiate fortification, regardless of their choices.
Hence familiarity with the fortification process or program does imply more willingness to fortify.

27
SECTION 6: CHALLENGES
6.1 Coordination Challenges
It would not be wrong to say that coordinating with the millers was the prime challenge during this
project. The main reason for this was a lack of survey culture in the industrial landscape of Pakistan
Secondly, due to a lack of centralized authority it was an uphill task to coordinate in 18 districts. In
Punjab and Balochistan, contacts of most of the DFCs were provided by Mott MacDonald while in
other provinces VTT used different channels for coordination. In house coordination team from
VTT called the millers directly and introduced the survey to them. However, the response was very
low. VTT also approached influential millers to seek their support especially in districts like
Peshawar, Mardan and Hazara region..
6.2 Lack of proper Administrative Structure in Mills
The coordination became even more difficult due to the weak administrative structure or lack
thereof. The entire milling industry faced this issue. Since the mill’s owner is the sole decision maker,
unless he has named a manager, and no one but him could respond to the researchers. The absence
of the owner made it difficult even to arrange an interview. Furthermore, this lack of
departmentalization or structure made the manager come and leave without the proper allocation of
time.
6.3 The complexity of DCE
The complexity of DCE created a feeling of unease among some of the respondents as they had no
experience of such a survey before. The training of the researchers paid off in this regard as they
made sure that the respondent was not annoyed or irritated by the complexity of DCE. At some
mills, our researcher spent extra time to make each miller understand about the nature of the
survey.
6.4 Authority Letter
Lastly, it was noted that in many instances in various regions, the millers were not comfortable in
giving interviews unless the researchers brought an authority letter from the Flour mills association
(FMA) or food authority. VTT had to use its resources (local influential) in this regard to convince
the millers and arrange an interview.

28
SECTION 7: DISCUSSION
The Food Fortification Programme has been appreciated for its design regarding building the millers’ capacity through various incentives so they could play their part in fighting the challenge of nutrition
in Pakistan. It is essential for government and other responsible stakeholders to make millers realize
that they could play an instrumental role in improving overall health of a large population. The
majority of millers considered it a welcome and healthy exercise to communicate their general
concerns to government and international organizations. Lot of suggestion and comments have been
recorded regarding fortification, its potential and challenges. Despite the fact that flour milling
industry is going through challenging times and multiple mills have been closed in recent years across
Pakistan, millers were open to the idea of adopting new practices. They have shown an interest in
what is being offered and they seem to be open to the idea of helping the society in their nutritional
development.
A major concern for the millers was that government must take authority and enforce strict laws
regarding fortification. As demonstrated by the results, the relative importance that Millers placed
on attributes was highly dependent on whether or not the government regulates fortification. Under
the non-regulation scenario, there were no strong ordering preferences and less Millers chose to
initiate fortification consistently. Furthermore, regulation was ranked number one in the direct
preference question. Being the early adopter of the programme can be a risky decision for any mill
owner and that risk can only be minimized when the market is moving in a unison. Moreover, the
millers want the customers to be made aware of the programme and what it aims to do. They want
the general public to understand and realize the importance of fortification because they think that
without it the programme will have a thin chance of success. Under the regulation scenario, the
incentive of free marketing outvalues the other attributes such as equipment and subsidy which
amplifies the importance of marketing.
Perhaps the most valuable outcome of this study is the fact that millers can be offered with a lower
subsidy which will have same influence on the decision of fortifying. Under both scenarios, the
Millers did not differentiate between the subsidy levels – they seemed to “look the same”. We are
confident this is not due to a misunderstanding based on feedback from the pre-testing and the fact
that Millers correctly ranked the subsidy levels in the direct preference question. So instead of
investing in a high subsidy it can be more useful to invest in marketing and offer a lower subsidy. It
can be assumed from findings that subsidy on premix does not directly have any impact on revenue
generation of a respective mill. Considering that millers are specifically business oriented, it’s difficult
to convince them to alter their regular norms of business until an authority comes into play and
demand of fortified flour arises in the market.
Naturally government can play most important role in changing the status quo that prevails among
the millers. Marketing of fortification and raising its urgency among general masses will make the
millers more comfortable while taking any decision regarding fortification. Lowering the subsidy
could also make more budget available to overcome the barriers identified in the Behaviour Change
Scorecard, namely the lack of necessary skills, a lack of peer support and an inability to fit
fortification into current routines. As is often the case when trying to change behaviour, non-
financial incentives and support can be stronger drivers of behaviour than financial incentives alone.
Government involvement and its regulation policies will further validate fortification.
29
Appendix:
Instrument design/ Pre-Pilot Findings and Alterations
The survey instrument was designed and developed by the Common Collective team. The further
changes were, however, suggested by VTT Team to improve the data collection and survey
accuracy. In addition to the standard Pre-test for the study, an initial Pre-Pilot test was conducted in
order to effectively develop the DCE.
On 7th June 2018, VTT Team conducted a survey of three mills to test the DCE part of the survey
instrument. This Pre-Pilot test was conducted in I-9 and I-10 sectors of Islamabad. Although the mills
in Islamabad were already registered with the Food Fortification Programme, the main objective of
the Pre-Pilot test was being fulfilled which was to see the effectiveness of the DCE tool. There were
three flour mills namely: Sunny flour mills, Al-Imran flour mills and Nafees Flour Mills. In the
following discussion, these mills are referred to in the findings as Miller 1, 2 and 3 respectively as
stated above. Answers to the proposed questions are given in Green.
3.2.1 Findings of pre-pilot
Do millers understand what food fortification is?
All the millers were well aware of the concept of fortification.
Do they understand the option of machinery?
The millers could easily comprehend the option of machinery.
Do they understand the option of marketing?
They easily understood the concept but required some further detail regarding the kind of marketing
they were being offered.
Which presentation of subsidy do they prefer? per kg or paisa?
The graphical representation, in Miller 1’s opinion, was a useful tool and he preferred the “per kg” over the ‘paisa’. He was of the view that the graphical representation may not serve the purpose in
backward locations. A contradictory preference was noted in Miller 3, who preferred ‘paisa’ over
‘per kg’. However, Miller 2 was confident about the viability of the graphical representation all over
Pakistan.

30
When thinking about subsidy, did millers try to figure out how much they will have to pay out
of their pocket? What was that their first reaction to the subsidy? [Umar: The reason for this
question is that at the moment we are informing millers how much the subsidy is (either in
per kg form or paisa form). It is possible that millers are actually interested in knowing the
differential that they have to pay which we are not telling them directly at the moment].
In order to calculate the amount that the miller will have to spend from his own pocket, one of the
millers calculated the amount. Although this amount was only calculated when the miller was
presented with the statement stating the subsidy and price in the form of paisas and not the rupees
per kg form.
Do they understand the subsidy?
All three millers understood the term of subsidy and the concept of subsidizing.
3.2.2 Outcome
The DCE tool was considered to be very easily understandable and the graphical representation was
added after considering the observations taken from the pre-pilot test. The biggest change that had
to be made after the Pre-Pilot test was in terms of rephrasing the statements explaining the levels of
subsidy. The survey required the most easily comprehensible statements and the representation in

31
terms of the price of a 20 kg bag seemed like the best way to do it. The changes in the DCE were
incorporated by the Common Collective while the translation of the changed statements was
undertaken by VTT. Moreover, the details regarding the option of marketing were discussed with
Mott MacDonald and were incorporated into the DCE tool after the approval of the client and the
required changes were made.
3.3 Pilot Findings
A pilot was conducted on 22nd June 2018, which was also a hands-on training for the hired
resources. The team had a successful experience of conducting interviews in 5 flour mills from
Mandi-Bahauddin, which were selected by Mott MacDonald. The table below shows the names and
corresponding information of the interviewed mills:
Flour Mill Name Owner/ Manager Contact Number Status
Hassan and Shahzad Flour Mill
Awais 0344 6551658 Surveyed
Arshad Flour Mill M. Arif 0321 6463180 Surveyed
Topa Flour Mill Syed Nayyar Abbas Referred Mr. Arif Surveyed
Miran GK Flour Mill Javaid Referred by Mr. Arif Rejected
Raja Flour Mill Mudassir Nadeem 0342 6652097 Surveyed
Baba Flour Mill Arsalan Referred by Mr. Mudassir Surveyed
The following lists the findings and observations of the pilot:
I. A low response rate was noticed and a reluctance of millers in terms of giving interviews
was clearly noticeable.
II. Communication with the millers in order to arrange the interview was the key, not just
message but the mode of communication. as well as telephone calls for an appointment,
were noticed to result in a premature rejection.
III. Having the right contact for arranging the interviews was required
IV. Repetition of concepts and sequence of behavioural scorecard was a source of irritation for
the respondents.
V. Some statements seemed unnecessary as they were a further expansion of the previous
ideas. They could be incorporated into the single statement.
VI. There appeared to be a lack of awareness and perception among the millers regarding
fortification, premix subsidy, marketing and machinery.
VII. A few questions were asked by the millers regarding the concepts that confused them:
To whom will the millers pay the maintenance cost for the equipment of PKR 30,450/- ?
What are the exact ingredients of the premix?
Why is the premix added? The exact rationale for fortification has to be answered in a
convincing manner.
The millers thought that the asking price of a micro feeder was too high, therefore
unacceptable for them. In their opinion, a micro-feeder costs a lot less than what was
being asked.
Can premix be harmful?

32
3.3.1 Outcome
The Observations from the pilot were discussed with Mott MacDonald. Beginning with the issue of
the low response rate, the first suggestion was to engage a local influential miller from the respective
target district and ask him to bring other millers on board to participate in this study. It was also
proposed that some non-financial incentives could be offered to compensate for the time that the
millers would take out of their busy schedule. Mott MacDonald agreed to provide promotional items
including note pads and pens and bags from FFP.
When discussing the communication strategy, it was suggested that the letter from PFMA could be
instrumental in this regard. The necessity to consult relevant departments such as the District Food
Control Authority, Local Flour Mills Association, or Chamber of Commerce was stressed due to
their influence on the millers. Another solution suggested was conducting a workshop for the flour
mill owners. Mott MacDonald (FFP) supported VTT continuously in the field and took relevant
influencers from the targeted districts (Like Muhammad Arif at Mandi Buhaudin whose contact was
provided by Mott MacDonald to assist during the pilot. He was a local mill owner and an influential
person in the area onboard that assisted the field researchers in surveying millers. The repetitive
statements in the behavioural scorecard were taken care of by the VTT Team and the issue was
resolved by rearranging the statements in the preferred order and by also removing a few redundant
statements.
When it came to the awareness and perception of the millers, Mott MacDonald provided answers to
the questions received by interviewers and also provided written notes which were used as a
support tool for explaining the concepts such as the explanation of the FFP and the terms used in
incentive packages and the contents of the premix.

33
Annexures:
Survey Information Sheet.xlsx
34