Embed Size (px)
DESCRIPTION
VT Law Eco-Econ June 17, 2005 Gary Flomenhoft http://www.uvm.edu/~gflomenh/ VTLAW-EcoEcon/ /. - PowerPoint PPT Presentation
Citation preview
VT Law Eco-EconJune 17, 2005
Gary Flomenhofthttp://www.uvm.edu/~gflomenh/VTLAW-EcoEcon//
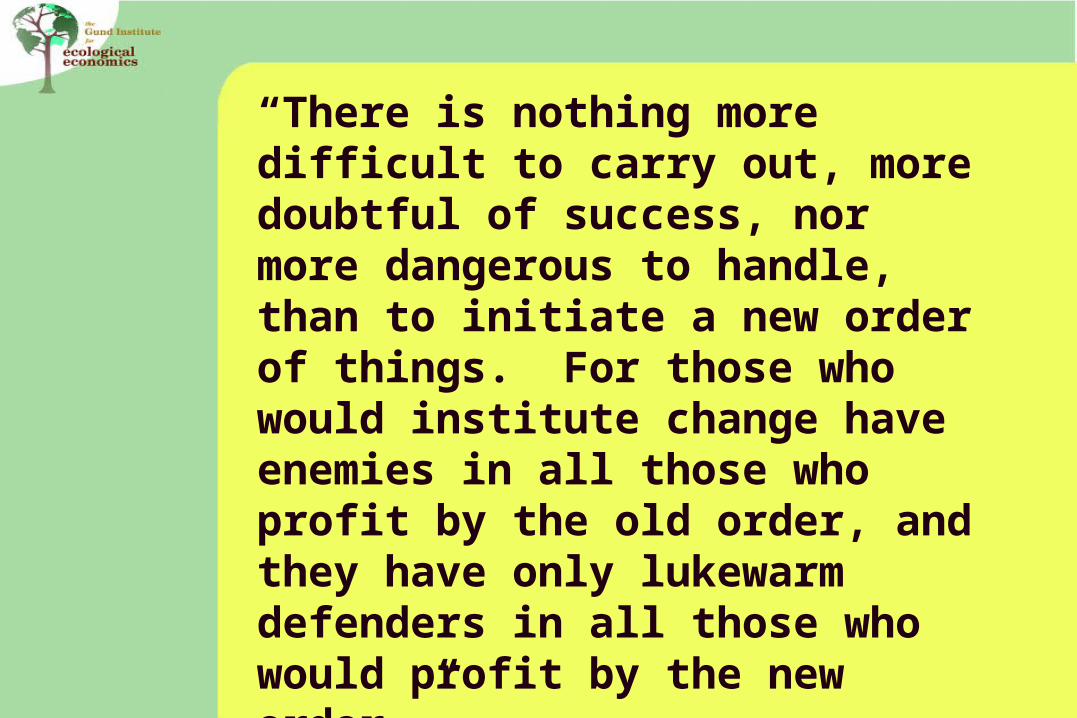
“There is nothing more difficult to carry out, more doubtful of success, nor more dangerous to handle, than to initiate a new order of things. For those who would institute change have enemies in all those who profit by the old order, and they have only lukewarm defenders in all those who would profit by the new order.”
Nicolo Machiavelli, 1490
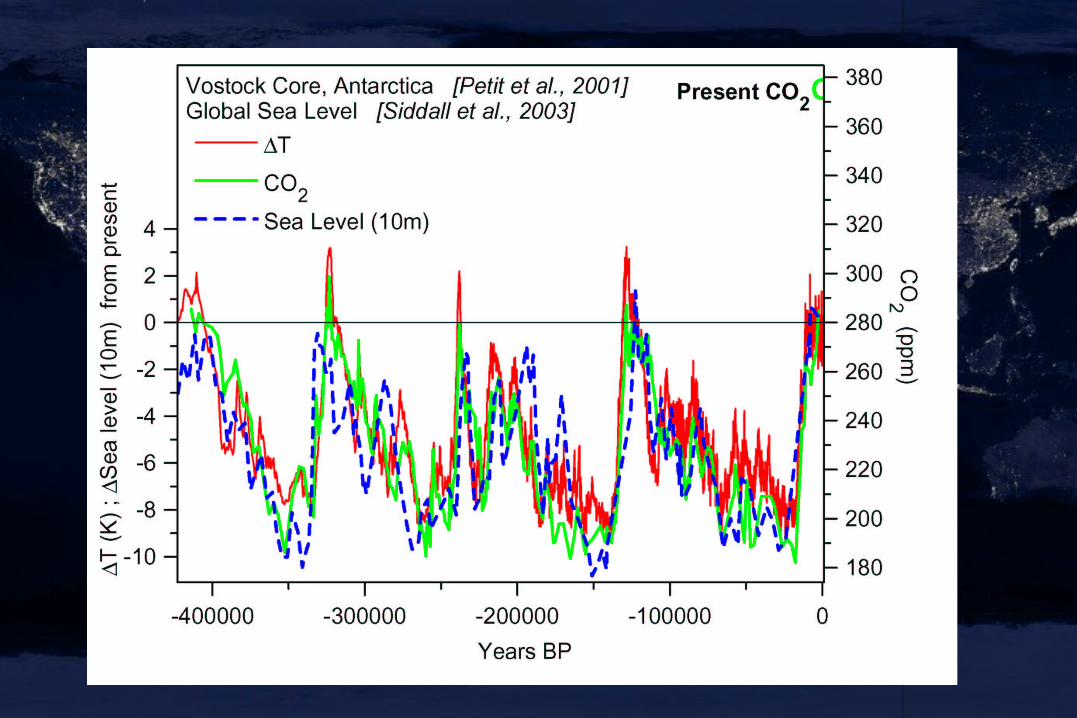
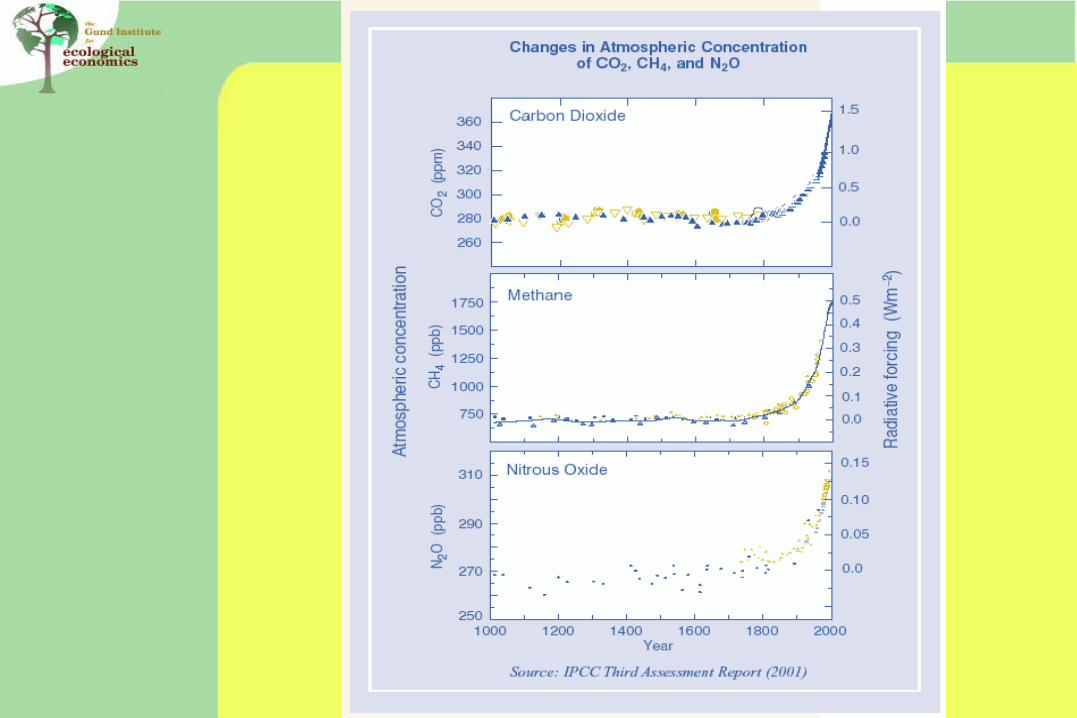
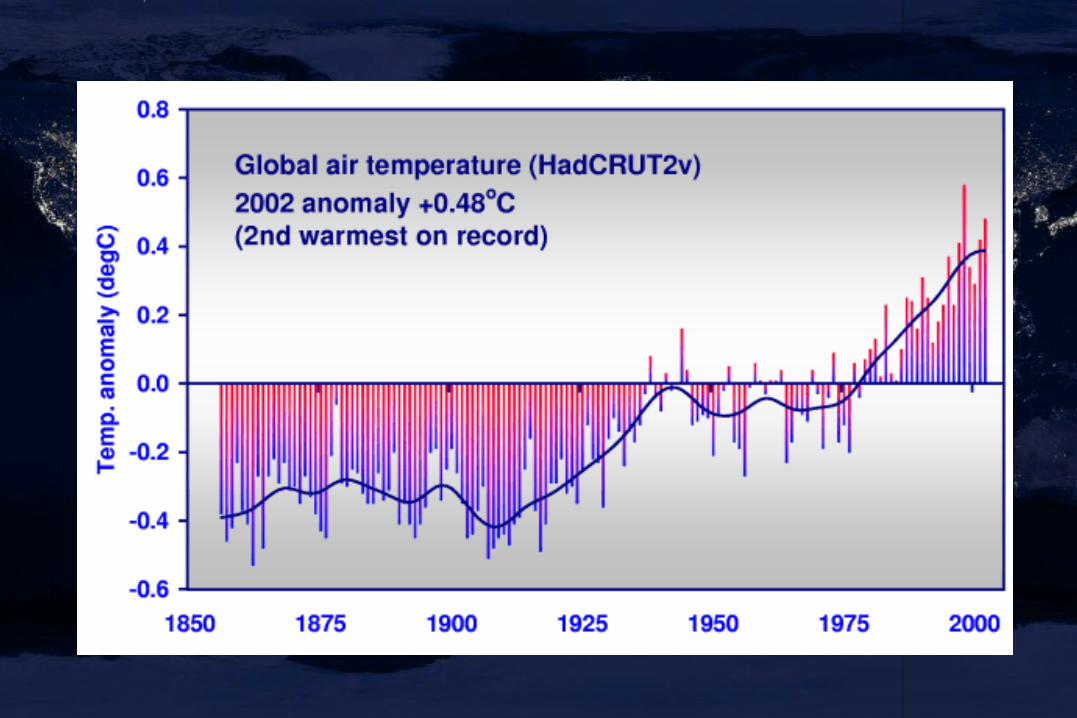
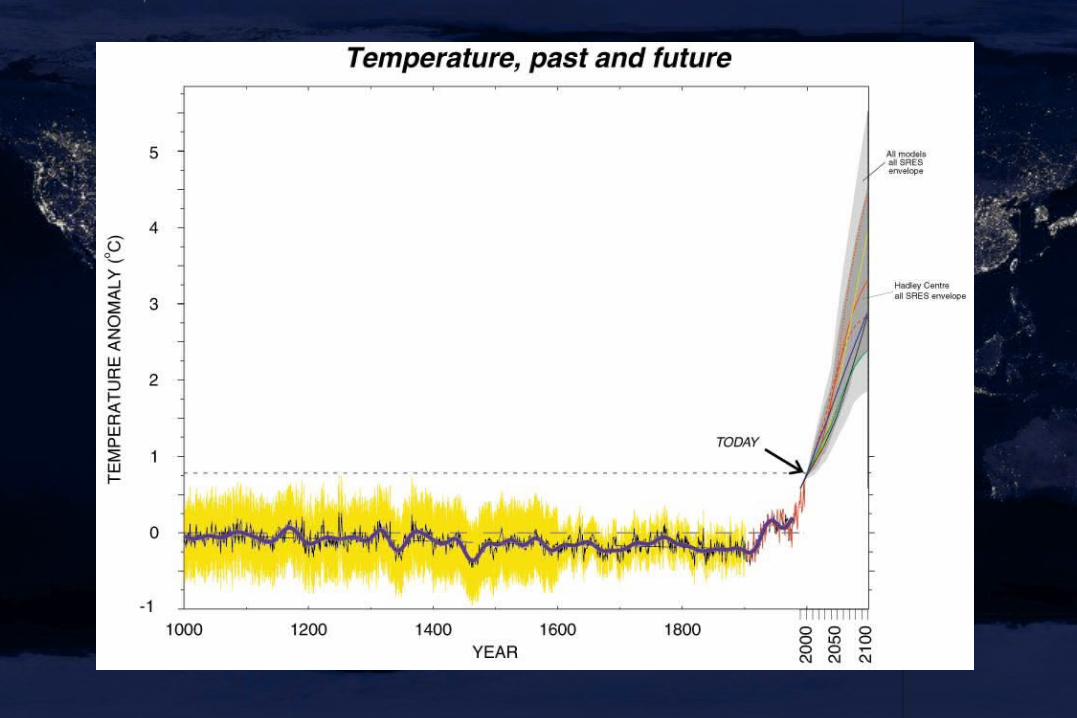
Climate ChangeSummary of Facts
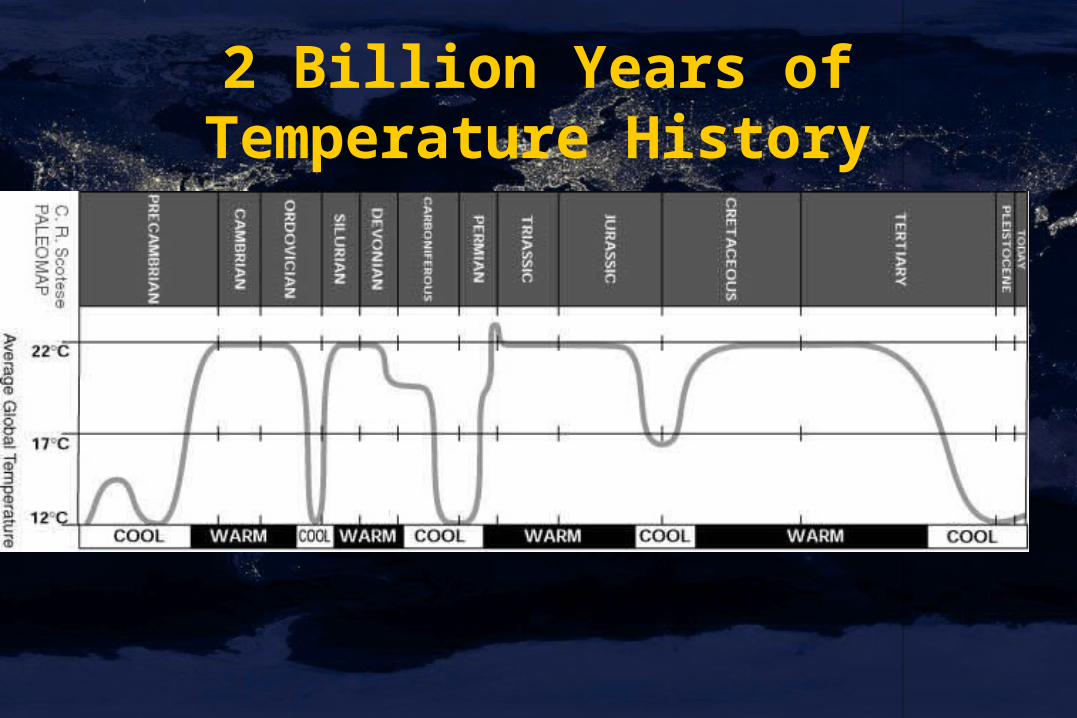
2 Billion Years of Temperature History
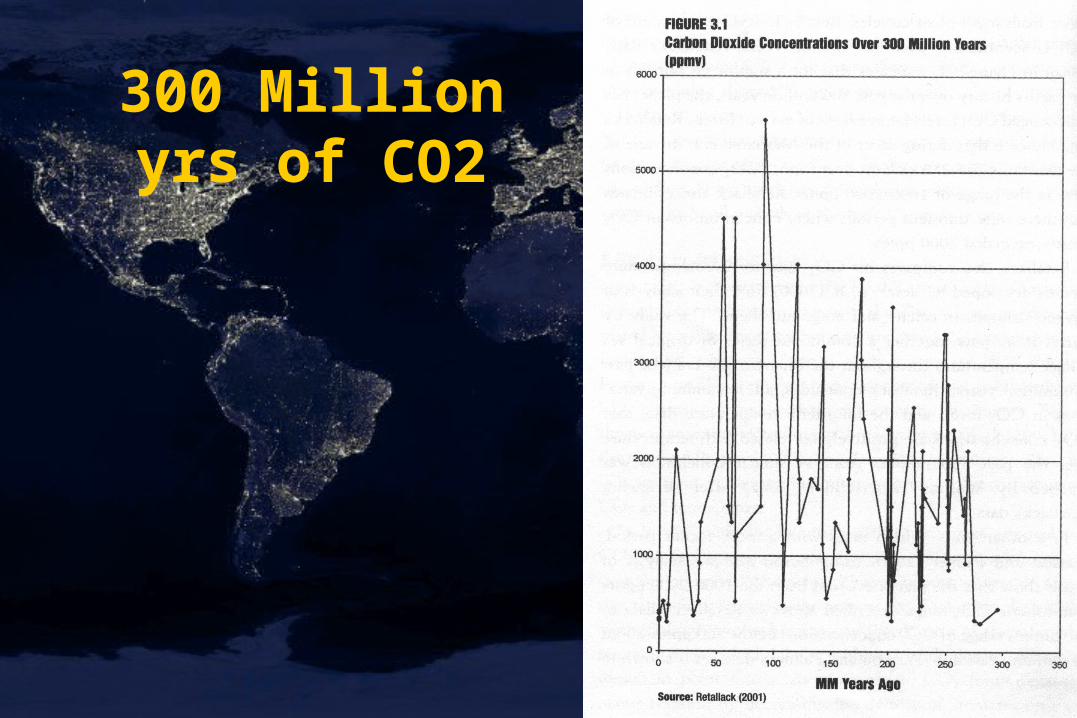
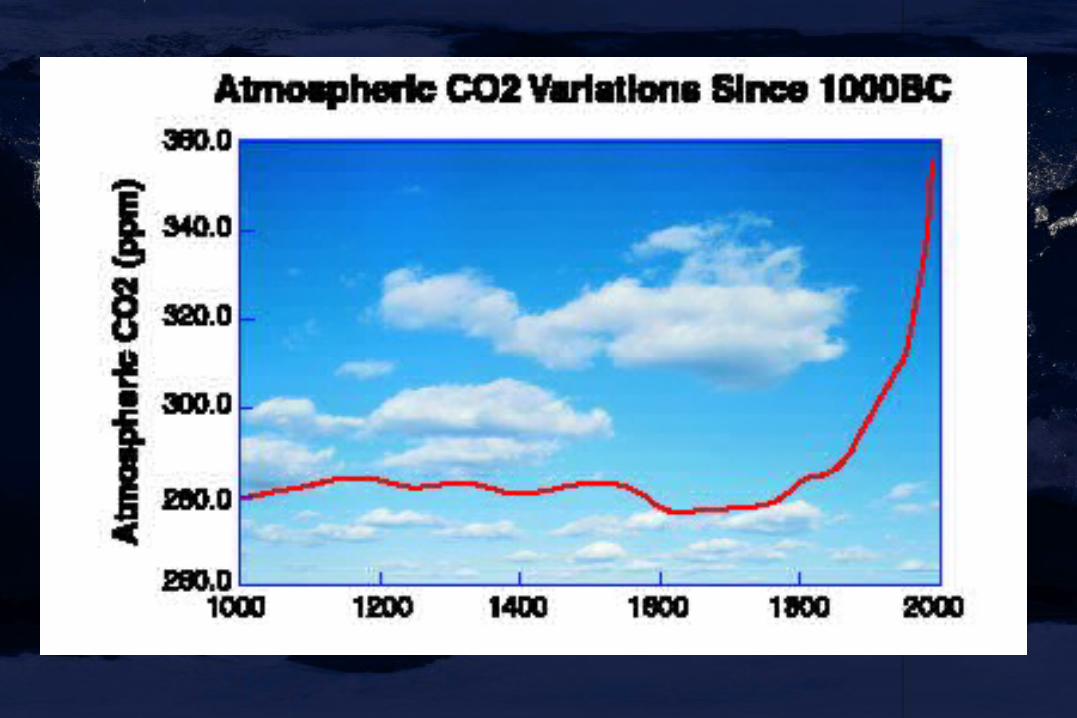
300 Million yrs of CO2
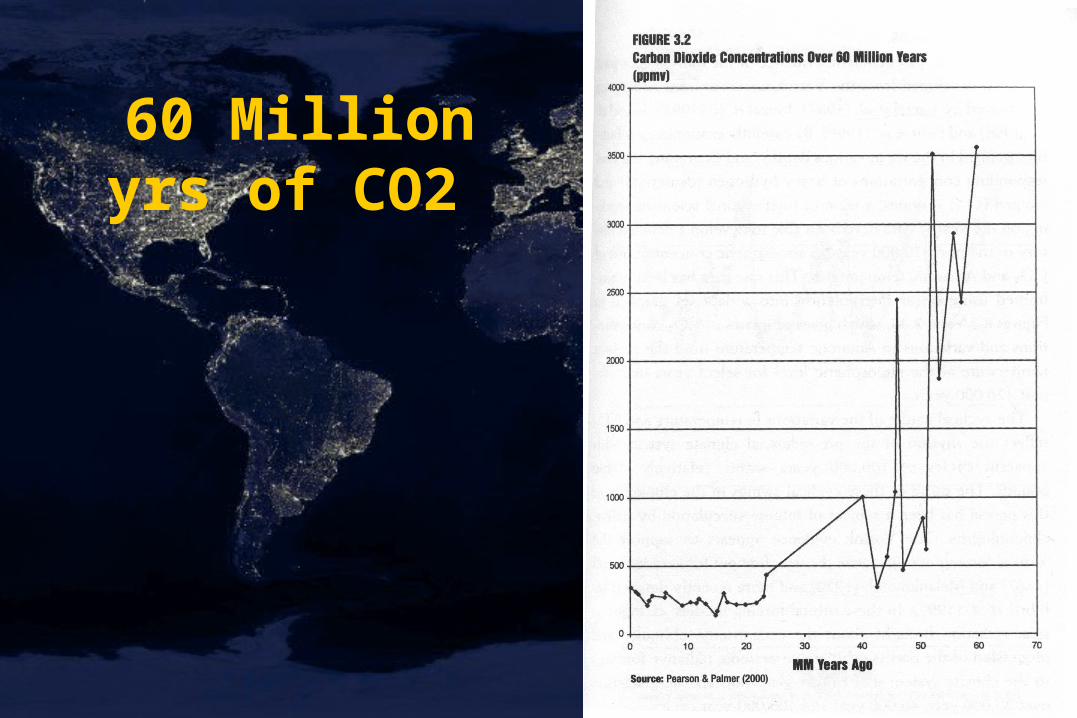
60 Million yrs of CO2

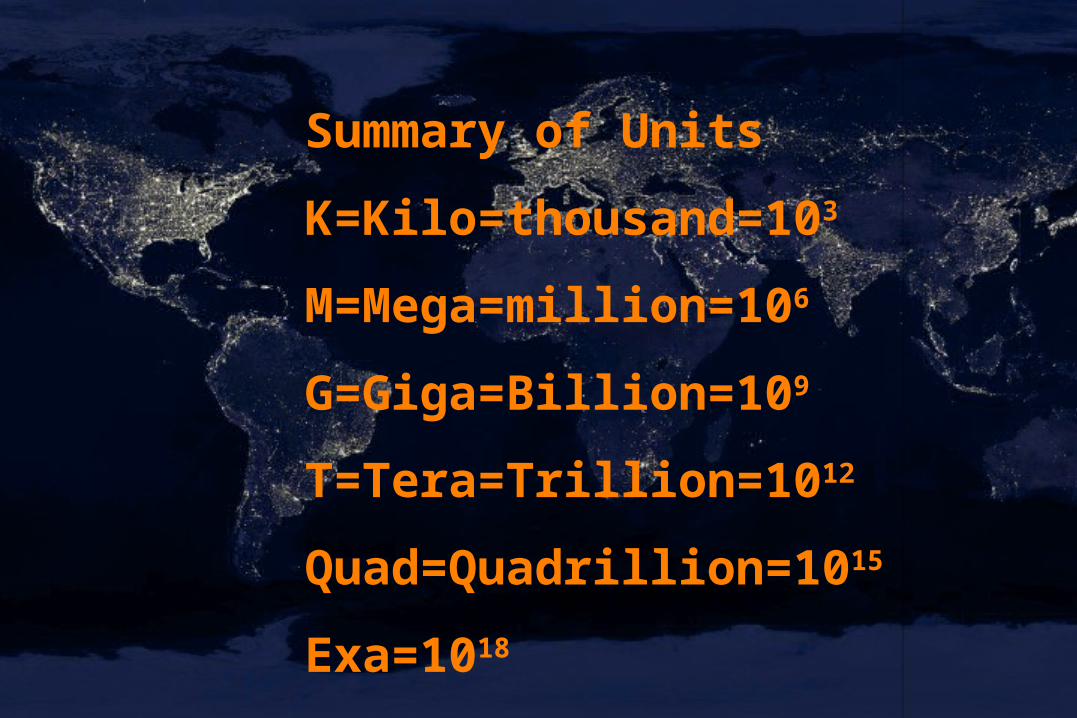
Summary of Units
K=Kilo=thousand=103
M=Mega=million=106
G=Giga=Billion=109
T=Tera=Trillion=1012
Quad=Quadrillion=1015
Exa=1018
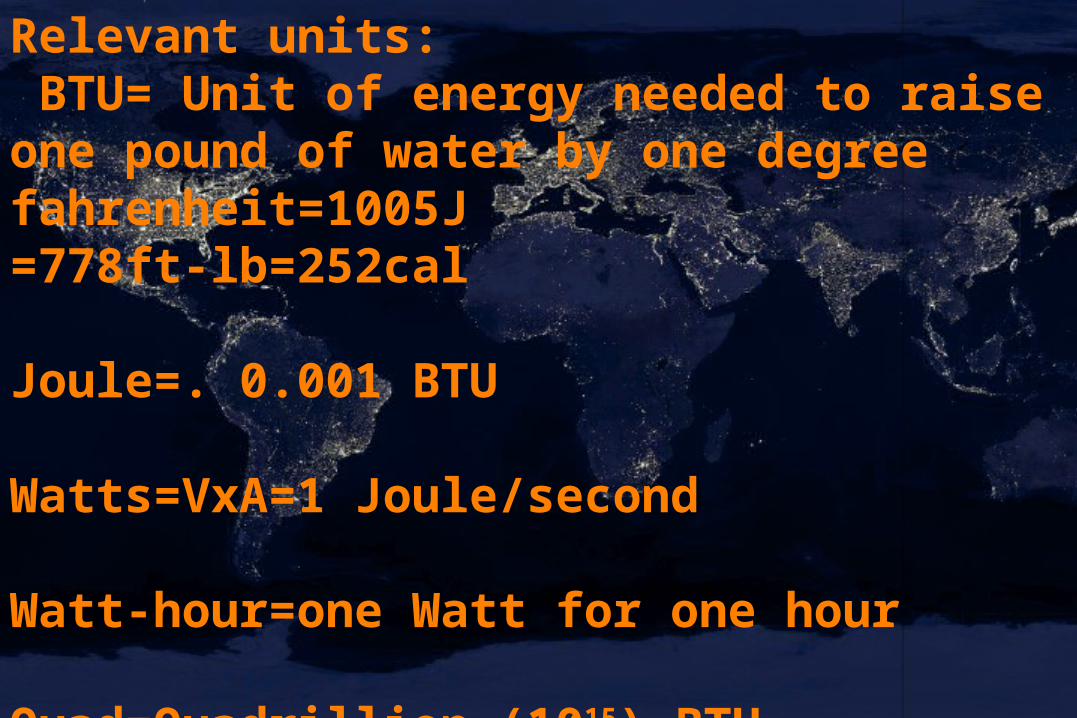
Relevant units: BTU= Unit of energy needed to raise one pound of water by one degree fahrenheit=1005J=778ft-lb=252cal
Joule=. 0.001 BTU
Watts=VxA=1 Joule/second
Watt-hour=one Watt for one hour
Quad=Quadrillion (1015) BTU
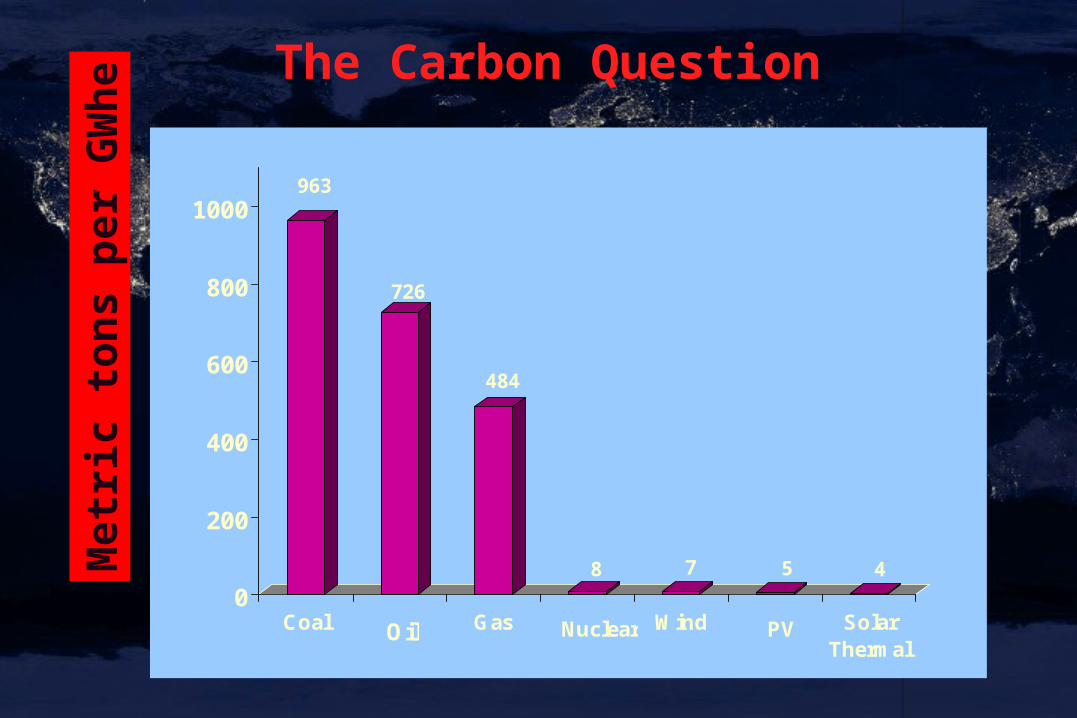
The Carbon Question
963
726
484
8 7 5 4
0
200
400
600
800
1000
Coal Gas Wind SolarThermal
Oil Nuclear PV
Met
ric
ton
s p
er G
Wh
e
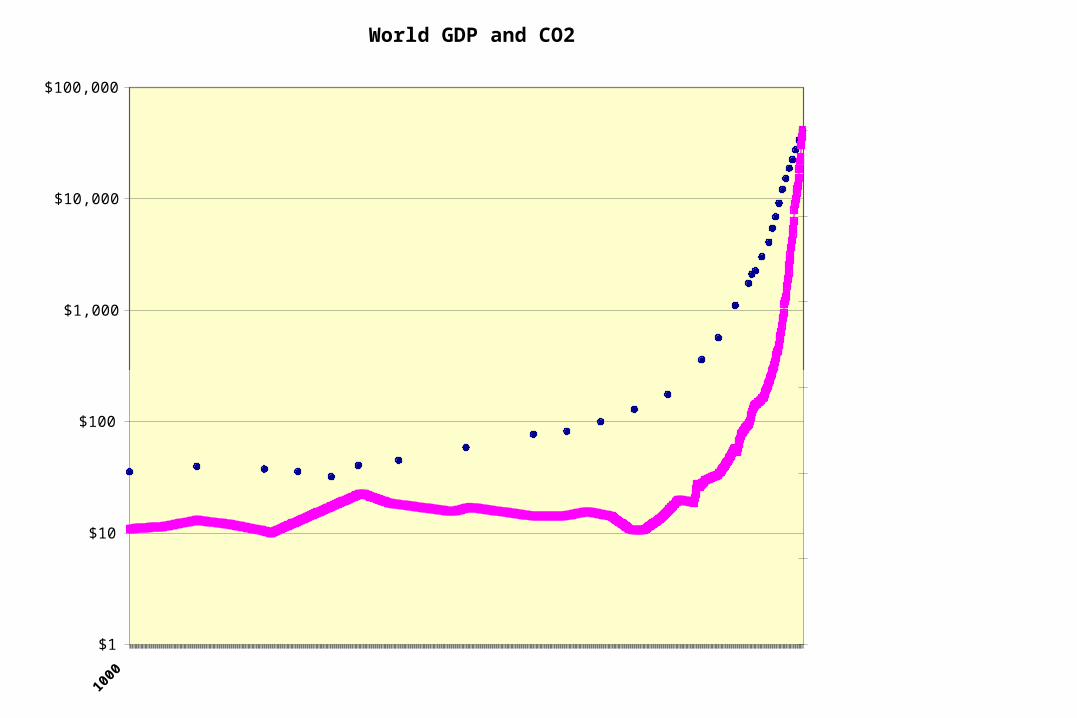
World GDP and CO2
$1
$10
$100
$1,000
$10,000
$100,000
1000
0
25
50
75
100
1800 1825 1850 1875 1900 1925 1950 1975 2000
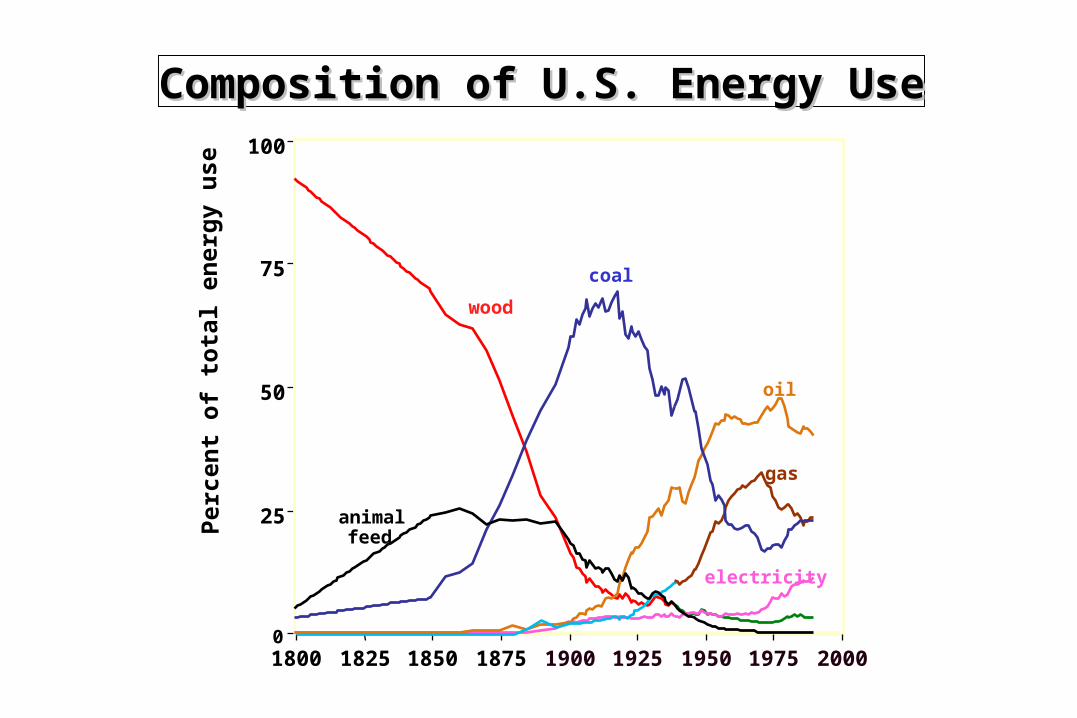
Composition of U.S. Energy UseComposition of U.S. Energy Use
wood
animal feed
coal
oil
gas
electricity
Per
cen
t o
f to
tal
ener
gy
use
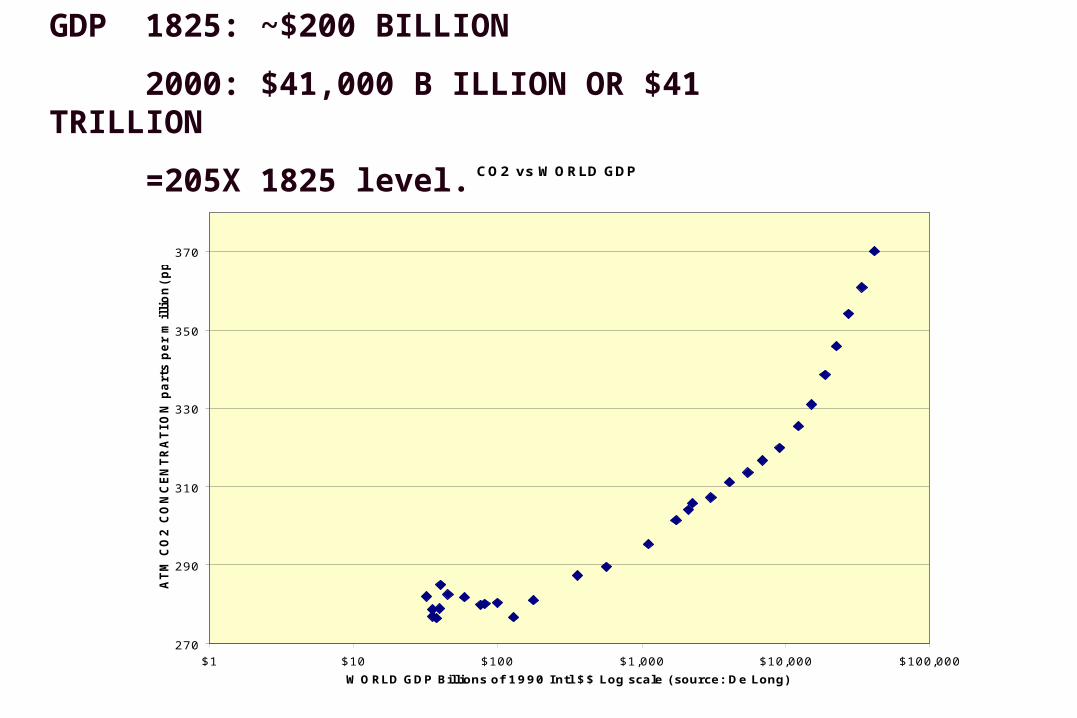
CO2 vs WORLD GDP
270
290
310
330
350
370
$1 $10 $100 $1,000 $10,000 $100,000
WORLD GDP Billions of 1990 Intl $$ Log scale (source: De Long)
ATM
CO
2 C
ON
CEN
TR
ATIO
N p
art
s p
er
million
(ppm
)
GDP 1825: ~$200 BILLION
2000: $41,000 B ILLION OR $41 TRILLION
=205X 1825 level.
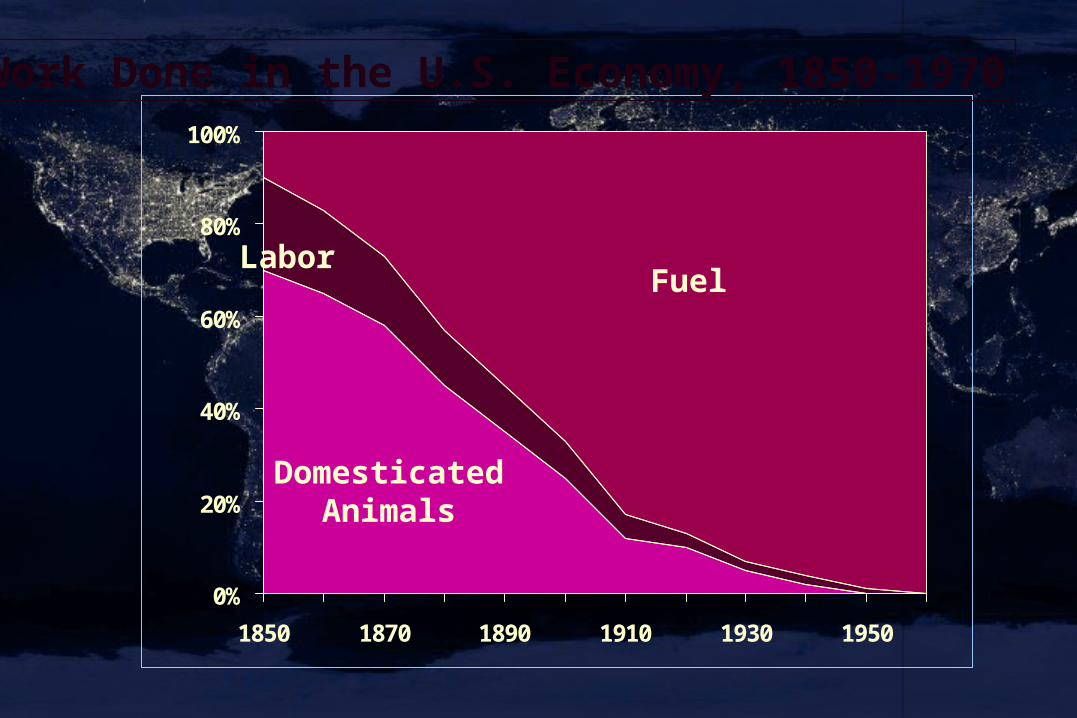
0%
20%
40%
60%
80%
100%
1850 1870 1890 1910 1930 1950
Fuel
DomesticatedAnimals
Labor
Work Done in the U.S. Economy, 1850-1970
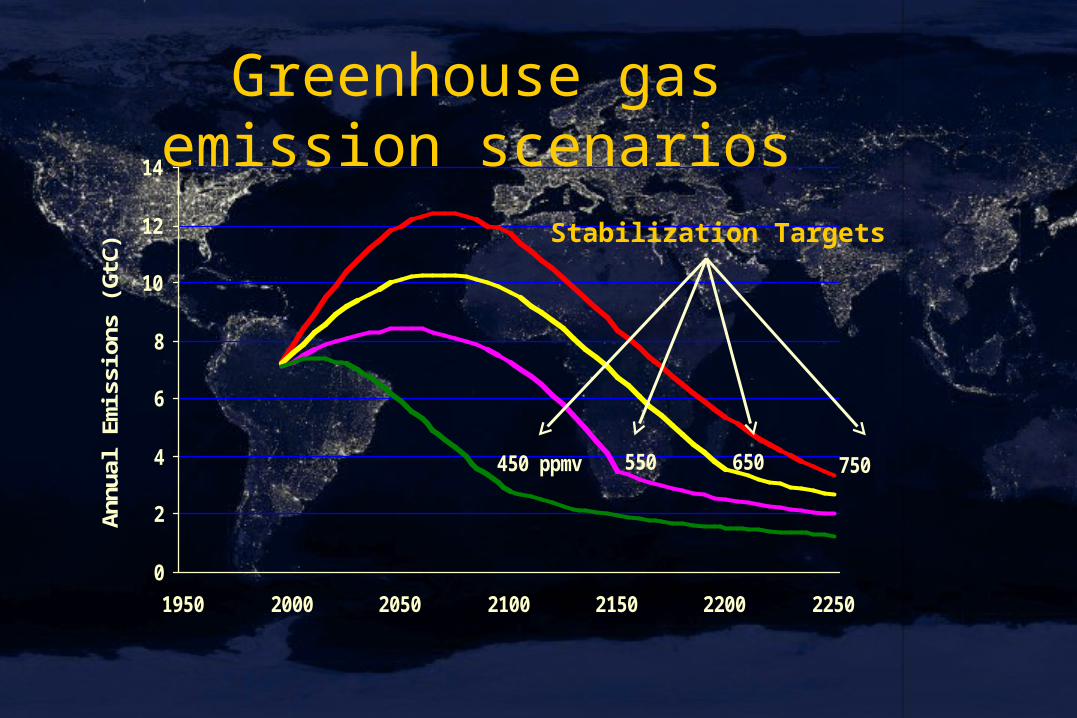
750650550450 ppmv
0
2
4
6
8
10
12
14
1950 2000 2050 2100 2150 2200 2250
Ann
ual E
mis
sion
s (G
tC)
Stabilization Targets
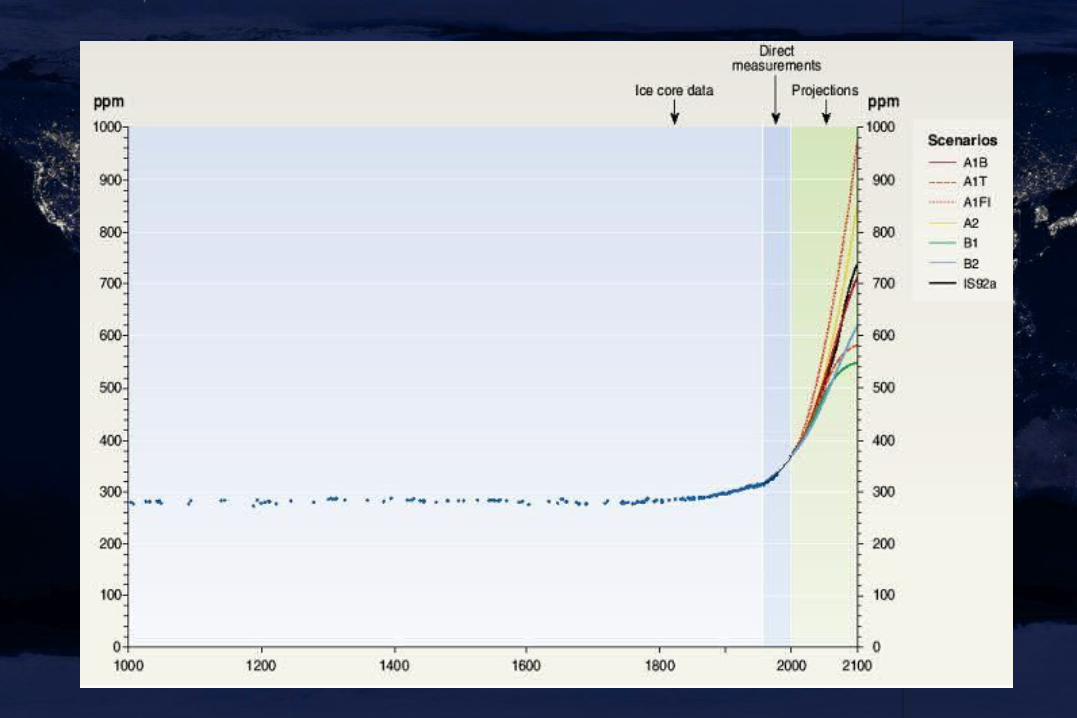
Greenhouse gas emission scenarios
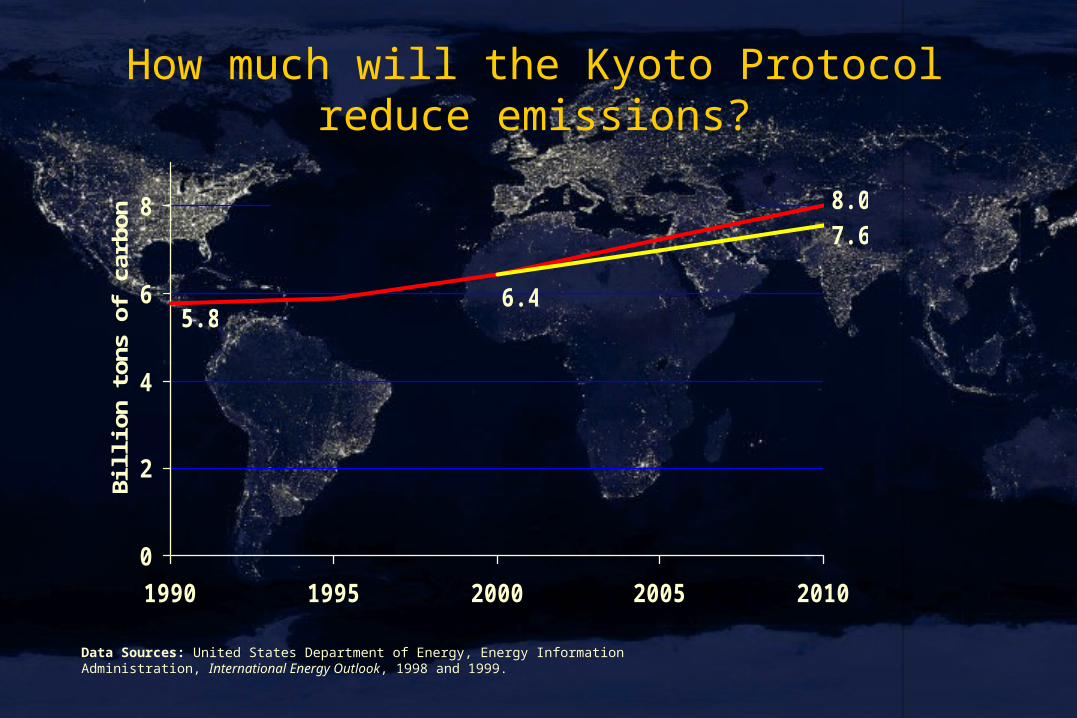
Data Sources: United States Department of Energy, Energy Information Administration, International Energy Outlook, 1998 and 1999.
How much will the Kyoto Protocol reduce emissions?
8.0
5.8
7.6
6.4
0
2
4
6
8
1990 1995 2000 2005 2010
Bill
ion
tons
of
carb
on
Data Source: Marland et al, 1999. Carbon Dioxide Information Analysis Center.
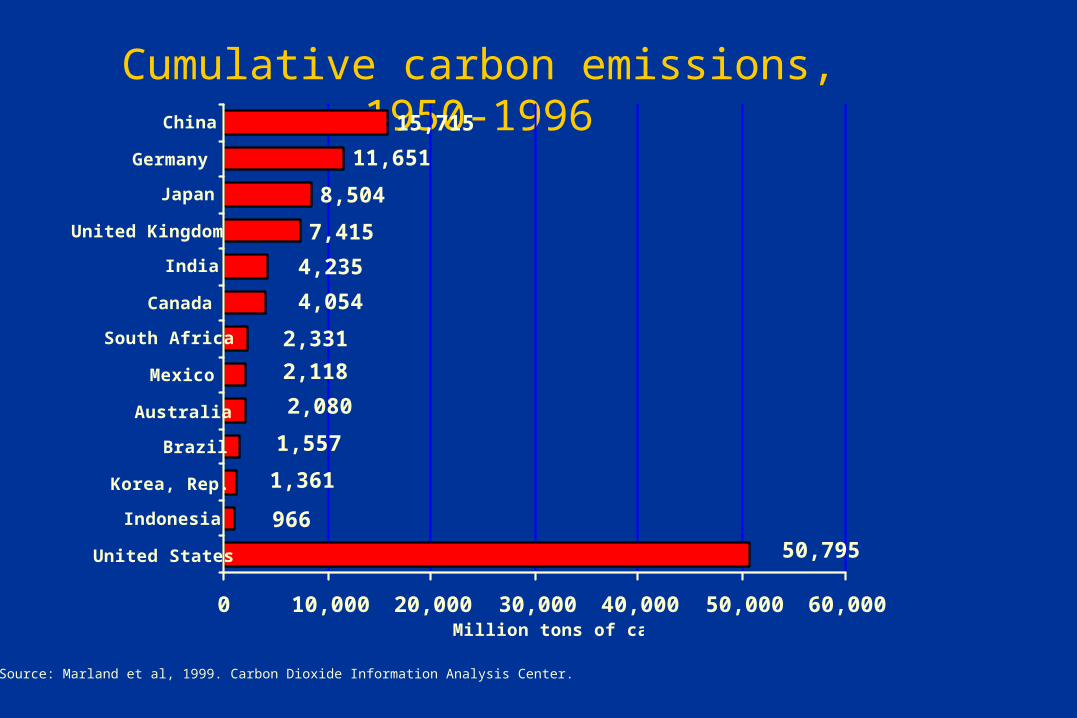
Cumulative carbon emissions, 1950-1996
7,415
8,504
11,651
15,715
4,235
4,054
2,331
1,361
96650,795
1,557
2,080
2,118
0 10,000 20,000 30,000 40,000 50,000 60,000
United States
Indonesia
Korea, Rep.
Brazil
Australia
Mexico
South Africa
Canada
India
United Kingdom
Japan
Germany
China
Million tons of carbon
Data Source: Marland et al, 1999. Carbon Dioxide Information Analysis Center.
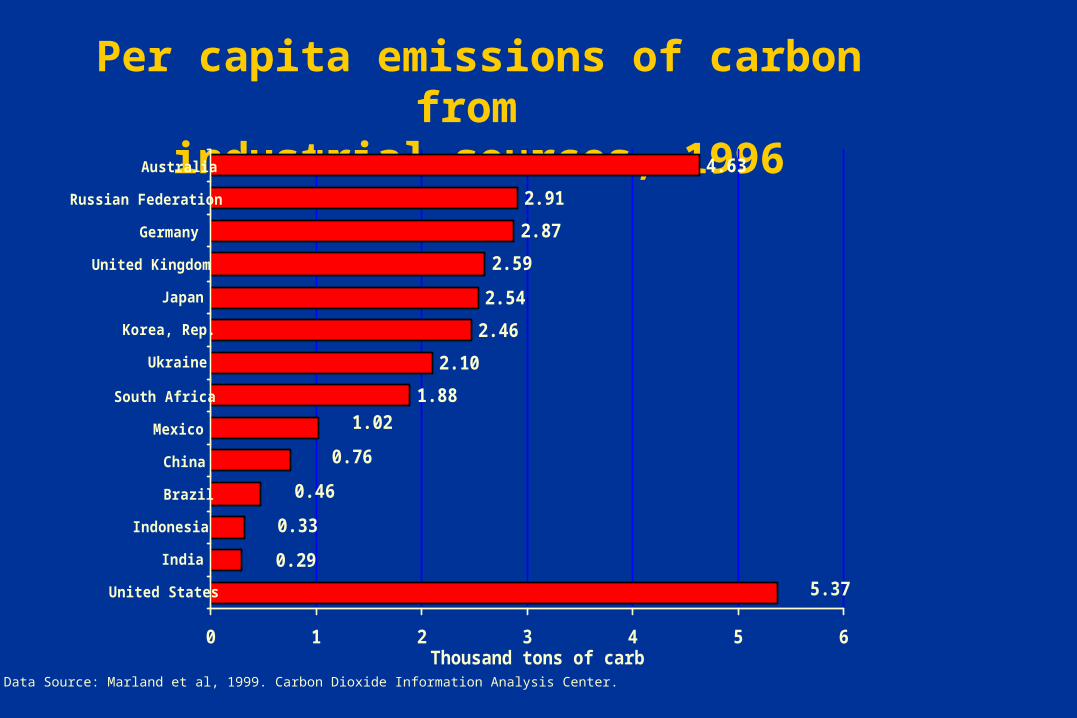
Per capita emissions of carbon from industrial sources, 1996
1.88
2.10
2.46
2.54
2.59
2.87
2.91
4.63
0.33
0.29
5.37
0.46
0.76
1.02
0 1 2 3 4 5 6
United States
India
Indonesia
Brazil
China
Mexico
South Africa
Ukraine
Korea, Rep.
Japan
United Kingdom
Germany
Russian Federation
Australia
Thousand tons of carbon
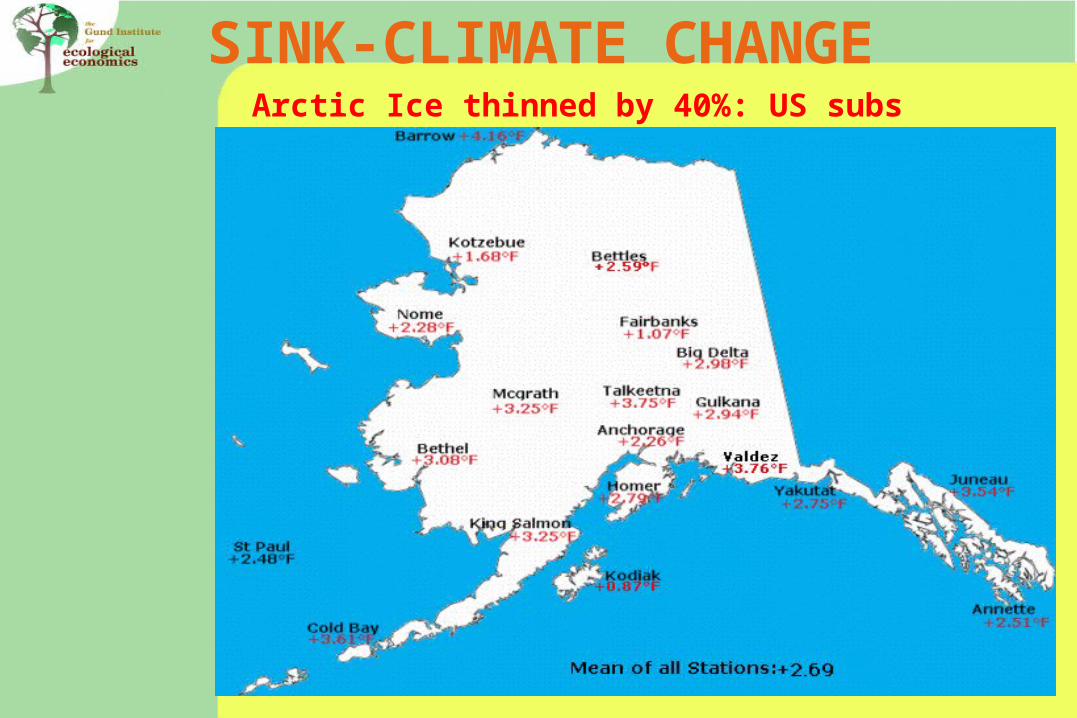
SINK-CLIMATE CHANGEArctic Ice thinned by 40%: US subs
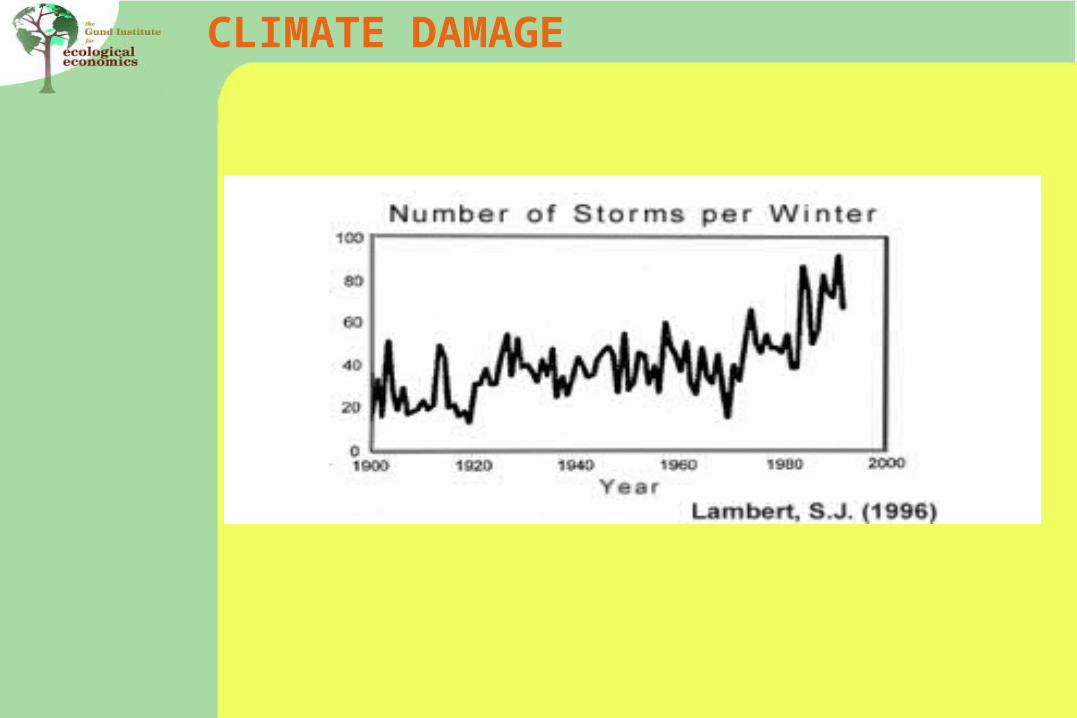
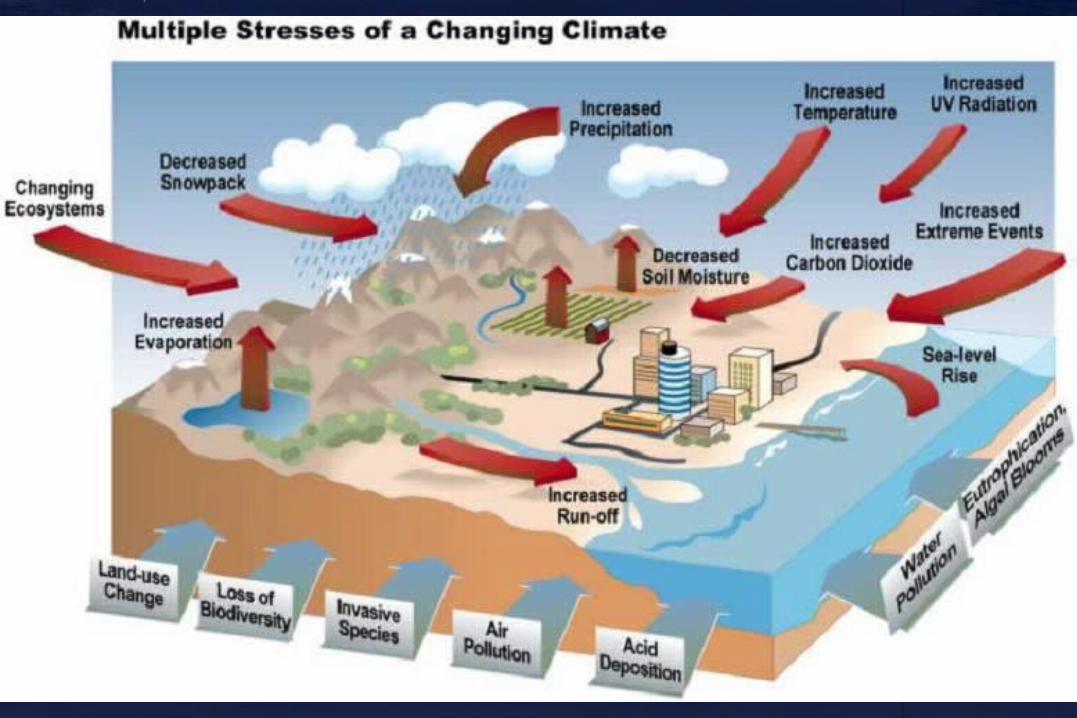
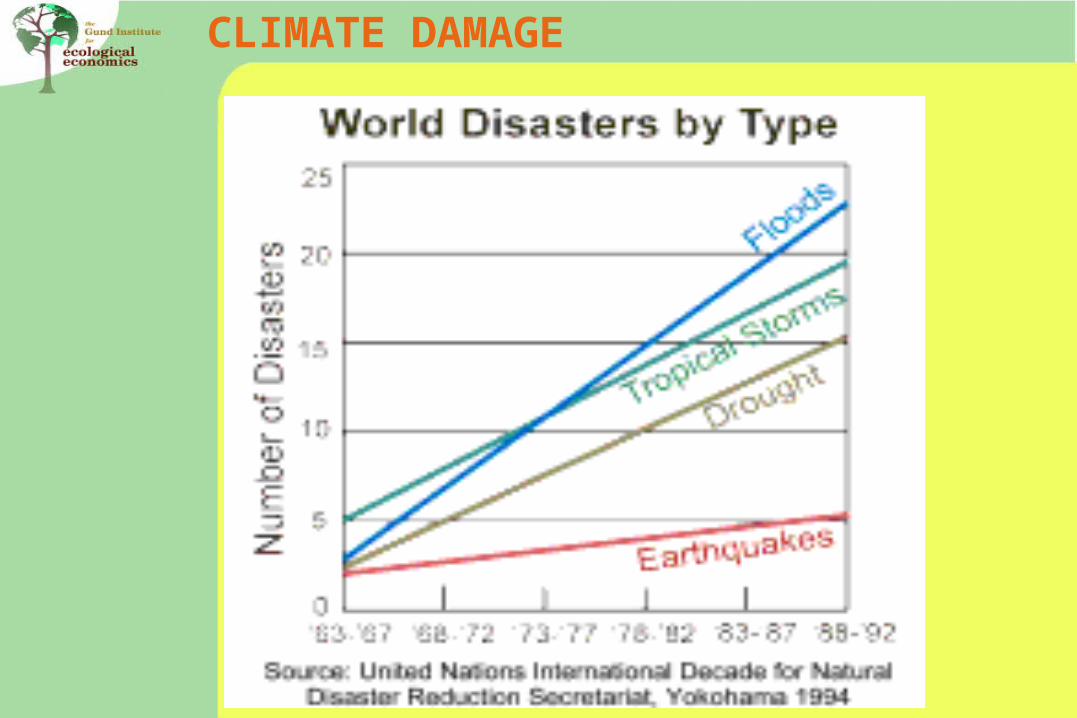
CLIMATE DAMAGE
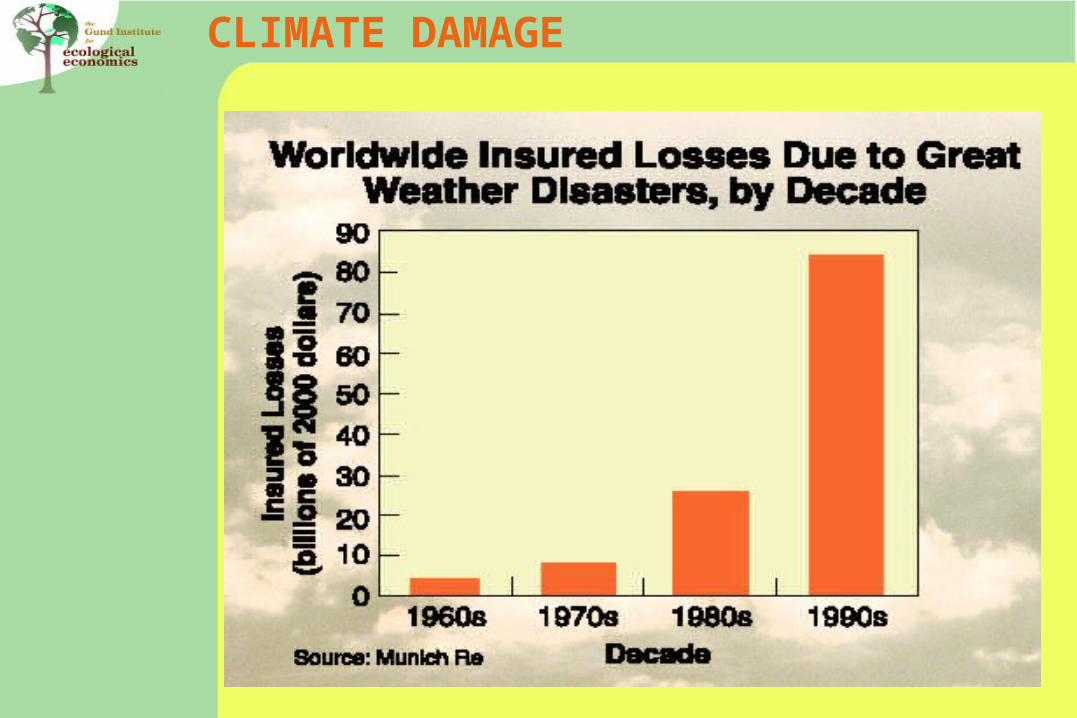
CLIMATE DAMAGE
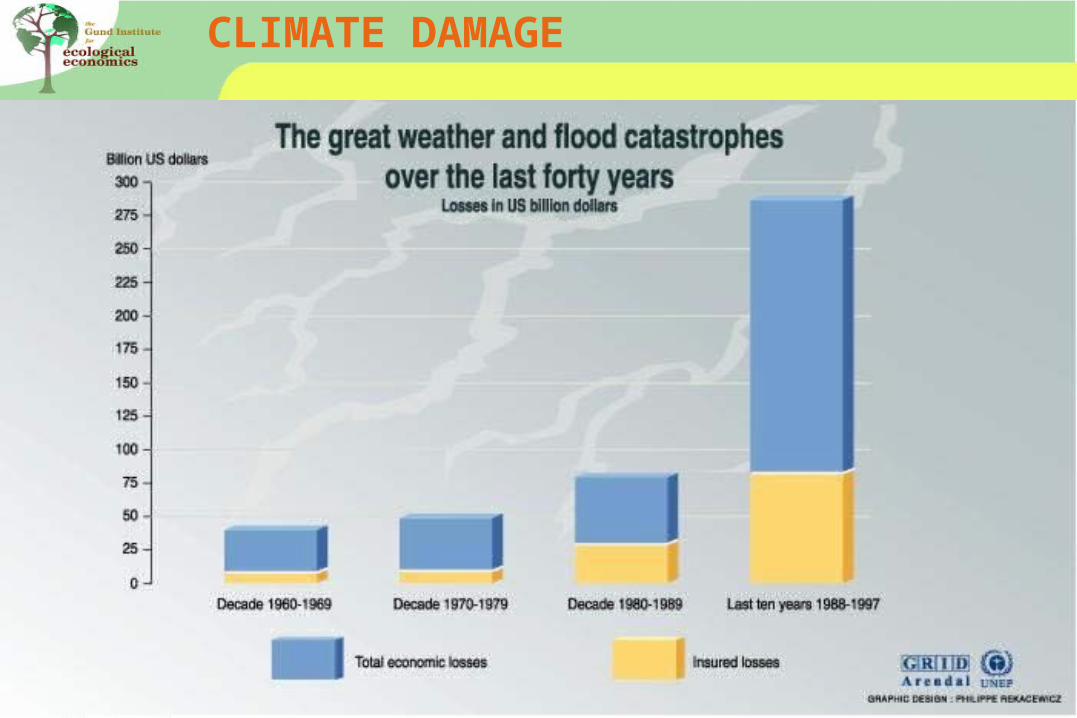
CLIMATE DAMAGE
CLIMATE DAMAGE
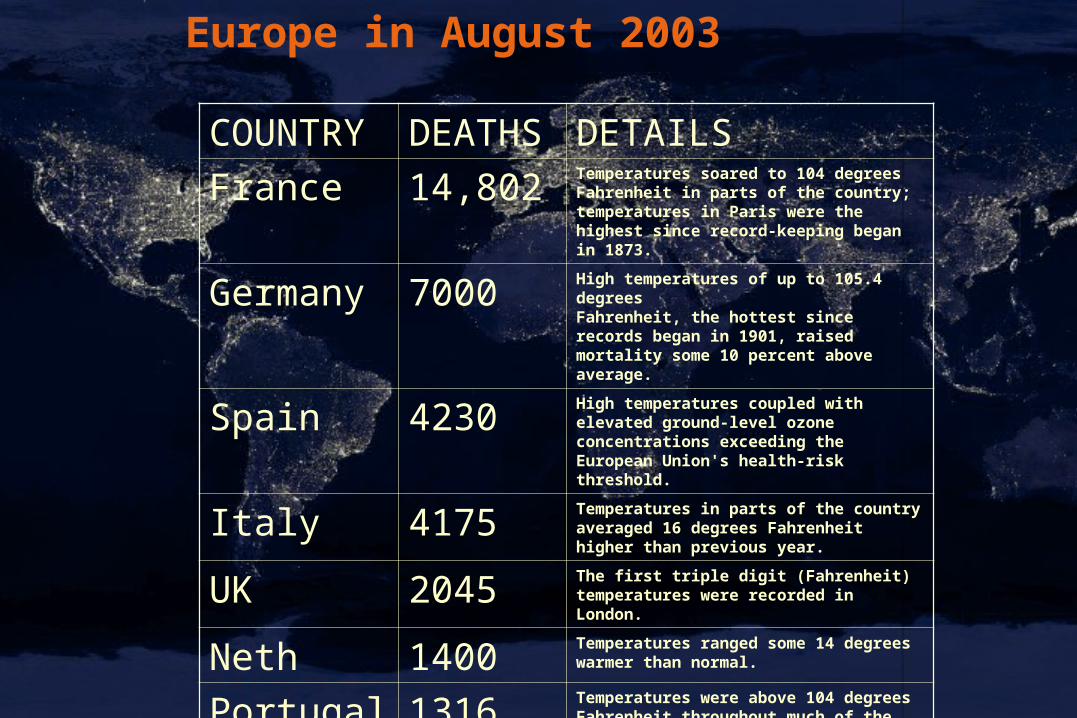
Europe in August 2003
COUNTRY DEATHS DETAILS
France 14,802Temperatures soared to 104 degrees Fahrenheit in parts of the country; temperatures in Paris were the highest since record-keeping began in 1873.
Germany 7000High temperatures of up to 105.4 degreesFahrenheit, the hottest since records began in 1901, raised mortality some 10 percent above average.
Spain 4230High temperatures coupled with elevated ground-level ozone concentrations exceeding the European Union's health-risk threshold.
Italy 4175Temperatures in parts of the country averaged 16 degrees Fahrenheit higher than previous year.
UK 2045The first triple digit (Fahrenheit) temperatures were recorded in London.
Neth 1400Temperatures ranged some 14 degrees warmer than normal.
Portugal 1316Temperatures were above 104 degrees Fahrenheit throughout much of the country.
Belgium 150Temperatures exceeded any in the Royal Meteorological Society's records dating back to 1833.
TOTAL 35,118
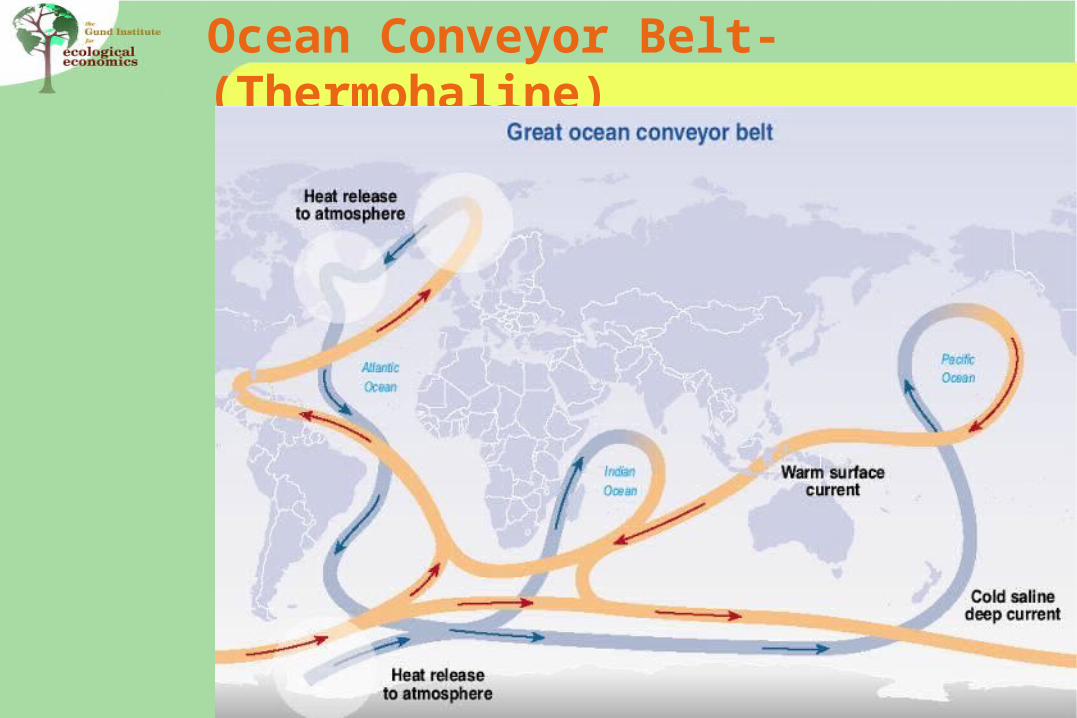
Ocean Conveyor Belt-(Thermohaline)
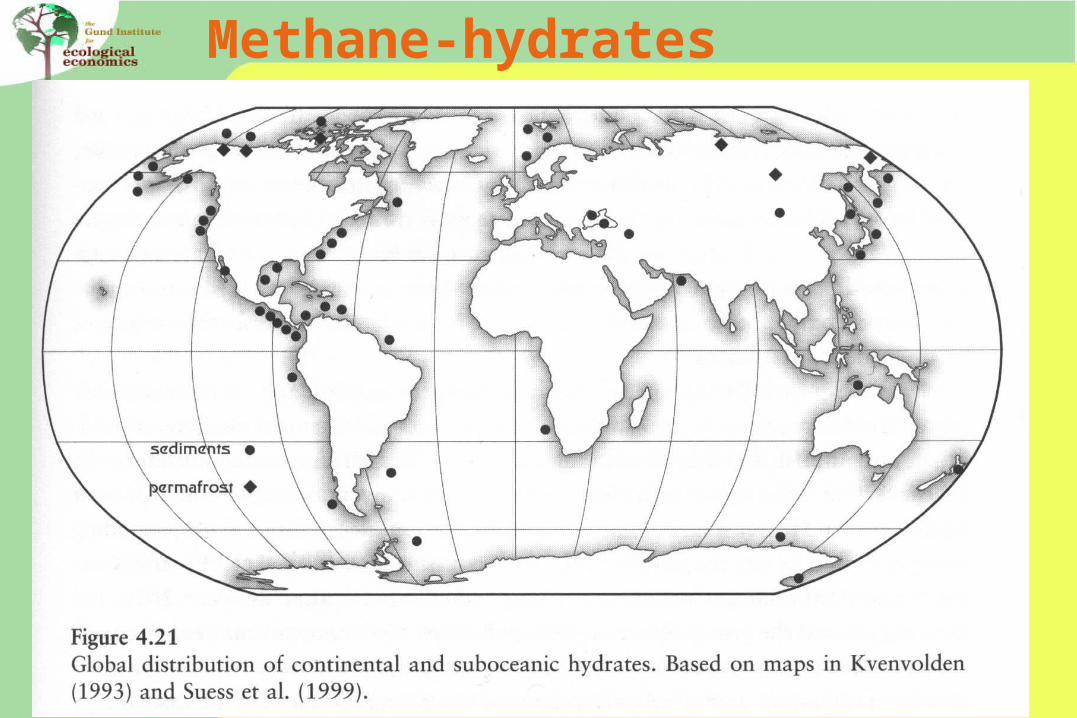
Methane-hydrates
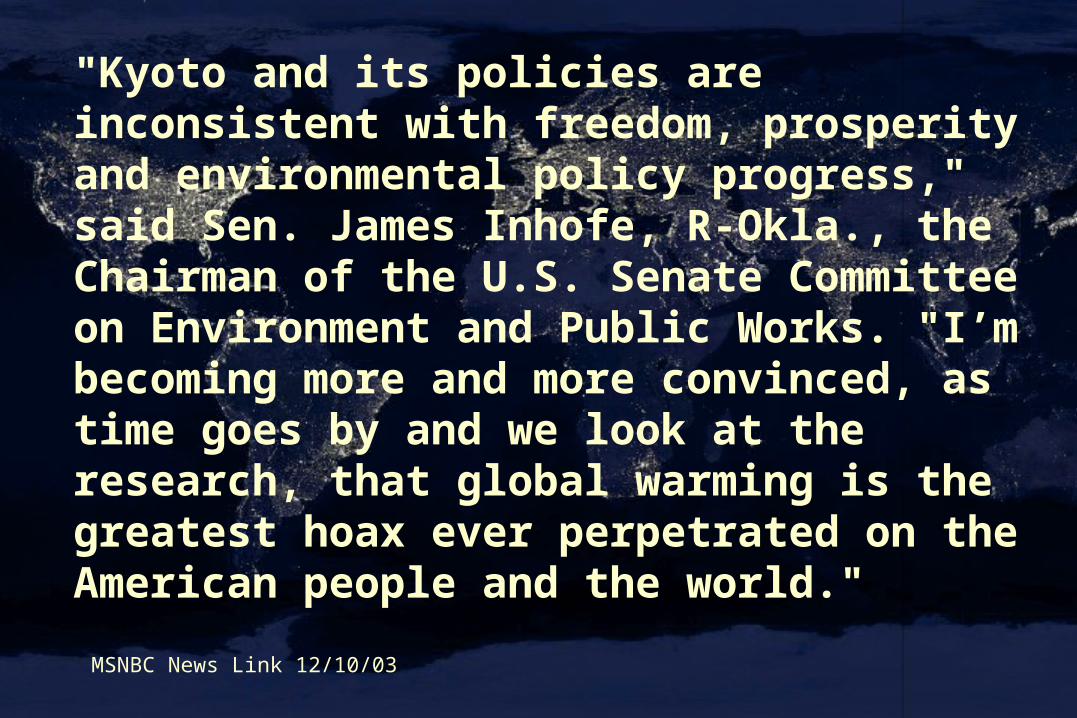
"Kyoto and its policies are inconsistent with freedom, prosperity and environmental policy progress," said Sen. James Inhofe, R-Okla., the Chairman of the U.S. Senate Committee on Environment and Public Works. "I’m becoming more and more convinced, as time goes by and we look at the research, that global warming is the greatest hoax ever perpetrated on the American people and the world."
MSNBC News Link 12/10/03
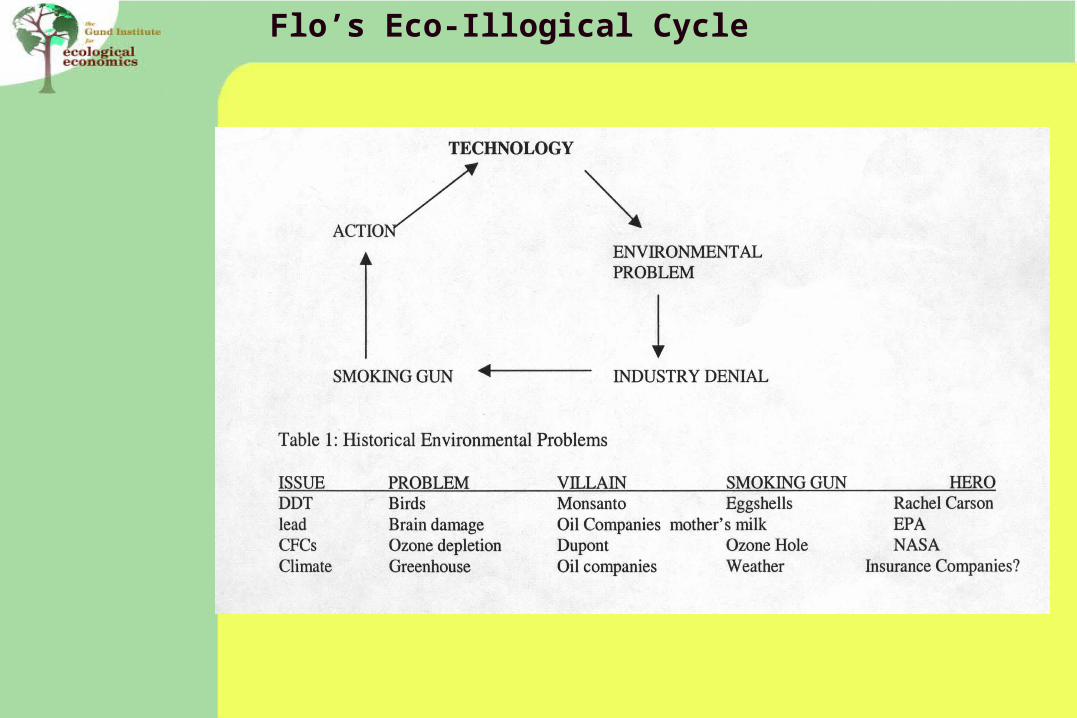
Flo’s Eco-Illogical Cycle
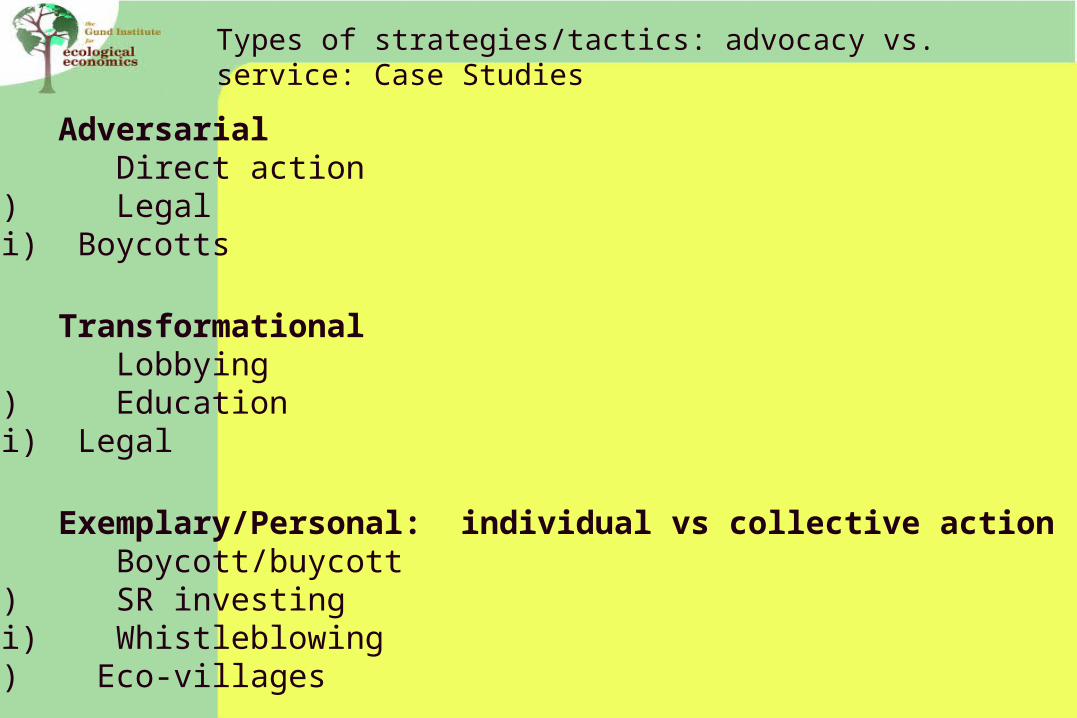
A) Adversariali) Direct actionii) Legaliii) Boycotts
B) Transformationali) Lobbyingii) Educationiii) Legal
C) Exemplary/Personal: individual vs collective actioni) Boycott/buycottii) SR investingiii) Whistleblowingiv) Eco-villages
Types of strategies/tactics: advocacy vs. service: Case Studies