Embed Size (px)
Citation preview
VON BERTALANFFY GROWTH CURVES FOR STRIPED MARLIN, TETRAPTURUS AUDAX, A N D BLUE MARLIN, MAKAZRA NZGRZCANS,
I N THE CENTRAL NORTH PACIFIC OCEAN
ROBERT A. SKILLMAN AND MARIAN Y. Y. YONG'
ABSTRACT
The growth of striped marlin, Tetrapturus audaz, and blue marlin, Makaira nigricans, was described by fitting von Bertalanffy growth curves (an assumed age model and a length-increment model) to the progression of age-groups, by quarters, through the Hawaiian longline fishery from 1960 to 1970. For striped marlin, the sexes grew at about the same rate and had similar predicted asymptotic maximum fork lengths, 277.4314.4 cm for males and 288.7-326.2 cm for females. For blue marlin, the sexes grew at about the same rate until 250 em. Above this length, the growth rate of males declined and an asymptotic maximum length of 298.8-368.0 em was predicted. For females above 250 cm, the growth continued at a rapid rate: exhibiting little tendency toward an asymptote over the range of ages available to the study.
While blue marlin, Makaira nigricans LacepBde, are important in the U S . sport fishery in Califor- nia, Florida, and Hawaii and striped marlin, Tetrupturus audax (Philippi), are important in California and Hawaii, little is known about their population characteristics or parameters. In par- ticular, growth of these species has received little attention. In this paper, the growth of striped and blue marlins is described by fitting von Ber- talanffy growth curves to age-groups separated from length-frequency data collected in Hawaii.
A review of the literature revealed four papers dealing with the growth of marlins. In them, growth was examined by plotting the progression of mean sizes for age-groups separated from size-frequency data by month or some other time interval; the fitting of a functional growth model (e.g., von Bertalanffy or Gompertz) was not dis- cussed or attempted. Royce (1957) studied striped marlin in the Hawaiian longline fishery (1949-52) and concluded that small (13.6-17.7 kg) and large (45.3-49.4 kg) size classes grew about 13.6 kg per year. De Sylva (1957) studied the growth of sailfish, Zsfiophorus platypterus (Shaw and Nod- der ) , in t he Atlantic from records obtained primarily from sport catches. His growth curve, fitted by eye, showed an extremely rapid rate of growth: 180 cm total length in the first year of life and 30 cm in the second. Maximum age was estimated as IV. De Sylva and Davis (1963) com-
'Southwest Fisheries Center Honolulu Laboratory, National Marine Fisheries Service, NOAA, Honolulu, HI 96812.
pared data for the white marlin T. albidus Poey, and the sailfish and concluded that white marlin live longer than sailfish. Koto and Kodama (1962), studying the growth of sailfish caught near Japan, found an annual growth of 35 cm for a 140-175 cm eye orbit-fork length group, 20 cm for a 176-195 cm group, and 15 cm for a 196-210 cm group.
The objective of this study was to quantitatively describe the growth of striped and blue marlins using a model that adequately followed the ob- served data and provided estimates of growth parameters, which could be incorporated into analytical models of population dynamics. Since the von Bertalanffy growth model satisfied these conditions, i t was used in this study. Specifically for striped marlin, growth parameters were sought by sex for individual cohorts and then for data pooled over all years. For blue marlin, growth parameters were sought by sex only for da ta pooled over all years because the data were in- sufficient to work with individual cohorts. By pooling across years, the assumption was made that the populations under study were in or tend- ing toward a steady state. As such, yearly varia- tions in mean lengths of age-groups as well as variations in growth parameters between cohorts were treated as homogeneous sets of responses to variations in the environment.
MATERIALS
From April 1960 through April 1970 at the
Manuscript accepted February 1976. FISHERY BULLETIN: VOL. 74, NO. 3.1976 553

FISHERY BULLETIN: VOL. 74. NO. 3
blue marlin in the Atlantic (Erdman 1968) and in the Pacific (Strasburg 1970) do not exceed about 136 kg. An examination of data collected under ideal sampling conditions a t Hawaiian Interna- tional Billfish Tournaments revealed only 5 out of 385 individuals in 12 yr that exceeded 136 kg. Four of these were under 143 kg while one fish weighed 171 kg. On the basis of these data, we accepted Erdman’s and Strasburg’s contention as essen- tially correct, assumed that all males over 143 kg were misidentified due to the difficult sampling conditions at the auction sites, and reclassified all males over 143 kg as females (56 were reclassified out of 2,710 specimens originally classified as males).
auction blocks of the fresh fish markets in Hono- lulu, the staff of the Honolulu Laboratory, Na- tional Marine Fisheries Service, NOAA, collected weight and sex data from large pelagic species caught by the Hawaiian longline fleet. Details of the longline fishery are given by June (1950) and Otsu (1954). All fish were weighed to the nearest whole pound. Due to the nearly complete utiliza- tion of marlin by the dealers, only a small incision could be made in the abdominal wall in order to examine the gonads. At best, a small section of gonad could be cut off and examined; no micro- scopic determinations were made. Thus, i t is possi- ble that some misidentification of the sex of these fish occurred, especially preceding sexual maturity for both species and following spawning for blue marlin.
METHOD OF ANALYSIS
Briefly, the analyses consisted of 1) transform- ing the data into usable form by (a) calculating length-weight relationships using functional re- gressions (Ricker 1973), (b) converting weights to lengths, and (c) grouping the lengths by sex, quarter, year, and length interval; 2) separating age-groups from the frequency distributions and estimating their mean lengths; 3) setting up the progressions of mean lengths and corresponding age structures; and 4) fitting von Bertalanffy growth models to the progressions of mean lengths. Following these steps, tests were per- formed to determine whether the yearly samples were homogeneous and could be pooled. These tests consisted of a series of nonparametric Friedman two-way analyses of varianq.e (Hol- lander and Wolfe 1973:139) performed on the number of age-groups, the mean lengths of age- groups, and the percent representation of age- groups separated for each year sampled, as well as on the growth parameters of the different cohorts. Also, a sign test (Siegel 1956:68) was used to test for trends in mean length between sexes; and a series of one sample runs tests (Siegel 1956:52) was used to test for trends in mean length among cohorts. If heterogeneity was not found, the transformed yearly data were pooled, that is, the year designation was ignored, and steps 2-4 above were repeated on the pooled data.
An initial inspection of the blue marlin length- frequency distributions revealed some unusually large specimens identified as males weighing up to 328 kg, whereas i t had been eontended that male
Transformation of Data
Observed weights were converted from pounds to kilograms and then to fork lengths in cen- timeters (tip of bill to middle point on the posterior margin of the middle caudal rays, FL). Length- weight relationships used for the latter conver- sions were calculated as functional regressions from Skillman and Yong (1974) following the recommendations of Ricker (1973). Briefly, the differences between functional and the commonly used predictive (linear) regressions, which are of importance to this application, are as follows. First, the predictive regression applies where it is hypothesized that one variable is linearly related to or dependent on a second variable, the in- dependent variable. Whereas, the functional re- gression applies where it is hypothesized that two variables are interdependent, and the effect of one cannot be disentangled from the effect of the other. Second, the predictive regression tends to systematically underestimate the magnitude of the regression coefficient as the sample range truncates the real range of the variates; the functional regression does not do so. For striped marlin, the data were insufficient to calculate functional length-weight relationships for each sex; therefore, a single relationship (FL = 73.4429 W 0.2858) was applied to each sex separately. For blue marlin, separate functional length-weight
65.4502 W 0.3030, and FLYALE = 56.8780 W 0.331R).
As expected, the coefficients of allometry calculat- ed using functional regressions increased over those calculated in Skillman and Yong (1974) using predictive regressions, and the difference between sexes decreased by 36%.
relationships were calculated (FLFEMALE - -
554

SKILLMAN and YONG. GROWTH CURVES FOR TWO MARLINS
In order to efficiently separate age-groups from the frequency distributions, t he d a t a were grouped and length intervals set up (Simpson e t al. 1960). Lengths for striped marlin were grouped by sex, year, quarter, and 3-cm interval, and these groupings resulted in a maximum of 96-length intervals per quarter. Blue marlin lengths were grouped by sex, quarter, year, and 5-cm interval, and these groupings resulted in a maximum of 73-size intervals per quarter.
Separation of Age-Groups
The computer program ENORMSEP (Yong and Skillman 1975) was used to separate the grouped, length-frequency d a t a into consti tuent age- groups and to calculate estimates of the mean length, variance, percent representation, and numerical size of the age-groups. Essentially this computer program automates the Cassie-Harding probability paper method (Harding 1949; Cassie 1954) and en te r s in te rmedia te resu l t s in to NORMSEP which performs the actual separation of age-groups.
Progression of Age-Groups The estimates of mean lengths for age-groups
were plotted by quarter in order to check for reasonable progression and to assign age. Ages were assigned by determining the time of peak spawning, estimating the age at recruitment, and then merely assigning ages progressively as the age-groups passed through the fishery.
The time of spawning is not well established for either striped or blue marlin. For striped marlin, Nakamura (1949) stated that the time of peak spawning seemed to be from April to May in the South China Sea near the Republic of China and from May to June near the Bonin Islands. Royce (1957) stated that testes with free flowing milt were collected in the equatorial central Pacific in March. Kume and Joseph (1969) estimated, on the basis of gonad index of females taken in the eastern tropical North Pacific, that peak spawning occurs in May and June. From specimens landed in southern California and northern Mexico, El- dridge and Wares (1974) indicated that gonad index was highest in June and July, but they did not have samples for August or September. Hence, we took June 1st as the time of peak spawning and assigned an age of 1.46 yr to the 151-cm male and 152-cm female age-groups recruited in the fourth quarter.
For blue marlin, Royce (1957) stated that males with free flowing milt were collected from Feb- ruary through October in the equatorial Pacific, and cited Nakamura (1942) as indicating tha t spawning occurs east of Luzon (Philippines) from May to July. Kume and Joseph (1969), on the basis of gonad index of females taken in the eastern tropical Pacific, concluded that spawning occurs in December and January; however, most of their samples were collected from south of the equator. We arbitrarily took June 1st as the time of peak spawning and assigned an age of 0.71 yr to the 55.5-cm female age-group recruited in the first quarter.
Von Bertalanffy Growth Model
Two computer programs, BGC3 and BGC4, assembled by Abramson (1971) and written by Patrick Tomlinson were used in this paper t o obtain estimates of von Bertalanffy growth pa- rameters. The computer program for model l, BGC3, fits the von Bertalanffy model by the least squares method to lengths from fish of known or, in this case, assumed age. The basic model is the familiar equation
where L = length at age t L, = a parameter depicting asymptot ic
maximum length K = a parameter indicating the rate of pro-
portional growth to = a parameter depicting the theoretical
age at which the fish has zero length given the adult growth form.
The computer program for model 2, BGC4, a version of the size-increment method proposed by Fabens (1965), fits the von Bertalanffy model by the least squares method to observed lengths, using data on growth increment in known time intervals but making no assumptions about absolute age. Parameter estimates using this method are in- cluded in the tables so that any future estimates of striped or blue marlin growth from tagging data can be compared directly to our results. For model 2, the von Bertalanffy model is written as
555

L" where b = 1 -- = La3
a parameter depicting the theoretical proportion of potential growth in length that occurs after hatching;
or by substituting t = t + .at and be-"' = 1 - 4 - into Equation (2a) L,
L, + A , = I., e + L, (1 - e- (2b)
where At = time increment between points of measured length.
GROWTH OF STRIPED MARLIN
Results-Analysis of Cohorts
Age-groups were successfully separated by ses and by quarter, within years, using the computer program ENORMSEP (Table 1). In general, the mean length estimates for females were slightly larger than those for males of the same age- groups. Quantitatively, the goodness of fit of the separated age-groups to the observed frequency distribution can be assessed with the chi-square values in Table 1. The largeness of the chi-square values indicated poor fit, but it was found that the tails of the distribution, having frequencies too small for the separation of age-groups, contribut- ed disproportionately to the total chi-square value. Qualitatively, the goodness of fit was deemed adequate for the following reasons. In all years there was close agreement between sexes in the number of age-groups separated within quarters: approximately 2, 3, 4, and 3 age-groups for the first through fourth quarters, respectively. There was also close agreement among years and between sexes in the mean lengths and length composition of age-groups within quarters.
The progressions of mean lengths were set up as depicted by the connected open circles in Figure 1. In the third quarter of every year for both seses, there was an age-group with mean length of about 167 cm that did not fit into the progression of age-groups. By assigning the same assumed age to this age-group as to a similar size group in the first quarter, and allowing the same time between spawning and the attainment of this age, this age-group could have resulted from a spawning in January. On the basis of gonad indices, Kume and Joseph (1969) believed that striped marlin from the eastern South Pacific spawn from November to
FISHERY BULLETIN: VOL. 74, NO. 3
December, and Royce (1957) indicated that striped marlin with ripe gonads have been collected in February in the equatorial region of the central Pacific. Hence, we concluded that this age-group belonged to a different spawning stock and should not be used in the calculation of the von Ber- talanffy growth curves for the central North Pacific stock. Also, for females there were two age-groups having mean lengths of 267.5 and 200.0 cm in the third quarter 1964 and 1966, and for males there were four age-groups having mean lengths of 204.6 and 272.0 cm in the third quarter of 1968, 271.8 cm in the fourth quarter 1968. and 266.0 rm in the second quarter 1969. These could not be assigned with certainty to any cohort.
Several qualitative aspects of the observed growth of the cohorts were noteworthy (Figure 1). First, there seemed to be a cyclical pattern in the mean size a t recruitment but no upward or down- ward trend. Second, the progression of age-groups during the first year in the fishery was fairly smooth and consistent between cohorts. Third, after about a year and a half in the fishery, there seemed to be a regression or slowing down in the apparent growth that persisted for two or three quarters. Fourth, the mean length of the last age-group in each cohort varied considerably.
There were a suficient number of age-groups for the 1959-65 cohorts to fit a von Bertalanffy growth curve but not for the 1957-58 and 1966-68 cohorts. The calculated growth curves were shown as smooth curves in Figure 1. As expected from the variation shown in the progression of the observed mean sizes in Figure 1, the standard errors of estimates were moderate, and there was variation in parameter estimates between cohorts (Table 2).
To investigate the variation in estimates of mean length for age-groups shown in Table 1 and in growth parameters shown in Table 2, a series of nonparametric Friedman two-way analyses of variance was performed. No difference in the number of age-groups by sex, quarter, or sample year could be demonstrated (all S test statistics were insignificant with probability -0.05, Hol- lander and Wolfe 1973139). In testing the effect of sex on the mean length of age-groups within quarters, three significant effects (S= 5.44, P~0.05; S=8.99, BO.01; and S=5.44, B0.05) were found out of 16 comparisons. However, using a sign test for trends in mean length between sexes showed that females tended to be larger than males ( t e s t s ta t i s t ic P = 0.00005, or probability P=O.Ol, for data from all years). In
556
SKILLMAN and YONG: GROWTH CURVES FOR TWO MARLINS
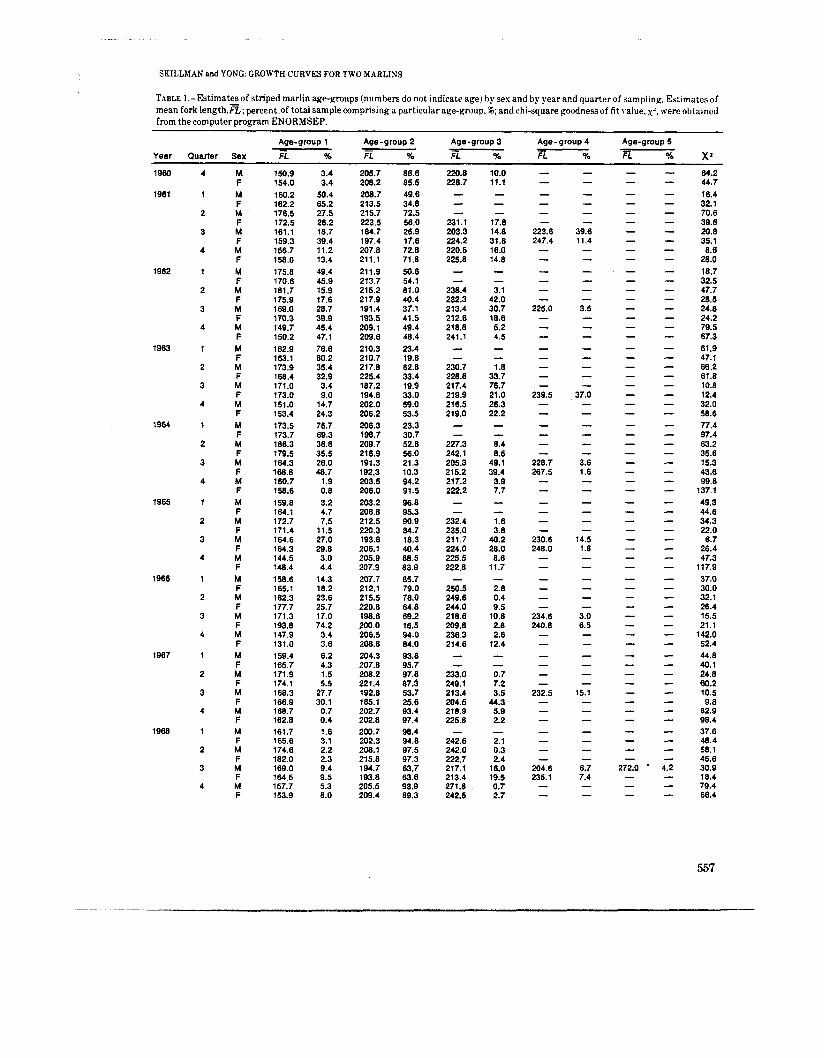
TABLE 1.-Estimates of striped marlin age-groups (numbers do not indicate age) hy sex and by year and quarter of sampling. Es:imates of mean fork length.=; percent of total sample comprising a particular age-group, 16; and chi-square goodness of fit value. x’. were obtained from the computer program ENORMSEP.
Age-group 1 Age-group 2 Age-group 3 Age- group 4 Age-group 5 - - - % X’ Year Quarter Sex FL % E % FL % FL % FL
1980
1961
1962
1963
1964
1965
1966
1967
1968
4
1
2
3
4
1
2
3
4
1
2
3
4
1
2
3
4
1
2
3
4
1
2
3
4
1
2
3
4
1
2
3
4
M F M F M F M F M F M F M F M F M F M F M F M F M F M F M F M F M F M F M F M F M F M F M F M F M F M F M F M F M F M F M F M F M F
150.9 154.0 160.2 162.2 176.5 172.5 161.1 159.3 156.7 158.0 175.8 170.6 181.7 175.9 169.0 170.3 149.7 150.2 162.9 163.1 173.9 168.4 171.0 173.0 151.0 153.4 173.5 173.7 186.3 179.5 164.3 168.8 160.7 158.6 159.8 164.1 172.7 171.4 164.6 164.3 144.5 148.4 158.6 165.1 182.3 177.7 171.3 193.8 147.9 131.0 159.4 165.7 171.9 174.1 168.3 166.9 168.7 162.8 161.7 165.6 174.6 182.0 169.0 164.5 157.7 153.9
3.4 3.4
50.4 65.2 27.5 26.2 18.7 39.4 11.2 13.4 49.4 45.9 15.9 17.6 28.7 39.9 45.4 47.1 76.6 80.2 35.4 32.9 3.4 9.0
14.7 24.3 76.7 69.3 38.8 35.5 26.0 48.7
1.9 0.6 3.2 4.7 7.5
11.5 27.0 29.8 3.0 4.4
14.3 18.2 23.6 25.7 17.0 74.2 3.4 3.6 6.2 4.3 1.5 5.5
27.7 30.1
0.7 0.4 1 .8 3.1 2.2 2.3 9.4 9.5 5.3 8.0
205.7 208.2 208.7 213.5 215.7 223.5 184.7 197.4 207.8 211.1 21 1.9 213.7 215.2 217.9 191.4 193.5 209.1 209.6 210.3 210.7 217.8 225.4 187.2 194.8 202.0 206.2 206.3 198.7 209.7 216.9 191.3 192.3 203.5 206.0 203.2 206.8 212.5 220.3 193.8 206.1 205.9 207.9 207.7 212.1 215.5 220.8 198.6 200.0 206.5 208.8 204.3 207.8 208.2 221.4 192.8 185.1 202.7 202.8 200.7 202.3 208.1 215.8 194.7 193.8 205.5 209.4
86.6 85.5 49.6 34.8 72.5 56.0 26.9 17.6 72.8 71.8 50.6 54.1 81.0 40.4 37.1 41.5 49.4 48.4 23.4 19.8 62.8 33.4 19.9 33.0 59.0 53.5 23.3 30.7 52.8 56.0 21.3 10.3 94.2 91.5 96.8 95.3 90.9 84.7 18.3 40.4 88.5 83.9 65.7 79.0 78.0 64.8 69.2 16.5 94.0 84.0 93.8 95.7 97.8 87.3 53.7 25.6 93.4 97.4 98.4 94.8 97.5 97.3 63.7 63.6 93.9 89.3
220.8 228.7 - -
231.1 203.3 224.2 220.6 225.8 - - 236.4 232.3 213.4 212.6 218.8 241.1
- 230.7 228.8 217.4 219.9 216.5 219.0 - - 227.3 242.1 205.3 215.2 217.2 222.2 - -
232.4 235.0 21 1.7 224.0 225.5 222.8
250.5 249.6 244.0 218.6 209.8 236.3 214.6
-
- - 233.0 249.1 213.4 204.5 218.9 225.8
242.6 242.0 222.7 217.1 213.4 271.8 242.5
-
10.0 11.1 - - - 17.8 14.8 31.6 16.0 14.8 - - 3.1
42.0 30.7 18.8 5.2 4.5 - - 1 .8
33.7 76.7 21 .o 26.3 22.2 - - 8.4 8.5
49.1 39.4
3.9 7.7 - - 1.6 3.8
40.2 28.0 6.6
11.:
2.8 0.4 9.5
10.8 2.8 2.6
12.4
-
- - 0.7 7.2 3.5
44.3 5.9 2.2
2.1 0.3 2.4
16.0 19.5 0.7 2.7
-
272.0 - - -
64.2 44.7 16.4 32.1 70.6 39.6 20.8 35.1 8.6 28.0
32.5 47.7 28.5 24.8 24.2 79.5 67.3 61.9 47.1 66.2 61.8 10.8 12.4 32.0 58.6 77.4 97.4 63.2 35.6 15.3 43.6 99.8
137.1 49.3 44.6 34.3 22.0
6.7 26.4 47.3
117.9 37.0 30.0 32.1 26.4 15.5 21.1
142.0 52.4 44.8 40.1 24.8 60.2 10.5 9.8
82.9 98.4 37.6 48.4 58.1 45.6 30.9 18.4 79.4 66.4
18.7
557
FISHERY BULLETIN: VOL. 74. NO. 3
Table 1.-Continued.
Age-group 1 Age-group 2 Age-group 3 Age -group 4 Age-group 5 - FT % X' - - - Year Quarter Sex FL % FL % FL YO FL %
- - 31.1 - - - - - 32.2 F 156.6 12.6 206.8 87.4 - 2 M 179.0 9.1 2!1.6 90.6 266.0 0.3 - - - - 34.1
- 39.4 F 182.0 0.4 212.0 97.0 221.9 2.6 - - - - 15.5 3 M 161.0 0.5 195.4 62.2 220.0 25.2 235.9 12.1 -
F 174.7 8.3 196.8 71.2 221.0 13.8 241.4 6.7 - - 40.2 - - 33.9 4 M 154.5 5.8 206.6 92.5 233.0 1.7 - - F 155.3 4.8 206.0 93.4 238.2 1.8 - - - - 70.9
- - 35.9 F 164.2 47.4 206.2 52.6 - - - -
1969 1 M 157.8 8.9 203.5 91.1 - - - -
- - - - - 2a.2 1970 1 M 164.1 45.3 210.4 54.7 -
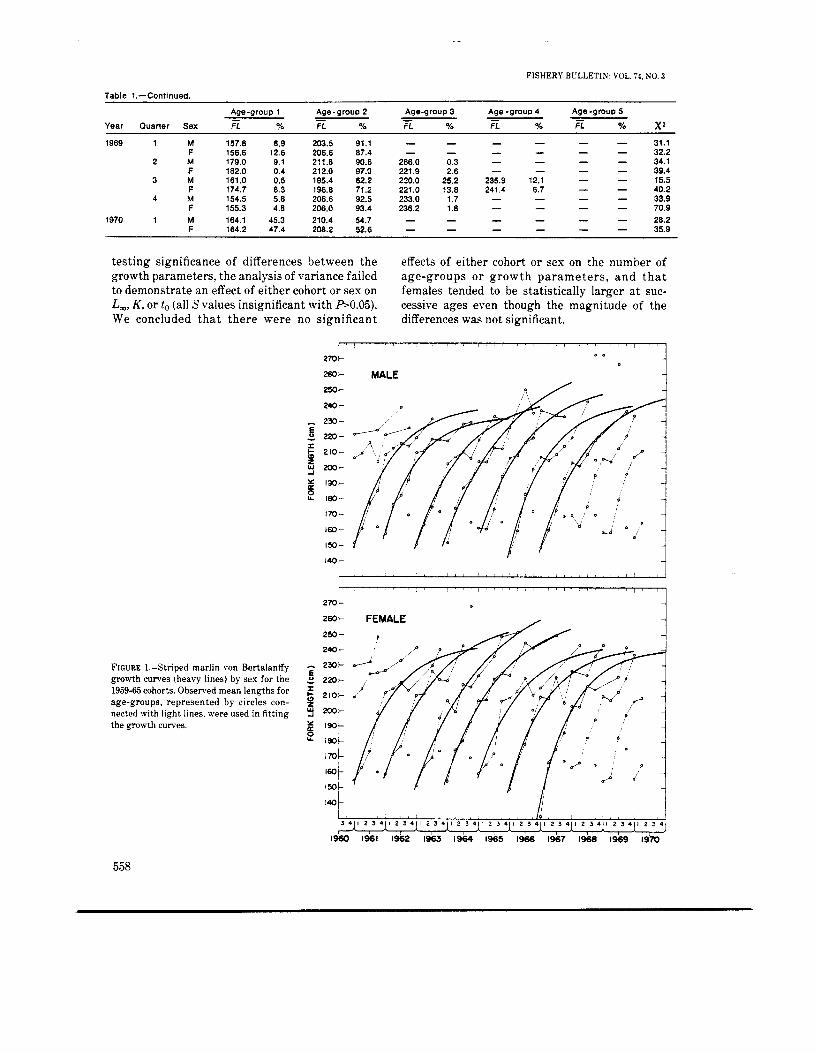
testing significance of differences between the growth parameters, the analysis of variance failed to demonstrate an effect of either cohort or sex on L,, K, or to (all S values insignificant with b 0 . 0 5 ) . We concluded tha t there were no significant
effects of either cohort or sex on the number of age-groups or growth parameters, and tha t females tended to be statistically larger a t suc- cessive ages even though the magnitude of the differences was not significant.
FIGURE 1.-Striped marlin von Bertalanffy growth curves (heavy lines) by sex for the 1959-65 cohorts. Observed mean lengths for age-groups, represented by circles con- nected with light lines. were used in fitting the growth curves.
Y a e
2 d
2601 MALE
220
2 10
130
IYJ
A i 3 4 1 1 2 3 4 1 1 2 3 4 1 1 2 3 4 1 1 2 3 4 1 1 2 3 4 1 1 2 3 4 1 1 li 2 3 4 1 2 3 4 1 2 3 4 , 1 2 3 4 ) , ,
r 1360 1 9 6 1 1%2 1963 1964 1965 1966 1967 1968 1969 l9?0
558

SKILLMAN and YONG: GROWTH CURVES FOR TWO MARLINS
TABLE 2.-Striped marlin von Bertalanffy growth parameters hy cohort and sex. The parameter estimates, L, (asymptotic maximum fork length), K (rate of proportional growth), and t, (theoretical time at which the fish would have zero length), are given for model 1 (upper row) and model 2 (lower row).
~
Standard error Year- Class Sex L, (cm) K t. (yr) of estimate
1959 Male 241.0 0.812 251.1 0.651
Female 245.0 0.809 255.1 0.626
1960 Mele 233.7 0.929 233.5 0.988
Female 261.7 0.584 290.0 0.437
1961 Male 247.0 0.640 250.9 0.830
Female 283.3 0.428 265.7 0.574
I -
0.297 5.1 6.1
0.294 6.6 7.3
0.260 3.6 4.7
-0.096 6.0 8.0
0.007 4.6 5.3
-0.304 6.0 8.6
1962 Male 274.4 0.448 -0.435 6.8 248.2 0.873 9.0
Female 265.7 0.554 -0.125 3.7 261.9 0.664 6.0
1963 Male 256.0 0.622 -0.004 6.2 244.2 0.655 7.9
Female 245.5 0.729 0.091 9.1 258.7 0.607 10.9
1964 Male 243.7 0.818 0.351 7.1 275.5 0.570 6.7
Female 243.3 0.803 0.282 7.0 234.9 1.087 9.8
1965 Male 253.3 0.630 0.086 4.3 258.1 0.585 5.3
Female 239.8 0.914 0.542 6.5 231.5 1.267 8.9
Results-Analysis of Pooled Data
In the preceding section, it was shown that there were no demonstrable differences in the growth parameters between different cohorts; hence, the estimates for L,, K, and to could be averaged to provide a pooled estimate. In addition, it was not possible to consistently show significant differ- ences between quarters or years in the number of age-groups separated (S- 11.78, P50.05), the mean lengths of age-groups (S- 15.51, Ps0.05, for males in third quarter, all seven remaining S values had P>O.O5), or the percent representation of age- groups (S-57.18, P4 .01 , for males in the second quarter, S = 49.57, Ps0.01, for females in the third quarter, all six remaining S values with B0.05) . Neither was it possible to show a trend in mean lengths among cohorts using a series of sample runs tests (one test out of 18 deviated from random at the 0.05 level). We interpreted these results to mean that the yearly samples were homogeneous and that a t least approximately a steady s t a t e existed. Therefore, t he yearly frequency data were pooled; and ENORMSEP was used to separate age-groups.
The mean lengths and percent representation of age-groups by quarter (Table 3) were quite similar to the values found using the yearly data (Table 1). Quantitatively evaluating the goodness of fit, the chi-square values were found again to be rather large. Qualitatively, however, the shape of the frequency distributions was consistent between sexes within quarters and generally so between quarters within each sex (Figure 2). The plots for the third quarter, the off-season for striped marlin in Hawaii, did not show much of a pattern at all. Also, the shapes of the plots for the pooled data analysis were similar to those for the analysis of individual cohorts (not shown).
Mean lengths for females and males exhibited a fairly smooth progression (Figure 3). As in the analysis of cohorts, there was an age-group with mean length of about 167 cm in the third quarter that did not fit into the progression of age-groups. Again, i t was assumed tha t this age-group belonged to a different spawning stock and should not be used in the calculation of the growth curve. For females, there were 11 age-groups in the progression whereas there were 10 or 12 but never 11 for the analysis of cohorts. For males, there were 12 age-groups in the progression whereas there were 9 to 11 in the analysis of cohorts. The smallest fish were recruited into the fishery in the fourth quarter and progressed through the fishery until the largest fish passed from it in the third
TABLE 3.-Statistics for striped marlin age-groups by quarter and sex, pooled over all years. Estimates of mean fork length, FL; percent representation of the age-group, B; the numerical sample for size of the age-group, n; the total sample size, N and the chi-square goodness of fit value, ,y2, were obtained from the computer program ENORMSEP.
Male Female Age- - Quarter group FL O h n F i % n
1 1 2 N
2 1 2 3 N X'
3 1 2 3 4 5 N X2
4 1 2 3
X I n
166.6 36.2 204.7 83.8
114.1 177.3 17.5 212.5 81.5 228.0 1.0
97.2 167.1 17.0 195.3 52.6 215.2 19.9 231.6 9.1 280.0 1.4
71.6 151.3 7.1 204.7 87.0 222.6 5.9
130.1
1,480 2,813 4,093
1,020 4,746
57 5.823
178 551 208 96 14
1,047
421 5.162
352 5,935
167.1 42.6 1.568 207.2 57.4 2,115
3,683 183.8 174.4 21.0 852 219.7 69.7 2,827 238.4 9.3 377
4,056
166.7 22.7 190 194.0 50.1 419 217.5 19.4 162 238.2 7.8 65
836
54.0
- - - 45.1
152.2 8.7 431 207.0 83.0 4,113 222.7 8.3 413
4,957 192.3
559

FISHERY BULLETIN: VOL. 74. NO. 3
FEMALE I " " " " 1
MALE w , , , , , 7
FIRST QUARTER 00
- SECOND OUARTER
600-
1 i c i
I " " 1
7001 O A
FOURTH QUARTER
I \
w a '300
i l
li.
J I
1 i i 1
xx)
100
I25 IS0 175 xx) 225 250 275 500
LENGTH INTERVAL ( cm 1 LENGTH INTERVAL (em)
FIGURE Z.-Striped marlin length composition hy sex and quarter for the analysis of pooled data. The smooth curves represent age-groups separated by the computer program ENORMSEP. and circles represent observed values.
560
270
m- zso-
I30
10 I S 2 0 23 30 35 4 0 4.3 S O S S M E IN YEARS
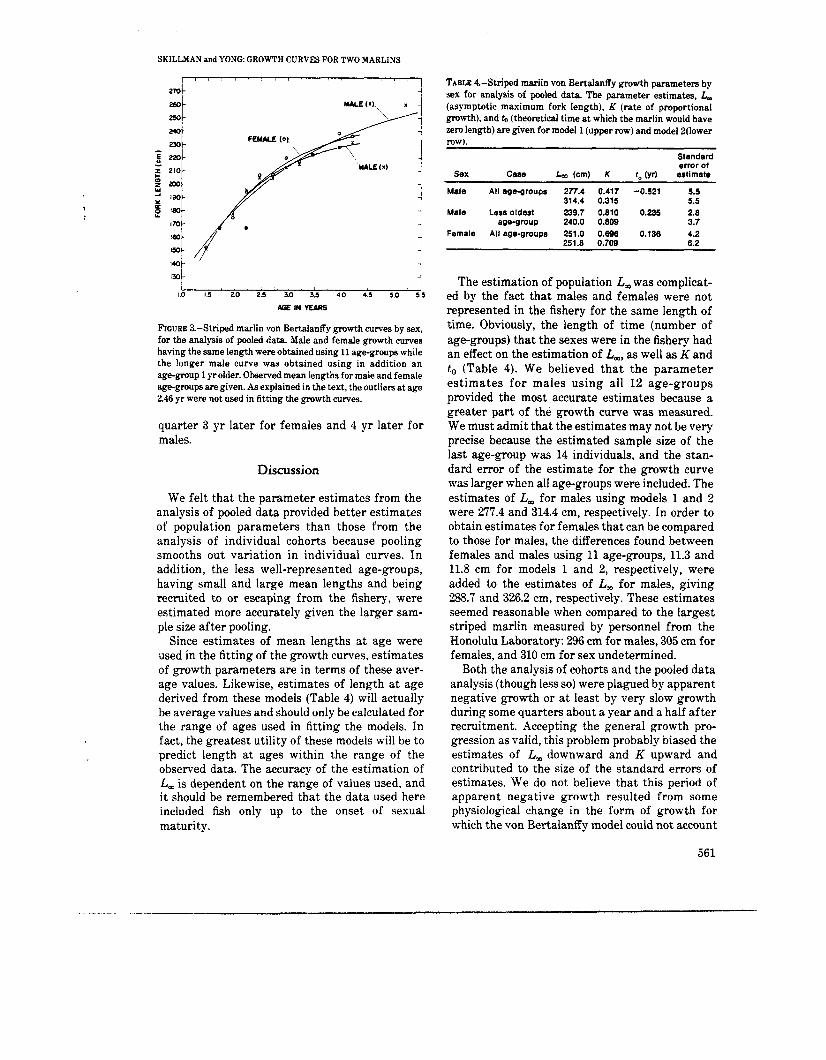
FIGURE 3.-Striped marlin von Bertalanffy growth curves by sex, for the analysis of pooled data Male and female growth curves having the same length were obtained using 11 age-groups while the longer male curve was obtained using in addition an age-group 1 yrolder. Observed mean lengths formale and female age-groups are given. As explained in the text, the outlien atage 246 yr were not used in fitting the growth curves.
quarter 3 yr later for females and 4 yr later for males.
-
‘ UUE (1).
-1
Discussion
We felt that the parameter estimates from the analysis of pooled data provided better estimates of population parameters than those from the analysis of individual cohorts because pooling smooths out variation in individual curves. In addition, the less well-represented age-groups, having small and large mean lengths and being recruited to or escaping from the fishery, were estimated more accurately given the !arger sam- ple size after pooling.
Since estimates of mean lengths a t age were used in the fitting of the growth curves, estimates of growth parameters are in terms of these aver- age values. Likewise, estimates of length at age derived from these models (Table 4) will actually be average values and should only be calculated for the range of ages used in fitting the models. In fact, the greatest utility of these models will be to predict length at ages within the range of the observed data. The accuracy of the estimation of L, is dependent on the range of values used, and it should be remembered that the data used here included fish only up to the onset of sexual maturity.
TABLE 4.-Striped marlin von Bertalanffy growth parameters by sex for analysis of pooled data. The parameter estimates, L, (asymptotic maximum fork length). K (rate of proportional growth), and to (theoretical time at which the marlin would have zero length) are given for model 1 (upper row) and model P(1ower row).
Standard error of
Case Lao (cm) K to (yr) astirnate Sex
Male AH age-groups 277.4 0.417 -0.521 5.5 314.4 0.315 5.5
Male Less oldest 239.7 0.810 0.235 2.8 age-group 240.0 0.809 3.7
Female All age-groups 251.0 0.696 0.136 4.2 251.8 0.709 6.2
The estimation of population L, was complicat- ed by the fact that males and females were not represented in the fishery for the same length of time. Obviously, the length of time (number of age-groups) that the sexes were in the fishery had an effect on the estimation of L,, as well as K and to (Table 4). We believed tha t the parameter estimates for males using all 12 age-groups provided the most accurate estimates because a greater part of the growth curve was measured. We must admit that the estimates may not be very precise because the estimated sample size of the last age-group was 14 individuals, and the stan- dard error of the estimate for the growth curve was larger when all age-groups were included. The estimates of L, for males using models 1 and 2 were 277.4 and 314.4 cm, respectively. In order to obtain estimates for females that can be compared to those for males, the differences found between females and males using 11 age-groups, 11.3 and 11.8 cm for models 1 and 2, respectively, were added to the estimates of L, for males, giving 288.7 and 326.2 cm, respectively. These estimates seemed reasonable when compared to the largest striped marlin measured by personnel from the Honolulu Laboratory: 296 cm for males, 305 cm for females, and 310 cm for sex undetermined.
Both the analysis of cohorts and the pooled data analysis (though less so) were plagued by apparent negative growth or at least by very slow growth during some quarters about a year and a half after recruitment. Accepting the general growth pro- gression as valid, this problem probably biased the estimates of L, downward and K upward and contributed to the size of the standard errors of estimates. We do not believe that this period of apparent negative growth resulted from some physiological change in the form of growth for which the von Bertalanffy model could not account
561

FISHERY BULLETIN VOL 7 4 ~ NO 3
means of separat ing age-groups from a mixed dis t r ibut ion, there is a lways t h e d a n g e r t h a t age-groups from different cohorts of the same spawning stock will be so similar in size tha t they cannot be separated, especially with increasing age and varying growth rates of the cohorts. We acknowledge tha t this may be a problem, but if it is, it would seem from Figure 1 to be more impor- tan t for the growth period following the period of aberrant growth. This problem would be increased if there were more than one spawning stock involved, and this seems to be the case for some quarters. In spite of the small sample sizes in the third quarter, there seemed to be little doubt that the 167-cm age-group was real, since i ts mean length is quite removed from tha t of the next age-group at about 194 cm and since the age-group was found for the pooled data analysis and for 8 out of 9 yr for females and for all years for males in t h e analysis of yearly da ta . Because t h e t w o spawning stocks would continue to have qui te different lengths for the next couple of quarters and no comparable age-groups were separated in these quarters, i t was reasonable to assume that this other secondary stock was not represented in the catches in the subsequent fourth, first, and probably second quarters. But what about the following third quarters? If similar growth curves a re assumed for this other stock, then the 200.0-cm female age-group in the third quarter of 1966 and the 204.6-ern male age-group in the third quarter of 1968 could also belong to the secondary spawn- ing stock. If this secondary stock was present in other years but in numbers too small to be separ- a ted out, it would tend to bias downward the estimates of the similar-sized age-group of the primary spawning stock. With the accuracy of the present set of data, it is impossible to comment on the likeiihood or importance of this possibility.
The occurrence of these age-groups at approx- imately 167 cm in the third quarter presents an additional problem. Where do they come from? If the male and female growth curves are used to back calculate the probable time of spawning for the age-group a t approximately 167 cm in the pooled data analysis, January is estimated as the time of peak spawning. We hypothesize that these fish could come from a stock spawning in the equatorial region, probably north of the equator, during months corresponding to the southern summer. I t is hard to visualize a hypothesis t h a t would account for a stock spawned 6 mo out of
and, therefore, is invalid, but r a t h e r t h a t the apparent change in growth was caused by seasonal changes in availability of the stock due to some seasonal size-age migration phenomenon or possi- bly by changes in the selectivity of the fishery. Preliminary examinat ion of Japanese longline statistics suggested that the striped marlin stock available to the Hawaiian fishery shifts its center of density northward in t h e months with the warmest water temperature and becomes less available to the local fishery (Heeny S. H. Yuen, Southwest Fisheries Center, pers. commun.). The decreased growth most commonly seen in the third quarter might then be due to smaller fish being associated with the periphery of the stock.
There are of course other possible explanations. For example, one reviewer suggested tha t this period of slow or negative growth represented a n asymptote followed by the initiation of a new growth phase. F i t t i n g a two-cycle Gompertz growth curve to the pooled data , this reviewer found both sexes tending toward a n asymptote at age 246 yr followed by another growth phase where females tended toward a n asymptote at 320 cm, but no solution was found for males. Such changes in growth phase are common at sesual matur i ty and at o ther times when body form changes. Change in growth form is commonly accompanied by a corresponding change in the length-weight relationship, and Skillman a n d Yong (1974) found no indication of a change in the l e n g t h - w e i g h t r e l a t i o n s h i p o v e r t h e r a n g e 142.2-310.1 cm. Also, t h e age of fish i n t h e Hawaiian fishery, having a calculated mean length corresponding to length at first maturity found by Eldridge and Wares (1974) and Kume and Joseph (1969) for the eastern tropical Pacific, was 4.2 yr. This age is nearly double the hypothesized age of first asymptotic growth. Thus. while it is possible to fit a segmented growth curve t o t h e d a t a , biological evidence given above does not support such a procedure.
Another possible e s p l a n a t i o n involves t h e separation of age-groups. The aberrant growth occurred most frequently in the third quarter. and since the sample size was smallest in this quarter, the precision of the estimates is probably less than for the other quarters. However, the aber ran t growth did not always occur in this quarter, and its repeated occurrence among cohorts suggested that it was real and not a n artifact of the estima- tion procedure per se. With a n y probabilistic
562

SKILLMAN and YONG. GROWTH CURVES FOR TWO MARLIhS
phase migrating poleward, but at lower latitudes, at the same time as the primary stock. Possibly these fish associate with blue marlin of about the same size tha t migrate into Hawaiian waters in the third quarter.
Estimates of von Bertalanffy growth pa- rameters for both sexes were first obtained using for females and using 12 and 11 (deleting oldest) age-groups for males (Table 4, smooth curves in Figure 3). The standard errors of estimates were slightly smaller than those f o r t h e individual cohorts but still not what could be considered small. When the oldest age-group for males was deleted from the calculations, L, for females was 11 to 12 cm greater than for males. Using all of the age-groups for males, the estimate of L, increased substantially.
Although this paper deals with growth, t h e length composition and age of striped marlin as found in this study have some relevancy to the problem of migrat ion. F i r s t , Matsumoto a n d Kazama (1974) hypothesized tha t striped marlin migrate out of Hawaiian waters to spawn, most likely to the western North Pacific. The calculated mean length of the last female age-group found in the Hawaiian fishery (age 4.2 yr) corresponded to the length at first maturity found by Eldridge and Wares (1974) and Kume and Joseph (1969) for the eastern tropical North Pacific. Thus, our d a t a established t h a t a s striped marlin reached the length corresponding t o sexual matur i ty , they became unavailable to the local fishery. Second, Kume and Joseph (1969) indicated tha t there was a tendency for average length to increase in the southern areas of the Japanese longline fishery in the eastern tropical North Pacific, and i t seemed t o us from their charts tha t there was also a western component to the increasing average lengths. Eldridge and Wares (1974) believed tha t maturing striped marlin moved out of the range of the sport fisheries based in southern California and Mexico; and Squire (1974) suggested tha t the movement of striped marlin away from the Baja California area might be to the area of the Revilla Gigedo Islands where fish with ripe gonads have been collected and where behavior suggestive of spawning ac- tivity has been observed by the Japanese. While the range of our length da ta was similar to tha t found in t h e eas te rn tropical Pacific, t h e last age-group recognizable in our da ta comprised less than 10% of the total frequency whereas similar- sized fish seemed to be well represented in the
southern and western areas of the eastern tropical North Pacific longline fishery. Thus, it seems apparent that the fish leaving the fishery off the American coast d o not m i g r a t e through t h e Hawaiian fishery in a n y appreciable numbers. However, the capture of a striped marlin, tagged off Baja California, 322 km southwest of t h e Hawaiian Islands indicates t h a t some eastern Pacific fish move into the vicinity of the Hawaiian Islands. Finally, our analyses do not provide any information on the direction of emigration from the Hawaiian fishery.
GROWTH OF BLUE MARLIN
Results-Analysis of Pooled Data
The number of age-groups, as separated by the computer program ENORMSEP, var ied from three in the third quarter for males to as many as eight in the first quarter for females (Table 5). The
TABLE 5.-Statistics for blue marlin age-groups by quarter and sex for analysis of pooled data. Estimates of mean fork length, E; percent representation of the age-group, 8; the numerical sample size for the group, i ) : the total sample size. N; and the chi-square goodness of fit value, x'. were obtained from the computer program ENORMSEP.
Male Female - - Quarter AOB-!XOUD FL % n FL % n
1 1 123.0 2 172.7 3 225.0 4 240.5 5 281.8 6 7 - 8 N X 2 16.8
2 1 180.5 2 220.0 3 250.1 4 278.0 N xz 22.0
3 1 163.6 2 227.7 3 255.8 4 - 5 N X Z 33.2
4 1 175.5 2 228.7 3 264.0 4 285.5 5 6 7 N X ' 26.2
- -
-
- - -
3.3 8.7
57.2 20.0 10.8 - - -
0.3 65.4 31.7
2.6
1.4 77.6 21.0 - -
8.4 80.7 10.4 0.5 - - -
2 5
34 12 7 - - -
60
1 172 84
7 264
9 486 131 - -
626
32 304
39 2 - - -
377
55.5 0.6 1 145.9 1.8 3 190.5 3.0 5 232.8 7.4 12 286.8 31.5 52 333.5 32.9 55 366.1 22.2 37 415.5 0.6 1
166
205.7 5.9 28 298.3 76.2 365 345.4 13.0 62 377.2 4.9 24
479
158.8 0.4 3 213.5 7.3 48 292.6 53.1 352 327.1 24.2 160 362.9 15.0 100
863
101.7 0.9 4 180.8 9.2 41 225.1 11.3 51 280.0 33.5 151 307.8 14.2 64 342.1 27.4 123 390.8 3.5 16
449
33.2
34.1
38.5
69.3
563

FISHERY BULLETIN: VOL. 14. NO. 3
the first quarter were females, with males being recruited 1 yr later. Males were present in the fishery for 3% pr and females for 7 yr. Several age-groups represented by one or two individuals were separated for both sexes. The existence of these age-groups was tentatively accepted, but the accuracy of their estimated mean lengths was viewed with skepticism in calculating growth parameters. The mean length estimates of male and female age-groups were in close agreement until about 250 cm (S = 0.50, fi0.05). From 250 to 300 cm, the mean lengths for female age-groups were larger than estimates for males. Above 300 cm, only female age-groups were found, and these formed an irregularly increasing progression.
Estimates of von Bertalanffy growth pa- rameters for both sexes were first obtained using
shape of the frequency distribution differed sub- stanially between sexes (Figure 4). The 240.5-cm male age-group separated in the first quarter that had zero variance (Table 5 ) was regarded as false and was not used in subsequent calculations. Quantitatively, the chi-square values do not in- dicate very good fit; however, as was the case with striped marlin, the tails of the frequency distribu- tions, having frequencies too small for the separ- ation of age-groups, contributed disproportiona- tely to the total chi-square value. Qualitatively, as can be seen from Figure 4, the shape of the frequency distribution was similar from quarter to quarter, especially for males.
Progressions of mean lengths were set up for males and females as depicted in Figure 5. The smallest blue marlin recruited into the fishery in
MALE FEMALE
I " I
my , ,
FIGURE 4-Blue marlin length composition by sex and quarter for the analysis of pooled data. The smooth curves represent age-groups separated by the computer program ENORMSEP, and circles represent observed values.
4 Y
I i t " " " ' I
1 4%
564

SKILLMAN and YONG: GROWTH CURVES FOR TWO MARLINS
r I *t i
IW i- /
o i
1 i
i 00 I 2 3 4 5 6 7 e 9
AGE IN Y E M
FIGURE 5.-Blue marlin von Bertalanffy growth curves by sex for the analysis of p l e d data. Observed mean lengths for female and male age-groups are given.
all age-groups, and then using only those with estimated numerical representations greater than two individuals. Further analyses were done using age-groups for females, over the same age span as for males, with numerical representation greater than two individuals (Table 6). For males, pa- rameter estimates were similar using all age- groups and those age-groups represented by more than two individuals. The standard error of es- timate was smaller for the latter than it was for the case using all age-groups. For females, again the parameter estimates were similar for the two data sets, and the standard errors of estimates did not change appreciably. The estimates for L,were nearly doubled those for males. In addition, the estimate of L, for females, using the same age- groups as for males with age-groups represented by more than two individuals, was nearly 3% times that for males.
Discussion
The estimates of von Bertalanffy growth pa- rameters for male blue marlin differed little whether all of the age-groups were used o r whether the less well-represented age-groups were deleted (Table 6). Because the standard errors of estimates were generally smaller for the reduced data sets, we felt that these fits provided
TABLE &-Blue marlin von Bertalanffy growth parameters by sex for the analysis of pooled data. The parameter estimates, L, (asymptotic maximum fork length), K (rate of proportional growth), and to(theoretica1 time at which the fish would have zero length) are given for model 1 (upper row) and model 2 (lower row).
Sex Case L, (cm) K
Male All agegroups
Male Age-groups with more than two individuals
Female All age-groups
Female Agagroups with more than two individuals
Female Same agegroups as for males with morethan two individuals
371.1 0.285 282.3 0.815 368.0 0.315 298.8 0.560
659.1 0.116 807.8 0.091 628.6 0.123 540.2 0.175
1,248.1 0.048 875.2 0.086
Standard error of
1, (yr) estimate
0.106 12.7 18.6
0.390 9.9 15.0
-0.181 10.2 13.8
-0.202 9.1 14.0
-0.874 4.0 5.2
better estimates of parameters. Although the standard errors of estimates were larger than desirable, they varied from less than 1% to only '7% of the estimated L,. Thus, the von Bertalanffy growth model described the data satisfactorily. The mean length estimates for the poorly repre- sented age-groups, which were the youngest and oldest in our samples, should be viewed as approximate.
For males. estimates of L,, 368.0 and 298.8 cm for models 1 and 2, respectively, bracketed the commonly accepted asymptotic length of about 300 cm. If our assumption of a knife-edge limit of 143 kg (approximately 300 cm) for males was incorrect, the progression of age-groups would have been expected to increase in len-gth up to this point without approaching an asymptote. Since an asymptote was found, we felt our assumption was valid.
For females, the von Bertalanffy growth curves seemed adequate for describing the data, but the es t imates of growth pa rame te r s were not biologically reasonable. Using the same range of age-groups as used for males, the estimates of L, were around 1,000 cm, confirming the visual im- pression that there was little tendency towards an asymptote over this range of ages. Using all of the data, estimates of L, were 626.6 and 540.2 cm for models 1 and 2, respectively, or approximately 1,729 and 1,060 kg, respectively. While these results suggested that there was some tendency towards an asymptote, which is not visually ap- parent in the data, we do not believe that enough older age-groups were included in the regressions
565

FISHERY BULLETIS: YOL. iJ, NO. 3
Islands area. Part I - The Hawaiian long-line fishery. Commer. Fish. Rev. 121 1):l-23.
KOTO. T.. ASD K. KODAMA. 1962. Some considerations on the growth of Marlins, using
size-frequencies in commercial catches. I. Attempts to estimate the growth of Sailfish. [In Jap., Engl. atstr .] Rep. Nankai Reg. Fish. Res. Lab. 597-108.
KUME. S.. A N D J. JOSEPH. 1969. Sizecomposition and sexual maturity of billfish caught
by ?he Japanese longline fishery in the Pacific Ocean east of 130”W. Bull. Far Seas Fish. Res. Lab. (Shimizu) 21 15-162.
MATSCMOTO, W. M.. A N D T. K. KAZAMA. 1971. Occurrence of young billfishes in the central Pacific
Ocean. I n R. 3. Shomura and F. Williams (editors). Proceedings of the International Billfish Symposium, Kailua-Kana. Hawaii. 9-12 August 1972. Part 2. Review and contributed papers, p. 238251. C.S. Dep. Commer., NOAA Tech. Rep. NMFS SSRF-675.
NAKAYCRA. H. 1942. On the ecology of the istiophond fishes of Taiwan
waters. [In Jap.] Suisan Gakkwai Hd 9:45-51. 1949. The tunas and their fisheries. Takeuchi Shdbo, Tokyo,
118 p. (Translated from Jap. by W. G. Van Campen. 1952. U. S. Fish Wildl. Serv.. Spec. Sci. Rep. Fish. 82. 115 p.)
OTSU, T. 1954. Analysis of t he Hawaiian long-line fishery.
1948-52. Commer. Fish. Rev. 16(9):1-17. RICXER, W. E.
1973. Linear regressions in fishery research. J. Fish. Res. Board Can. 30409-434.
ROYCE. W. F. 1957. Observations on the spearfishes of the central
Pacific. C.S. Fish Wildl. Se rv.. Fish. Bull. 57:197-554. SIEGEL, S.
1956. Sonparametric statistics for the behavorial sci- ences. McGraw-Hill. S.Y.. 312 p.
SIMPSON. G. G.. A. ROE, AND R. C. LEWONTIN. 1960. Quantitative zoology. Revised ed. Harcourt. Brace
and Co.. N.Y., 440 p. SKILLMAN. R. A,, W D M. T. Y. YONG.
1974. Length-weight relst ionships for six species of billfishes in the central Pacific Ocean. I n R. S. Shomura and F. Williams (editors,. Proceedings of the Internation- al Billfish Symposium. Kailua-Kona. Hawaii. 9-12 August 19’72. Part 2 Review and contributed papers, p. 126137. US. Dep. Commer.. NOAA Tech. Rep. NMFS SSRF-675.
1974. Migration patterns of Istiophoridae in the Pacific Ocean as determined by cooperative tagging pro- grams. I n R. S. Shomura and F. Williams (editors). Proceedings of the International Billfish Symposium, Kailua-Kana. Hawaii. 9-12 August 1972. Part 2. Review and contributed papers. p. 26-237. C.S. Dep. Commer.. NOAA Tech. Rep. NNFS SSRF-675.
SQUIRE, J . L.. JR.
STRASBLRG. D. W. 19‘70. A report on the billfishes of the central Pacific Ocean.
Bull. Mar. Sci. 20575-604. YOSC. M. Y. Y.. .ASD R. A. SKILLUAN.
1975. .A computer program for analysis of polymodal frequency distributions (ENORMSEP), FORTRAN IV. Fish. Bull., U.S. 73681.
to obtain valid estimates of L, or K. Among fishery biologists, there seems to be less of a consensus on the maximum size of females than of males, but generally it is thought that female blue marlin have a maximum weight of less than 900 kg. Hence, our estimates of L, seemed too large.
ACKNOWLEDGMENTS
The efforts of many people collecting data over a 10-yr period from the fresh fish auctions in Ho- nolulu have made this paper possible. Thanks are extended to James B. Reynolds, Luis R. Rivas. Michael F. Tillman, and the anonymous reviewers for their helpful comments on an earlier version of this manuscript.
LITERATURE CITED
ABRAMSON, N. J. (compiler). 1971. Computer programs for fish stock assessment. FA0
Fish. Tech. Pap. 101, [149 p.] CASIE, R. M.
1954. Some uses of probability paper in the analysis of size frequency distributions. Aust. J. Mar. Freshwater Res. 5513-522.
DE SYLVA, D. P. 1957. Studies on the age and growth of the Atlantic sailfish.
Istiophonis americanus (Cuvier), using length-frequency curves. Bull. Mar. Sei. Gulf Caribb. 71-20.
DE SYLVA, D. P.. AND W. P. DAVIS. 1963. White marlin, Tetrapturus alhidus. in the ,Middle
Atlantic Bight, with observations on the hydrography of the fishing grounds. Copeia 1963:81-99.
ELDRIDGE. M. B., AND P. G. WARES. 1971. Some biological observations of billfishes taken in the
eastern Pacific Ocean, 1967-1970. I n R. S. Shomura and F. Williams (editors), Proceedings of the International Billfish Symposium, Kailua-Kana, Hawaii. 9-12 August 1972. P a r t 2. Review and contr ibuted papers , p. 89-101. US. Dep. Commer.. NOAA Tech. Rep. XMFS SSRF-675.
ERDMAN, D. S. 1968. Spawning cycle, sex ratio, and weights of blue marlin
of€ Puerto Rico and the Virgin Islands. Trans. Am. Fish. Soc. 97:131-137.
F.ABENS, A. J. 1965. Properties and fitting of the van Bertalanfly growth
curve. Growth 3265-289. HARDING. J. P.
1949. The use of probability paper for the graphical analysis of polymodal frequency distributions. J. Mar. Bioi. .lssoc. U.K. 28:141-153.
HOLLANDER. M., AND D. A. WOLFE.
Sons, Inc., N.Y., 503 p. 1973. Nonparametric statistical methods. John Wiley and
JUNE, F. C. 1950. Preliminary fisheries survey of the Hawaiian-Line
566