Embed Size (px)
Citation preview

California State ParksInterpretation and Education Division
CA
LI
FO
RN
IA
S
TA
TE
P
AR
KS
•
2
01
5
Volunteers in Parks Program
2 0 1 5 A N N U A L R E P O R T

© 2016 California State Parks
California State Parks supports equal access. This publication can be made available in alternate formats. For information call: (800) 777-0369 (916) 653-6995, outside the U.S. 711, TTY relay service www.parks.ca.gov
Questions about this report or request for copies should be directed to: Interpretation and Education Division California State Parks P.O. Box 942896, Sacramento, CA 94296-0001 Phone: (916) 654-2249 [email protected]

California State Parks Interpretation and Education Division
Sacramento, California2016
Volunteers in Parks Program2 0 1 5 A N N U A L R E P O R T

2015 ACTIVITY REPORT VOLUNTEERS IN PARKS PROGRAM
Summary
In 2015, 40,195 volunteers provided a total of 1,266,695 service hours, surpassing the one-million hour benchmark for the eighth consecutive year. These hours represent an equivalent value of more than $34.9 million* to California State Parks. Volunteers enabled state parks to enhance outreach and community engagement activities, services to visitors, and the stewardship of our natural and cultural resources.
A whopping 79% of volunteers —31,855 individuals —participated as short-term (three days or less) volunteers, while 8,340 people made long-term commitments. This number remained around the same levels as in previous years (except for 2014, where higher numbers are ascribed to the 150th Anniversary’s many activities).
Though the total number of volunteers is relatively stable, each volunteer’s average number of hours contributed is 31.51 hours, an increase of nearly 19%. Interpretation continued to represent the largest category of volunteer service, comprising almost 25% of all volunteer hours. Combined, hours donated as campground hosts, in performing maintenance/housekeeping tasks, and public contact functions account for more than 44% of total volunteer hours.
A pie chart providing a visual representation of volunteer hours in each service category follows; program statistics and graphs that give a five-year look at trends in volunteer activity are also included in this report.
Staff Support and Training
In 2015, every staff hour invested in the Volunteers in Parks Program yielded over 10 hours of volunteer service. The total number of staff involved in the program reached a five-year low of 780, and 118,105 staff-support hours represent a 21% decrease from 2014’s activity-rich year.
Volunteer Recognition
Department staff presented 38 Poppy Awards and 9 Volunteer Medallions to outstanding individuals and groups receiving special acknowledgment during 2015.
Program Contact
If you have questions about
this report, please contact Karen Barrett
at (916) 653-8819 or Karen.Barrett@
parks.ca.gov.
*$27.59 per hour as provided by www.independentsector.org. This rate is indexed for California and includes fringe benefits estimated at 12%.
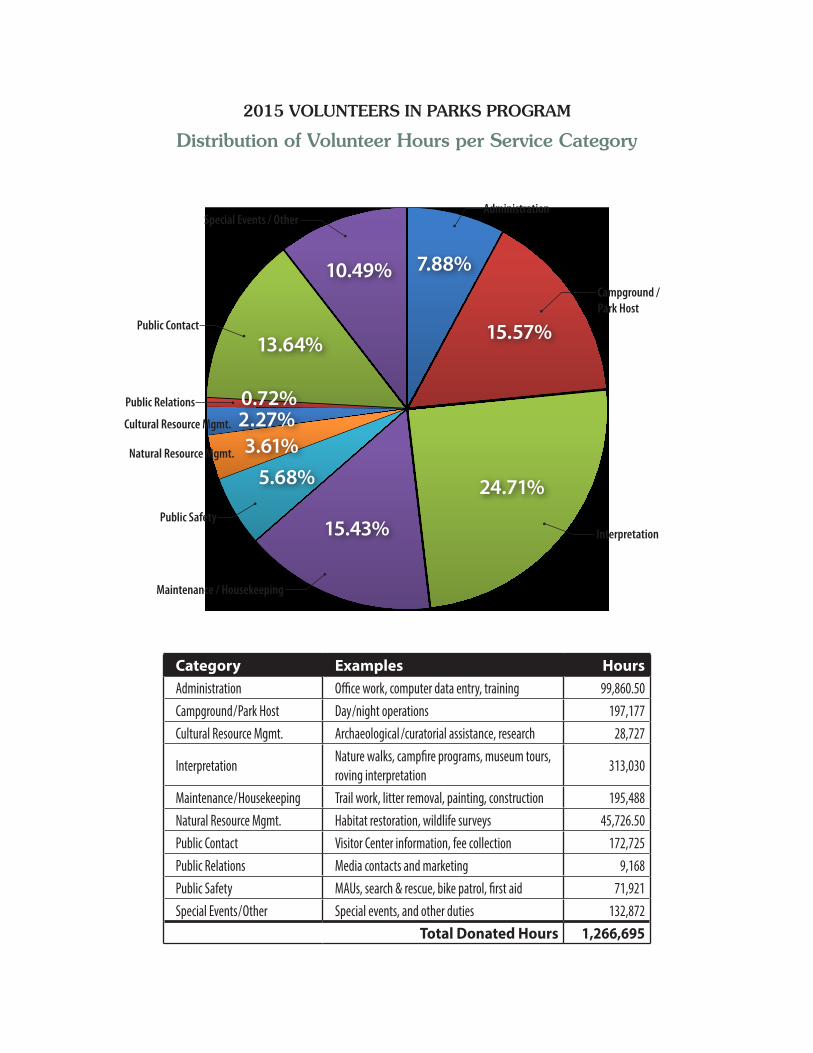
2015 VOLUNTEERS IN PARKS PROGRAM
Distribution of Volunteer Hours per Service Category
Category Examples HoursAdministration Office work, computer data entry, training 99,860.50Campground / Park Host Day /night operations 197,177Cultural Resource Mgmt. Archaeological /curatorial assistance, research 28,727
InterpretationNature walks, campfire programs, museum tours, roving interpretation
313,030
Maintenance / Housekeeping Trail work, litter removal, painting, construction 195,488Natural Resource Mgmt. Habitat restoration, wildlife surveys 45,726.50Public Contact Visitor Center information, fee collection 172,725Public Relations Media contacts and marketing 9,168Public Safety MAUs, search & rescue, bike patrol, first aid 71,921Special Events / Other Special events, and other duties 132,872
Total Donated Hours 1,266,695
Campground / Park Host
Administration
Public Contact
Public Relations
Public Safety
Natural Resource Mgmt.
Cultural Resource Mgmt.
Special Events / Other
Interpretation
24.71%
0.72%
15.43%
5.68%3.61%2.27%
13.64%
10.49% 7.88%
15.57%
Maintenance / Housekeeping
2015 by the Numbers:VIPP Spreadsheets and
5-Year Comparisons
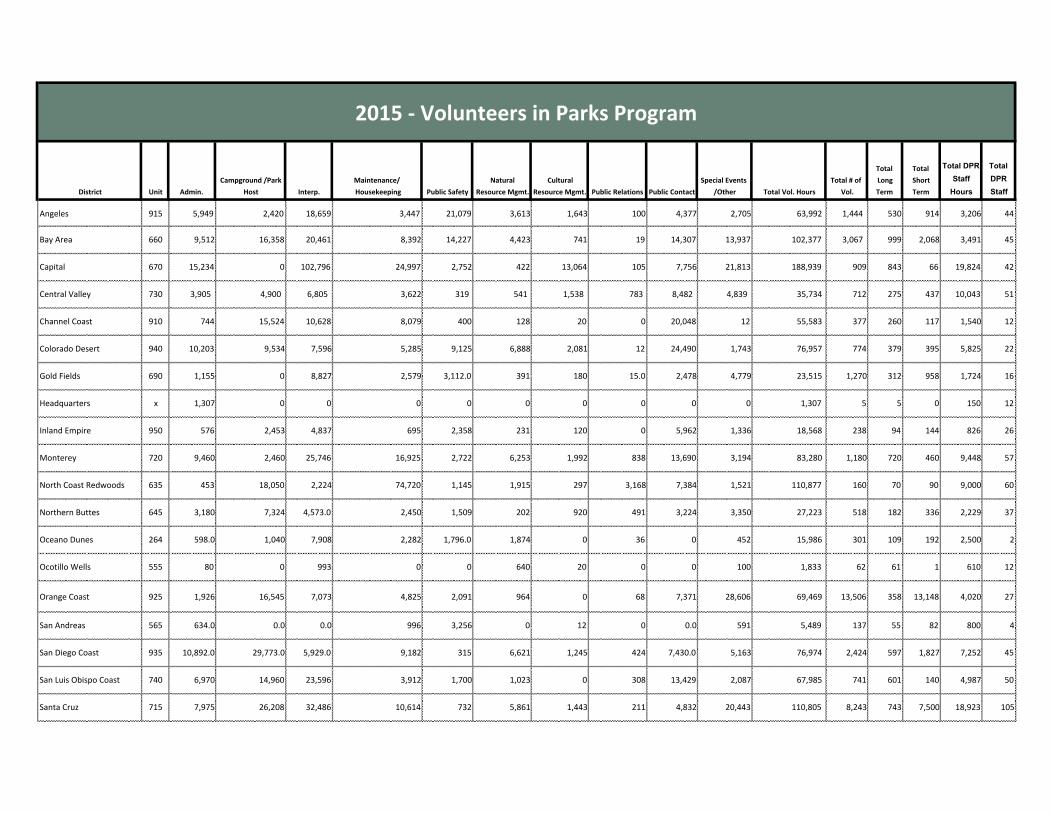
District Unit Admin.Campground/Park
Host Interp.Maintenance/Housekeeping PublicSafety
NaturalResourceMgmt.
CulturalResourceMgmt. PublicRelations PublicContact
SpecialEvents/Other TotalVol.Hours
Total#ofVol.
TotalLongTerm
TotalShortTerm
Total DPR Staff
Hours
Total DPR Staff
Angeles 915 5,949 2,420 18,659 3,447 21,079 3,613 1,643 100 4,377 2,705 63,992 1,444 530 914 3,206 44
BayArea 660 9,512 16,358 20,461 8,392 14,227 4,423 741 19 14,307 13,937 102,377 3,067 999 2,068 3,491 45
Capital 670 15,234 0 102,796 24,997 2,752 422 13,064 105 7,756 21,813 188,939 909 843 66 19,824 42
CentralValley 730 3,905 4,900 6,805 3,622 319 541 1,538 783 8,482 4,839 35,734 712 275 437 10,043 51
ChannelCoast 910 744 15,524 10,628 8,079 400 128 20 0 20,048 12 55,583 377 260 117 1,540 12
ColoradoDesert 940 10,203 9,534 7,596 5,285 9,125 6,888 2,081 12 24,490 1,743 76,957 774 379 395 5,825 22
GoldFields 690 1,155 0 8,827 2,579 3,112.0 391 180 15.0 2,478 4,779 23,515 1,270 312 958 1,724 16
Headquarters x 1,307 0 0 0 0 0 0 0 0 0 1,307 5 5 0 150 12
InlandEmpire 950 576 2,453 4,837 695 2,358 231 120 0 5,962 1,336 18,568 238 94 144 826 26
Monterey 720 9,460 2,460 25,746 16,925 2,722 6,253 1,992 838 13,690 3,194 83,280 1,180 720 460 9,448 57
NorthCoastRedwoods 635 453 18,050 2,224 74,720 1,145 1,915 297 3,168 7,384 1,521 110,877 160 70 90 9,000 60
NorthernButtes 645 3,180 7,324 4,573.0 2,450 1,509 202 920 491 3,224 3,350 27,223 518 182 336 2,229 37
OceanoDunes 264 598.0 1,040 7,908 2,282 1,796.0 1,874 0 36 0 452 15,986 301 109 192 2,500 2
OcotilloWells 555 80 0 993 0 0 640 20 0 0 100 1,833 62 61 1 610 12
OrangeCoast 925 1,926 16,545 7,073 4,825 2,091 964 0 68 7,371 28,606 69,469 13,506 358 13,148 4,020 27
SanAndreas 565 634.0 0.0 0.0 996 3,256 0 12 0 0.0 591 5,489 137 55 82 800 4
SanDiegoCoast 935 10,892.0 29,773.0 5,929.0 9,182 315 6,621 1,245 424 7,430.0 5,163 76,974 2,424 597 1,827 7,252 45
SanLuisObispoCoast 740 6,970 14,960 23,596 3,912 1,700 1,023 0 308 13,429 2,087 67,985 741 601 140 4,987 50
SantaCruz 715 7,975 26,208 32,486 10,614 732 5,861 1,443 211 4,832 20,443 110,805 8,243 743 7,500 18,923 105
2015-VolunteersinParksProgram

District Unit Admin.Campground/Park
Host InterpMaintenance/Housekeeping PublicSafety
NaturalResourceMgmt.
CulturalResourceMgmt. PublicRelations PublicContact
SpecialEvents/Other TotalVol.Hours
Total#ofVol.
TotalLongTerm
TotalShortTerm
Total DPR Staff
Hours
Total DPR Staff
Sierra 683 5,045 5,949 11,245 5,001 1,927 179 1,526 347 14,587 1,908 47,714 617 549 68 4,745 50
Sonoma-MendocinoCst. 651 2,456 22,262 7,585 5,324 237 2,802 1,630 2,200 11,444 5,832 61,772 2,375 447 1,928 5,468 39
Tehachapi 900 1,607.0 1,417 2,795 1,748 0 414 255 43 1,434 3,828 13,541 659 151 508 1,355 16
TwinCities 558 0 0 269 413 1,119 342 0 0 0 4,633 6,776 476 0 476 139 6
Totals 99,860.5 197,177 313,030 195,488 71,921 45,726.5 28,727 9,168 172,725 132,872 1,266,695 40,195 8,340 31,855 118,105 780
%ofTotal 7.88% 15.57% 24.71% 15.43% 5.68% 3.61% 2.27% 0.72% 13.64% 10.49%
ValueofVolunteers'Contribution*
40,1951,266,695
$27.59
$34,948,115.05
2015VIPProgramFiguresataGlance
2015-VolunteersinParksProgram(cont.)
2015DPRInvestmentinVIPProgramTotalNumberofVIPs
ValueperVolunteerServiceHour*
TotalVolunteerHours(equalto608employees**)
TotalNumberofDPRStaff
TotalDPRStaffHours
AverageValueperServiceHour**
*Valueprovidedbywww.independentsector.orgindexedforCalifornia;valueincludesanestimated12%addedforfringebenefits.**Full-timeEquivalent
**CalculatedbyusingthemidpointhourlywageofaStateParkPeaceOfficer(Ranger)includingemploymentbenefits.
780
118,105
$41.72
$4,927,340.60CostofParkStaffHours**

DistrictTotalVolunteer
HoursTotal#of
VolunteersTotalDPRStaff
HoursTotalDPR
StaffVolunteerHoursReceivedperStaff
HoursInvested
Angeles 63,991 1,444 3,206 44 19.96
BayArea 102,377 3,067 3,491 45 29.33
Capital 188,939 909 19,824 42 9.53
CentralValley 35,734 712 10,043 51 3.56
ChannelCoast 55,583 377 1,540 12 36.09
ColoradoDesert 76,957 774 5,825 22 13.21
GoldFields 23,515 1,270 1,724 16 13.64
Headquarters 1,307 5 150 12 8.71
InlandEmpire 18,568 238 826 26 22.48
Monterey 83,280 1,180 9,448 57 8.81
NorthCoastRedwoods 110,877 160 9,000 60 12.32
NorthernButtes 27,223 518 2,229 37 12.21
OceanoDunes 15,986 301 2,500 2 6.39
OcotilloWells 1,833 62 610 12 3.00
OrangeCoast 69,469 13,506 4,020 27 17.28
SanAndreas 5,489 137 800 4 6.86
SanDiegoCoast 76,974 2,424 7,252 45 10.61
SanLuisObispoCoast 67,985 741 4,987 50 13.63
SantaCruz 110,805 8,243 18,923 105 5.86
Sierra 47,714 617 4,745 50 10.06
Sonoma-MendocinoCoast 61,772 2,375 5,468 39 11.30
Tehachapi 13,541 659 1,355 16 9.99
TwinCities 6,776 476 139 6 48.75
Total 1,266,695 40,195 118,105 780AverageVol.Hrs.ReceivedperStaffHr. 10.73
2015-VolunteersInParksProgramParkStaff/VolunteerHours

Year NumberofVolunteers2011 27,6382012 35,6592013 39,6132014 54,8982015 40,195
Year VolunteerHoursContributed2011 1,088,2582012 1,107,7822013 1,117,0492014 1,454,7042015 1,266,695
A5-YearLookattheVolunteersInParksProgram2011-15
0
10,000
20,000
30,000
40,000
50,000
60,000
2011 2012 2013 2014 2015
NumberofVolunteers2011-15A5-YearComparison
NumberofVolunteers
0
500,000
1,000,000
1,500,000
2,000,000
2011 2012 2013 2014 2015
VolunteerHoursContributed2011-15A5-YearComparison
VolunteerHours
Note:2014markedthe150thAnniversaryofCaliforniaStateParks; theincrease inevents,interpretiveprogramming,andaHeadquarter'ssuppliedactivitytoolkitlikelyswelled volunteerandstaffparticipation.Thetrendlineisstable, 2014isananomaly.

Year Long-TermVolunteers2011 8,6722012 8,7572013 8,6812014 9,8092015 8,340
Year Short-TermVolunteers2011 19,2412012 26,9022013 30,9322014 45,0892015 31,855
A5-YearLookattheVolunteersInParksProgram2011-15(cont.)
7,500
8,000
8,500
9,000
9,500
10,000
2011 2012 2013 2014 2015
Long-TermVolunteers2011-15A5-YearComparison
Long-TermVolunteers
010,00020,00030,00040,00050,000
2011 2012 2013 2014 2015
Short-TermVolunteers2011-15A5-YearComparison
Short-Term
Note:2014markedthe150thAnniversaryofCaliforniaStateParks; theincrease inevents,interpretiveprogramming,andaHeadquarter'ssupplied activitytoolkitlikelyswelled volunteerandstaffparticipation.Thetrendlineisstable, 2014isananomaly.
Short-TermVolunteers

YearNumberofStateParkStaffInvolvedwithVIPP
2011 8162012 9112013 9222014 9432015 780
YearStateParkStaffHoursContributedtoVIPP
2011 97,6792012 94,6442013 111,8282014 150,1042015 118,105
A5-YearLookattheVolunteersInParksProgram2011-15(cont.)
0
500
1,000
2011 2012 2013 2014 2015
NumberofStateParkStaffWhoWorkWithVolunteers2011-15A5-YearComparison
NumberofStateParkStaffInvolvedwith
0
50,000
100,000
150,000
200,000
2011 2012 2013 2014 2015
StateParkStaffHoursContributed2011-15A5-YearComparison
StateParkStaff
Note:2014markedthe150thAnniversaryofCaliforniaStateParks; theincrease inevents,interpretiveprogramming,andaHeadquarter'ssupplied activitytoolkitlikelyswelled volunteerandstaffparticipation.Thetrendlineisstable, 2014isananomaly.
Number of Staff
Staff Hours
State Park Staff HoursContributed to VIPP