Embed Size (px)
Citation preview

United States Environmental Protection Aaencv . , I
EP41625 9-89 009 Apr 1989 Technology Transfer
GEpA Volumetric Tank Testing: An Overview

I EPiV625/9-891009
ADriI 1989
Volumetric Tank Testing: An Overview
Center for Environmental Research Information Office of Research and Development U.S. Environmental Protection Agency
Cincinnati, OH 45268
,

Contents
1.
2.
3.
4.
5.
6.
7.
8.
9.
10.
11.
Introduction 1
The EPA Program 3
Types of Volumetric Tank Tests
Volumetric Tank Testing 7
Conducting a Volumetric
5
Tank Test 13
Performance 15
Results of the Edison Evaluation 17
Applying the Results 25
Checklist for Good Performance 27
References 33
Glossary 35

1. Introduction
Background In the United States there are several million underground storage tanks containing petroleum fuels and chemicals. It is estimated that 10 to 25% of them may be leaking. This translates to up to one half million leaking tanks in the U.S. The contamination of groundwater that results from such leaks is a serious environmental threat and one that impacts public health directly, for in most states at least 50% of the potable water supply comes from underground sources. In 1984 (through the Hazardous and Solid Waste Amendments to the Resource Conservation and Recovery Act of 1976) the U.S. Environmental Protection Agency (EPA) was charged with developing regulations for the detection of releases from underground storage tanks. The new regulations [l], issued in September 1988, state that all volumetric tank test methods must, within two years, have the capability of detecting leaks as small as 0.1 gallons per hour with a probability of detection' of 95% and a probability of false alarm of 5%.
There are many commercially available methods for detecting leaks in underground storage tanks. Those which are the most widely used in the petroleum industry are in a category called volumetric tank tests (also known as "precision," "tank tightness," or "tank integrity" tests). The premise of a volumetric tank test. and hence its name, is that any change in the volume of fluid within a tank can be interpreted as a leak. Detection of these leaks is difficult because there are many physical mechanisms which produce volume changes that can be mistaken for
~~~
1Gld type denotes a term that IS defined in the Q Io s sa ry .
leaks. Most of the volumetric tank tests on the market today claim the ability to detect leaks as small as 0.05 gallons per hour. (This is the "practice" recommended by the National Fire Protection Association [2] for volumetric tests in tanks less than 12,499 gallons in capacity, a category that includes most of the tanks at retail gasoline stations, i.e., those addressed in the EPA regulations.) These volumetric tank iests. however, do not specify their reliability in terms of probability of detection and probability of false alarm against this 0.05- gallon-per-hour leak rate. A performance of 0.1 gallons per hour with a probability of detection of 95% and a probability of false alarm of 5% represents a realistic goal in terms of the current technology. A performance of 0.05 gallons per hour with the same 95% probability of detection and 5% probability of false alarm would be, at best, difficult to achieve.
Approach This report summarizes the technical findings of an EPA study on volumetric tank testing.
It describes the results of the €PA study, which evaluated the viability of volumetric tank tests as a means of detecting leaks in underground storage tanks.
It explains the accuracy requirements specified in the EPA regulations concerning the testing of underground storage tanks for leaks.
i It presents information that will aid the user in selecting a volumetric tank test method that meets these regulations.
1

The EPA study found that volumetric tank tests are a viable means of monitoring underground storage tanks for leaks. It determined that the concept of volumetric tank testing is intrinsically sound, as are most of the physical devices used in testing. In general, performance shortcomings were found to be procedural in nature. That is, it was not the devices themselves, but the way in which they were used, that detracted from performance. The study concluded that volumetric testing can meet regulatory standards and is an important tool in minimizing the effect of leaks from underground storage tanks.
This document is intended for state and local regulators and small tank owners and
operators. The reader who wants more technical detail is referred to the EPA document Evaluation of Volumetric Leak Detection Methods for Underground Fuel Storage Tanks [3], a comprehensive repo; on the results of the EPA evaluation. It contains the objectives and the chronolog of the experiments, a thorough explanatior of the engineering principles underlying tf experiments, and a comprehensive analysis of the results. In addition, the document includes the evaluation reports written for each of the 25 test methods. It available from the National Technical Information Service.
2. The EPA Program
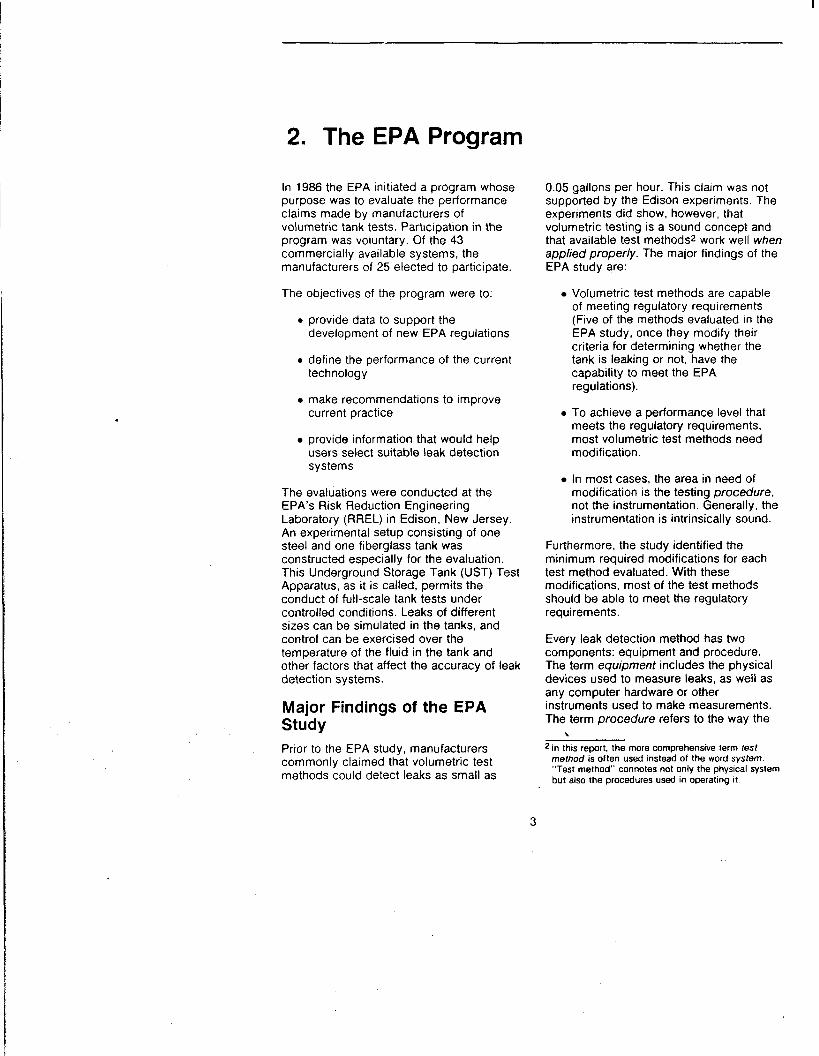
In 1986 the EPA initiated a program whose purpose was to evaluate the performance claims made by manufacturers of volumetric tank tests. Participation in the program was voluntary. Of the 43 commercially available systems, the manufacturers of 25 elected to participate.
0.05 gallons per hour. This claim was not supported by the Edison experiments. The experiments did show, however, that volumetric testing is a sound concept and that available test methods2 work well when applied properly. The major findings of the EPA study are:
The objectives of the program were to:
0 provide data to support the development of new EPA regulations
0 define the performance of the current technology
current practice
provide information that would help users select suitable leak detection systems
make recommendations to improve
The evaluations were conducted at the EPA's Risk Reduction Engineering Laboratory (RREL) in Edison, New Jersey. An experimental setup consisting of one steel and one fiberglass tank was constructed especially for the evaluation. This Underground Storage Tank (UST) Test Apparatus, as it is called, permits the conduct of full-scale tank tests under controlled conditions. Leaks of different sizes can be simulated in the tanks, and control can be exercised over the temperature of the fluid in the tank and other factors that affect the accuracy of leak detection systems.
Major Findings of the EPA Study
Volumetric test methods are capable of meeting regulatory requirements (Five of the methods evaluated in the EPA study, once they modify their criteria for determining whether the tank is leaking or not, have the capability to meet the EPA regulations).
To achieve a performance level that meets the regulatory requirements, most volumetric test methods need modification.
In most cases, the area in need of modification is the testing procedure, not the instrumentation. Generally, the instrumentation is intrinsically sound.
Furthermore, the study identified the minimum required modifications for each test method evaluated. With these modifications, most of the test methods should be able to meet the regulatory requirements.
Every leak detection method has two components: equipment and procedure. The term equipment includes the physical devices used to measure leaks, as well as any computer hardware or other instruments used to make measurements. The term procedure refers to the way the
Prior to the €PA studv. manufacturers 2in this report, the more comprehensive term rest method I S often used instead of the word sysrem "Test method" connotes not only the physical system but also the procedures used in operating it
commonly claimed th'at volumetric test methods could detect leaks as small as
3

test is conducted; it includes not only the role of the test operator but also the data analysis scheme, detection criterion, temperature-compensation scheme, and procedures for calibrating the instruments. When a method did not function as well as it could have, the cause was almost invariably some aspect of procedure. Two classes of procedural failures were noted: (1) the instructions were incorrect or were inappropriate; (2) the instructions were not followed. It is significant that the limitations of these volumetric test methods turned out to be in the realm of procedure rather than
. equipment. Procedural changes chn generally be made with less effort than equipment changes.
The equipment itself has no intrinsic ranking. The ranking depends on how the test method is used. Because procedural changes are so readily implemented, any ranking implicit in the EPA study is alread outdated The study's value lies not in ranking various methods but in identifying features common to methods with high performance.
4
iere is and it
test
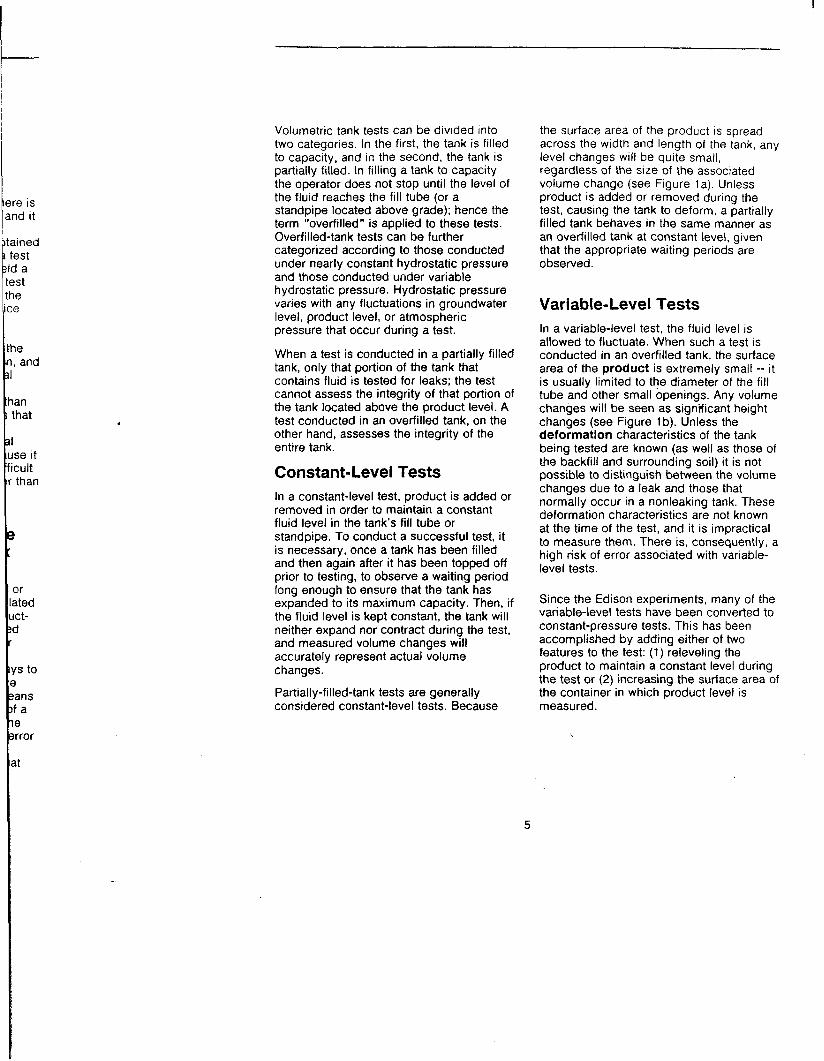
Volumetric tank tests can be divided into two categories. In the first, the tank is filled to capacity, and in the second, the tank is partially filled. In filling a tank to capacity the operator does not stop until the level of the fluid reaches the fill tube (or a standpipe located above grade); hence the term "overfilled" is applied to these tests. Overfilled-tank tests can be further categorized according to those conducted under nearly constant hydrostatic pressure and those conducted under variable hydrostatic pressure. Hydrostatic pressure varies with any fluctuations in groundwater level, product level, or atmospheric pressure that occur during a test.
When a test is conducted in a partially filled tank, only that portion of the tank that contains fluid is tested for leaks; the test cannot assess the integrity of that portion of the tank located above the product level. A test conducted in an overfilled tank, on the other hand, assesses the integrity of the entire tank.
Constant-Level Tests In a constant-level test, product is added or removed in order to maintain a constant fluid level in the tank's fill tube or standpipe. To conduct a successful test, it is necessary, once a tank has been filled and then again after it has been topped off prior to testing, to observe a waiting period long enough to ensure that the tank has expanded to its maximum capacity. Then, if the fluid level is kept constant, the tank will neither expand nor contract during the test, and measured volume changes will accurately represent actual volume changes.
Partially-filled-tank tests are generally considered constant-level tests. Because
5
the surface area of the product is spread across the width and length of the tank, any level changes will be quite small, regardless of the size of the associated volume change (see Figure 1 a). Unless product is added or removed during the test, causing the tank to deform, a partially filled tank behaves in the same manner as an overfilled tank at constant level, given that the appropriate waiting periods are observed.
Variable- Level Tests In a variable-level test, the fluid level is allowed to fluctuate. When such a test is conducted in an overfilled tank, the surface area of the product is extremely small -- it is usually limited to the diameter of the fill tube and other small openings. Any volume changes will be seen as signfficant height changes (see Figure 1 b). Unless the deformation characteristics of the tank being tested are known (as well as those of the backfill and surrounding soil) it is not possible to distinguish between the volume changes due to a leak and those that normally occur in a nonleaking tank. These deformation characteristics are not known at the time of the test, and it is impractical to measure them. There is, consequently, a high risk of error associated with variable- level tests.
Since the Edison experiments, many of the variable-level tests have been converted to constant-pressure tests. This has been accomplished by adding either of two features to the test: (1) releveling the product to maintain a constant level during the test or (2) increasing the surface area of the container in which product level is measured.

I
:an t than
Partially Filled Tank
isic how the
icedural lted, any is already lot in jentifying !h high
A
Adding a quart of liquidto this tank wouldproduce a barely noticeable rise in the level of fluid. Level changes are distributed over a large surface area, so that even large volume changes produce only very small level changes.
Overfilled Tank
R pq :.:.:.:.:.:.:.: .... . ........
8 Adding a quart of liquid to this tank would cai the fluid to rise many inches. Here the surf; area is very small. Thus, even a small volu. change can mean a drastlc level change. B
consequently, a large change in pressure on : tank walls.
Figure 1 . The same volume change can produce very different level changes depending whether the tank is partially filled or overfilled.
6

lume . than ression so I t
this, :kfill . The
ipacity e al test.
iting .O
I the 1. In
3
due to
um,the or juct- it. This inge the
1
'ncr> 7
?
luct, the e ends) level of
4. Volumetric Tank Testing
Detecting a leak by means of volumetric testing is akin to the statistical problem of finding a signal in a background of noise. The "signal" is the volume change that is due to a leak, and the "noise" is the sum of all the volume changes due to factors other than a leak. A volumetric tank test measures the change in the volume of fluid ("product") in the tank and attributes this change, once all other sources of noise have been accounted for, to a leak. Most methods measure changes in the level of the product and convert these to volume changes using a height-to-volume conversion factor (h-to-v); this is the technique used in variable-level tests. Others measure volume directly; this is the technique used in constant-level tests. A leak is defined in terms of flow rate in gallons per hour and can be positive or negative; that is, product can flow out of the tank or groundwater can flow into the tank. Once the flow rate has been established, a decision must be made as to whether to declare the tank in question leaking or nonleaking. This decision is usually made by comparing the flow rate to a predetermined value (called the "threshold"); if the flow rate exceeds the threshold, a leak is declared.
Unfortunately, a leak is not the only physical mechanism responsible for changes in the level and volume of product. There are a number of physical mechanisms that can contribute to either real or apparent volume changes, whether the tank is leaking or not. The best- performing methods can differentiate between these non-leak-related volume changes and an actual leak.
It is a common perception that if the equipment is working properly the test will
yield the actual leak rate. In reality, there is always some variation in test results, and it is likely that even with the same test method a different flow rate will be obtained each time a test is conducted. Even a test on a nonleaking tank will generally yield a value different from zero. Variation in test results stems from three sources: ( 1 ) the equipment itself, (2) operational practice (how the test is conducted), and (3) environmental considerations such as thermal expansion and contraction of the product, evaporation and condensation, and the way these and other environmental factors interact. For best results, the instrumentation noise should be less than the environmental noise. This ensures that the instrumentation will not limit the detection of small leaks. Environmental noise is the more acute problem because it can be difficult to predict, it can be difficult to compensate for, and it can be larger than the leak itself.
Normally Occurring Volume Changes Can Mask a Leak There are at least five sources of environmentally induced product-level or product-volume changes that are unrelated to a leak. These non-leak-related product- level or product-volume changes (called "ambient noise") can be as large as or larger than the smallest leaks to be detected. There are many effective ways to compensate for ambient noise. The five sources of ambient noise are by no means equal in their impact on the accuracy of a test. The first three are likely to have the most deleterious effects, because the error associated with them is large. The retnainder are responsible for errors that are small by comparison.
7

7. Thermal Expansion and Contraction of the Product
Temperature fluctuations cause expansion and contraction of the p d u c t . Expansion and contraction represent changes in volume that can easily be mistaken for a leak unless they are taken into consideration when overall volume changes are calculated. When product is added to the tank (for example, during a delivery or during topping to fill the tank to its maximum capacity), the temperature increases or decreases as the product seeks thermal equilibrium with the surrounding backfill, native soil, and groundwater. Similarly, newly added product seeks equilibrium with the product that is already in the tank, and vice versa. Thus, temperature fluctuations are at their peak in the period immediately following a delivery of product or following topping (see Figure 2.) The importance of compensating for these temperature changes cannot be overemphasized. The volume changes produced by expansion and contraction of the product are real, and may be as large as 1 gallon per hour, but
Cap '.( Concrete )
they are not in any way associated wlth a leak.
2. Expansion and Contractior of Vapor Pockets In addition to their direct influence on the product, temperature fluctuations can alsc cause the expansion or contraction of vaF pockets that are almost always present after a tank has been filled to capacity. Here. though. temperature is not the sole influence
Vapor pocket size can also be affected by atmospheric pressure and by pressure changes resulting from product-level changes When the volume of the trappec vapor changes, there is a resultant chang in the level of the product; this latter change may mistakenly be interpreted as leak. Despite efforts to "bleed" the tank c trapped vapor, pockets large enough to adversely affect the outcome of a test ma still be present. Vapor pockets in quantitit as small as 10 gallons can influence a tes result in a 10,000-gallon tank. It is virtuall: impossible to determine the exact size of vapor pockets. However, when the vapor pocket is large, i.e.. greater than 10 to 20
Concrete Cap
Fill Tube Product Level
A A large amount of product has just been added to an underground tank that was already partly filled. In this example, the new product is cooler than the resident product and sinks. The temperature of the product throughout the tank fluctuates greatly.
B As the old product cools and the new warm equilibrium is reached. But the temperature a whole is cooler, causing the product to contra and the level to go down. (The inverse is tri when a large amount of warmer product is adde causing the product to expand and the level rise.)
Figure 2. How temperature changes can be mistaken for a leak.
8

gallons, it is possible to determine that trapped vapor is present. The procedure for doing this is explained in [3]. If vapor pockets of 10 to 20 gallons or more are shown to be present, or if for any reason (for example, if the tank is tilted) it is suspected that they are present, the tank and lines should again be bled; if vapor pockets are shown to be largely absent, testing may proceed.
3. Structural Deformation of the Tank Whether it is constructed of steel or fiberglass, and whether it is embedded in a dense backfill or in a loose one that has more “give,” the tank itself expands and contracts in response to both level and temperature changes. This phenomenon is known as structural deformation. When the tank expands, the level of the fluid inside it goes down; conversely, when it contracts, the level goes up. The height changes produced by the change in the volume of the tank may also be mistaken for a leak (see Figure 3). There are two types of structural deformation: (1) the instantaneous deformation that appears immediately after any change in product level and (2) the time-dependent relaxation of the tank. Instantaneous deformation is
accounted for when the height-to-volume conversion factor is measured rather than calculated. The instantaneous compression and expansion of trapped vapor is also accounted for in this way. What is not accounted for is the time-dependent relaxation of the tank. In order to do this, the amount of “give” of the tank, backfill and surrounding soil must be known. The length of time it takes for the tank to expand or “relax” to its maximum capacity must also be known. Generally, these values are not known during an actual test. However, the effects of structural deformation can be minimized by introducing a waiting period. The waiting period varies from one tank system to another. Efficient testing requires an analysis algorithm to determine when the effects of deformation have subsided. In the Edison tanks, time-dependent deformation took 15 hours or more to subside.
Even when expansion or contraction due to sudden, large, man-made changes in product level has reached its maximum, the tank continues to deform, expanding or contracting in response to every product- level change that occurs during a test. This occurs regardless of whether the change was produced by a leak or by one of the
A B An emply underground tank has just been filled with product.
In response to the pressure of the product, the walls of the tank (the sides as we// as the ends) begin to deflect or “deform,” and the level of tlre product goes down.
Figure 3. How structural deformation of the tank can be mistaken for a leak.
9

i !ed with a I'raction
-25 min
I
I
I
e vapor 10 to 20
qew warms,
five environmental noise sources. It can be a problem during a variable-level test if the tankibackfillisoil system is highly elastic and the tank is overfilled. In a case like this, interpretation of the results is difficult. because the measured volume changes are always smaller than the actual volume changes. The reason for this is that any increase in product level at the start of a test causes the tank to expand in response to the increased pressure; product level then drops as a result of the expansion of the tank; when the product level drops, the pressure is reduced and the tank contracts; when the tank contracts, the product level rises again at least part of the way back to where it was originally. The product level drops and rises repeatedly. This complex interaction of forces is dependent on the tankibackfillisoil characteristics, which in actual practice are not known. It is best, therefore, to avoid variable-level tests.
4. Evaporation and Condensation within the Tank Unless a tank and its fill tube are completely filled and no air or vapor pockets are present, it is likely that as temperatures change fluid will evaporate
from the free product surface or condense on tank walls. This activity produces volume fluctuations that may be mlstaken for a leak.
5. Waves Mechanical vibrations and other disturbances produce waves; these can be of two types, surface or internal. (In some instances, internal waves can produce surface waves.) Surface waves move aIoni the exposed area of the product in a . partially filled tank, causing a back-and- forth motion comparable to a "bathtub" wave. They may be misinterpreted as changes in fluid level. Internal waves, whic are found in both filled and partially filled tanks, usually occur when there are temperature differences present, such as : the boundary layer between resident and newly added product. The passage of an internal wave causes this boundary layer t undulate vertically so that a temperature sensor at a fixed location records the temperature changes associated with the wave rather than those responsible for volume changes. If the data are undersampled. the waves may appear to produce level or temperature changes,
Sampling Interval
I I I
1-30 min j I Wave Period
6 An example of an appropriate sampling inter\ for the length of the wave period. Data a collected every 15 minutes. so that both the hig and lows are recorded. The average rate change is zero.
Figure 4. Undersampling the data can produce a problem called aliasing. This problem cause errors in estimating the mean rate of change of product level or temperature.
10

tst how
tank.
3. In Jally; kes a ver, cess. a
even though none exist. This problem is called aliasing (see Figure 4). However, i f the data are sampled frequently enough and are averaged, the problem is avoided.
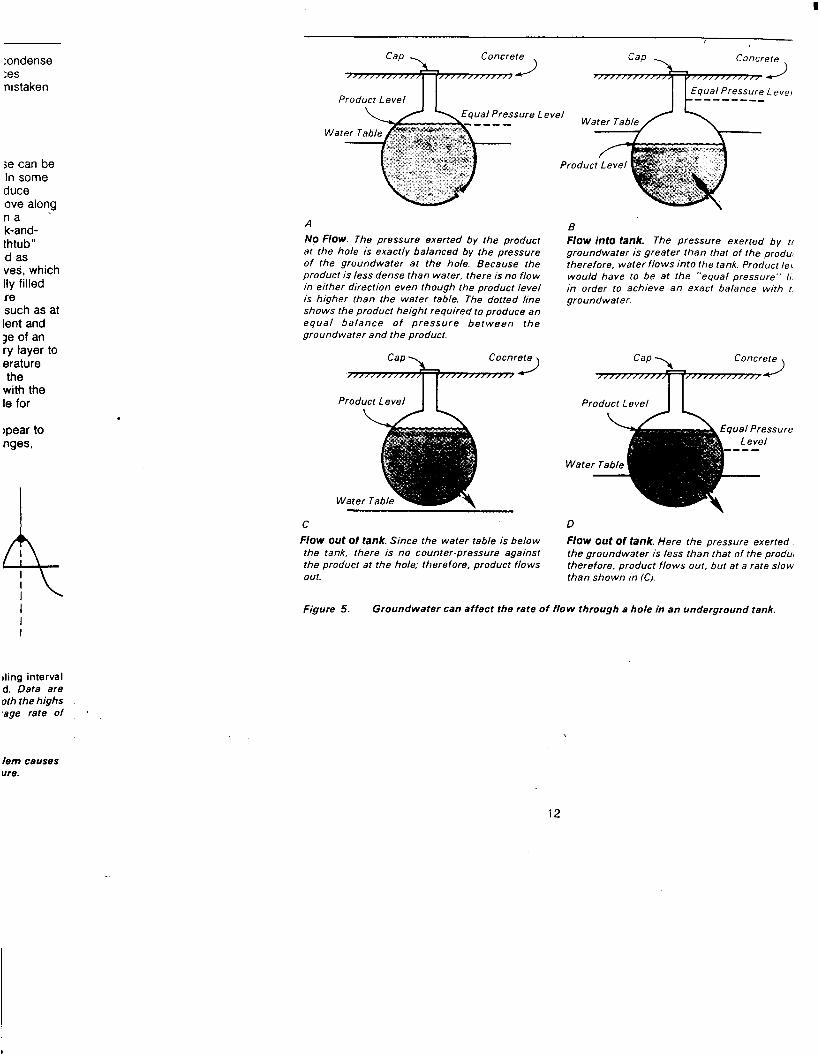
Groundwater Height Can Affect the Size of a Leak There is another factor that can interfere with accurate measurements. Unlike the five listed above, it does not mimic a leak. It does, however, have a direct effect on the size of a leak. This factor is groundwater. The water table of the soil in which a tank is buried can vary in height depending on factors such as geographic location, season, and amount of precipitation. If a tank is leaking, the height of the water table in relation to the tank has a direct effect on the flow rate measured during a test. If the water table is above the location of a hole or fissure in an underground tank, the groundwater exerts a pressure on that hole which counteracts the
pressure exerted on the same hole by the fluid in the tank. There are three possible scenarios. Groundwater can restrict the flow of product out of the tank; it can prevent flow entirely; or it can cause an inflow of water into the tank. As shown in Figure 5, any of these scenarios can alter the rate of a leak. Whenever the groundwater IS above a hole in the tank, it may cause even a large leak to go undetected. Since it is virtually impossible to determine the location of a hole in an underground tank, efforts must be concentrated instead on monitoring the groundwater level. This is accomplished by means of a “monitoring well” installed next to the tank and used to make measurements of the water table. It is important to be aware that when the water table is higher than the bottom of the tank, any test for leaks will be less sensitive. The best test results are obtained when the water table is below the level of the tank. Flow through the hole is then unrestricted by groundwater.
11
:ondense :es nistaken
je can be In some duce ove along n a k-and- thtub" Id as ves, which Ily filled Ire such as at lent and le of an ry layer to erature the
with the le for
)pear to nges,
4
Concrete
/ / / / / / / / / , , I 4J
Equal Pressure Level -- - - -- -__ ual Pressure L eve1
Water Table
A No Flow. The pressure exerted by the product at the hole is exactly balanced by the pressure of the groundwater at the hole. Because the product is less dense than water. there is no flow in either direction even though the product level is higher than the water table. The dotted line shows the product height required to produce an equal balance of pressure between the groundwater and the product. /,";Jy //y,y-y
Product Level
Flow Out of rank. Since the water table is below the tank, there is no counter-pressure against the product at the hole; therefore, product flows out.
B Flow into tank. The pressure exerted by t l groundwater is greater than that of the produ, therefore, water flows into the tank. Product le1 would have to be at the "equal pressure'' 11. in order to achieve an exact balance with t, groundwater.
/ /;/;come> Product Level
Wate
D Flow Out of tank. Here the pressure exerted the groundwater is less than that of the produ, therefore, product flows out. but at a rate slow than shown in IC).
Figure 5. Groundwater can affect the rate of f low through a hole in an underground tank.
ding interval d. Data are 0th the highs 'age rate of
lem causes we.
12

lability elihood
other Ixists
3ns tment e of
sely, d for
sk of
ent on : is, on
is 0.05
5. Conducting a Volumetric Tank Test
Procedures for conducting a volumetric tank test do not differ greatly from one test method to another. (The major differences between test methods are in the instrumentation used to gather data.) The general procedure for conducting an overfilled-tank test is shown in Figure 6; the procedure for a partially-filled-tank test is similar to it. The three procedural steps common to all volumetric test methods are preparation, testing and analysis.
Preparation In order to prepare for a test, the tank must first be filled to the level required for testing. A waiting period must be observed to ensure that two major consequences of filling the tank have subsided: the horizontal differences in the temperature of the product within the tank and the structural deformation of the tank itself. The instrumentation can then be installed. (This can be done during the waiting period.) The instrumentation includes the physical devices used to measure the temperature or volume of the product, for example, thermistors and height or volume sensors. Next (in the case of overfilled-tank tests) the tank is topped. This means making fine adj:Jstments to the fluid level, either by adding or removing small amounts of product, in order to bring this fluid level into conformity with the test method’s requirements for initiating testing. Since any change in product level precipitates temperature differences and structural jeformation, these fine adjustments Qecessitate a second waiting period. The test operator must then determine values for the height-to-volume conversion factor m d the coefficient of thermal sxpansion. Finally, the operator should neasure the height of the water table. This
13
is necessary in order to interpret the test results properly. The preparations are now complete, and testing can begin.
Testing During the test, specialized sensors take measurements of both the temperature and the level (or volume) of the fluid in the tank. In many test methods, temperature and level data are sampled at the same rate. In most cases the data are collected manually; the operator reads an instrument or makes a measurement and then records it on a data sheet. Some manufacturers, h’owever, have automated the data collection process. The decision to end a test is based on a criterion predetermined by the manufacturer. Usually this criterion is expressed in terms of time; for example, the test ends 60 minutes after the start of the data collection. Sometimes the length of test is not fixed. The end of the test depends on some criterion in the data.
Analysis Making sense of the data is the purpose of the analysis. Procedures for converting the level data to volume data, compensating for temperature, and computing a volume rate are usually well defined by the manufacturer of the test method. The end result of the analysis is a calculated volumetric flow rate that indicates how fast fluid is escaping from the tank.
The detection criterion (usually a single threshold value) is applied after the analysis has been completed and is used to determine whether the level changes are due to a leak or to normally occurring volume fluctuations. If the temperature- corapensated volume change exceeds the detection criterion, then a leak is

I
iure Level .--
Ted by the !he product; 'roduct level !ssure" line ce with the
ncr3 v7
/ Pressure eve/ b-
? exerted by the product; rate slower
/ tank.
for Effects of Temperature Fluctuations
C 0
Top Tank il-- t
1 Wait I
Determine
Height-to-Volume Conversion Factor, Coefficient of Thermal Expansion. I and Groundwater Level I
Analyze Data a
1
suspected; if not, it is assumed that 110 le is present. The height-to-volume conversion factcr 1 5
employed to convert level changes measured during the test to volume changes. For example. i f 5 gallons of I I ~ U were poured into a container, and measurement with a ruler showed that the height of the liquid in that container was inches, a height of 3 inches would equal , volume of 1 gallon, making the h-to-v conversion factor equal to 3; this is an example of a direct physical measuremer An h-to-v conversion factor that is derivec mathematically from the geometry of the surface area of the product in the tank m: be in error. In an overfilled tank in particular, the instantaneous change in th, dimensions of the tank due to structural deformation or the compression or expansion of vapor may result in height changes different from those expected foi given volume change. Thus, calculating tt h-to-v factor is considerably less reliable than making a physical measurement.
Using the coefficient of thermal expansior and the total volume of the product in the tank, compensation is made for any temperature changes recorded. The temperature-induced volume changes are then subtracted from the measured VOIUIT: changes, yielding the temperature- compensated volume changes. These are used to determine the volumetric flow rat€
The manufacturers of some test methods use all the data available when they perform the analysis to calculate flow rate Others do not. One anaiysis approach is tg subtract end-of-test data from start-of-test data and divide by the time that has elapsed between the two. Another is to ad all the cumulative volume changes and then divide this sum by the duration of the test. A third approach is to fit a line to the data. Based on the result of the analysis, the tank is declared either leaking or nonleaking.
Figure 6. General procedure for conducting an overfilled-tank test.
14

6. Performance
ers'
Lents A 0 ibed It to ited ition. ate the s input
lany :hod
Performance is the accuracy and reliability of a test method in ascertaining whether a tank is leaking or not. The key to how well a test method performs is its ability to discriminate between the "signal," or volume changes produced by a leak, and the "noise," or other volume changes that normally occur in both leaking and nonleaking tanks. Noise can mask or mimic the signal and thus be confused with the leak. Better performance is expected when the detectable leak is large; i.e., large leaks can be detected with greater reliability than small ones.
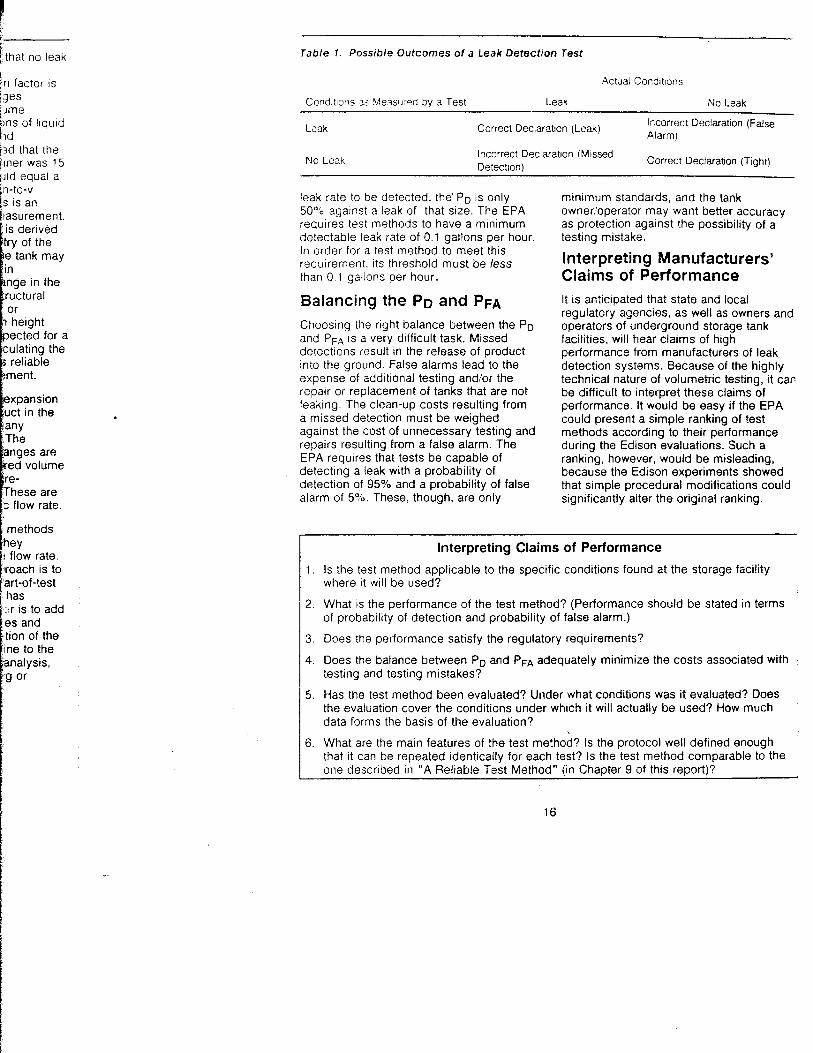
How Performance Is Defined Performance is defined by the test method's probability of detection (PO) and probability of false alarm (PFA) for each leak rate that the method claims to be able to detect. The probability of detection refers to the test's chances of correctly identifying a leaking tank compared to its chances of failing to detect a leak that is actually present. The probability of false alarm refers to a test's chances of reporting the presence of a leak when in fact none exists. There are four possible outcomes of a leak detection test: a correctly identified leak, a correctly identified tight tank, a false aiarm, and a missed detection. These are summarized in Table 1 .
Two of the outcomes in Table 1 constitute accurate test results --- the measured conditions reflect the actual conditions. A leaking tank is correctly identified, or the integrity of a nonleaking tank is confirmed. The other two represent erroneous test results --- the measured conditions do not reflect actual conditions. In a false alarm, a test result mistakenly indicates a leak in a tank that is tight. In a missed detection, a test result indicates that a tank is tight when in reality it is leaking. The likelihood of a
missed detection hinges on the probability of detection. If the Po is 75%, the likelihood of a missed detection is 25%.
Both the PO and the PFA are dependent on the criterion for declaring a leak, that is, on the threshold value set by the manufacturer. If the calculated flow rate exceeds the threshold, it is assumed that a leak is present. Once this threshold value has been selected, the PFA is established; it does not change, even if the leak rate to be detected is changed. The PD, however, does change. The PO increases as the leak to be detected increases. Stated simply, there is a better chance of finding large leaks than small leaks. The threshold can be changed in order to balance the PO and PF* in such a way that there is also an acceptable balance between economic and environmental risks. If the threshold is low (i.e.. if very small leaks are to be detected), the probability of detection is high, but so is the probability of false alarm. On the other hand, if the threshold is high, there exists less chance of false alarm but also a greater probability of missed detections (because the PO is lower). Any adjustment made to the threshold for the purpose of improving the PO carries with it an increased risk of false alarm. Conversely, any adjustment made to the threshold for the purpose of lowering the PFA automatically implies an increased risk of missed detections.
The most commonly used threshold is 0.05 gallons per hour. A threshold of 0.05 gallons per hour might yield high performance (e.g., a PO greater than 99?40) against a leak rate of 1 gallon per hour, but low performance (e.g., a PO less than 10%) against a leak rate of 0.025 gallons per hour. The 0.05-gallon-per-hour threshold is often confused with the leak rate to be detected. If the threshold is equal to the
15
that no leak
n factor is
Jme 1;: of liquid
p e s
, one described in "A Reliable Test Method" (in Chapter 9 of this report)+
Table 1. Possible Outcomes of a Leak Detection Test
Actual Conditions
Conditions 3s Ve?su:od by 3 Test Leak No Leak
Leak Correct Declaration (Leak) Incorrect Declaration (False Alarm)
No Leak Incorrect Declaration (Missed Detection)
Correct DeclaraUon (Tight)
leak rate to be detected, the' PI, is only 50% against a leak of that size. The EPA requires test methods to have a minimum detectable leak rate of 0.1 gallons per hour. In order for a test method to meet this requirement. its threshold must be less than 0.1 gallons per hour.
Balancing the PO and PFA Choosing the right balance between the Po and P F ~ is a very difficult task. Missed detections result in the release of product into the ground. False alarms lead to the expense of additional testing and/or the repair or replacement of tanks that are not leaking. The clean-up costs resulting from a missed detection must be weighed against the cost of unnecessary testing and repairs resulting from a false alarm. The EPA requires that tests be capable of detecting a leak with a probability of detection of 95% and a probability of false alarm of YO. These, though, are only
minimum standards, and the tank 0wner:operator may want better accuracy as protection against the possibility of a testing mistake.
Interpreting Manufacturers' Claims of Performance It is anticipated that state and local regulatory agencies, as well as owners and operators of underground storage tank facilities, will hear claims of high performance from manufacturers of leak detection systems. Because of the highly technical nature of volumetric testing, it car: be difficult to interpret these claims of performance. It would be easy if the EPA could present a simple ranking of test methods according to their performance during the Edison evaluations. Such a ranking, however, would be misleading, because the Edison experiments showed that simple procedural modifications could significantly alter the original ranking.
1 .
2.
3.
4.
5.
6.
Interpreting Claims of Performance
Is the test method applicable to the specific conditions found at the storage facility where it will be used?
What is the performance of the test method? (Performance should be stated in terms of probability of detection and probability of false alarm.)
Does the performance satisfy the regulatory requirements?
Does the balance between Po and PFA adequately minimize the costs associated with testing and testing mistakes?
Has the test method been evaluated? Under what conditions was it evaluated? Does the evaluation cover the conditions under which it will actually be used? How much data forms the basis of the evaluation?
What are the main features of the test method? Is the protocol well defined enough that it can be reDeated identicallv for each test? Is the test method comoarable to the
Smallest e tec table eak Rate
wrm D = 0.99 CA = 0.01 ( g a W
0.50
0.12
2.52
0.23 0.23
0.17 0.23 0.29
3.42
1.04
0.49
0.25 2.85 0.33 1.21
2.94 1.48
1 :::: sormal
mance
7. Results of the Edison Evaluation
Evaluation Approach The experiments conducted at the EPA facility in Edison represent the first attempt at a systematic evaluation of volumetric test methods. The program was designed to accommodate a large number of methods, an approach made possible by the fact that there is a great similarity among volumetric test methods. Based on information provided by the manufacturer, a mathematical description was generated for every test method in the program, and a report describing each method was completed. The manufacturer reviewed the report and concurred that the description was an accurate representation of his test method. It was the method described in the report that was evaluated at Edison. (The salient features of each test method can readily be found in the technical appendices to [3], from which proprietary information has been excised.)
A large computer database of the volume changes that normally occur in nonleaking tanks was developed at the Test Apparatus. These normally occurring changes can mimic or mask a leak. In particular, the database included a wide range of temperature conditions for product, for e,,.ample, conditions representative of seasonal temperature changes nationwide.
This database was entered into a computer along with the mathematical description of each test method. The result obtained was a simulated performance of the test method under many conditions. Moreover, the use of computer simulation made it possible to replicate this broad range of conditions identically for each method. The validity of the simulated performance was confirmed during three days of field testing (at Edison) for each test method. During that time the manufacturers, using their own crews and
equipment, conducted tests whose performance was compared with the simulated performance of their test methods. (In addition, the manufacturers' equipment was calibrated, and the precision and accuracy of the instruments were used as input to the simulation.) A primary goal of the field testing was to verify that the test method was described accurately in the report. It is important to note that the evaluation results presented here are based on a computer simulation. The field test data were used to validate the test-method models that were used as input to the simulation. Each performance estimate was made on the basis of many tank tests simulated with the test-method model.
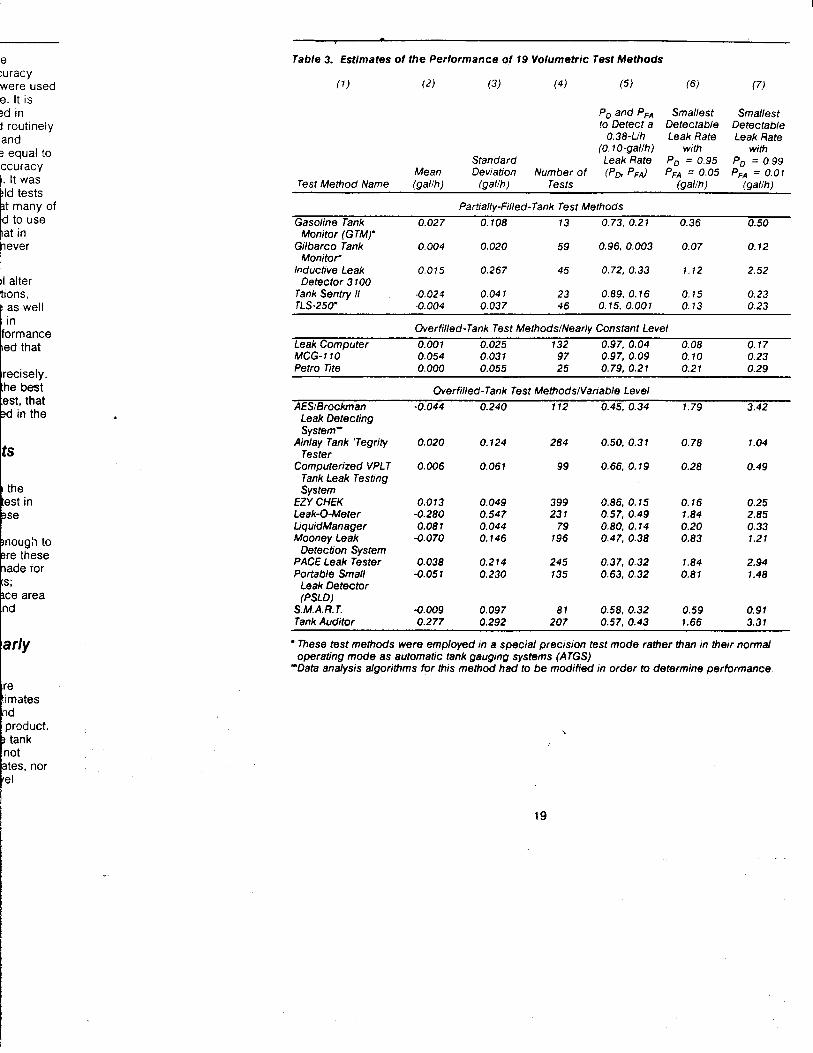
Quantitative Performance Estimates The names of the 25 commercially. available volumetric test methods that were evaluated by the EPA at the UST Test Apparatus are presented, along with their manufacturers, in Table 2. The performance of 19 of the 25 test methods is summarized in Tables 3 and 4. Proper interpretation of the quantitative performance estimates given in Table 3 requires the use of Table 4. Table 5 shows the methods for which no quantitative performance estimates could be made.
In Table 3, test methods are arranged by alphabetical order in three categories: (1 ) partially-filled-tank test methods, (2) variable-level, overfilled-tank test methods, and (3) nearly constant-level, overfilled-tank test methods. The reason for this arrangement is that performance is largely controlled by characteristics particular to each of these categories. For example, vapor may be trapped during an overfilled-
17

k (False
ccuracy :y of a
,ers’
rl iners and tank
of leak 4 highly ‘ng, it can IS of l e EPA test nance :h a ,ding, showed ns could ng.
ITight)
Table 2. Participants Completing the €PA Volumetric Test Method Evaluation Program
Test Method Name Test Method Manufacturer Teleohone Numhnr - AESiBrochman leak Detecting
Ainlay Tank ‘Tegnty Tester
Automatic Tank Monitor and Tester (AUTAMAT)
Computerized VPLT Tank leak Testing System
DWY leak Sensor
EZY CHEK
Gasoline Tank Monitor (GTM)
Gilbarco Tank Monitor
Inductive leak Detector 3100
Leak Computer
leah-O-Meter
bquidManager
System
INSTA-TEST
LMS-750
MCG-1100
Mooney Leah Detection System
OTEC Leak Sensor
PACE leak Tester
Petro Tite
Portable Small leak Detector
S. M. A. R. T.
‘ (PSLD)
Tank Auditor
Tank Monitoring Device (TMD-1)
Tank Sentry I1
TLS-250 Tank Level Sensing System
Associated Environmental Systems (805) 393-2212
Soiltest, Inc.
Exxon Research and Engineering co.
NDE Technology, Inc.
OWY Corp.
Horner Creative Products, Inc.
Tide1 Systems
Gilbarco. Inc.
Sarasota Automations, Inc.
EASI. Inc.
Tank Audit, Inc.
Fluid Components, Inc.
Colt Industries
Pneumercator Co.. Inc.
L & J Engineering, Inc.
The Mooney Equipment Co., Inc.
OTEC, Inc.
PACE (Petroleum Association for Conservation of the Canadian Environment)
Heath Consultants, Inc.
TankTech, Inc.
Michael & Associates of Columbia,
Leak Detection Systems, Inc.
Pandel Instruments, Inc.
Core Laboratories, Inc.
Veeder-Root Co.
Inc.
(312) 869-5500
(201) 765-3786
(213) 212-5244
(715) 735-9520
(517) 684-7180
(214) 416-8222
(9 19) 292-301 1
(8 13) 366-8770
(2 19) 239-7003
(6 19) 693-8277
(619) 744-6950
(8 13) 882-0663
(5 16) 293-8450
(312) 396-2600
(504) 282-6959
(71 5 ) 735-9520
(416) 298-1144
(617) 344-1400
(303) 757-7876
(803) 786-4 192
(617) 740-1717
(2 14) 660- 1 106
(5 12) 289-2673
(203j 527-7201
tank test but not during a partially-filled- tank test. Evaporation and condensation can be an important source of error in a partially-filled-tank test, but they are not a significant source of error in an overfilled- tank test. In overfilled-tank tests the tank must be topped prior to the test, an action that carries with it the risk of degrading the
.
18
performance, while in a partially-filled-tank test topping is not necessary. The first column in Table 3 lists the name of each method. The second and third columns show the mean and the standan deviation of the simulated temperature- compensated tank test data that were usec to estimate performance. The fourth
e :uracy were used e. It is 3d in j routinely and equal to
Lcuracy
t many of
ever
DI alter tions, ! as well ; in formance led that
recisely. :he best :est, that sd in the
l e est in
se
Table 3. Estimates of the Performance of 79 Volumetric Test Methods
PD and PFA Smallest Smallest to Detect a Detectable Detectable
0.38-Uh Leak Rate Leak Rate (0.1 0-gallh) with With
Standard leak Rate P, = 0.95 P, = 0.99 Mean Deviation Number of (PO, PFJ PFA = 0.05 P F ~ = 0.01
rest Method Name (galih) (galih) Tests (galih) (galih)
Gasoline Tank 0.027 0.108 13 0.73, 0.21 0.36 0.50
Gilbarco Tank 0.004 0.020 59 0.96, 0.003 0.07 0.12
Partially-Filled-Tank Test Methods
Monitor (GTM)'
Monitor'
Detector 3 100 Inductive Leak 0.015 0.267 45 0.72, 0.33 1.12 2.52
Tank Sentry I1 -0.024 0.04 1 23 0.89, 0.16 0.15 0.23 TLS-250' -0.004 0.03 7 46 0.15, 0.001 0.13 0.23
Overfilled-Tank Test MethodslNearly Constant Level Leak Computer 0.001 0.025 132 0.97, 0.04 0.08 0.17 MCG-110 0.054 0.031 97 0.97, 0.09 0.10 0.23 Petro Tite 0.000 0.055 25 0.79. 0.21 0.2 1 0.29
~ ~~ ~~~~~~
Overfilled-Tank Test MethodslVariable Level AESIErockman -0.044 0.240 112 0.45, 0.34 1.79 3.42
Leak Detecting System-
Tester
Tank Leak Testing System
Ainlay Tank 'Tegrity 0.020 0.124 284 0.78 1.04 0.50, 0.31
Computerized VPLT 0.006 0.061 99 0.66, 0.19 0.28 0.49
EZY CHEK 0.013 0.049 399 0.16 0.25 0.86, 0.15 Leak-0-Meter -0.280 0.547 23 1 0.57. 0.49 1 .84 2.85 LjquidManager 0.081 0.044 79 0.80, 0.14 0.20 0.33 Mooney Leak -0.070 0.146 196 0.47, 0.38 0.83 1.21
Detection System
Leak Detector (PSLD)
PACE Leak Tester 0.038 0.214 245 0.37, 0.32 1.84 2.94 Portable Small -0.05 1 0.230 135 0.8 1 1.48 0.63. 0.32
S.M.A. R. T. -0.009 0.097 81 0.59 0.91 0.58, 0.32
These test methods were employed in a special precision test mode rather than in their normal
'Data analysis algorithms for this method had to be modified in order to determine performance
Tank Auditor 0.277 0.292 207 0.57. 0.43 1.66 3.31
operating mode as automatic tank gauging systems (ATGS)
\
19
I
gram
?e Number
193-22 12
169-5500
'65-3786
?12-5244
'35-9520
84-7180
16-8222
92-301 1
66-8770
39-7003
93-8277
44-6950
82-0663
93-8450
96-2600
82-6959
35-9520
98-1 144
44-1400
57-7876
8 6 4 192
40-1717
60- 1 106
89-2673
27-7201
-filled-tank
the name d third e standard xtrature- t were used turth
1-
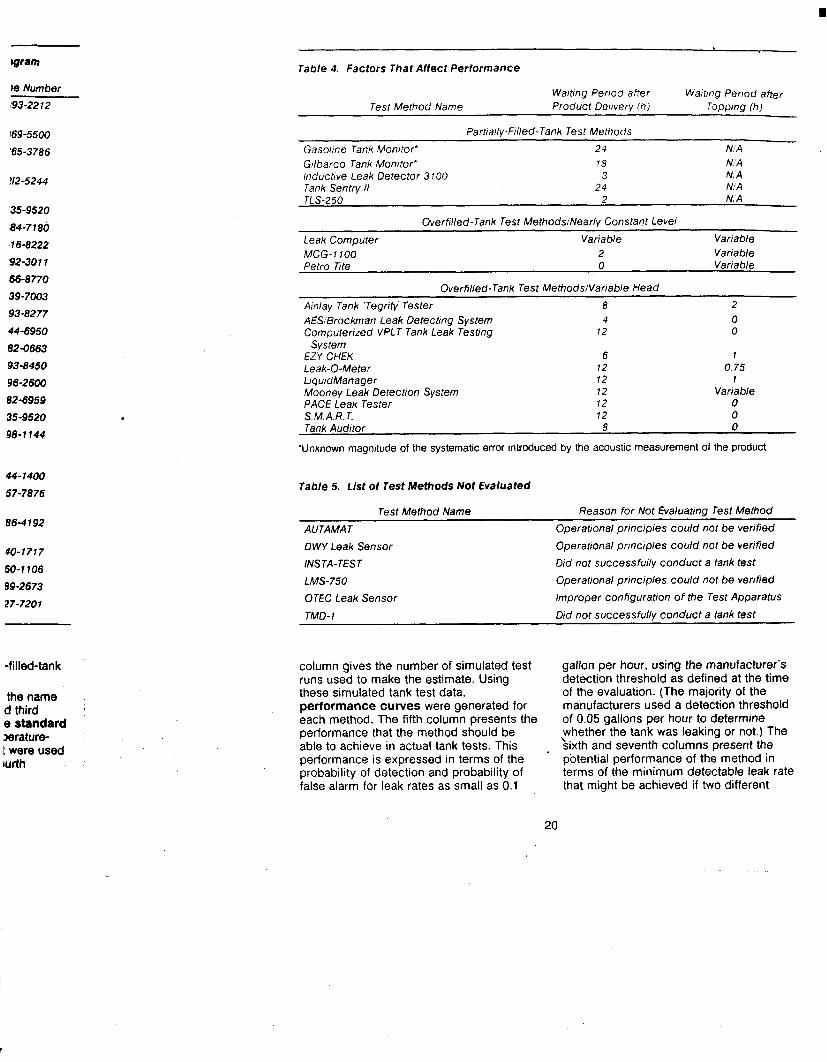
Table 4. Factors That Affect Performance
Wai fin g Per1 o d after Waiting Period after Test Method Name Product Delivery (h) Topping (h)
Partially-Filled-Tank Test Methods
Gasoline Tank Monitor" 24 Ni A Gilbarco Tank Monitor' 18 N, A Inductive Leak Detector 3 100 3 N A Tank Sentry II 24 N A TLS-250 2 N, A
Overfilled-Tank Test MethodsiNearly Constant Level
Leak Computer Varia ble Variable MCG- 1 100 2 Variable Petro Tite 0 Varia ble
Overfilled- Tank Test MethodslVariable Head
Ainlay Tank Tegrity Tester 8 2 AES,Broc/unan Leak Detecting System 4 0 Computerized VPLT Tank Leak Testing 12 0
EZY CHEK 6 1 Leak-O-Meter 12 0 75 LquidManager 12 1 Mooney leak Detection System 12 Variable PACE Leak Tester 12 0 S M A R T 12 0 Tank Auditor 8 0
System
*Unknown magnitude of the systematic error introduced by the acoustic measurement of the product
Table 5. List of Test Methods Not Evaluated
Test Method Name Reason for Not Evaluating Test Method
Operational principles could not be verified AUTAMA T DWY Leak Sensor Operational principles could not be verified
INSTA-TEST Did not successfully conduct a tank test
LMS-750 Operational principles could not be verified
OTEC leak Sensor lmproper configuration of the Test Apparatus
TMD-I Did not successfully conduct a tank test
column gives the number of simulated test runs used to make the estimate. Using these simulated tank test data, performance curves were generated for each method. The fifth column presents the performance that the method should be able to achieve in actual tank tests. This performance is expressed in terms of the probability of detection and probability of false alarm for leak rates as small as 0.1
gallon per hour, using the manufacturer's detection threshold as defined at the time of the evaluation. (The majority of the manufacturers used a detection threshold of 0.05 gallons per hour to determine whether the tank was leaking or not.) The sixth and seventh columns present the potential performance of the method in terms of the minimum detectable leak rate that might be achieved if two different
\ .
20

I
f P, and using his
's Having D C d
and P,
'ate 4 = 0.01
in Terms 0.01
tect This tons
le to .05) methods, ice can I changes
wer, on
probabilities of detection and false alarm (95 and 5% and 99 and 1 YO, respectively) were required. The manufacturer's detection threshold was not employed in these performance estimates; instead, thresholds were selected which yield probabilities of false alarm of 5% and 1 %, respectively.
Basis for Performance Estimates The quantitative performance estimates shown in Table 3 should not be used unless the reader first understands what sources of noise were included in the estimates, what sources were not included, and what assumptions were used in the analysis. If these are not understood, the test method that is chosen may yield significantly poorer performance than would be expected based on the numbers shown in Table 3.
Three general remarks apply to nearly all of the methods evaluated. First, the majority of the methods exhibit a bias; i.e., the mean of the data is statistically different from zero. Because this means that the measured volume is systematically different from the actual value, a bias can adversely affect the conclusions drawn from test results (Le., declarations of false alarm, missed detection, tank tightness, etc.. may be in error). The magnitude of the bias found in most methods is evidenced in the mean values shown in Table 3. In general, the performance of methods with a bias cannot be accurately estimated, because unless the physical mechanisms producing the bias are known and can be quantified (so that the bias can be removed), performance can change from test to test. The bias was removed for the estimates presented in Table 3, i.e., the estimates were made with the assumption that the bias was zero. If the bias is large, i.e., if it represents a large percentage of the detectable leak, the test method should be considered suspect.
Second, experimental estimates of the precision and accuracy of each method's instrumentation were derived from data obtained from a calibration of the level and temperature measurement systems; this
calibration was done as part o i the evaluation. The precision and accuracy derived from the calibration data were used to make the performance estimate. It is assumed that the instruments used in actual practice are accurately and routinely calibrated, and that the precision and accuracy of these instruments are equal to or better than the precision and accuracy used in the performance estimate. It was observed during the evaluation field tests that the calibration procedures that many of the manufacturers used or claimed to use were generally inadequate, and that in many cases the instruments had never been calibrated at all.
Third, deviations from the protocol alter performance; during these evaluations, performance was seen to improve as well as to suffer as a result of changes in protocol. In order to make the performance estimates, therefore, it was assumed that the test protocol as given by the manufacturer is always followed precisely. This implicitly assumes that only the best test crews are used to execute a test, that is, the type of crew that participated in the evaluation program.
Partially- Filled-Tank Tests The effects of evaporation and condensation were not included in the estimates made for methods that test in partially filled tanks. In general, these effects are small, but in some circumstances they can be large enough to produce testing errors. (Neither were these effects included in the estimates made for methods that test in overfilled tanks; because of the small product-surface area in an overfilled tank, evaporation and condensation are negligible.)
Overfilled- Tank TestslNearly Constant Level The effects of a product delivery are included in all the performance estimates for methods that overfill the tank and maintain a nearly constant level of product. However, the effects of topping the tank during an overfilled-tank test were not included in the performance estimates, nor were the effects of any product-level
21

changes that are required before starting a test. Furthermore, these estimates include neither the degrading effects of spatial inhomogeneities in product temperature nor the large change in tank volume due to structural deformation. Waiting periods, which allow the temperature fluctuations and the structural deformation produced by topping to subside, are usually incorporated into test protocols, but in general they were found to be too short. It should be noted that improper topping protocol (i.e., waiting periods that are too short) can seriously degrade performance. The short waiting times after topping shown in Table 4 suggest the magnitude of the problem. Thus, in actual practice, performance could be significantly poorer than that shown in Table 3.
In all overfilled-tank tests the potential exists for trapping vapor in the top of the tank or in its associated piping. The effects of trapped vapor were not included in the performance estimates in Table 3 for two reasons: most manufacturers claim to be able to remove vapor before a test begins, and the distribution of the volume of trapped vapor is unknown. That vapor will be trapped, however, is almost inevitable, and the performance estimates shown in Table 3 will be reduced if this vapor is not removed before a test.
test
ifacturer’s it the time
Overfilled- Tank TestslVariable Level The same effects that have the potential to degrade the performance of constant-level tests also impact the performance of variable-level tests. In addition, when the product level within the fill tube or standpipe is allowed to fluctuate during a test, it is nearly impossible to convert product-level measurements to volume. Test methods that allow the product level to fluctuate should be considered suspect.
Methods Which Could Not Be Evaluated There were no quantitative performance estimates made for 6 of the 25 methods in the evaluation program; these methods are
listed in Table 5. The reason was one of three.
1 . In two cases, the manufacturer’s test crew could not perform a satisfactor! tank test during the 72-hour period allotted to them during the field tests at the UST Test Apparatus.
2. In three cases, the data obtained during the field tests clearly indicate, that the method was not behaving as the manufacturer had said it would.
3. In the final case, the Test Apparatus was not properly configured, thus preventing a fair field test of the method.
Summary of Test Results Estimates of the potential performance of each test method, detailed in Table 3, wer summarized in order to show the total number of methods meeting the detection standard of 0.1 gallons per hour with various probabilities of detection and false alarm. Table 6 shows the number of test methods attaining a certain Po and PFA, with each test method using its own detection threshold. For example, three of the test methods have a probability of detection greater than 90% with an accompanying probability of false alarm 0 1
10% or less.
Table 7 summarizes potential performance in terms of the leak rate detectable with tw different sets of Po and PFA (95 and 5% and 99 and 1 O h , respectively). Five test methods were able to detect leaks betwee 0.05 and 0.1 5 gallons per hour with the PC of 95% and PFA of 5% required by the EP tank tightness regulations. One test metho was able to detect a leak of the same size with the Po of 99% and the PFA of 1%. A total of eight methods evaluated could detect leaks of 0.25 gallons per hour or less with the PD and PFA specified by the regulations.
Table 8 gives another summary, an estimate of the performance that could be ‘achieved with these methods after improvements have been made; these estimates are based on the experimental
22

I
t evolved erefore, can particular
oday might qance
t be used,
n made to
t delivery I
Table 6. Summary of Performance Estimates (Performance is expressed in terms of P, and PFA for the detection Of a leak of 0.1 gal lon per hour, each manufacturer using his own detection threshold.)
Number of Methods Having P, ("/.I pFA ("la) This P, and P,
90-100 0-10 3
65-90 10-25 6
35-75 25-50 9
10-20 0- 1 1
Table 7. Potential Performance in Terms of Leak Rate for Two Different Sets of P, and P F A
Number of Methods Able to Detect This leak Rate
Detectable leak Rate (gallh) with P, = 0.95, PFA = 0.05 with P, = 0.99, PFA = 0.01
0.05-0.15 5 1
0.15-0.25
0.25 -0.35
3
1
5
2
0.35-0.55 1 2
0.55 -0.75
0.75-0.95
0.95
Table 8. Estimate of the Performance after Two Levels of Modifications, Expressed in Terms of the Smallest Leak Rate That can be Detected with P, = 0.99 and PFA = 0.01
Number of Test Methods Able to Detect This leak Rate after Minor Modificabons
Detectable Leak Rate (gallh) (Protocol Only)
0.05-0.15
0.15-0.25
6
13
and theoretical work done during the program. Table 7 shows that, without modifications, most systems were not able to detect leaks smaller than 0.20 ( f 0.05) gallons per hour. In Table 8, however, it is evident that with minor modifications, i.e., primarily protocol changes, all the systems should be able to do at least as well as this. With more elaborate modifications, the
majority of systems should be able to detect leaks as small as 0.10 (kO.05) gallons per hour. Thus, for many methods. a significant increase in performance can be achieved by means of protocol changes alone. The actual performance improvement would depend, however, on the specific changes made by the manufacturer.
\
23
.s one of
,turer’s test atisfactory r period field tests 1. btained
ly indicated lehaving as I it would.
Apparatus ed, thus of the
Its nance of )le 3, were total
detection with and false r of test Id PFA, mn , three of ity of an 3 alarm of
rformance )le with two and 5% ve test (s between ith the PD by the EPA est method iame size
could lour or td by the
an : could be er these wimental
of 1%. A


ter the that at elapse other ids will um has patel y :ank imperature 1. However,
9. Checklist for Good Performance
A test method with good performance is one that meets or exceeds the EPA regulations. When a regulator is considering a test method for approval in hidher jurisdiction, or when an owner/operator is considering purchasing one, the first
question should be whether the test method has been evaluated systematically. If it is on8 of those evaluated in the EPA program, the results of the evaluation are available to the public. If the manufacturer has made changes to an evaluated test method,
27
A Reliable Test Method
Experimental studies at the UST Test Apparatus suggest that a test method having the :haracteristics described below should, with proper execution, meet or exceed the EPA *egulatory requirements for testing tanks of approximately 10,000 gallons in capacity Nhether such a system does or does not meet the regulatory standards depends on the mplementation of these features.
There are 5 or more temperature sensors (or the equivalent).
The sensors can measure volume changes of 0.025 gallons per hour. Temperature
There is a waiting period of at least 6 hours after delivery of product to minimize
There is a waiting period of at least 3 hours after topping the tank to minimize
Checks are made to identify the presence of structural deformation and to wait for it
sensors with a precision of 0.001 "C are adequate.
temperature instabilities.
temperature instabilities.
to subside.
There is a single threshold value used as a detection criterion.
.To avoid aliasing, data are sampled at intervals of 1 second in the case of a tank that is partially filled or at intervals of 1 to 5 minutes in the case of an overfilled tank.
0 Test length is between 1 and 2 hours. The test is longer if the precision of the instruments is less than that given above.
0 The test is conducted at a nearly constant hydrostatic pressure. For overfilled-tank tests this may require that the product be releveled at regular intervals during the test, or that the cross-sectional area of the measurement container be enlarged.
4 reliable test method need not be identical to the system described above, nor contaiii he same features. In order to meet the regulatory requirements, a system need only be :apable of detecting a leak of 0.1 gallons per hour with a PD of 95% and a PF* of 5 % .

I
improved performance can only be determined through reevaluation. If the test method is not among those evaluated by the EPA, the regulator should ask to see other evaluations that may exist.
A checklist for good performance is given below. It represents a list of features found in successful test methods.
1. Instrumentation A well-designed testing system is not limited by its instrumentation.
Instrumentation noise (fluctuations in level and temperature produced by the system itself) should be 3 to 5 times less than the minimum detectable leak rate (the fluctuations due to a leak).
The temperature sensors must provide adequate spatial coverage of the tank, so that the data they record are representative of product conditions throughout the tank. Generally, one sensor is not sufficient, because the temperature at the top of the tank may be increasing while the temperature at the bottom is decreasing. The Edison experiments showed that one vertical array of five thermistors, or its equivalent, provides good spatial coverage. At times, however, temperature measurement systems with less coverage are adequate. For example, circulating (or mixing) the product in the tank can eliminate the problem of uneven temperature distribution. Thus, methods that circulate the product in the tank can, if the product is sufficiently mixed to eliminate this problem, obtain satisfactory results with a single probe. Methods that use averaging probes also eliminate this problem.
measurements made by the sensors are accurate. All instrumentation should be calibrated periodically. A reliable test method makes provisions for field calibration checks before each test (as part of the protocol) as well as
Calibration ensures that
for regularly scheduled calibration checks.
2. Protocol The predetermined steps that are followed in conducting a test are known as the protocol. With only slight variations from one test method to another, the protocol generally follows the description in Figure 6. The seven items below, whether they occur during preparation, testing, or analysis, are in the realm of protocol.
Groundwater level can affect the size of a leak. If there is any possibility th; the groundwater is above the level of the tank, an estimate of the height of the water table should be made. Ther should be a formal procedure for dealing with high groundwater levels. For example, a test can be postponec until the water table drops below the tank. Alternatives can be used only if they are part of the test design and if their impact on performance has beer evaluated.
A test should not be conducted while the water table is fluctuating. If it is impossible to meet this condition, as is sometimes for a tank located in a tidewater area, the test for leaks will be less sensitive.
factor should be measured directly rather than calculated from the tank’s geometry. The former procedure is simple to do and is less subject to error than the latter.
Many test methods have temperature compensation schemes whose accuracy is directly influenced by the coefficient of thermal expansion. The coefficient is usually determined in one of two ways: it is calculated from specific gravity measurement of the product in the tank, or an average value is calculated for a given type o product. The uncertainty of the coefficient is typically 5 to 10%.
Tests should be conducted under nearly constant hydrostatic pressure If a test is conducted under variable
The height-to-volume conversion
.
28

I
PD and !times one nttl such ian the 1111
of fer be
are ised on I be
hydrostatic pressure, the product level is always fluctuating, making i t impossible to convert product level to product volume. It is advisable, therefore, to eliminate from consideration any test conducted under variable hydrostatic pressure.
A variable-pressure test can be made into a constant-pressure test by releveling the product. Another way to turn a variable-pressure test into a constant-pressure test is by increasing the cross-sectional area of the measuring container. With either approach, volume changes in the product can be determined from the height- to-volume conversion factor, as they are in any other constant- pressure test.
To minimize the thermal disturbances and deformation associated with releveling, newly introduced product should be at approximately the same temperature as the product in the tank; it should be added at a location as remote as possible from the temperature sensors (i.e., through a fill tube other than the one where the sensors have been inserted or through an extension tube that reaches to the bottom of the tank, away from the sensors); and it should be added in very small increments.
Adequate waiting periods must be observed after any change in product level, whether such a change represents the initial product delivery or a subsequent adjustment (topping) prior to starting the test. A change in product level can disturb the distribution of temperature in the tank: it also produces structural deformation of the tank itself. These two effects of a product-level change will eventually dissipate: the horizontal temperature differences will become small, and the tank will cease expanding. However, unless the waiting period is long enough to allow for this dissipation, the volume changes produced by the disturbances will obscure the leak, rendering the test results invalid. It is recommended that a waiting period of
4 to 6 hours be observed after the initial filling of the tank. and that at least 3 hours be allowed to elapse after the occurrence of any other change. These waiting pefiods will ensure that thermal equilibrium has returned. Methods that adequately circulate the product in the tank theoretically minimize the temperature effects produced by topping. However, the time required to mix product adequately is comparable in length to the waiting periods that are used when product is not circulated.
It is much more difficult to know how much time must be allowed for structural deformation to subside. It could be less than for thermal equilibrium, but it could be much more, as much as 12 to 24 hours. The only way, then, to know how long to wait for structural deformation to subside is to watch the data. The data will indicate the presence of structural deformation and will show when it has subsided. It is crucial that a test method incorporate this data monitoring in its overall design.
The last consideration in that area of the protocol that deals with waiting periods is thermal disturbance of the vapor in a partially filled tank, a phenomenon that occurs when the fill hole is opened in preparation for a test. Thermal disturbances in the vapor space cause residual fluctuations in the product. Limited experimental data suggest that it takes at least 6 hours for these to dissipate.
The, various waiting periods can be observed simultaneously providing that the total period is long enough to compensate for all of the above phenomena.
Data collection is examined in terms of sampling interval and test duration. As a rule, the more data the better. Undersampling the data can lead to aliasing. To avoid aliasing, level data should be sampled frequently enough to measure the fluctuations at and beneath the product surface.
29

-- bration
e followed IS the )ns from protocol
ier they I , or :ocoI.
in Figure
ct the size jsibility that l e level of ! height of nade. There Ire for iter levels. postponed
below the jed only if sign and if :e has been
icted while ,g. If it is ndition, as it :ated in a leaks will
iersion j directly I the tank's :edure is JbjeCt to
emperature hose iced by the miion. The mined in Jlated from a lent of the average ven type of )f the 10%.
d under c pressure. 31 variable
Siudies have shown that, when the instrumentation characteristics are marginal, longer tests may be required in order to achieve acceptable performance. This is especially true of many of the temperature measurement systems. Higher performance is achieved with a longer test because averaging of the data tends to reduce the uncertainty. The widely used 1 -hour test Uuration would appear to be acceptable if the instrumentation has a high degree of precision and accuracy (for example, if it has no electronic drift) and if the spatial coverage is adequate for temperature compensation. Temperature measurement systems with a precision of 0.001 "C are difficult to make and to keep calibrated. As a consequence. a test duration of 2 hours or more (after the appropriate waiting periods have been observed) is generally a good choice when high performance is desired. The test duration to use, however, is the one that gives the desired performance.
important part of the protocol. The best solution is to eliminate trapped vapor from the tank. Although the amount of trapped vapor cannot be accurately estimated with the current technology, its presence (or absence) can be determined. A reliable test method will check for the presence of trapped vapor and will call for bleeding the tank and lines until a subsequent check shows that trapped vapor is largely absent.
Dealing with vapor pockets is an
3. Data Analysis and Detection Criterion Many test methods lack a defined data- analysis protocol. In others, an attempt is made to implement complicated analysis algorithms whose effect on the test results is not known. The first step in the analysis is to compute the volume changes from the product-level changes (unless volume is measured directly) and from the product- temperature changes. The second is to calculate the temperature-compensated
volumetric flow rate Thirdly, the volumetri flow rate, once it has been estimated, mus be compared to a detection criterion, whic has been predetermined as part of the tes design In order for a test method to perform well against small leaks, the threshold value used as a detection criterion must be smaller by a factor of 2 c more than the smallest detectable leak
4. Operator Influence Since performance depends on a set, repeatable procedure, the most reliable te methods are those least subject to operatc influence. Changes to the test protocol wil alter the performance of the method. Thu: any test method which requires or allows the operator to make subjective decisions during the test should be avoided. This does not imply that a trained operator should not be present. The presence of a trained operator is essential in preparing the tank prior to testing, especially in the case of overfilled tanks. Heishe, however, should not interfere with the test once dat; collection has begun.
5. Multiple- Testing Strategy The essence of a multiple-testing strategy is that the declaration of a leak depends n on one test but on the results of two or more tests. A multiple-testing strategy car be useful if it is well defined and has beer evaluated as an integral part of the test method. Multiple-testing strategies can increase the PD and/or lower the PFA if implemented properly.
Unfortunately, the evaluation of multiple- testing strategies is complicated because the tests in a given series are not necessarily independent. Tests are not independent when one test is correlated with the previous one. When this occurs, systematic errors remain the same from one test to another. It is possible to theoretically calculate the performance of multiple-testing strategy if two or more independent tests are combined. If the .tests are not independent, experimental estimates are required. As a general rule, all multiple-testing strategies should be evaluated experimentally.
30

Furthermore, many of the multiple-testing strategies currently in use are arbitrary. For example, if the results show that the calculated flow rate exceeds the threshold by only a small amount, an operator may decide to do a second test even though it is not a part of the protocol; i f the threshold is not exceeded in the second test, the tank is declared tight. This procedure lowers the probability of false alarm (i.e., the incidence of a "tight" tank being declared leaking) but at the same time it lowers the probability that a leaking tank will be detected.
A multiple-testing strategy should be considered suspect if the number of tests
is not fixed. This means that the P,, and PFA cannot be interpreted. Sometimes one test after another is conducted until such time as the leak rate is smaller than the threshold value. This approach will eventually result in a probability of detection of zero. (A leak will never be detected .)
While multiple-testing strategies are desirable, performance claims based on multiple-testing strategies should be viewed cautiously.
31
- . . . . . . .
I
- ? volumetric nated, must erion, which ‘t of the test bd to
. -- . .. ... ...

rd oil and iprings.
ht mean
IO. References
U.S. Environmental Protection Agency. Underground Storage Tanks;Part 280- Technical Standards and Corrective Action Requirements for Owners and Operators of Underground Storage Tanks. Federal Register, Vol. 53, No. 185 (September 23, 1988).
National Fire Protection Association. Underground Leakage of Flammable and Combustible Liquids. NFPA Pamphlet 329, National Fire Protection Association, Quincy, Massachusetts (December 30,1986).
t are not
33
3. US. Environmental Protection Agency. Evaluation of Volumetric Leak Detection Methods for Underground Fuel Storage Tanks, Vol. I (EPN600/2-88/068a) and Vol. I I (EPN60012-881068b). Risk Reduction Engineering Laboratory, Edison, New Jersey (December 1988).
This two-volume report (Vol I, Order No PB 89-124 333, Cost $36.95 and Vol. 11, Order No. PB 89-124 341. Cost $73.95) is available tram the National Technical Information Service. 5285 Port Royal Road, Springfield. Virginia 22161 Telephone: (703) 487-4650


~ s H. Pim, ; irtment of
k ,
11. Glossary
Accuracy The difference between a measured value and the corresponding actual value; "bias."
Aliasing An error that occurs when data are sampled too infrequently to reflect all the fluctuations in the data.
Bias See "accuracy."
Coefficient of thermal expansion 0 A measure of how much a liquid expands given a certain temperature change.
Database 0 A collection of many pieces of information, stored in a computer and arranged for ease and speed of retrieval.
Deformation See "Structural deformation."
Detectable leak rate 0 The smallest leak, expressed in terms of gallons per hour or liters per hour, that a test can reliably discern with a certain probability of detection and a certain probability of false alarm.
Detectlon criterion 0 A predetermined rule to ascertain whether the tank is leaking or not. Most volumetric tests use a "threshold" value as the detection criterion.
False alarm 0 The situation that occurs when a test indicates a leak in a tank that is, in reality, "tight" (not leaking). See "missed detection."
Flow rate 0 The rate, expressed in gallons per hour or liters per hour, at which fluid is escaping from a hole or fissure in a tank.
Groundwater Water that is found underground between saturated soil and rock and that supplies wells and springs
Height-to-volume conversion factor A value used to convert measurements made in inches or centimeters to a volume measurement. For example, a value of 3 inches per gallon for the h-to-v might mean that, in a specific container, the surface of the liquid rises 3 inches for every gallon of liquid added.
Mean A number that represents the average value of a group of data.
Missed detection 0 The situation that occurs when a test indicates that a tank is "tight" when in fact it is leaking. See "false alarm."
Noise 0 Product-level or product-volume changes occurring during a test that are not related to a leak but that may be mistaken for one.
Performance 0 A test's accuracy and reliability in detecting leaks; expressed in terms of leak rate in gallons or liters per hour and defined by a probability of detection and a probability of false alarm.
Performance Curve 0 A graphic representation of performance data.
Precision 0 The repeatability of a measurement.
Probability of detection (Po) 0 The likehhood, expressed as a percentage, that a test method will correctly identify a leaking tank.
35
t

Probability of false alarm ( P F ~ ) 0 The likelihood, expressed as a percentage, that a test method will incorrectly identify a "tight" tank as a leaking tank
Probability of missed detection The likelihood, expressed as a percentage, that a test method will incorrectly identify a leaking tank as a "tight" tank
Product The contents of a storage tank (in the present context, a petroleum fuel)
Product level The height of the product as measured in inches or centimeters from the bottom of the tank
Protocol A series of detailed steps for conducting a tank test.
Signal The volume or product-level change produced by a leak.
Standard Deviation A number that represents the amount of variation within a group of data.
Structural deformation 0 The distortion observed in the walls of a tank after liquid has been added or removed.
Temperature-compensated 0 Having been offset or counterbalanced for the effects of temperature.
Threshold A predetermined value against which measurements made during a test are compared and which serves as the basis for declaring the presence of a
leak. If, for example, measurements indicate that fluid is flowing out of a tank a a rate of 0.2 gallons per hour, and the protocol of a test states that any measurement greater than a threshold of 0.1 gallons per hour constitutes a leak, the tank is declared leaking.
Tight In reference to a tank, not leaking.
Topping The addition of a small amouni of product to a nearly filled or overfilled tank to raise the fluid level in the fill tube c an above-ground standpipe to the level required for starting a test. Topping often results in a large height change and thermal instability of the product in the tank.
Uncertainty 0 A measure of the spread ir the data about its mean value.
Variable A quantity or quality that is allowed to change within the context of ar: experiment.
Volumetric tank test One of several types of tests to ascertain the physical integrity of a storage tank. In a volumetric test, the volume of fluid in the tank is measured directly or calculated from product-level changes; a change in volum indicates a leak.
Water table 0 The height of the groundwater in relation to the surface of tt earth.
36
I
This document was written by Joseph W. Maresca, Jr., and Monique Seibel of Vista Research, Inc., Mountain View, California, for the Center for Environmental Research Information, U.S. Environmental Protection Agency, Cincinnati, Ohio 45268. Contents of the document are based on the EPA report entitled Evaluation of Volumetric Leak Detection Methods for Underground Fuel Storage Tanks, Volumes I and 11, available from the National Technical Information Service (see References). Technical assistance was provided by Thomas Young of the EPA Office of Underground Storage Tanks in Washington, D.C., and by John S . Farlow of the EPA Risk Reduction Engineering Laboratory in Edison. New Jersey.
Technical reviewers were James H. Pim, Suffolk County (New York) Department of Health Services; Ken Goldstein, New Jersey Department of Environmental Protection; Dr. Robert Koerner, Drexel University; and Dr. H. Kendall Wilcox of Geraghty and Miller, Inc.
This report has been reviewed in accordance with U.S. Environmental Protection Agency policy and approved for publication. Mention of trade names or commercial products does not constitute endorsement or recommendation for use. Other alternatives may exist or may be developed.
t U.S. GOVERNMENT PRINTING OFFICE: 1989 - 1552-Ml87093
37