Embed Size (px)
Citation preview

Industry Trends
Report
Volume Sixteen Number OneQ1 2016Published by Mitchell International
FEATURED IN THIS ISSUE:
The High Cost of High TechBy Greg HornVice President of Industry Relations, Mitchell

Industry Trends
ReportTable of Contents
Volume Sixteen Number One
4 Quarterly FeatureThe High Cost of High Tech
8 Average Length of Rental for Repairable Vehicles
14 Current Events in the Collision Industry
22 Motor Vehicle Markets
24 Mitchell Collision Repair Industry Data
31 Total Loss Data
32 Canadian Collision Summary
36 About Mitchell
37 Mitchell in the News

A Message from the CEO
Ballooning Parts Costs Welcome to the Q1 Edition of the 2016 Auto Physical Damage Mitchell
Industry Trends Report. As we started the year I had the opportunity to
share my thoughts in FenderBender magazine about the state of the
industry and how the future is looking for collision repairers. While it is
looking positive over the next few years, we all know the landscape is
constantly evolving and taking a long term view is key to aligning our
business with changes down the road.
In our feature article on page 4, The High Cost of High Tech, author
Greg Horn analyzes repair cost inflation rates as reflected by total loss
frequency, rising insurance rates and repair order costs. Greg explains
how the increased use of sophisticated technology makes for safer
vehicles, but at a price. This builds on a subject that Greg discussed a
couple of issues ago with the pace of technology influencing the parts
that are most often damaged and how with higher cost advancements
come higher average repair costs.
As Mitchell prepares to celebrate its 70th anniversary this year, it is a
good time to reflect on how far the industry has come. I look forward
to continuing to discuss with you how it has evolved, adapted to
change and where it is headed in future. I’d also like to thank all of you
for being part of our story and helping us grow to the company we are
today.
Alex Sun
President and CEO
Mitchell
Q1 2016
Alex Sun President and CEO, Mitchell
Industry Trends LiveSign up to hear a live
presentation of the trends
presented in this report from
Editor-in-Chief, Greg Horn.
Don’t miss the chance
to get the inside scoop!

4 Quarterly Feature
“Cars cost more to repair than they
used to” has become a phrase we
frequently hear in our industry. We
use it to justify increases in “total
loss” frequency, along with rising
insurance rates and repair costs. I
see it every time I gather data for
the Industry Trends Report
Fig. 1 or write an article on repair
costs for other publications. I
became curious, however, to
see what drove the increase,
and if properly adjusting for
inflation would affect the results.
Additionally, since our population
of “repairable vehicle” claims
has changed over time, away
from traditional SUVs toward
smaller CUVs and passenger cars,
I limited the study to two popular
passenger cars to measure the
change in factors like the number
of parts or paint hours.
About the methodologyI relied on the Consumer Price
Index of Dec. 15, 2015 to calculate
the cumulative inflation rate
through November 2015. I then
chose the Chevrolet Malibu and
By Greg HornVice President, Industry Relations, Mitchell
The High Cost of High Tech
Toyota Camry as representative
vehicles, and looked at the three
major components that drive repair
severity: parts, labor and paint. I
looked at new Camrys and Malibus
as estimated in 2010, then Malibus
and Camrys in 2015. The three
columns represent 2010 actual
dollars, then that number adjusted
for inflation (labeled “2010-IA”),
Fig. 1 and finally the current 2015
amount.
So what did we find? The average
number of parts replaced actually
I became curious to
see what drove the
[repair] increase, and
if properly adjusting
for inflation would
affect the results.
5
declined in the Malibu from
2010, while the Camry’s average
increased. Adjusted for inflation,
the overall repair severity increased
at more than double the rate
for the Malibu over the Camry,
despite the Malibu’s labor hours
staying the same. The differences
in labor dollars ($64 for the Malibu
and $45 for the Camry, adjusted
for inflation) contributed slightly
to the increases, as do the paint
and materials differences; but
parts costs represent the biggest
component of the increase.
In fact, of the $140 inflation
adjusted difference in the Camry,
$64 came from parts costs, with
a 0.5 part increase in the average
number of parts on the estimate.
Of the Malibu’s $292 inflation-
adjusted increase, however, $246
came from parts, but with 0.4
fewer parts replaced.
Greg Horn Vice President, Industry Relations, Mitchell
Greg Horn joined Mitchell
in September of 2006
as Vice President of Industry
Relations.
In this role, Greg assists the
Mitchell sales force in providing
custom tailored business solutions
to the Property and Casualty Claims
and Automotive Collision Repair
industries.
Prior to joining Mitchell, Greg served
as Vice President of Material Damage
Claims at GMAC Insurance, where
he was responsible for all aspects of
the physical damage claims process
and the implementation of a unique
vehicle replacement program along
with serving on the General Motors
Safety Committee. Prior to GMAC,
Greg served as Director of Material
Damage Processes for National
Grange Mutual in Keene, NH.
About the author…ConclusionEven when adjusted for inflation,
we found that new, popular
passenger cars do cost more to
repair now than they did five years
ago. Despite multiple variables
including the cost of insurance
and service hours, the rising cost of
parts has had the biggest impact on
collision repair costs overall.
Now we have to ask ourselves:
why are the cost of parts rising?
According to our findings, there
are a few reasons:
In many cases, the rising demand
for trendy and more expensive
headlights, like LED ‘halo’ lighting,
drives cost up.
Quarterly Feature

6 Quarterly Feature
OEMs (especially Chevrolet) are
working to reduce the number of
components in bumper systems
for greater efficiency during the
assembly process. Yet despite using
fewer components in bumper
systems, which account for 72%
of all repairable claims, collision
repairs on Chevys continue to
become more expensive.
It’s important to note that the
vehicles assessed in this study were
new when they were appraised,
so replacement parts were
overwhelming OEM—significantly
more expensive than aftermarket
parts, which aren’t yet available for
these models.
What does this information
mean for Insurers and Collision
Repairers?
By developing your teams’
expertise on bumper systems,
you’ll be able to improve appraisal
accuracy in the majority of
claim to avoid supplementation
and improve customer
satisfaction overall.
Something to keep in mind:
This case study focuses on newer
vehicle models, which do not yet
have LKQ parts available. Vehicles
that are five years old or older are
more likely to have aftermarket
parts available, and therefore may
not be impacted by rising parts cost
to the same extent.
For Collision Repairers: Trends are
changing all the time. Make sure
your shop has access to the most
up-to-date OEM repair procedures
so you can always be prepared.
Also, be aware of increased costs
for OEM parts and how this affects
owners of new vehicles. If you
receive objections to rising costs, you
can be prepared with an accurate
explanation.
For Insurers: As the cost of parts
continue to rise, accurate appraisals
for bumper repair and replacement
will become even more critical.
Bumper systems are affected in
72% of all collision repair claims. For
this reason, they’re a key driver in
overall repair costs and number of
operations.
Toyota Camry Chevrolet Malibu
2010 2010-IA 2015 2010 2010-IA 2015
Average Severity $3,143 $3,420 $3,559 Average Severity $3,127 $3,403 $3,699
Average Part Amount $1,693 $1,843 $1,955 Average Part Amount $1,805 $1,964 $2,203
Average Labor Hours 29.9 29.9 30.1 Average Labor Hours 27.7 27.7 27.7
Average Labor Amount $1,408 $1,532 $1,568 Average Labor Amount $1,335 $1,453 $1,502
Average Labor Rate $47.1 $51.2 $52.0 Average Labor Rate $48.1 $52.4 $54.2
Average Paint Material Amount $285 $310 $337 Average Paint Material Amount $279 $304 $301
Average Paint Material Rate $24.6 $26.8 $27.4 Average Paint Material Rate $25.0 $27.2 $27.5
Average Part Quantity Replaced 12.1 12.1 12.6 Average Part Quantity Replaced $12.1 12.1 11.7
Figure 1

Page Title7

8
At the time of this
writing, gasoline and
oil prices have dropped
significantly and could
make 2016 a year in
which collision repairers
and insurers see an
increase in volume.
U.S. Length of Rental Trend Continues for Q4 2015By Frank LaViolaAssistant Vice President, Insurance Replacement, Enterprise Rent-A-Car
The U.S. average Length of Rental
(LOR) rose in calendar year 2015
to 11.5 days, up 0.3 from calendar
year 2014. Miles driven and lower
gasoline prices have contributed to
an increase in accident frequency,
as more vehicles are on the road.
Also worth noting, is that total loss
vehicles have increased over the
past 2 years due to aging vehicles
and market pricing.
As shop capacity has increased, it is
possible that should a softening of
the market for damaged vehicles
and parts occur, we may see an
increase in repairs rather than
totals in 2016. At the time of this
writing, gasoline and oil prices have
dropped significantly and could
make 2016 a year in which collision
repairers and insurers see an
increase in volume. This may lead
to capacity issues as well as the
ever growing problem associated
with having enough quality trained
technicians.
For Q4 2015 LOR was 11.9 days,
up from 11.5 last Q4. The lack of
Average Length of Rental for Repairable Vehicles
significant weather this quarter
would typically lead to a decline
in LOR. However, the broader
conditions that led to an overall
increase for calendar year 2015
contributed to this incremental
increase. As stated previously, this
trend is expected to continue into
the new year.
California rose one full day from
Q4 2014 climbing to 12.3 days. As
highlighted in last quarter’s article,
the El Nino weather pattern had
the potential to produce record

9
U.S. Average Length of Rental (LOR) by StateQ4 2015
11.6
11.9
10
12
10.5
12.3
12.210.6
12.6
12.211.5
13.3
12.4
11.2
9.6
10.4
9
10.6 10.9
11.2
11.4
13.0
12.2
12.112
11.3
13.7
12.8
11.7
11.8
11.5
10.512.6
11.4
12.6
10
1114.6
11.9
11.7
12
9.6
9.1
9.7
9.7
11
12.5
Southern California
had the highest LOR
in the state at 12.7
days and the highest
average estimate at
28.6 hours.
Average Length of Rental for Repairable Vehicles
Figure 2
Average Billed Days for USQ4 2014 Q4 2015 Change
11.4 11.9 Up
Region Average Billed Days for US
RegionQ4 2014
LORQ4 2015
LORChange
California 11.3 12.3 UP
Mid-Atlantic 11.0 11.4 UP
Midwest 10.6 10.9 UP
Mountain 12.2 12.0 DOWN
Northeast 12.2 12.8 UP
Northwest 10.3 10.9 UP
Pacific 10.5 10.8 UP
Southeast 11.3 12.2 UP
Southwest 12.2 12.9 UP

10
distinction of being the only state
in the region to drop in LOR in Q4
2015 compared to the 5 year Q1
average of 12 days.
In general, the Midwest
experienced an extremely mild Q4,
especially in comparison to the past
two fourth quarters. While rain was
plentiful in many states, snowfall
and cold weather did not make an
appearance in the majority of the
region. The increase in frequency
as noted earlier, as well as an
increase in reported deer hits in
some parts of the region led the
Midwest to experience an increase
to 10.9 days, up 0.3 but still the
lowest region in the country. The
majority of deer hits occur in Q4
in the Midwest as deer are in the
migration and mating season.
Kentucky led the increase in LOR
up 0.9 to 13.0 days, followed by
Ohio at 11.4 days and Kansas and
Michigan at 11.2 days. Michigan
had the largest decline from Q4
2014 dropping 0.7 days. Other
states following closely behind
with higher rental lengths were
Missouri up 0.7 days to 11.0 days
and Wisconsin up 0.6 days to a 9.7
LOR. Five states in the region were
below 10 days, including North
Dakota at nine days. The others
include Minnesota at 9.1 days,
Nebraska at 9.6 days, and Iowa and
Wisconsin at 9.7 days. While the
majority of the Midwest has been
rainfalls for parts of the state. This
has led to mild weather elsewhere
in the country, but caused places
like San Diego that typically
have picture perfect weather, to
resemble Seattle at times.
Southern California had the
highest LOR in the state at 12.7
days and the highest average
estimate at 28.6 hours. Historically
we see this portion of the state as
the lowest with Northern California
as the highest. From Q3 2015 San
Francisco came in at 11.4 days and
the Sacramento area coming in
at 11.6. For comparison purposes,
San Francisco’s average estimate
was 21.9 hours, suggesting the
damages in Southern California
were more than a few bumper
repairs. Moving into the 1st quarter
of 2016 we should expect to see
a continuation in this trend for
California.
The Mid-Atlantic region increased
0.4 days from Q4 2014 winding
up at 11.4. Delaware and
Pennsylvania at11.4 days were
the only two states to experience
a drop in LOR by 0.3 days and 0.2
days respectively. States with the
largest increase of 0.7 days in LOR
were Maryland at 11.7 days, and
North Carolina at 11.5 days. The
highest LOR in the region was West
Virginia at 12.6 days with Virginia
having the lowest at 10.5 days.
New Jersey, at 11.9 days, holds the
Average Length of Rental for Repairable Vehicles
Click here to view theCasualty Edition
Industry Trends
Report
Volume Five Number OneQ1 2016Published by Mitchell
FEATURED IN THIS ISSUE:
ICD-10–How is the Casualty Industry Measuring Up?By Michele Hibbert-Iacobacci, CCSP, CMCOVice President, Information Management & Support, Mitchell Casualty Solutions

11
spared typical winter weather,
the consensus is winter weather
is still likely and that could impact
Q1 2016. There is also potential
for significant hail come spring as
El Niño patterns have historically
brought unstable weather to this
part of the county in spring.
The Mountain region experienced
the only regional decline in LOR
dropping 0.2 days to 12 overall.
The largest decrease came from
Wyoming down 0.9 days followed
by Colorado at 12.6 days, down 0.5
days. Colorado has been hit with
hail so often, collision repairers are
still trying to keep up with sheer
volume. Montana had the largest
increase in LOR, up 0.3 days to 10.8,
and Utah finished the quarter at
10.6 days, the lowest in the region
but up 0.2 days.
The Northeast led the nation with
the highest LOR at 12.8 days.
Rhode Island had the highest
LOR in the country and almost
toppled the 16-day mark ending
the quarter at 15.9 days, up 1.1 day
from Q4 2015 and 1.3 days higher
than the 5-year average. The
drivable LOR for Q4 2015 in Rhode
Island was 12.9 days and the non-
drive finished at a whopping 21
days. Massachusetts followed suit
by being the second highest in the
country with a LOR of 14.6 days,
up 0.8. Only the state of Vermont
declined to 9.6 days, down 0.7 and
Maine at 10days overall, stayed the
same as Q4 2014, The other states
with an increase include New York
at 12.5 days, New Hampshire at 11
and Connecticut at 12 days.
The LOR in the Northwest grew by
0.6 days to 10.9 days. Oregon saw
the largest increase, up 1 day to
12for Q4 2015. Oregon has steadily
increased LOR for Q4’s over the past
5 years and is up.
1.4 days from that average. Idaho
dropped 0.5 days to 10 overall and
Washington increased 0.6 days to
10.7 days.
Tracking down to the Southeast,
LOR increased to 12.2 days, a
sizable increase of 0.9 days from
Q4 2014. Leading the increase was
Louisiana at 13.7 days, up 0.7 and
then Georgia at 12.8 days, up 1.4.
Arkansas and Alabama both saw
increases of 0.7 days finishing the
fourth quarter with an LOR of 11.3
days and 12.1 days respectively. No
state had a decrease in this region
as Florida increased 0.9 days to 11.7,
South Carolina up 0.6 days to 11.8
days. The lowest increase in LOR for
12
11.5
11
10.5
102011 2012 2013 2014 2015
CY 2015 Q4
Kentucky led the
increase in LOR up 0.9
to 13.0 days, followed
by Ohio at 11.4 days
and Kansas and
Michigan at 11.2 days.
Figure 3—Length of Rental Over Time
Days
Average Length of Rental for Repairable Vehicles

12 Average Length of Rental for Repairable Vehicles
the region was Mississippi up 0.3
days to 12.
The Southwest region also
climbed, reaching 12.9 days overall
up 0.7 from Q2 2015. Texas led
the charge, up 0.8 days to a new
Q4 high of 13.3 days. All states in
the region showed Q4 increases
including Arizona at 11.5 days, and
New Mexico at 12.2 days, both up
a half day. Slightly more of an LOR
increase occurred in Oklahoma as
they increased 0.6 days with an
LOR of 12.4. The smallest increase
of 0.1 day was in Nevada with a Q4
2015 LOR of 12.2 days.
The state Of Alaska, which was
limited in snow fall last year, saw an
increase of 1.3 days to 12.5. As you
may recall Alaska’s relatively mild
weather last year had shop owners
hoping for a bit of weather this
season. So far business has increased
as some weather and an increase in
claims have started to impact shop
capacity.
Hawaii, which has been extremely
stable in Q4’s historically (one may
think the weather in paradise helps);
saw a modest increase of 0.2 days
with a final LOR of 10.3 days. One
would expect a much higher LOR due
to parts availability, but our friends on
the islands clearly have figured out
that obstacle.
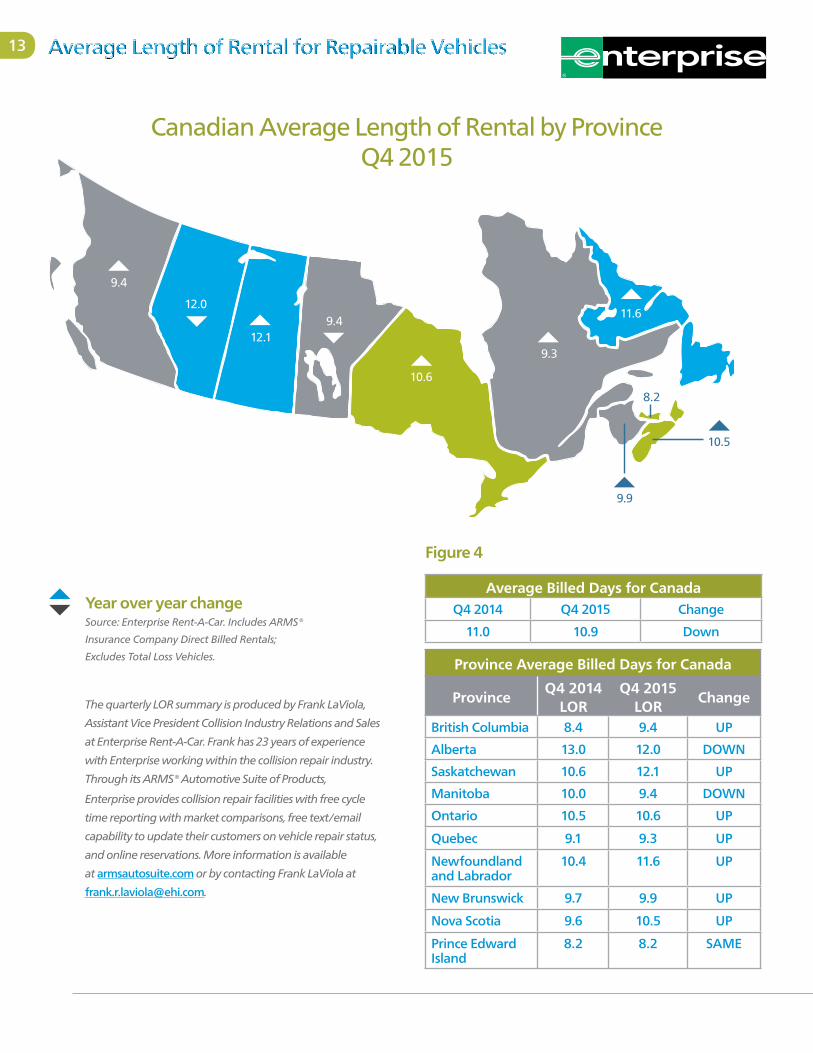
CanadaCanada dropped 0.1 days to 10.9
days Length of Rental in Q4 2015.
Prince Edward Island led the Canadian
Provinces with a low LOR of 8.2
days, matching Q4 2014. Quebec
was the next lowest at 9.3 days, an
increase of 0.2 days, followed by
New Brunswick at 9.9 days, an
increase of 0.2 days from Q4 2104.
Provinces with the highest LOR
were Alberta, coming in at 12 days,
but down 1 full day from last year,
Ontario with 10.6 days and Nova
Scotia at 10.5 days. Nova Scotia’s
LOR also increased 0.9 days from
last Q4 and marked the first Q4
in 5 years that the province was
over 10 days. British Columbia,
Saskatchewan and Manitoba are
excluded due to the presence of
government insurers ICBC, MPI
and SGI.
13
Province Average Billed Days for Canada
ProvinceQ4 2014
LORQ4 2015
LORChange
British Columbia 8.4 9.4 UP
Alberta 13.0 12.0 DOWN
Saskatchewan 10.6 12.1 UP
Manitoba 10.0 9.4 DOWN
Ontario 10.5 10.6 UP
Quebec 9.1 9.3 UP
Newfoundland and Labrador
10.4 11.6 UP
New Brunswick 9.7 9.9 UP
Nova Scotia 9.6 10.5 UP
Prince Edward Island
8.2 8.2 SAME
Average Billed Days for CanadaQ4 2014 Q4 2015 Change
11.0 10.9 Down
Canadian Average Length of Rental by Province Q4 2015
Year over year changeSource: Enterprise Rent-A-Car. Includes ARMS®
Insurance Company Direct Billed Rentals;
Excludes Total Loss Vehicles.
10.6
9.3
9.4
9.9
10.5
8.2
12.0
9.4
12.1
11.6
The quarterly LOR summary is produced by Frank LaViola,
Assistant Vice President Collision Industry Relations and Sales
at Enterprise Rent-A-Car. Frank has 23 years of experience
with Enterprise working within the collision repair industry.
Through its ARMS® Automotive Suite of Products,
Enterprise provides collision repair facilities with free cycle
time reporting with market comparisons, free text/email
capability to update their customers on vehicle repair status,
and online reservations. More information is available
at armsautosuite.com or by contacting Frank LaViola at
Figure 4
Average Length of Rental for Repairable Vehicles

14
From CollisionWeekPublished November 24, 2015
Current Events in the Collision Industry
Collision Claims, Frequency and Losses Grow During 1st Half of 2015
According to the latest available
Fast Track Monitoring system data
from the Independent Statistical
Service Inc. (ISS), private passenger
collision claims and losses
continued to grow during the first
half of 2015. Claims have risen in
all but two quarters from 2011
through 2014.
Data through the year that
ended in the second quarter of
2015 shows that collision claims
frequency has increased to 5.95
claims per 100 earned car years
up 6.82 percent compared to the
most recent low of 5.57 claims
for the year ended in the fourth
quarter of 2012.
Paid losses for private passenger
collision claims have increased
substantially, surpassing the
previous high set in the first quarter
of 2008. The data shows collision
losses at $21.36 billion for the
12-month period ended in the
second quarter of 2015, that is 8.4
percent above the $19.71 billion in
There were over
216,000 more collision
claims for the year
ending in the second
quarter of 2015 versus
the previous year, an
increase of 3.5 percent.
Major auto physical damage indicators continue to see increases this year after strong performance in 2014. Losses on collision claims up 8.4 percent during the first half versus a year ago.

15
collision claims for the year ending
with the second quarter of 2014.
The average paid claim cost stood
at $3,351 for the year ending in
the second quarter of 2015, up
4.69 percent compared to $3,201
a year earlier. While paid claim cost
is higher than repaired claim costs
due to the impact of total losses,
it provides an indication on the
growth trend in severity.
As our chart indicates, the number
of collision claims, on a year-
ending basis, has been rising
steadily since 2012 after four
years of sideways movement that
ran in concert with the recession.
There were over 216,000 more
collision claims for the year
ending in the second quarter of
2015 versus the previous year,
an increase of 3.5 percent. The
rate of growth in the number
of claims has declined during
the first half of 2015 compared
to the over 6 percent growth
recorded during 2014.
Looking back to 2002, the
number of claims declined until
the fourth quarter of 2006, when
claims clocked six consecutive
quarters of growth until starting to
decline for the year ending in the
third quarter of 2009.
Continued strength in new vehicle
sales, such as those projected by
the National Automobile Dealers
Association for 2016, should
help increase the pool of vehicles
covered for collision losses,
buoying collision claim and loss
trends into the near future.
02-4 03-2 03-4 04-2 05-2 06-2 07-2 08-2 09-2 10-2 11-2 12-2 13-2 14-204-4 05-4 06-4 07-4 08-4 09-4 10-4 11-4 12-4 13-4 14-4
$22B6.5M
CLA
IMS
LOSS
ES
6.3M
6.1M
5.9M
5.7M
5.5M
5.3M
5.1M
$21B
$20B
$19B
$18B
$17B
$16B
$15B
$14B
$13B
$12B
Figure 5—Private PassengerCollision Claims & Losses
Current Events in the Collision Industry

16 Current Events in the Collision Industry
Yesterday, two pieces of legislation
touching upon the collision repair
industry in Pennsylvania were
approved by the Commonwealth’s
House of Representatives in floor
votes. House Bill 1638 (HB1638)
proposes to amend the 1972 Motor
Vehicle Physical Damage Appraiser
Act to eliminate the requirement for
physical inspections.
Section 11(c) of the Appraiser Act
currently requires a personal
inspection in the preparation of
an estimate stating, “No appraiser
shall secure or use repair estimates
that have been obtained by the
use of photographs, telephone
calls or in any manner other than a
personal inspection.”
HB1638 proposes to eliminate that
requirement by replacing Section
11(c) with the following:
An appraiser may prepare a repair
estimate obtained by personal
inspection or by photographs, videos
or telephonic means. An appraiser
may not require the SUBMISSION
OF photographs or videos in order
to obtain an appraisal.
Pennsylvania House of Representatives Approves Photo-Video AppraisalBill seeks to amend the Commonwealth’s 1972 Appraisers Act that requires physical inspections of collision damaged vehicles and make the sale an installation of non-functioning airbags illegally approved.From CollisionWeekPublished December 16, 2015
An appraiser may
prepare a repair
estimate obtained by
personal inspection or
by photographs, videos
or telephonic means.

17
Collision repair facility operators
opposed to the bill, including the
Pennsylvania Collision Trade Guild,
have raised concerns about the
impact of the bill on consumer safety.
Opponents of the bill also see an
impact to insurance company claim
process with non-DRP collision repair
shops. The requirements in the 1972
Appraiser Act to both personally
inspect the vehicle, which often
takes place at the collision repair
facility, combined with the need to
“leave” a copy of the estimate help
to reduce supplements by affording
the opportunity to communicate
with the insurance appraiser about
the vehicle repair. Opponents are
concerned this process will be
disrupted leading to incomplete
estimates by insurance company
personnel that require supplements
and delays for the consumer.
Last year, a similar regulation
change was adopted in
Massachusetts by its Auto Damage
Appraiser Licensing Board (ADALB)
allowing the use of photographs
and video. That change was
rescinded earlier this year.
New ADALB board members
appointed by the Governor earlier
this year stated that insurers were
abusing the ability by writing low
estimates. They also cited safety
concerns due to the possibility
of hidden damage that could be
missed that might affect safety.
Proponents of the measure in
Massachusetts saw the measure
as an update reflecting the
capabilities of new technology
that could improve efficiency,
lower costs, and raise customer
satisfaction. They maintained
safety concerns could be avoided
through the internal processes
used by insurers to gauge the
severity of damage of the vehicle
and determine if the vehicle
needed a physical inspection.
HB1638 was approved by the full
house by a vote of 116–79. It will
now move to the state Senate for
consideration later this year or in
2016.
AN APPRAISER, OR AN INSURER
AS PART OF THE APPRAISAL
PROCESS, SHALL DISCLOSE TO
THE OWNER OF THE VEHICLE
THAT THERE IS NO REQUIREMENT
TO SUBMIT PHOTOGRAPHS OR
VIDEOS IN ORDER TO OBTAIN AN
APPRAISAL.
The bill also makes minor language
changes to Section 11(b) that
requires an appraiser to “leave” a
legible copy of an estimate with the
consumer’s choice of collision repair
shops. The proposal strikes “leave”
and inserts “furnish” in its place.
The bill’s sponsor, Representative
Mike Tobash, explained in a
September memo to House
members that, “There are new
methods of inspection that improve
customer service and satisfaction
and are based on new quality
electronic enhancements and
developments. In other states,
insurance companies allow vehicle
owners to photograph or video tape
damages and submit the photos
and/or videos to their insurance
company for review and generate
an estimated cost to repair
their damages.”
According to Tobash’s memo, there
are currently 45 other states that
allow the use of photographs and/
or video in the appraisal process.
According to Tobash’s
memo, there are
currently 45 other
states that allow the
use of photographs
and/or video in the
appraisal process.
Current Events in the Collision Industry

18 Current Events in the Collision Industry
Cadillac to Launch Aluminum Collision Repair Network
General Motors (NYSE:GM)
announced the launch of its
Cadillac Aluminum Repair Network
in conjunction with the upcoming
production of the Cadillac CT6 at
the end of 2015.
The Cadillac CT6 uses an advanced
mixed material approach for its
lightweight body structure. The
aluminum intensive structure also
includes 11 different materials to
achieve strength, performance and
efficiency thresholds.
Initial shipments of the vehicle to
dealers are expected in March.
Last summer at NACE, CollisionWeek
spoke with John Eck, manager
wholesale dealer channel for General
Motors, who described some of the
details of the network including the
facility verification process, the size
of the network and restrictions that
will be placed by GM on the sale of
structural parts.
According to Eck, GM dealers will
verify the VIN of the vehicle and that
the repair facility is part of its network
before releasing structural parts for
collision repairs to the vehicle.
Facilities that participate
in the network,
both authorized dealers
and independent body
shops will undergo
annual audits as part
of their continuation
in the program.
Program open to both dealers and independent repair facilities. Includes specific facility, training and equipment requirements to repair the Cadillac CT6 along with annual on-site audits.
From CollisionWeekPublished December 16, 2015

Page Title19
The Cadillac Aluminum Repair
Network will ensure that authorized
collision repair facilities have
the required tools, equipment,
processing procedures, and training
to properly repair the vehicle.
Facilities that participate in the
network, both authorized dealers
and independent body shops will
undergo annual audits as part of
their continuation in the program.
These audits will provide Cadillac
with a process to verify a shop’s
compliance with the network
requirements. It also establishes
a level of consistency between all
participating shops that allows
Cadillac to promote the Cadillac
Aluminum Repair Network to
Cadillac CT6 owners.
Training will be primarily web
based and orchestrated through
a combined effort between GM
and I-CAR. In addition, GM will
support the collision repair industry
by offering the CT6 collision repair
information at no charge.
Information on the Cadillac
Aluminum Repair Network is
available online, including a body
shop participation agreement
and other documents. In the
first quarter of 2016 technical
documents, service bulletins, paint
information, warranty information,
VIN, and other information will
be available.

20 Current Events in the Collision Industry
FinishMaster Completes Purchase of ColorMaster Automotive Paint
FinishMaster Inc., a leading distributor
of paint and related products in
the United States and subsidiary of
Uni-Select Inc., announced today
that it has completed the acquisition
of substantially all of the assets of
ColorMaster Automotive Paint Inc.
This transaction was announced on
Dec. 28, 2015 and its consummation
was subject to certain customary
closing conditions, all of which have
been satisfied.
“We are happy to welcome more
than 76 new team members to the
FinishMaster family. Our combined
efforts will accelerate growth in new
geographic areas and maximize our
service, product, and technical support
to new and existing customers,” said
Steve Arndt, President and Chief
Operating Officer, FinishMaster.
“This acquisition of a leading regional
player in the automotive refinish
sector is a key strategic addition to our
portfolio,” said Henry Buckley,
President and Chief Executive Officer
of Uni-Select.
FinishMaster is a leading national
independent distributor of automotive
paints, coatings and related accessories
in the United States. FinishMaster
operates three major distribution
centers with 187 branches and more
than 1,600 teammates in 30 states.
FinishMaster
operates three major
distribution centers
with 187 branches
and more than
1,600 teammates
in 30 states.
From ABRNPublished January 4, 2016

21 Current Events in the Collision Industry

22 Motor Vehicle Markets
New Vehicle Sales
Cars Trucks/Vans/SUVs
Camry 429,355 F-Series 726,246
Corolla 363,332 Silverado 600,544
Accord 355,557 Ram Pickup 435,304
Civic 335,384 CR-V 345,647
Altima 333,398 RAV4 315,412
Fusion 300,170 Escape 306,492
Elantra 241,706 Rogue 287,190
Cruze 226,602 Equinox 277,589
Sonata 213,303 Explorer 249,251
Sentra 203,509 Sierra 224,139
Figure 6—WardsAuto 10 Best Selling U.S. Cars and Trucks As of December 2015
Number of Vehicles
2,548,9743,082,366
23,7985,655,1381,586,551
761,7103,870
625,816319,184
95,3421,484,918
582,6752,499,3137,959,379
202,202404,537380,691
2,228,09585,04851,755
349,44070,046
3,771,81417,386,331
FordGM
Tesla MotorsNorth America Total
HondaHyundai
IsuzuKia
MazdaMitsubishi
NissanSubaruToyota
Asia/Pacific TotalAudi
BMWDaimler
FCAJaguar Land Rover
PorscheVolkswagen
VolvoEurope Total
Total Light Vehicles
5.45.0
72.65.43.05.0
-17.57.94.4
22.87.1
13.45.36.0
11.12.23.87.3
26.510.1-4.8
24.36.05.8
18M3M1M500K300K100K50K
Vo
l % C
han
ge fro
m 2014 Sales
Figure 7—WardsAuto U.S. Light Vehicle Sales by Company December 2015
Light vehicles are cars and light trucks (GVW Classes 1-3, under 14,001 lbs.). DSR is daily sales rate. Tesla Motors monthly sales estimated.Source: WardsAuto InfoBank
Source: WardsAuto InfoBank

23
Current Used Vehicle Market ConditionsSeptember 2015 Kontos Kommentary
By Tom Kontos Executive Vice President, ADESA Analytical ServicesThe following commentary is produced monthly by Tom Kontos, Executive Vice-President, ADESA Analytical Services. ADESA is a leading provider of wholesale used vehicle auctions and ancillary remarketing services.
As part of the KAR Auction Services family, ADESA works in collaboration with its sister company, Insurance Auto Auctions, a leading salvage auto auction company, to provide insights, trends and highlights of the entire automotive auction industry.
Summary
2015 was largely a year when strong
retail used vehicle and CPO demand,
benign new vehicle incentive activity,
and the embrace of upstream as
well as traditional auction processes
among remarketers diluted the usual
negative impact of growing supply
on wholesale values. Further masking
that impact was the displacement
of off-rental program vehicle
volume that appeared in the first
half of the year rather than the last
quarter of 2014. These high-dollar,
late-model units biased average
wholesale prices upward for much
of the year. Nevertheless, supply
growth underlies the wholesale price
softness seen later in the year and
most evidently in December, as prices
fell by upwards of one percent on
both a month-over-month and year-
over-year basis.
(More information on annual results and trends in 2015 will be provided in the year-end edition of Pulse.)
Details According to ADESA Analytical Services’ monthly analysis of Wholesale Used Vehicle Prices by Vehicle Model Class1, wholesale used vehicle prices in December averaged $9,763—down 1.2% compared to November and down 1.0% relative to December 2014. Minivans were the only model class segment that showed a significant month-over-month increase, and in general, prices in the truck classes declined less than for cars and crossovers.
Average wholesale prices for used vehicles remarketed by manufacturers were up 1.6% month-over-month but down 3.5% year-over-year. Prices for fleet/lease consignors were down 0.1% sequentially and down 0.7%
annually. Within that category,
off-rental risk units had modest
month-over-month and year-over-
year price increases, while prices for
three-model-year-old vehicles, a proxy
for off-lease vehicles, were down
significantly both month-over-month
and year-over-year. Dealer consignors
saw a 2.0% price decrease versus
November and a 1.2% decrease
relative to December 2014.
Data from NADA showed a 6.4%
year-over-year increase in used vehicle
sales by franchised dealers and an
11.7% increase for independent
dealers in December, and both were
up on a month-over-month basis as
well. November CPO sales were up
23.3% month-over-month and 13.1%
year-over-year, according to figures
from Autodata. This closes another
record year for certified sales, which
exceeded 2.5 million units.
Average Prices ($/Unit) Latest Month Versus
Dec-15 Nov-15 Dec-14 Prior Month Prior Year
Total All Vehicles $9,763 $9,883 $9,864 -1.2% -1.0%
Total Cars $8,138 $8,262 $8,620 -1.5% -5.6%
Compact Car $6,398 $6,577 $6,654 -2.7% -3.8%
Midsize Car $7,352 $7,422 $7,712 -0.9% -4.7%
Fullsize Car $6,490 $6,867 $6,075 -5.5% 6.8%
Luxury Car $11,810 $12,022 $12,466 -1.8% -5.3%
Sporty Car $12,065 $12,084 $12,950 -0.2% -6.8%
Total Trucks $11,608 $11,667 $10,851 -0.5% 7.0%
Mini Van $7,617 $7,266 $7,658 4.8% -0.5%
Fullsize Van $10,953 $11,583 $10,198 -5.4% 7.4%
Mini SUV $13,514 $13,518 $12,748 0.0% 6.0%
Midsize SUV $8,486 $8,545 $7,763 -0.7% 9.3%
Fullsize SUV $11,864 $11,941 $11,569 -0.6% 2.6%
Luxury SUV $18,308 $18,683 $19,109 -2.0% -4.2%
Compact Pickup $8,024 $7,960 $7,441 0.8% 7.8%
Fullsize Pickup $14,518 $14,649 $13,027 -0.9% 11.4%
Total Crossovers $11,341 $11,541 $11,931 -1.7% -4.9%
Compact CUV $10,036 $10,214 $10,565 -1.7% -5.0%
Mid/Fullsize CUV $12,281 $12,497 $12,875 -1.7% -4.6%
Figure 8—Wholesale Used Vehicle Price Trends
Source: ADESA Analytical Services
1The analysis is based on over seven million annual sales transactions from over 150 of the largest U.S. wholesale auto auctions, including those of ADESA as well as other auction companies. ADESA Analytical Services segregates these transactions to study trends by vehicle model class, sale type, model year, etc.
The views and analysis provided herein relate to the vehicle remarketing industry as a whole and may not relate directly to KAR Auction Services, Inc. The views and analysis are not the views of KAR Auction Services, its management or its subsidiaries; and their accuracy is not warranted. The statements contained in this report and statements that the
company may make orally in connection with this report that are not historical facts are forward-looking statements. Words such as “should,” “may,” “will,” “anticipates,” “expects,” “intends,” “plans,” “believes,” “seeks,” “estimates,” “bode”, “promises”, “likely to” and similar expressions identify forward-looking statements. Forward-looking statements are
subject to risks and uncertainties that could cause actual results to differ materially from the results projected, expressed or implied by the forward-looking statements. Factors that could cause or contribute to such differences include those matters disclosed in the company’s Securities and Exchange Commission filings. The company does not undertake any
obligation to update any forward-looking statements.
Motor Vehicle Markets

24 Mitchell Collision Repair Industry Data
Mitchell Estimating is an advanced
estimating system, combining database
accuracy, automated calculations, and
repair procedure pages to produce
estimates that are comprehensive,
verifiable, and accepted throughout the
collision industry. Mitchell Estimating
is an integral part of Mitchell’s
appraisal workflow solutions.
Visit Mitchell’s website at www.mitchell.com
MITCHELL SOLUTION:
Mitchell Estimating™
Appraisal ValuesThe initial average appraisal value, calculated by combining data from all first
and third-party repairable vehicle appraisals uploaded through Mitchell systems
in Q4 2015 was $2,970, $5 higher than the previous year’s Q4 2014 appraisal
average of $2,965.
Applying the prescribed development factor of 1.48% to these data produces
an anticipated average appraisal value of $3,013. The ACV during the quarter
was the second highest of the quarters surveyed indicating strong
residual values.
Collision LossesMitchell’s Q4 2015 data reflect an initial average gross Collision appraisal value
of $3,293, $39 less than this same period last year. However, by applying the
indicated development factor, suggests a final Q4 2015 average gross collision
appraisal value will be $ 3,344, $12 higher than the same quarter last year.
At the average Actual Cash Value (ACV) of vehicles appraised for Collision losses
during Q1 2015 was $15,389, the highest value of the quarters surveyed.
Fig.8—Average Appraisal Values, ACVs and Age | All APD Line Coverages*
$2,804 $2,854 $2,816 $2,965 $2,927 $2,970
$13,925 $14,001 $14,313 $14,306 $14,809 $14,740
$0
$2,000
$4,000
$6,000
$8,000
$10,000
$12,000
$14,000
$16,000
Q2 2013 7.41
Q4 2013 7.64
Q2 2014 7.39
Q4 2014 7.61
Q2 2015 7.39
Q4 2015 7.53 Avg. Veh Age in years
Appraisals ACV’s
$3,013/
* Values provided from Guidebook benchmark averages, furnished through Mitchell Estimating.
$3,055 $3,237 $3,097 $3,332 $3,249 $3,293
$14,630 $14,701 $14,843 $14,931 $15,380 $15,389
$0
$2,000
$4,000
$6,000
$8,000
$10,000
$12,000
$14,000
$16,000
$18,000
Q2 2013 6.89
Q4 2013 7.14
Q2 2014 6.91
Q4 2014 7.13
Q2 2015 6.91
Q4 2015 7.06
$3,344/
Appraisals ACV’s
Fig. 9—Average Appraisal Values, ACVs and Age | Collision Coverage*
Avg. Veh Age in years
* Values provided from Guidebook benchmark averages, furnished through Mitchell Estimating.

25
Click here to view theCasualty Edition
Industry Trends
Report
Volume Five Number OneQ1 2016Published by Mitchell
FEATURED IN THIS ISSUE:
ICD-10–How is the Casualty Industry Measuring Up?By Michele Hibbert-Iacobacci, CCSP, CMCOVice President, Information Management & Support, Mitchell Casualty Solutions
Comprehensive LossesIn Q4 2015, the average initial gross appraisal value for Comprehensive coverage
estimates processed through our servers was $3,040; compared to $2,935 in Q4 2014.
Applying the prescribed development factor of 1.02% for this data set produces an
increase in the adjusted value to $3,072.
Third-Party Property DamageIn Q4 2015, our initial average gross Third-party Property Damage appraisal
was $2,699 compared to $2,685 in Q4 2014, reflecting a $14 initial increase
between these respective periods. Adding the prescribed development factor
of .23% for this coverage type yields a Q4 2015 adjusted appraisal value of
$2,705; a $30 increase in average severity over Q4 2014.
Fig.10—Average Appraisal Values, ACVs and Age | Comprehensive Losses*
$3,246 $2,786 $2,940 $2,935 $3,125 $3,040
$14,420 $14,337 $15,024 $14,822
$15,696 $15,223
$0
$2,000
$4,000
$6,000
$8,000
$10,000
$12,000
$14,000
$16,000
$18,000
Q2 2013 7.38
Q4 2013 7.80
Q2 2014 7.29
Q4 2014 7.69
Q2 2015 7.38
Q4 2015 7.76
Appraisals ACV’s
$3,072/
* Values provided from Guidebook benchmark averages, furnished through Mitchell Estimating.
Fig. 11—Average Appraisal Values, ACVs and Age | Auto Physical Damage APD*
$2,467 $2,574 $2,565 $2,685 $2,626 $2,699
$13,165 $13,328 $13,621 $13,607 $14,017 $13,984
$0
$2,000
$4,000
$6,000
$8,000
$10,000
$12,000
$14,000
$16,000
Q2 2013 7.78
Q4 2013 8.00
Q2 2014 7.73
Q4 2014 7.97
Q2 2015 7.73
Q4 2015 7.84
$2,705/
ACV’sAppraisals
Avg. Veh Age in years
* Values provided from Guidebook benchmark averages, furnished through Mitchell Estimating.
Avg. Veh Age in years
Mitchell Collision Repair Industry Data

26 Mitchell Collision Repair Industry Data
Supplements
As it generally takes at least three months following the original date of appraisal to accumulate most supplements
against an original estimate of repair, we report (and recommend viewing supplement information) three months
after-the-fact, to obtain the most accurate view of these data.
Average Appraisal Make-Up
This chart compares the average appraisal make-up as a percentage of dollars, constructed by Mitchell-equipped
estimators. These data points reflect little change between labor and parts with a mere 1% increase in paint and
materials.
EDITOR’S NOTE
In Q4 2015, 32.15% of all original estimates prepared by Mitchell-equipped estimators during that period were
supplemented one or more times. In this same period, the pure supplement frequency (supplements to estimates), was
52.51%, reflecting a 3.08 pt. decrease from that same period in 2014. The average combined supplement variance for
this quarter was $813.03, $1.24 lower than in Q4 2014.
Fig. 12—Average Supplement Frequency and Severity
Date Q2/13 Q4/13 Q2/14 Q4/14 Q2/15 Q4/15 Pt. Change
% Change
% Est. Supplement 31.37 35.34 33 35.23 34.2 32.15 -3.08 -9%
% Supplement 44.01 47.87 46.85 49.22 49.09 52.51 3.29 7%
Avg. Combined Supp. Variance $ 765.5 763.26 764.04 814.27 873.79 813.03 -1.24 0%
% Supplement $ 27.3 26.75 27.13 27.46 29.86 27.37 -0.09 0%
Fig. 13—% Average Appraisal Dollars by Type
Date Q2/13 Q4/13 Q2/14 Q4/14 Q2/15 Q4/15 Pt. Change
% Change
% Average Part $ 40.58 45.25 41.23 45.25 43.23 45.46 0.21 0%
% Average Labor $ 48.44 43.27 47.71 43.42 45.71 43.27 -0.15 0%
% Paint Material $ 10.66 10.46 10.64 10.38 10.55 10.47 0.09 1%

27
Parts Type Definitions
Original Equipment Manufacturer (OEM)Parts produced directly by the
vehicle manufacturer or their
authorized supplier, and delivered
through the manufacturer’s
designated and approved supply
channels. This category covers all
automotive parts, including sheet
metal and mechanical parts.
Aftermarket Parts produced and/or supplied
by firms other than the Original
Equipment Manufacturer’s
designated supply channel. This
may also include those parts
originally manufactured by
endorsed OEM suppliers, which
have later followed alternative
distribution and sales processes.
While this part category is often
only associated with crash
replacement parts, the automotive
aftermarket also includes a large
variety of mechanical and custom
parts as well.
Non-New/Remanufactured Parts removed from an existing
vehicle that are cleaned, inspected,
repaired and/or rebuilt, usually
back to the original equipment
manufacturer’s specifications, and
re-marketed through either the
OEM or alternative supply chains.
While commonly associated with
mechanical hard parts such as
alternators, starters and engines,
remanufactured parts may also
include select crash parts such
as urethane and TPO bumpers,
radiators and wheels as well.
Recycled Parts removed from a salvaged
vehicle and re-marketed through
private or consolidated auto parts
recyclers. This category commonly
includes all types of parts and
assemblies, especially body, interior
and mechanical parts.
While there isn’t a perfect
correlation between the
types of parts specified
by estimators and those
actually used during the
course of repairs, we
feel that the following
observations to be
directionally accurate for
both the insurance and
auto body repair industries.
This segment illuminates
the percentage of dollars
allocated to each unique
part-type.
As a general observation,
recent data show that parts
make up 45% of the average
value per repairable vehicle
appraisal, about (.6) points
more than the average
allocation of labor dollars. In
addition, the current trend
reflects a continued decrease
in the use of new OEM
parts, likely as a result of the
increases in collision parts
taken by the manufacturers
to offset increased delivery
and storage expenses.
EDITOR’S NOTEParts Analysis
Mitchell Collision Repair Industry Data

28 Mitchell Collision Repair Industry Data
Original Equipment Manufacturer (OEM) Parts Use in Dollars
In Q4 2015, OEM parts represented only 65.16% of all parts dollars specified
by Mitchell-equipped estimators. These data reflect a 1.67 points relative
decrease from Q4 2014.
Aftermarket Parts Use in Dollars
In Q4 2014, 16.15% of all parts dollars recorded on Mitchell appraisals were
attributed to Aftermarket sources, up 1.84 points from Q4 2014.
Remanufactured Parts Use in Dollars
Currently listed as “Non-New” parts in our estimating platform and reporting
products, Remanufactured parts currently represent 5.84% of the average
gross parts dollars used in Mitchell appraisals during Q4 2015. This reflects a
0.32 relative decrease over this same period in 2014.
6.08% 6.71% 6.09% 6.16% 5.75% 5.84%
Q2 2013 Q4 2013 Q2 2014 Q4 2014 Q2 2015 Q4 2015
Fig. 16—Parts-Remanufactured
12.74% 13.71% 13.72% 14.31% 14.28% 16.15%
Q2 2013 Q4 2013 Q2 2014 Q4 2014 Q2 2015 Q4 2015
Fig. 15—Parts-Aftermarket
Fig. 14—Parts-New
68.37% 66.45% 67.92% 66.83% 67.39% 65.16%
Q2 2013 Q4 2013 Q2 2014 Q4 2014 Q2 2015 Q4 2015
Mitchell’s Quality Recycled Parts (QRP)
program is the most comprehensive
source for finding recycled parts,
providing online access to a parts
database compiled from a growing
network of more than 800 of the
highest quality recyclers in North
America and Canada.
For more information on QRP,
visit Mitchell’s website at
www.mitchell.com.
MITCHELL SOLUTION:
Mitchell QRP™
Mitchell MAPP™
Mitchell Alternate Parts Program
(MAPP) offers automated access
to nearly 100 Remanufactured
and Aftermarket part types from
over 700 suppliers ensuring shops
get the parts they need from their
preferred vendors.
For more information on MAPP,
visit Mitchell’s website at www.mitchell.com.
MITCHELL SOLUTION:

29
EDITOR’S NOTE
It is commonly understood
within the collision repair
and insurance industries
that a very large number of
RECYCLED “parts” are actually
“parts-assemblies” (such as
doors, which in fact include
numerous attached parts and
pieces). Thus, attempting to
make discrete comparisons
between the average number
of RECYCLED and any
other parts types used per
estimate may be difficult and
inaccurate.
Mitchell’s Refinishing Materials
Calculator (RMC) provides accurate
calculations for refinishing materials
costs by incorporating a database of
over 7,000 paint codes from eight paint
manufacturers. It provides job-specific
materials costing according to color
and type of paint, plus access to the
only automated, accurate, field-tested,
and industry-accepted breakdown of
actual costs of primers, colors, clear coats,
additives and other materials needed to
restore vehicles to pre-accident condition.
For more information on RMC, visit
Mitchell’s website at www.mitchell.com.
MITCHELL SOLUTION:
Mitchell RMC™
Recycled Parts Use in Dollars
Recycled parts constituted 12.85% of the average parts dollars used per
appraisal during Q4 2015, reflecting a modest .15 increase from Q4 2014.
The Number of Parts by Part Type
In order to capture another aspect of parts use, we calculate the number of
parts used by part type on a repairable estimate. For Q4 2015, New OEM parts
use decreased again, with a modest increase in aftermarket parts as well as in
recycled parts.
Paint and Materials
During Q4 2015, Paint and Materials made up 10.47% of our average
appraisal value, representing a .09 point relative increase from Q4 2014.
Represented differently, the average paint and materials rate—achieved
by dividing the average paint and materials allowance per estimate by the
average estimate refinish hours—yielded a rate of $33.11 per refinish hour
in this period, compared to $32.77 in Q4 2014.
Fig. 17—Parts-Recycled
12.81% 13.13% 12.26% 12.70% 12.58% 12.85%
Q2 2013 Q4 2013 Q2 2014 Q4 2014 Q2 2015 Q4 2015
1.71 0.74 0.31
7.93
0
1
2
3
4
5
6
7
8
9
Q2 13 Q4 13 Q2 14 Q4 14 Q2 15 Q4 15
New OEMAftermarketRecycledRemanufactured
10.66 10.46 10.64 10.38 10.55 10.47
32.36 32.05 32.55 32.77 32.25 33.11
Q2 2013 Q4 2013 Q2 2014 Q4 2014 Q2 2015 Q4 2015
Fig. 19—Paint And Materials, By Quarter
Fig. 18—Parts-Recycled
Mitchell Collision Repair Industry Data

30 Mitchell Collision Repair Industry Data
Adjustments
In Q4 2015, the percentage of adjustments made to estimates decreased by 2%. The frequency of betterment
taken also decreased by 1%, while the average dollar amount of the betterment taken increased slightly
to $123.33. Appearance allowance frequency decreased by 2% and the dollar amount of that appearance
allowance decreased to $204.22.
Labor Analysis
For the full year of 2015 average body labor rates have risen in all states except New Jersey.
Fig. 20—Adjustment $ and %s
Fig. 22–Percent of average labor hours by type
Fig. 21—Average Body Labor Rates and Change by State
Replace
RefinishRepair
46.0%31.6%
22.4%
Date Q2/13 Q4/13 Q2/14 Q4/14 Q2/15 Q4/15 Pt/$ Change
% Change
% Adjustments Est 2.94 3.05 2.75 2.89 2.82 2.94 0.05 2%
% Betterment Est 2.34 2.5 2.15 2.37 2.23 2.39 0.02 1%
% Appear Allow Est 0.43 0.44 0.43 0.41 0.44 0.42 0.01 2%
% Prior Damage Est 2.87 2.77 3.01 2.79 2.98 2.59 -0.2 -7%
Avg. Betterment $ 121.58 119.62 120.87 121.56 124.15 123.33 1.77 1%
Avg. Appear Allow $ 203.64 199.99 212.19 208.13 210.92 204.22 -3.91 -2%
2014 2015 YTD $ Change % Change
Arizona $ 48.34 $ 49.73 $ 1.39 3%
California $ 58.26 $ 61.12 $ 2.86 5%
Florida $ 41.14 $ 42.50 $ 1.36 3%
Hawaii $ 48.09 $ 50.98 $ 2.89 6%
Illinois $ 49.66 $ 50.06 $ 0.40 1%
Michigan $ 43.01 $ 43.68 $ 0.67 2%
New Jersey $ 46.58 $ 46.58 $ (0.0) 0%
New York $ 46.76 $ 47.37 $ 0.61 1%
Ohio $ 44.18 $ 45.16 $ 0.98 2%
Rhode Island $ 44.72 $ 45.17 $ 0.45 1%
Texas $ 43.26 $ 43.89 $ 0.63 1%

31
Mitchell WorkCenter™ Total LossMitchell WorkCenter™ Total Loss gives
your claims organization a statistically
driven, fully automated, web-based total
loss valuation system that generates fair,
market-driven values for loss vehicles.
It combines J.D. Power and Associates’
data analysis and pricing techniques
with Mitchell’s recognized leadership
in physical damage claims processing
solutions. Mitchell WorkCenter™
Total Loss helps you reduce settlement
time and improve customer satisfaction. www.mitchell.com.
MITCHELL SOLUTION:
The chart below illustrates the total loss data for both vehicle age and actual
cash value of total loss vehicles processed through Mitchell’s servers.
Total Loss
Vehicles Q2/13 Q4/13 Q2/14 Q4/14 Q2/15 Q4/15
Average Vehicle Age in Years
Convertible 11.67 12.13 12.14 12.83 12.35 12.85
Coupe 11.62 12.12 11.81 12.11 11.94 12.45
Hatchback 8.76 8.94 8.49 8.59 8.25 8.21
Sedan 10.3 10.6 10.3 10.53 10.26 10.56
Wagon 9.19 9.79 9.69 10.17 10.02 10.69
Other Passenger 12.14 12.67 12.63 12.67 13.04 12.33
Pickup 11.81 12.28 12.18 12.69 12.63 13.34
Van 10.88 11.32 11.04 11.49 11.29 11.79
SUV 9.97 10.39 10.09 10.42 10.2 10.49
Fig. 23—Average Vehicle Age in Years
Vehicles Q2/13 Q4/13 Q2/14 Q4/14 Q2/15 Q4/15
Average Actual Cash Value
Convertible 10,193.60 9,976.85 10,045.93 9,575.86 10,163.23 10,361.44
Coupe 7,322.94 7,205.99 7,493.71 7,686.78 7,958.80 8,014.12
Hatchback 8,207.56 8,041.86 8,569.69 8,216.17 8,477.33 8,607.60
Sedan 7,375.64 7,360.44 7,560.96 7,577.53 7,803.98 7,696.54
Wagon 7,455.04 7,162.20 7,057.93 6,870.76 6,926.95 6,636.81
Other Passenger 13,101.40 15,439.13 14,606.06 17,769.01 14,698.45 17,614.76
Pickup 9,589.92 10,052.48 10,381.83 10,508.74 11,101.02 11,258.30
Van 5,822.11 5,825.51 6,034.97 6,044.28 6,248.82 6,354.89
SUV 9,171.69 9,038.30 9,290.57 9,453.64 9,809.46 10,092.67
Fig. 24—Average Vehicle Total Loss Actual Cash Value
Total Loss Data

32 Canadian Collision Summary
At the request of our customers
and friends in Canada,
we are pleased to provide
the following Canada-specific
statistics, observations, and
trends. All dollar-figures
appearing in this section are
in CDN$. As a point
of clarification, these data are
the product of upload activities
from body shops, independent
appraisers, and insurance
personnel, more accurately
depicting insurance-paid loss
activity, rather than consumer
direct or retail market pricing.
Canadian Appraisal Severity
Fig. 26—Collision Losses
The average initial gross collision appraisal value uploaded through
Mitchell Canadian systems in Q4 2015 was $3,667, a $17 increase
from Q4 2014. However applying the prescribed development factor
yields an anticipated final average appraisal value of $3,728, a $78
increase from Q4 2014.
Canadian Average Appraisal Make-UpFigure 27—This chart compares the average appraisal make up as a percentage of dollars. These data points reflect a
slight increase in parts and paint and materials with a decrease in labour.
Fig. 25—Average Appraisal Values Severity Overall
The average gross initial appraisal value, calculated by combining data
from all first and third party repairable vehicle appraisals uploaded through
Mitchell Canadian systems in Q4 2015 was $3,751, a $32 increase from
Q4 2014. Applying the prescribed development factor yields an increase to
$3,654, a decrease of $65 over Q4 2014.
$3,279 $3,613 $3,195 $3,719 $3,502 $3,751
$14,547 $14,333 $13,734
$15,202 $15,474 $16,278
$0
$2,000
$4,000
$6,000
$8,000
$10,000
$12,000
$14,000
$16,000
$18,000
Q2 2013 5.46
Q4 2013 5.58
Q2 2014 5.41
Q4 2014 5.57
Q2 2015 5.48
Q4 2015 5.81 Avg. Veh Age in Years
$3,654/
Appraisals ACV’s
$3,303 $3,582 $3,222 $3,650 $3,512 $3,667
$14,543 $14,321 $13,751
$15,100 $15,332 $16,063
$0
$2,000
$4,000
$6,000
$8,000
$10,000
$12,000
$14,000
$16,000
$18,000
Q2 2013 5.36
Q4 2013 5.51
Q2 2014 5.31
Q4 2014 5.48
Q2 2015 5.38
Q4 2015 5.72
Appraisals ACV’s
Avg. Veh Age in years
$3,728/
Date Q2/13 Q4/13 Q2/14 Q4/14 Q2/15 Q4/15 Pt/$ Change % Change
% Average Part $ 41.85 44.36 42.63 44.65 43.65 44.68 0.03 0%
% Average Labour $ 46.33 44.12 45.37 44.16 44.33 43.75 -0.41 -1%
% Paint Material $ 8.85 8.45 9.08 8.28 8.68 8.38 0.1 1%

33
Canadian SupplementsFigure 30—In Q4 2015, 44.45% of all original estimates prepared by Mitchell-equipped Canadian estimators
were supplemented one or more times. In this same period, the pure supplement frequency (supplements to
estimates) was 81.82%, reflecting a significant increase from the fourth quarter 2014. The average combined
supplement variance for this quarter was $725.25, $116.06 lower than in Q4 2014.
About Mitchell in Canada…For more than 20 years, Mitchell’s
dedicated Canadian operations
have focused specifically and
entirely on the unique needs
of collision repairers and insurers
operating in the Canadian
marketplace. Our Canadian team
is known for making itself
readily available, for being flexible
in its approach to improving claims
and repair processes, and for its
‘second to none’ commitment
to customer support.
Headquartered in Toronto, with
offices across Canada, Mitchell
Canada delivers state-
of-the-art, multi-lingual collision
estimating and claims workflow
solutions (including hardware,
networks, training, and more),
world-class service, and
localized support.
Figure 29—Third-Party Property Damage
In Q4 2015, our Canadian industry initial average gross third party property
damage appraisal was $3,869, an increase of $77 from Q4 2014 on vehicles
with a significantly higher ACV. Applying the prescribed development factor,
we end up with a final value of $3,895.
Figure 28—Comprehensive Losses
In Q4 2015, the average initial gross Canadian appraisal value for comprehensive
coverage estimates processed through our servers was $4,046 or $152 higher
than in Q4 2014. Applying the prescribed development factor, the anticipated
final average appraisal value will be $4,102.
ACV’sAppraisals
$2,796/
$2,853 $3,236 $2,667
$3,792 $3,574 $3,869
$13,285 $12,825
$10,206
$13,177
$14,892
$17,234
$0
$2,000
$4,000
$6,000
$8,000
$10,000
$12,000
$14,000
$16,000
$18,000
$20,000
Q2 2013 6.95
Q4 2013 7.08
Q2 2014 7.56
Q4 2014 6.88
Q2 2015 7.48
Q4 2015 7.73 Avg. Veh Age in years
$3,895/
Date Q2/13 Q4/13 Q2/14 Q4/14 Q2/15 Q4/15 Pt/$ Change % Change
% Est Supplements 48.86 51.38 49.2 49.51 51.4 44.45 -5.06 -10%
% Supplements 75.98 70.07 79.24 67.86 78.79 81.82 13.96 21%
Avg Combined Supp Variance 556.81 609.05 710.28 841.31 842.58 725.25 -116.06 -14%
% Supplement $ 16.98 16.86 22.23 22.62 24.06 19.34 -3.28 -15%
$3,176 $3,672
$3,053 $3,894
$3,407 $4,046
$15,114 $14,833 $14,418
$15,804 $16,083 $16,781
$0
$2,000
$4,000
$6,000
$8,000
$10,000
$12,000
$14,000
$16,000
$18,000
Q2 2013 5.62
Q4 2013 5.63
Q2 2014 5.40
Q4 2014 5.66
Q2 2015 5.67
Q4 2015 5.97
$4,102/
Appraisals ACV’s
Avg. Veh Age in years
Canadian Collision Summary

34 Canadian Collision Summary
Fig. 33–Labour OperationsAverage Body Labour Rates and Change by Province
Canadian Adjustments
Figure 31—In Q4 2015, the average frequency betterment was taken on estimates increased by 6%, and the dollar
amount of that betterment increased by 56% . Appearance allowances increased by 20%, and the dollar amount of
those allowances increased by 32%.
Canadian Labour Analysis
Figure 32—All data reflects the percentage of labor dollars utilized in the creation of Mitchell appraisals
by Canadian estimators. Labour rates increased in all provinces and territories.
Canadian Paint and Materials
Figure 34—During Q4 2015, paint and materials made up 8.38% of our average appraisal value. Represented
differently, the average paint and materials hourly rate rose to just under $35.33 dollars per hour.
8.85 8.45 9.08 8.28 8.68 8.38
33.79 34.44 34.67 34.73 35.14 35.33
Q2 2013 Q4 2013 Q2 2014 Q4 2014 Q2 2015 Q4 2015
% Paint Materials $ Rate = Average P&M $/Refinish Labour Hours
Remove/Replace
RefinishRepair
43.15% 33.44%
23.41%
Date Q2/13 Q4/13 Q2/14 Q4/14 Q2/15 Q4/15Pt/$
Change% Change
% Adjustments Est 2.29 1.96 1.93 1.77 1.8 1.94 0.17 10%
% Betterment Est 2.01 1.72 1.68 1.58 1.5 1.68 0.1 6%
% Appear Allow Est 0.29 0.24 0.25 0.2 0.3 0.24 0.04 20%
% Prior Damage Est 0.05 0.05 0.06 0.11 0.23 0.18 0.07 64%
Avg. Betterment $ 221.49 255.8 234.92 247.54 273.76 385.82 138.28 56%
Avg. Appear Allow $ 222.88 229.34 276.2 208.21 236.69 274.55 66.34 32%
2014 YTD 2015 $ Change % Change
Alberta 73.31 75.08 $ 1.77 2%
Newfoundland & Labrador 61.97 62.59 $ 0.62 1%
Nova Scotia 58.8 59.25 $ 0.45 1%
Ontario 56.16 56.87 $ 0.71 1%
Quebec 51.14 51.7 $ 0.56 1%
Yukon Territory 94.15 95.34 $ 1.19 1%

35
Figure 39—Parts-Recycled
Canadian Parts Utilization
All data reflect the percentage of parts-type dollars utilized in the construction of Mitchell appraisals
by Canadian estimators.
Canadian Number of Parts by Part Type
Figure 35—We continue to see a fluctuation of OEM parts used and smaller corresponding fluctuations in
alternate parts, which indicate Spring quarters have fewer replaced parts than winter quarters.
Original Equipment Manufacturer (OEM) Parts Use in DollarsIn Q4 2015 Canadian OEM parts use
decreased compared to Q4 2014.
Remanufactured Parts Use in DollarsRemanufactured parts use in Canada was
2.02% for Q4 2015 compared to 2.19% in Q4
2014, reflecting the decreased availability of
remanufactured bumper covers and face bars.
Recycled Parts Use in DollarsRecycled parts use in Canada has decreased
to its lowest level of the surveyed quarters.
Aftermarket Parts Use in DollarsAftermarket parts use in Canada rose again
in Q4 2015 topping nearly 15%.
Figure 37—Parts-Non-New
2.86% 2.54% 2.49% 2.19% 2.16% 2.02%
Q2 2013 Q4 2013 Q2 2014 Q4 2014 Q2 2015 Q4 2015
9.20% 8.54% 8.61% 7.92% 8.30% 7.64%
Q2 2013 Q4 2013 Q2 2014 Q4 2014 Q2 2015 Q4 2015
Figure 36—Parts-New
75.46% 76.64% 75.78% 77.16% 76.67% 75.34%
Q2 2013 Q4 2013 Q2 2014 Q4 2014 Q2 2015 Q4 2015
1.18 0.47 0.09
6.2
0
1
2
3
4
5
6
7
8
Q4 12 Q2 13 Q4 13 Q2 14 Q4 14 Q2 15
New OEMAftermarketRecycledRemanufactured
12.48% 12.28% 13.12% 12.73% 12.87% 14.99%
Q2 2013 Q4 2013 Q2 2014 Q4 2014 Q2 2015 Q4 2015
Figure 38—Parts-Aftermarket
Canadian Collision Summary

36 About Mitchell
Mitchell San Diego Headquarters 6220 Greenwich Dr. San Diego, CA 92122
Mitchell empowers clients to
achieve measurably better
outcomes. Providing unparalleled
breadth of technology,
connectivity and information
solutions to the Property &
Casualty claims and Collision
Repair industries, Mitchell
is uniquely able to simplify
and accelerate the claims
management and collision
repair processes.
As a leading provider of Property
& Casualty claims technology
solutions, Mitchell processes
over 50 million transactions
annually for over 300 insurance
companies/claims payers and over
30,000 collision repair facilities
throughout North America.
Founded in 1946, Mitchell is
headquartered in San Diego,
California, and has approximately
2,000 employees. The company is
privately owned primarily by KKR,
a leading global investment firm.
For more information on Mitchell,
visit www.mitchell.com.

37 Mitchell in the News
Mitchell in the News
ICBC Selects Mitchell International as Strategic Material Damage Solution ProviderMitchell enters into long-term agreement with Insurance Company of British Columbia (ICBC) to serve as their new material damage solution provider. Read More
CIECA Award Winners AnnouncedThe Collision Industry Electronic Commerce Association (CIECA) board of trustees announces the winners of the 2015 Electronic Commerce awards. Read More
Is There a Driverless Car in Your Future?Greg Horn provides an overview of the very low- and no-tech obstacles in the way of a truly driverless car. Read More
Replacement Parts IncreasingGreg Horn discusses the frequency of parts replacement when it comes to collision repairs. Read More
Mastering Underutilized Management System FunctionsBrian Elmi shares ways to explore the potential of shop management software to continually improve processes. Read More
MitchellRepair Mitchell ClaimsMitchell_IntlMitchell InternationalPress Releases
For More Mitchell News:

Industry Trends
ReportThe Industry Trends Report is a quarterly snapshot of the auto physical damage collision and casualty industries. Just inside—the economy, industry highlights, plus illuminating statistics and measures, and more. Stay informed on ongoing and emerging trends impacting the industry, and you, with the Industry Trends Report!
Questions or comments about the Industry Trends Report may be directed to:
Greg Horn Editor in Chief, Vice President of Industry Relations [email protected]
Additional Contributors:
Kontos Kommentary is produced monthly by Tom Kontos, Executive Vice-President, ADESA Analytical Services. ADESA is a leading provider of wholesale used vehicle auctions and ancillary remarketing services. As part of the KAR Auction Services family, ADESA works in collaboration with its sister company, Insurance Auto Auctions, a leading salvage auto auction company, to provide insights, trends and highlights of the entire automotive auction industry.
For more information about Enterprise Rent-A-Car Average Length of Rental and to access your market and shop numbers please contact [email protected].
The Industry Trends Report is published by Mitchell.
The information contained in this publication was obtained from sources deemed reliable. However, Mitchell cannot guarantee the accuracy or completeness of the information provided.
Mitchell and the Mitchell logo and all associated logos and designs are registered and unregistered trademarks of Mitchell International, Inc. All other trademarks, service marks and copyrights are the property of their respective owners.
Volume Sixteen Number OneQ1 2016 Published by Mitchell
©2016 Mitchell All Rights Reserved.