Embed Size (px)
Citation preview

SHERLOCK BENCHMARKSMedicare Plans Edition
Confidential & Trade SecretsCopyright © 2019 Sherlock Company. All Rights Reserved.
Volume IFinancial Metrics
SHERLOCK BENCHMARKS Medicare Edition ‐ 2019 Volume I: Financial Metrics
The use of this Report and its content (including data values, survey instruments, definitions and calculation methodologies) form and layout collectively, the Report) is governed by a non-exclusive license agreement or a mutual confidentiality agreement between Sherlock Company and its client that restricts the use of the Report to the client’s internal purposes. Any distribution or reproduction, intentional or unintentional, of any materials contained herein without the express written permission of Sherlock Company is prohibited except as specified in the license or mutual confidentiality agreement. The agreement between the client and Sherlock Company does not convey any right of commercial use, nor effect any transfer of the Report or any portion thereof. This Report and its contents are also protected under one or more copyrights.
Copyright © 2019 Sherlock Company. All Rights Reserved. Photograph by Ray K. Saunders.
SHERLOCK COMPANY
September 2019

TABLE OF CONTENTS Tab Introduction and Background 1
Background, Organization, Conventions, Calculations and Procedures Summary Analyses 2
Summary of Medians High Level Functional Expenses and Navigator Reconciliation Longitudinal Comparison Plan Specific Administrative Cost Growth
Functional Expenses, across Products 3 Identification of Variances due to Product Mix PMPM and Percent of Revenue Analyses on Facing Pages
Functional Expenses of Each Product, PMPM 4 Identification of Cost Variances within Products, expressed PMPM
Functional Expenses of Each Product, Percent of Premiums or Fees 5 Identification of Cost Variances within Products, expressed Percent of Revenues
Expenses of Specialty Services and Other Self-Contained Activities 6 Includes Pharmacy, Behavioral Health and Healthcare Recoveries PMPM and Percent of Revenue Analyses on Facing Pages
Supplemental Schedules 7 Costs Charged by Parent Organization Depreciation and Amortization Strategic Project Expenses Individual Expenses – Under 65, Market Segments
Finance & Accounting Details and Information Systems Expenses, Allocated by Supported Functional Area 8 Use of Stop Loss, and its Profitability Balance Sheet Metrics, Capitalization Policy of Strategic Projects in Information Systems and Other Investments,
Analysis of Strategic Projects, Metrics of Capital Intensity and Aging of PP&E
Analysis of Taxes Stemming from Health Care Reform IS Allocations and Applications Summarized and Allocated to Functional Areas Staffing Costs analyzed Relative to Functional Area Costs Adjusted for Information Systems Allocations
Costs of Medicare Offered by Other Universes 9 Includes Independent/Provider-Sponsored, Blue Cross Blue Shield, Medicaid, and Medicare Plans PMPM and Percent of Revenue Analyses of Medicare Advantage, Medicare SNP, and Stand-Alone Medicare Part D
Participant Characteristics Selected Characteristics of Participants 10 Membership, Product Mix, Groups Served, Revenues, Health Care Costs, Earnings and Segment Summary
Tabs 2-10 contain their own Tables of Contents, with links, to locate specific product lines, expense categories or respondent characteristics.
COPYRIGHT © 2019 SHERLOCK COMPANY. ALL RIGHTS RESERVED. Confidential & Trade Secrets
M E D I C A R E E D I T I O N
S H E R L O C K
C O M P A N Y S H E R L O C K B E N C H M A R K S P A G E 1
INTRODUCTION AND BACKGROUND The 2019 Edition of the Sherlock Benchmarks Thank you for licensing the Sherlock Benchmarks for Medicare plans. This is the 16th annual edition of our performance benchmarks for these health plans. The Sherlock Benchmarks (Sherlock Expense Evaluation Report or SEER) represent the cumulative experience of over 855 health plan years and 22 consecutive years. While health plans are responsible for the health care of many of their members, they are responsible for the administrative activities to support all of them. The goal of the Sherlock Benchmarks is to aid in plans’ achievement of optimal costs. That is, to incur only those costs that are necessary to meet plans’ strategic objectives. In that way, the Benchmarks establish a norm so that, above those levels, expenses should be justified with an ROI. The measurement of a return on investment is challenging but may ultimately be linked to more rapid growth or a decline in health benefit trends. There are at least two other reasons why optimizing administrative expenses is a high priority for health plan managers. First, the surge in expenses of adapting to the Affordable Care Act and onboarding Exchange and Medicaid members have passed. Second, administrative expense visibility has been heightened by the rhetoric of presidential candidates.
The Sherlock Benchmarks assists in performance improvements for health plans by facilitating comparisons between plans and their universe as a whole. It quantifies health plans’ relative performance and identifies sources of variance at a highly granular level. Sherlock Benchmarks are unusually comprehensive and a highly valid analytical tool. The Sherlock Benchmarks help operational and financial managers optimize costs: Identify whether plans are operating at best-of-class costs. Prioritize functional areas for optimization. Discern key drivers of function variances such as staffing
ratios or compensation levels. Draw attention to operational metrics that may affect
desired outcomes. Sherlock Benchmarks have additional uses, such as to: Evaluate outsourcing of selected MCO operations, and the
value-added of management consultants. Develop a realistic and cost-conscious budget. Execute business combinations including due diligence,
estimation of the effect of synergies and development of a plan for successful integration.
The Sherlock Benchmarks are intended for use by health plan management teams and Boards, as well as their advisors such as management consultants and investment bankers. They are also used by vendors and outsourcers to health plans to assure the competitiveness of their services in the market.

COPYRIGHT © 2019 SHERLOCK COMPANY. ALL RIGHTS RESERVED. Confidential & Trade Secrets
M E D I C A R E E D I T I O N
S H E R L O C K
C O M P A N Y S H E R L O C K B E N C H M A R K S P A G E 2
Sherlock Benchmarks are described as the Gold Standard for health plan performance benchmarks. Our broad use is such that: Since June 2016 health plans serving 171 million insured
Americans use the Sherlock Benchmarks, including most Blue Cross Blue Shield plans, public companies and the largest Independent/Provider-Sponsored health plans.
Of the 34 U.S.-based Blue Cross Blue Shield primary licensees, fourteen serving approximately 37 million people, participate in this year’s Sherlock Benchmarking Study for Blue Cross Blue Shield Plans.
Of the 15 members of the Alliance of Community Health Plans that are not focused on public programs or are staff-model plans, ten are participating in this year’s Sherlock Benchmarking Study for Independent / Provider – Sponsored health plans
Most of the largest members of the Health Plan Alliance that are focused on commercial products are participating in this year’s Sherlock Benchmarking Study for Independent / Provider – Sponsored health plans.
Organization of the Sherlock Benchmarks The 2019 Sherlock Benchmarks for Medicare-focused plans is a carefully compiled and validated summary of the surveyed operational characteristics of leading health plans. 11 Medicare-focused plans participated this year. These plans make up the overwhelming share of the leading health plans in this sector. Collectively, the plans reflected here serve 4.6 million people with comprehensive products.
The Sherlock Benchmarks are produced in two volumes: Volume I: Financial Metrics includes analyses of administrative expenses through financial ratios such as percent of revenues and per member per month. Data is divided into 10 product lines and approximately 69 functions. Additional descriptions are found below. Volume II: Operational Metrics complements Volume I by facilitating in-depth analyses of the financial metrics. It is subdivided into four documents. Staffing and Compensation focuses on the staffing components of operational metrics and includes metrics of compensation, staffing ratios and outsourcing. Operational Metrics translates between operational performance and cost performance. Expenses are, first, often analyzed into factors of user demand, employee productivity, unit cost, staffing ratios and cost per employee. For instance, Claim and Encounter Capture and Adjudication is analyzed into claims per member, productivity of claims processors, cost per claim and per-employee costs of claims. Second, all functions are analyzed by factors of staffing ratios, staffing costs per FTE and non-labor costs. Finally, numerous drivers of costs and quality are also provided. For example, in the claims area these include metrics of electronic submission, auto-adjudication and factors requiring manual intervention. Medical Management Metrics reports the costs and volumes of key medical management activities such as case and disease management.

COPYRIGHT © 2019 SHERLOCK COMPANY. ALL RIGHTS RESERVED. Confidential & Trade Secrets
M E D I C A R E E D I T I O N
S H E R L O C K
C O M P A N Y S H E R L O C K B E N C H M A R K S P A G E 3
Health Care Utilization Metrics contains health care utilization and cost metrics for forty health services, segmented by product. In addition to these documents, a comprehensive set of data definitions and calculation notes, called Common Guidelines, is provided normally in PDF form for ease of reference. This document, Volume I, is divided into ten sections: TAB 1. INTRODUCTION AND BACKGROUND
This section summarizes the organization, conventions, calculations and procedures of the 2019 Sherlock Benchmarks for Medicare plans.
TAB 2. SUMMARY ANALYSES
This section includes several exhibits that summarize the results of the financial metrics. It presents a summary of median costs by product and functional area. Participant editions identify their unfavorable variances by displaying them in red. Also, this section reports functional expenses summarized into four major functional area clusters, by product. Participant editions show their costs in this and all similar exhibits as the top row in the statistical analysis of each product / expense cell. A separate reconciliation to values published in Plan Management Navigator is also provided.
The description and meaning of the various values presented in the statistical analyses are described later in this tab in the section titled Conventions Used in this Report. This section also includes historical expense trends from 2014 through 2018. Trends are calculated both as-reported and constant-mix. The latter adjusts to eliminate the effect any apparent changes in cost trends attributable to product mix changes. All rates of change are calculated based solely on continuously participating plans. Participant editions have an additional exhibit that displays year-over-year differences. Increases or decreases are expressed as a percent, in dollars and as a percent of total dollars of increase or decrease.
TAB 3. FUNCTIONAL EXPENSES, ACROSS PRODUCTS
This section is an analysis of specific functional expenses as incurred in various across product lines. Values in the statistical analyses are presented on a per member per month and percent of revenue basis, on opposing pages.

COPYRIGHT © 2019 SHERLOCK COMPANY. ALL RIGHTS RESERVED. Confidential & Trade Secrets
M E D I C A R E E D I T I O N
S H E R L O C K
C O M P A N Y S H E R L O C K B E N C H M A R K S P A G E 4
TAB 4. FUNCTIONAL EXPENSES OF EACH PRODUCT, PMPM This section is an analysis of the administrative expense composition for each product. Data is presented on a per member per month basis. Note that the values in this section and Tab 5 duplicate those in Tab 3 for ease of use. This approach facilitates application by readers whether they first identify cost variance in a function or in a product.
TAB 5. FUNCTIONAL EXPENSES OF EACH PRODUCT, PERCENT OF
PREMIUMS AND/OR FEES
Like Tab 4, this section presents an analysis of the administration expense composition for each product line. However, results are presented on a percent of revenue basis.
TAB 6. EXPENSES OF SPECIALTY AND OTHER SELF-CONTAINED
SERVICES
This section provides an analysis of activities and functions of Pharmacy, Behavioral Health and an analysis of Healthcare Recoveries across product lines. The costs and associated revenues for these functional areas and activities are not included in Tabs 3-5. These activities are not uncommonly outsourced may be provided by the health benefit plan sponsor or are otherwise arranged in ways that are unique to the individual plan. Healthcare recoveries is different in that it provides an in-depth analysis of activities presented elsewhere. Therefore, a separate analysis of
these areas is beneficial to their understanding and provides more accurate comparability in understanding of the performance of the other functional areas. Data is presented on a per member per month and percent of revenue basis.
TAB 7. SUPPLEMENTAL SCHEDULES This section is an analysis of Costs Charged by Parent, Depreciation and Amortization, Strategic Projects as well as the expense composition of all products sold to Individuals. Individual segments are reported as ACA and Non-ACA costs, and are expressed PMPM and percent of premiums. It also contains complete cost information on other market segments, including Small Group, Middle Market, Large Group. There is an additional analysis of Broker Commissions and the composition of the market segments to the health plan as a whole.
TAB 8. FINANCE & ACCOUNTING DETAILS AND INFORMATION
SYSTEMS EXPENSES, ALLOCATED BY SUPPORTED FUNCTIONAL AREA
Finance & Accounting has a global view of metrics of and operational, tax, accounting / capital intensity policy, solvency and capacity for internal funding of growth. These are gathered here. Stop Loss insurance is often sold to self-insured (ASO) customers of health plans. Since stop loss has different economic and cash flow characteristics than ASO but they are often sold together, it can be illuminating to

COPYRIGHT © 2019 SHERLOCK COMPANY. ALL RIGHTS RESERVED. Confidential & Trade Secrets
M E D I C A R E E D I T I O N
S H E R L O C K
C O M P A N Y S H E R L O C K B E N C H M A R K S P A G E 5
look at stop-loss and ASO products as though they were combined. In this section, we report the proportion of ASO membership that purchases stop-loss coverage and the costs and revenues of the product on a stand-alone basis. We also report the combined economics of the ASO plus the stop loss insurance to get a complete view of these complementary products. These analyses are performed both with and without prescription drug and behavioral health benefits, administrative expenses and associated revenues. Other operational metrics include those of Strategic Projects. Metrics of accounting / capital intensity policy include aging of property plant and equipment and non-cash expenses. RBC, Current Ratio and aging of accounts payable and receivable are metrics of solvency. Equity Turnover and Return on and Operating Return on Equity are metrics of the plan’s capacity to internally fund its growth. The components of ACA taxes and Fees is also analyzed. The Information Systems provides analyses of functional expenses but, because each includes an allocation of Information Systems costs, it provides an end-to-end view of the associated process. There are two sets of analyses. One is based on all Information Systems costs and the other is based on identifiable Information Systems applications
associated with the supported functions. Applications are a subset of total Information Systems costs. In each instance, we report the proportion and dollar amounts of Information Systems costs that respondents consider appropriate to be allocated to each of the supported functional areas. The PMPM dollar amount of these allocations are presented to illuminate the cost of the functional areas, including the allocable Information Systems costs, and what proportion of functional area costs these allocated IS costs represent. Staffing costs are also calculated as a proportion of each functional area’s total costs, defined to include the allocated Information Systems costs.
TAB 9. COSTS OF MEDICARE OFFERED BY OTHER UNIVERSES
This section provides an analysis of Medicare Advantage, Medicare SNP, Medicare Cost, and Medicare Part D (Stand-Alone) plans that are offered by other universes in Sherlock Company's benchmarking study for 2019 edition. Data is presented on a per member per month and a percent of revenue basis.
Revenues are defined as premiums or self-funded fees. Premiums and fees exclude those of pharmacy and mental health, as do associated expenses.

COPYRIGHT © 2019 SHERLOCK COMPANY. ALL RIGHTS RESERVED. Confidential & Trade Secrets
M E D I C A R E E D I T I O N
S H E R L O C K
C O M P A N Y S H E R L O C K B E N C H M A R K S P A G E 6
TAB 10. PARTICIPANT CHARACTERISTICS
This section presents an extensive profile of the participating universe. We summarize membership, product mix, groups served, growth, revenues and sources, medical expenses and ratios, administrative expenses and ratios, profit margins and other key attributes of the products offered by the plans. In addition, this section provides provide information of the business segments offered by the plans. Statistical summaries illustrating the distribution of results are included.
Conventions Used in this Report In the Sherlock Benchmarks, we analyzed costs for the plans as a whole, by functional area and also by product. We have employed a number of reporting conventions, which we discuss below.
1. The terms “high” and “low” mean the average of the two highest and two lowest values, respectively. The standard deviation is the measure of dispersion. To facilitate comparability of standard deviations, we have expressed standard deviation as a percent of the mean, commonly termed the coefficient of variation.
2. Statistical results are unweighted. That is, each metric
reflects equally the experience of each plan that reports a functional area for a product, without regard to the plan’s size.
3. Statistical measures for each functional area are calculated independently. Accordingly, the statistical analysis of total expenses is not the sum of the statistical analysis of each component cost.
4. Results were carefully validated to identify, and correct
if possible, reporting errors.
5. Within each firm, ratios based on the total scope of products (for instance in the Total and Comprehensive values) are intrinsically weighted by the relative importance of each product to that firm. For instance, a firm with a heavy commitment to Indemnity & PPO ASO will reflect that product’s weighting and its company-wide costs will be lower as a result.
6. Trend analyses are calculated to include only data from
firms participating in both years of a comparison. For instance, the comparisons between costs in 2018 and 2017 employ the same firms in both years, and the comparisons between costs in 2017 and 2016 employ the same firms in both years. But the 2017 firms may not be the same in both comparison periods.
7. The trend analyses that hold mix constant similarly include only data from firms in both years of comparisons. In addition, to calculate the constant-mix values, each of the participating plans’ cost values for the prior year are reweighted to reflect the current year product mix.

COPYRIGHT © 2019 SHERLOCK COMPANY. ALL RIGHTS RESERVED. Confidential & Trade Secrets
M E D I C A R E E D I T I O N
S H E R L O C K
C O M P A N Y S H E R L O C K B E N C H M A R K S P A G E 7
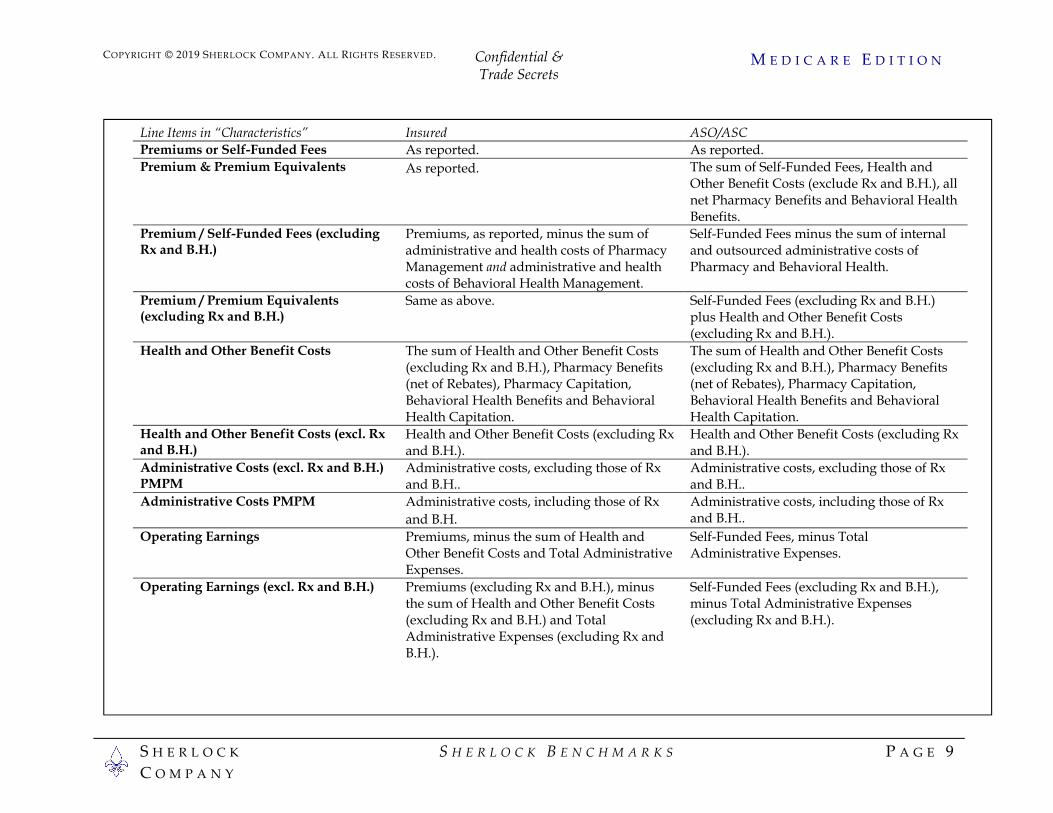
Explanatory Notes to Participant Characteristics We do not disclose any individually identifiable values without the express permission of the plan. However, to understand the comparability of the plans to users of Sherlock Benchmarks, Tab 10 contains a statistical summary of the plans in the respondent universe. The following describes the conventions that we employed in making this summary. EXPLANATION OF LINE ITEMS In the participant characteristics section, we refer to a number of revenue and expense items that, because of the way we use them, benefit from further explanation. The term “as reported” means as reported on the survey form submitted to us, after the effect of our data validation. Expense classifications used in the Sherlock Benchmarks often differ from plans reporting to its internal and other external audiences. Note that in some of the above calculations, we adjust health benefits, administrative expenses and premiums to exclude “Rx and B.H.” “Rx” means pharmacy and “B.H.” means Behavioral Health. This segmentation improves comparability between firms that outsource these activities (or otherwise do not provide them) and those who perform them internally. Accordingly, administration and benefits for these health services are collected in a separate section of the survey form and are therefore not normally included in the calculations of total per member per month costs or in any calculation of percent of premium. Premium equivalents are estimated by adding health benefits to ASO fees paid by self-insured groups. Fees are used instead
of administrative expenses since fees encompass profits, making the calculation more closely resemble premiums. When calculations of health benefits include pharmacy and behavioral health, health benefits include any capitation, benefits and subtract the effect of rebates. Administration includes both internal administrative costs and / or internal contract management of otherwise capitated and combined administration and health benefits. EXPLANATION OF PARTICIPANT CHARACTERISTICS RATIOS Most of these metrics are self-explanatory but a few are worth elaboration. Additional explanation of data elements and calculations are found in the Common Guidelines, which accompanies the Sherlock Benchmarks. Some additional calculation notes are shown in a table on the following page. Mix – The proportion of each plan’s product portfolio is calculated based on membership, and revenues and premium equivalents. The denominator for membership is that of the Comprehensive total. Revenues are a blend of fees and premiums, while premium equivalents are fees, adjusted upwards to include health benefits. Premiums and premium equivalents include costs and revenues related to pharmacy and behavioral health. The denominator for revenue metrics of mix is that of Comprehensive total. Health Benefits Ratio (MLR) – Health and Other Benefits Costs divided by Premium / Premium Equivalents. This is calculated both including and excluding Rx and B.H. Health benefits are services that are provided to members as patients. Note that this differs from health benefit definition

COPYRIGHT © 2019 SHERLOCK COMPANY. ALL RIGHTS RESERVED. Confidential & Trade Secrets
M E D I C A R E E D I T I O N
S H E R L O C K
C O M P A N Y S H E R L O C K B E N C H M A R K S P A G E 8
employed in CMS’s Medical Loss Ratio calculations in that activities that improve health care quality or health information technology in the medical management and information systems functions may be included as medical expenses. Instead these activities are reflected in our ratios as administrative costs. Administrative Expense Ratio – Administrative Expenses divided by Premium or Fees. We also calculate this based on Premium Equivalents, and these ratios are calculated both including and excluding Rx and B.H Operating Margin – Operating Earnings divided by Premiums/Self-funded Fees. These ratios are calculated both including and excluding Rx and B.H
COPYRIGHT © 2019 SHERLOCK COMPANY. ALL RIGHTS RESERVED. Confidential & Trade Secrets
M E D I C A R E E D I T I O N
S H E R L O C K
C O M P A N Y S H E R L O C K B E N C H M A R K S P A G E 9
Line Items in “Characteristics” Insured ASO/ASC Premiums or Self-Funded Fees As reported. As reported. Premium & Premium Equivalents As reported. The sum of Self-Funded Fees, Health and
Other Benefit Costs (exclude Rx and B.H.), all net Pharmacy Benefits and Behavioral Health Benefits.
Premium / Self-Funded Fees (excluding Rx and B.H.)
Premiums, as reported, minus the sum of administrative and health costs of Pharmacy Management and administrative and health costs of Behavioral Health Management.
Self-Funded Fees minus the sum of internal and outsourced administrative costs of Pharmacy and Behavioral Health.
Premium / Premium Equivalents (excluding Rx and B.H.)
Same as above. Self-Funded Fees (excluding Rx and B.H.) plus Health and Other Benefit Costs (excluding Rx and B.H.).
Health and Other Benefit Costs
The sum of Health and Other Benefit Costs (excluding Rx and B.H.), Pharmacy Benefits (net of Rebates), Pharmacy Capitation, Behavioral Health Benefits and Behavioral Health Capitation.
The sum of Health and Other Benefit Costs (excluding Rx and B.H.), Pharmacy Benefits (net of Rebates), Pharmacy Capitation, Behavioral Health Benefits and Behavioral Health Capitation.
Health and Other Benefit Costs (excl. Rx and B.H.)
Health and Other Benefit Costs (excluding Rx and B.H.).
Health and Other Benefit Costs (excluding Rx and B.H.).
Administrative Costs (excl. Rx and B.H.) PMPM
Administrative costs, excluding those of Rx and B.H..
Administrative costs, excluding those of Rx and B.H..
Administrative Costs PMPM Administrative costs, including those of Rx and B.H.
Administrative costs, including those of Rx and B.H..
Operating Earnings
Premiums, minus the sum of Health and Other Benefit Costs and Total Administrative Expenses.
Self-Funded Fees, minus Total Administrative Expenses.
Operating Earnings (excl. Rx and B.H.)
Premiums (excluding Rx and B.H.), minus the sum of Health and Other Benefit Costs (excluding Rx and B.H.) and Total Administrative Expenses (excluding Rx and B.H.).
Self-Funded Fees (excluding Rx and B.H.), minus Total Administrative Expenses (excluding Rx and B.H.).

COPYRIGHT © 2019 SHERLOCK COMPANY. ALL RIGHTS RESERVED. Confidential & Trade Secrets
M E D I C A R E E D I T I O N
S H E R L O C K
C O M P A N Y S H E R L O C K B E N C H M A R K S P A G E 1 0
Procedures The process employed in the development of the Sherlock Benchmarks is to select the plans, design the survey instrument, assure confidentiality, collect the data, validate and analyze the data and publish the reports. The Common Guidelines, employed by all users of the Sherlock Benchmarks, provides the data definitions distributed to each participant for functional area and product descriptions. The data employed in this report was for the period ended December 31, 2018. SELECTION OF PLANS The peer group was established to be relatively uniform. Within that constraint, it is open to all Medicare-focused plans possessing the ability to compile high quality segmented financial and operational data. The peer group universe in this analysis consisted of 11 Medicare-focused plans. 7 of this year’s participants participated in the prior year. The selected plans served 4.6 million people with comprehensive health benefits. Within the Comprehensive products 57%, or 2.6 million members, were commercial. Approximately 1.0 million of the commercial members were served under some form of self-insurance arrangements, or approximately 39% of the total commercial members. Medicare Advantage served 755,000 members and it was 17% of the combined Comprehensive membership and 29% of revenues for Comprehensive products. Medicare SNP was
offered by four plans with a combined membership of 33,200 and composed 3% of Comprehensive revenues. Medicare Supplement, offered by 4 plans, composed 1% of Comprehensive members. Medicaid HMO, offered by 7 plans, composed 24% of membership. CONFIDENTIALITY Confidentiality is an important aspect of this study for competitive, data quality and legal reasons. Accordingly, we employed a number of safeguards to promote confidentiality of company-specific information. 1. Sherlock Company does not identify respondents.
Accordingly, with respect to Sherlock Company’s communications, only Sherlock Company has certain knowledge of the precise identity of the participants. We do not restrict any communication between the plans themselves, however.
2. The results of the individual plans are not disclosed in the
Sherlock Benchmarks. The end product is a statistical summary: In these documents, no specific company information is disclosed, except in the case of participants’ editions in which only its own results are displayed.
3. The data is provided to Sherlock Company to physical and
virtual locations that are under Sherlock Company control. No respondent has physical or electronic access to information provided by any other plans.

COPYRIGHT © 2019 SHERLOCK COMPANY. ALL RIGHTS RESERVED. Confidential & Trade Secrets
M E D I C A R E E D I T I O N
S H E R L O C K
C O M P A N Y S H E R L O C K B E N C H M A R K S P A G E 1 1
4. We sign mutual confidentiality agreements. The confidentiality agreements require Sherlock Company to keep plan data confidential and for plans to restrict use of the Sherlock Benchmarks exclusively for their internal purposes. This agreement underscores the seriousness of Sherlock Company’s commitment to the confidentiality of the data.
SURVEY DESIGN The 2019 survey was similar to ones performed in prior years for Medicare-focused plans and other peer groups. The scope and other aspects of the survey were refined based on conversations with past and current respondents and users. One aspect of this refinement, definitions and calculation notes, were memorialized in Common Guidelines. The Common Guidelines, included with the Sherlock Benchmarks reports as a separate electronic volume, was provided to the participants to promote the comparability of responses. In addition, the panel requested, and we added several new sub-functions making more granular existing classification: Internal Sales Commissions, Member Services, Printed Materials, Grievances and Appeals and Risk Management. The survey instrument itself contains the detailed definitions corresponding with the Guidelines. Both the survey and the Guidelines were provided to the respondents in electronic form in March. Ambiguities in definitions and emerging issues were addressed in weekly conference calls and by other means.
SUBMISSION OF DATA Plans emailed their completed survey forms to us, beginning in July. All financial and other information submitted to us was provided in actual dollars or actual volumes (member months, for instance) which were segmented by functional area and product line. If we identified outlying responses, we requested the plans to revise outliers stemming from reporting errors. This data validation process is further described in Quality Assurance, below. COMPILATION AND ANALYSIS OF DATA Data from all of the respondents was compiled into linked spreadsheets. The survey form was in Microsoft Excel®, facilitating links between the various survey forms, the final Sherlock Benchmark Reports and intermediate analyses. The final Sherlock Benchmarks represent summaries and statistical analyses of the results of the survey. Not all plans offered all business lines and certain optional fields were omitted by some plans. QUALITY ASSURANCE We employed the procedures below to promote the accuracy of the responses. It should be noted that, while we believe the responses to be as accurate as practical, we did not perform an audit on any of the respondents.
1. Precise Definitions. Functions and product lines were extensively defined in the survey instrument and Common Guidelines. Definitions typically included the function name itself, which is meaningful to

COPYRIGHT © 2019 SHERLOCK COMPANY. ALL RIGHTS RESERVED. Confidential & Trade Secrets
M E D I C A R E E D I T I O N
S H E R L O C K
C O M P A N Y S H E R L O C K B E N C H M A R K S P A G E 1 2
participants, and a broad description of the activities undertaken by the function. A more detailed list of each of the principle activities is also provided for each function. In addition, examples of cost centers associated with various functions were provided, often using language employed by the plans themselves, so that if a question arises as to what functional area a cost center should be included, the respondent may locate where other similarly-described cost centers have been assigned. In addition, exceptions to the described activities were also noted, as appropriate. Because these definitions were provided electronically, the definitions are searchable in the separate Common Guidelines document. They were also included as “comments” on the electronic form of the survey for ease of use. The Guidelines are also included with licensed copies so, if you are not a participant, you may employ the Guidelines to harmonize your plan’s cost classifications with those found in the Benchmarking study. Sherlock Company can also do this and has done so on numerous occasions. Let us know if this would be of interest.
2. Participatory Protocol. The scope of the survey reflected the input of participants, including at a meeting of most of the participants in March of 2019. This, we believe, helps to assure that the benefit of the resulting metrics exceeds the cost of gathering the information to populate it. As a result of this balanced approach, we believe that participating plans are
committed to the accurate completion of the survey. This approach also assures that the segmentation of the functions reflects the consensus of the actual practices of the respondents: by reducing the overall need of the panel to reclassify, the resulting simplicity promotes accuracy. Finally, since each of the participants receives a copy of the Report, and since that Report is typically shared with senior management and other leaders, our primary contacts have a strong incentive for accuracy.
3. Feedback, Reinforcing Definitions. We also addressed
emerging issues as they arose. These arose from the evolving nature of the business of health plans or ambiguities that were found in the definitions employed in the survey. We resolved, nearly always in consultation with plans, any ambiguities and we communicated interpretations to all participants so that respondents could adjust their responses accordingly. Numerous questions were addressed and disseminated through a series of conference calls conducted during the survey process.
4. Reconciliation with Financial Statements. We requested
that each of the plans provide audited consolidated financial information and that revenues, health benefits and administrative expense information tie to information plans provide in the survey form. If there were differences between the data submitted in the survey form and in the audit, plans submitted a reconciliation schedule. The reconciliation of their submitted data with audited financials is intended to assist in assuring the accuracy and completeness of their survey information.
COPYRIGHT © 2019 SHERLOCK COMPANY. ALL RIGHTS RESERVED. Confidential & Trade Secrets
M E D I C A R E E D I T I O N
S H E R L O C K
C O M P A N Y S H E R L O C K B E N C H M A R K S P A G E 1 3
In certain cases, reported expenses were excluded from this survey, for instance pension accrual adjustments and product start-up costs. However, to assure the validity of the check with the audit, these exclusions were highly limited and tightly defined.
5. Submissions Scanned for Anomalies. We employed
statistical models and visual screens to identify outliers in the submissions. For instance, if a plan reported a value for a function within a product that varied by a specified standard deviation, it was flagged to be addressed by the participating plan. The plan was then required to determine and communicate to us whether variances stemmed from reporting errors or were true operational differences. Reporting errors were corrected for inclusion in the Sherlock Benchmarks reports, while actual variances were not corrected. The combination of the granularity of the survey with the audit reconciliation noted above has the effect of highlighting outlying responses.
6. Review by Participants. Prior to final printing, a draft
of each participant edition of the Report was submitted to the participants. This draft was similar to the final Sherlock Benchmarks report in that it highlighted each plan’s results in the context of the universe as a whole. This permitted the plans to identify any anomalies that we may have missed.
7. Practice Effect. 7 respondents participating in this
year’s study participated with us last year, or 63%. Of
the plans participating this year, 64% have five or more years of experience and 91% have three or more years of experience participating in the Sherlock Benchmarks. We believe that familiarity with reporting in accordance with the Sherlock Benchmarks enhances the accuracy of reporting.
Questions and Comments
We invite questions and comments on the Sherlock Benchmarks.
Douglas B. Sherlock, CFA
President Sherlock Company
215-628-2289 1180 Welsh Road
Suite 110 North Wales, PA 19454
In addition, please know that we support your use of the Sherlock Benchmarks. We hope that you will not hesitate to
contact us if you have any questions concerning classifications, calculation methodologies and the application of the Sherlock Benchmarks to improve the performance of your health plan.

Tab 2Summary Analyses
Figure Analysis PageSummary of Medians
2-1 Per Member Per Month………………………………………………………………………….…………… 42-2 Percent of Revenues………………………………………………………………………………………… 62-3 Participant Characteristics…………………………………………………………………………………… 8
High Level Functional Expenses2-4 & 2-5 Sales and Marketing………………………………………………………………………………………… 12
Rating and UnderwritingMarketingSalesExternal Broker CommissionsAdvertising and Promotion
2-6 & 2-7 Medical and Provider Management………………………………………………………………………… 14Provider Network Management and ServicesMedical Management / Quality Assurance / Wellness
2-8 & 2-9 Account and Membership Administration………………………………………………………………… 16Enrollment / Membership / BillingCustomer ServicesClaim and Encounter Capture and AdjudicationInformation Systems Expenses
2-10 & 2-11 Corporate Services…………………………………………………………………………………………… 18Finance and AccountingActuarialCorporate Services FunctionCorporate Executive & GovernanceAssociation Dues and License / Filing Fees
2-12 & 2-13 Subtotal Expenses (Excluding Miscellaneous Business Taxes)………………………………………… 20
COPYRIGHT © 2019 SHERLOCK COMPANY. ALL RIGHTS RESERVED. CONFIDENTIAL AND TRADE SECRETS. 1
This section summarizes the Financial Metrics volume of the Sherlock Benchmarks. It includes a summary of median values, a functional area summary, a longitudinal (year-over-year) comparison, comparisons with other Sherlock Company reports and changes in participant plan cost growth.
The median values for each functional area and product are shown in this section. The summary of medians is intended to provide an immediate and accessible metric of central tendency for administrative costs in each product / expense cell. If your plan has submitted data to this survey, median values are printed in black if the plan has low costs and red if it has high costs.
The functional area summary provides a high level analysis by four high-level clusters of functional areas. Results are presented on a per member per month and percent of revenue basis. All of the expense classifications reported by the respondents have been summarized in this section. Revenues are defined as premiums or self-funded fees. Premiums and fees exclude those of pharmacy and mental health, as do their associated expenses.
Sherlock Benchmark values are provided in a slightly different form in Plan Management Navigator and figures in this tab faciliate their comparison.
Also, administrative cost growth is analyzed for health plans that participated in both this and the prior year.
Medicare Edition Tab 2. Summary Analyses
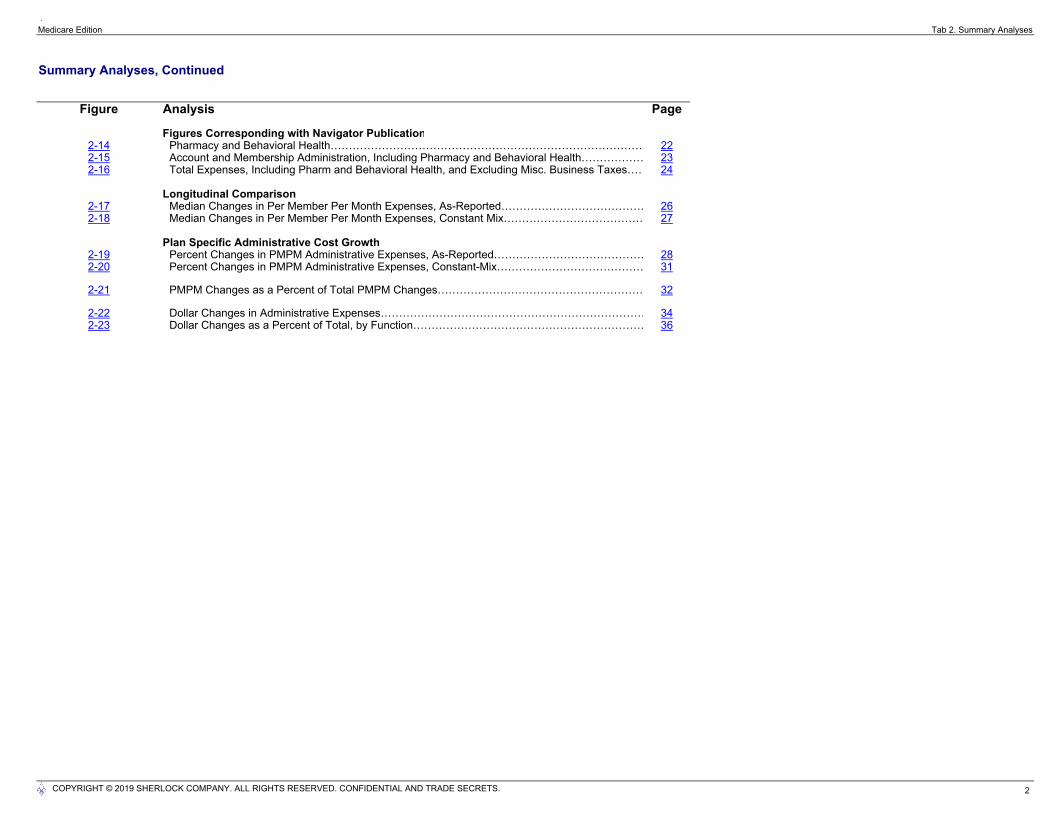
Summary Analyses, Continued
Figure Analysis Page
Figures Corresponding with Navigator Publication2-14 Pharmacy and Behavioral Health…………………………………………………………………………… 222-15 Account and Membership Administration, Including Pharmacy and Behavioral Health……………… 232-16 Total Expenses, Including Pharm and Behavioral Health, and Excluding Misc. Business Taxes…… 24
Longitudinal Comparison2-17 Median Changes in Per Member Per Month Expenses, As-Reported………………………………… 262-18 Median Changes in Per Member Per Month Expenses, Constant Mix………………………………… 27
Plan Specific Administrative Cost Growth2-19 Percent Changes in PMPM Administrative Expenses, As-Reported…………………………………… 282-20 Percent Changes in PMPM Administrative Expenses, Constant-Mix…………………………………… 31
2-21 PMPM Changes as a Percent of Total PMPM Changes………………………………………………… 32
2-22 Dollar Changes in Administrative Expenses……………………………………………………………… 342-23 Dollar Changes as a Percent of Total, by Function……………………………………………………… 36
COPYRIGHT © 2019 SHERLOCK COMPANY. ALL RIGHTS RESERVED. CONFIDENTIAL AND TRADE SECRETS. 2

Tab 3Functional Expenses, Across Products
Functional Area Page
Sales and Marketing1. Rating and Underwriting............................................................................................................................................ 42
(b) Risk Adjustment............................................................................................................................................ 44(c) All Other Rating and Underwriting........................................................................................................................ 46
2. Marketing............................................................................................................................................ 48(a) Product Development and Market Research....................................................................................................... 50(b) Member and Group Communication.................................................................................................................... 52(c) Other Marketing............................................................................................................................................ 54
3. Sales............................................................................................................................................ 56(a) Account Services............................................................................................................................................ 58(b) Internal Commissions............................................................................................................................................ 60(c) Other Sales............................................................................................................................................ 62
4. External Broker Commissions.................................................................................................................................. 645. Advertising and Promotion....................................................................................................................................... 66
(a) Media and Advertising............................................................................................................................................ 68(b) Charitable Contributions....................................................................................................................................... 70
Medical and Provider Management6. Provider Network Management and Services......................................................................................................... 72
(a) Provider Relations Services................................................................................................................................. 74(b) Provider Contracting............................................................................................................................................ 76
(1) Provider Configuration....................................................................................................................................... 78(2) Other Provider Contracting................................................................................................................................ 80
(d) Other Provider Network Management and Services............................................................................................ 827. Medical Management / Quality Assurance / Wellness............................................................................................. 84
(a) Pre-Certification............................................................................................................................................ 86(b) Case Management............................................................................................................................................ 88(c) Disease Management............................................................................................................................................ 90(d) Nurse Information Line............................................................................................................................................ 92(e) Health and Wellness............................................................................................................................................ 94(f) Quality Components............................................................................................................................................ 96(g) Medical Informatics............................................................................................................................................ 98(h) Utilization Review............................................................................................................................................ 100(i) Other Medical Management.................................................................................................................................. 102
COPYRIGHT © 2019 SHERLOCK COMPANY. ALL RIGHTS RESERVED. CONFIDENTIAL AND TRADE SECRETS. 39
This section provides an analysis of specific functional expenses across product lines. Values are presented to account for whether services are provided internally or outsourced. Costs are presented on a per member per month and percent of premiums and/or fees basis. Premiums and fees exclude those attributable to pharmacy and mental health.This section provides an analysis of specific functional expenses across product lines. Values are presented to account for whether services are provided internally or outsourced. Costs are presented on a per member per month and percent of premiums and/or fees basis. Premiums and fees exclude those attributable to pharmacy and mental health.
Medicare Edition Tab 3. Functional Expenses, Across Products
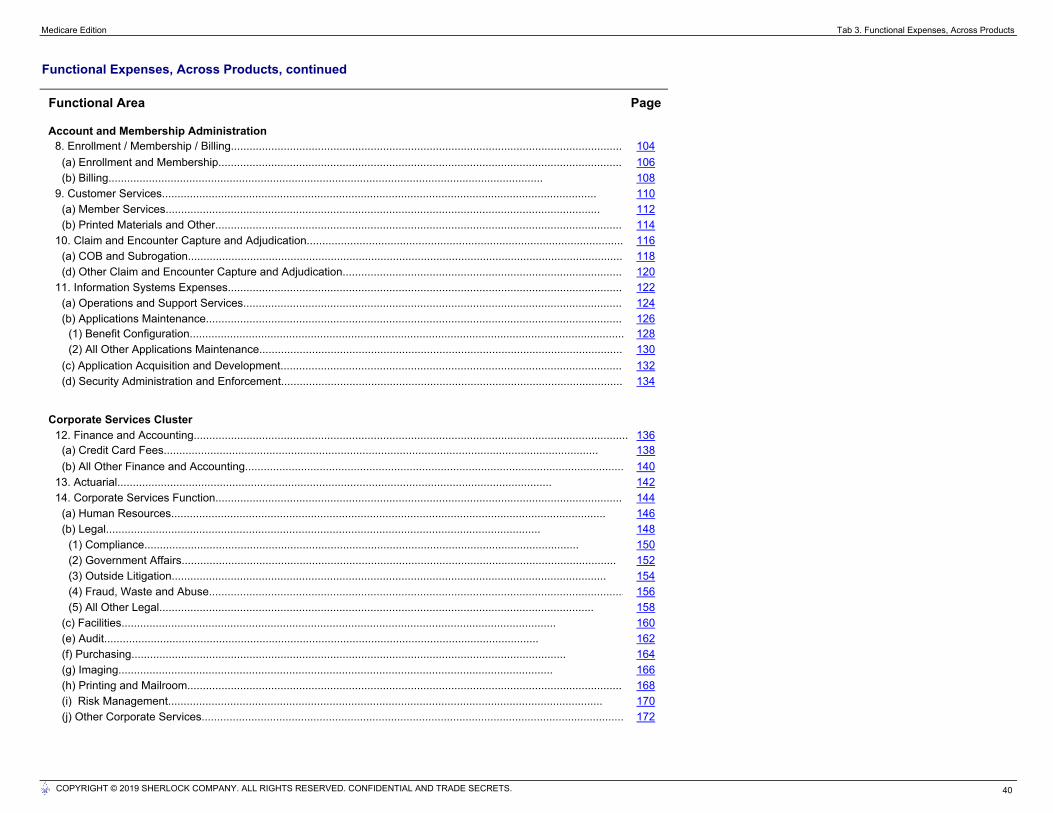
Functional Expenses, Across Products, continued
Functional Area Page
Account and Membership Administration8. Enrollment / Membership / Billing.............................................................................................................................. 104
(a) Enrollment and Membership.................................................................................................................................. 106(b) Billing............................................................................................................................................ 108
9. Customer Services............................................................................................................................................ 110(a) Member Services............................................................................................................................................ 112(b) Printed Materials and Other................................................................................................................................... 114
10. Claim and Encounter Capture and Adjudication...................................................................................................... 116(a) COB and Subrogation............................................................................................................................................ 118(d) Other Claim and Encounter Capture and Adjudication.......................................................................................... 120
11. Information Systems Expenses............................................................................................................................... 122(a) Operations and Support Services.......................................................................................................................... 124(b) Applications Maintenance...................................................................................................................................... 126
(1) Benefit Configuration............................................................................................................................................ 128(2) All Other Applications Maintenance..................................................................................................................... 130
(c) Application Acquisition and Development.............................................................................................................. 132(d) Security Administration and Enforcement.............................................................................................................. 134
Corporate Services Cluster12. Finance and Accounting............................................................................................................................................ 136
(a) Credit Card Fees............................................................................................................................................ 138(b) All Other Finance and Accounting.......................................................................................................................... 140
13. Actuarial............................................................................................................................................ 14214. Corporate Services Function................................................................................................................................... 144
(a) Human Resources............................................................................................................................................ 146(b) Legal............................................................................................................................................ 148
(1) Compliance............................................................................................................................................ 150(2) Government Affairs............................................................................................................................................ 152(3) Outside Litigation............................................................................................................................................ 154(4) Fraud, Waste and Abuse...................................................................................................................................... 156(5) All Other Legal............................................................................................................................................ 158
(c) Facilities............................................................................................................................................ 160(e) Audit............................................................................................................................................ 162(f) Purchasing............................................................................................................................................ 164(g) Imaging............................................................................................................................................ 166(h) Printing and Mailroom............................................................................................................................................ 168(i) Risk Management............................................................................................................................................ 170(j) Other Corporate Services........................................................................................................................................ 172
COPYRIGHT © 2019 SHERLOCK COMPANY. ALL RIGHTS RESERVED. CONFIDENTIAL AND TRADE SECRETS. 40

Medicare Edition Tab 3. Functional Expenses, Across Products
Functional Expenses, Across Products, continued
Functional Area Page
Corporate Services Cluster, continued15. Corporate Executive & Governance........................................................................................................................ 17416. Association Dues and License/Filing Fees ............................................................................................................. 176
Subtotal Expenses....................................................................................................................................................... 17817. Miscellaneous Business Taxes.................................................................................................................................. 180
Total Expenses............................................................................................................................................................. 182
COPYRIGHT © 2019 SHERLOCK COMPANY. ALL RIGHTS RESERVED. CONFIDENTIAL AND TRADE SECRETS. 41

Tab 4Functional Expenses of Each Product, PMPM
Figure Product Page
Total4-1 Comprehensive Total..................................................................................................................................... 186
Commercial4-2 Commercial HMO, Insured.............................................................................................................................. 1884-3 Commercial POS, Insured............................................................................................................................... 1904-4 Commercial Indemnity & PPO, Insured........................................................................................................... 1924-5 Commercial Total, Insured............................................................................................................................. 194
4-6 Commercial, ASO/ASC..................................................................................................................................... 196
4-7 Commercial Total..................................................................................................................................... 198
Medicare4-8 Medicare Advantage..................................................................................................................................... 2004-9 Medicare SNP..................................................................................................................................... 2024-10 Medicare Total..................................................................................................................................... 204
4-11 Medicare Supplement..................................................................................................................................... 206
Medicaid4-12 Medicaid HMO..................................................................................................................................... 2084-13 Medicaid CHIP..................................................................................................................................... 2104-14 Medicaid Total..................................................................................................................................... 212
COPYRIGHT © 2019 SHERLOCK COMPANY. ALL RIGHTS RESERVED. CONFIDENTIAL AND TRADE SECRETS. 185
This section provides an analysis of the expense composition of each product. All expenses for each product are included in each table. Costs are presented on a per member per month basis. Each section includes a statistical analysis of product expenses.This section provides an analysis of the expense composition of each product. All expenses for each product are included in each table. Costs are presented on a per member per month basis. Each section includes a statistical analysis of product expenses.

Tab 5Functional Expenses of Each Product, Percent of Premiums and/or Fees
Figure Product Page
Total5-1 Comprehensive Total....................................................................................................................................... 216
Commercial5-2 Commercial HMO, Insured.............................................................................................................................. 2185-3 Commercial POS, Insured............................................................................................................................... 2205-4 Commercial Indemnity & PPO, Insured........................................................................................................... 2225-5 Commercial Total, Insured............................................................................................................................. 224
5-6 Commercial, ASO/ASC.................................................................................................................................... 226
5-7 Commercial Total............................................................................................................................................. 228
Medicare5-8 Medicare Advantage........................................................................................................................................ 2305-9 Medicare SNP.................................................................................................................................................. 2325-10 Medicare Total............................................................................................................................................... 234
5-11 Medicare Supplement...................................................................................................................................... 236
Medicaid5-12 Medicaid HMO................................................................................................................................................. 2385-13 Medicaid CHIP................................................................................................................................................. 2405-14 Medicaid Total............................................................................................................................................... 242
COPYRIGHT © 2019 SHERLOCK COMPANY. ALL RIGHTS RESERVED. CONFIDENTIAL AND TRADE SECRETS. 215
This section provides an analysis of the expense composition of each product. All expenses for each product are included in each table. Each figure includes a statistical analysis of expenses. Costs are presented on a percent of premiums and/or fees basis. Premiums and fees exclude those of pharmacy and mental health, as do associated expenses.
This section provides an analysis of the expense composition of each product. All expenses for each product are included in each table. Each figure includes a statistical analysis of expenses. Costs are presented on a percent of premiums and/or fees basis. Premiums and fees exclude those of pharmacy and mental health, as do associated expenses.

Tab 6Expenses of Specialty Services and Other Self-Contained Activities
Figures Function Page
Pharmacy6-1 & 6-2 Administration.................................................................................................................................................. 2466-3 & 6-4 Gross Benefits................................................................................................................................................. 2486-5 & 6-6 Rebates............................................................................................................................................................ 2506-7 & 6-8 Total Pharmacy Costs................................................................................................................................... 252
Behavioral Health6-9 & 6-10 Administration.................................................................................................................................................. 254
6-11 & 6-12 Benefits............................................................................................................................................................ 2566-13 & 6-14 Total Behavioral Health Costs....................................................................................................................... 258
Healthcare Recoveries6-21 & 6-22 COB and Subrogation Recoveries................................................................................................................... 2606-23 & 6-24 Provider Recoveries......................................................................................................................................... 262
COPYRIGHT © 2019 SHERLOCK COMPANY. ALL RIGHTS RESERVED. CONFIDENTIAL AND TRADE SECRETS. 245
This section provides an analysis of specialty and other self-contained net or total expenses across products. These activities are Pharmacy, Mental Health, ICD-10 Information Systems and COB and Subrogation. Values are presented on a per member per month and percent of premiums or premiums equivalent basis.
In calculating ratios, premiums and equivalents exclude pharmacy and mental health, except they are respectively included for pharmacy and mental health functions. Membership refers to all members except in the case of pharmacy, in which only pharmacy members are used if available.
While Pharmacy, Mental Health and ICD-10 Information Systems are excluded from the total expenses found in Tabs 3-5, Healthcare Recoveries contains a more detailed analysis of COB and Subrogation and Provider Recoveries included in those tabs.

Tab 7Supplemental Schedules
Figure Schedule Page
Costs Charged by Parent Organization7-1 Per Member Per Month………………………………………………………………………………………………… 2677-2 Percent of Premiums and Fees……………………………………………………………………………………… 2697-3 Percent of Total Function Administrative Expenses………………………………………………………………… 271
Depreciation and Amortization7-4 Per Member Per Month………………………………………………………………………………………………… 2737-5 Percent of Premiums and Fees……………………………………………………………………………………… 2757-6 Percent of Total Function Administrative Expenses………………………………………………………………… 277
Strategic Project Expenses7-7 Per Member Per Month………………………………………………………………………………………………… 2797-8 Percent of Premiums and Fees……………………………………………………………………………………… 2817-9 Percent of Total Function Administrative Expenses………………………………………………………………… 283
COPYRIGHT © 2019 SHERLOCK COMPANY. ALL RIGHTS RESERVED. CONFIDENTIAL AND TRADE SECRETS. 265
Costs Charged by Parent Organization reports the size and scope of costs that are charged to the health plan from its parent organization (e.g. legal services, accounting, etc.). It can also provide a gauge of the reasonableness of such services, though it should be understood that this application is limited since the precise nature of the services for which the parent bills is unknown.
Depreciation and Amortization reports the size and scope of depreciation and amortization expenses. The non-cash expenses of depreciation and amortization are included in the functions that they support in the main schedule of the administrative expense survey form. In this schedule, only depreciation and amortization expenses are included in each functional area.
Strategic Project Expenses reports the size and scope of those expenses that are considered by your plan to be part of strategic projects. Expenses are reported by functional area. “Strategic” here is intentionally vague, as the purpose of this schedule is to allow plans to compare the amount of expenses that they consider strategic with other plans.
Individual Expenses reports those expenses that are for Individual contracts only. This includes ACA compliant members on and off exchange and grandfathered, non-ACA compliant members. Expenses are reported by functional area.
Market Segments reports various metrics for Individual, Small, Middle, Middle/Large and Large groups.
In all schedules, revenues are defined as premiums and fees excluding pharmacy and mental health.
Medicare Edition Tab 7. Supplemental Schedules
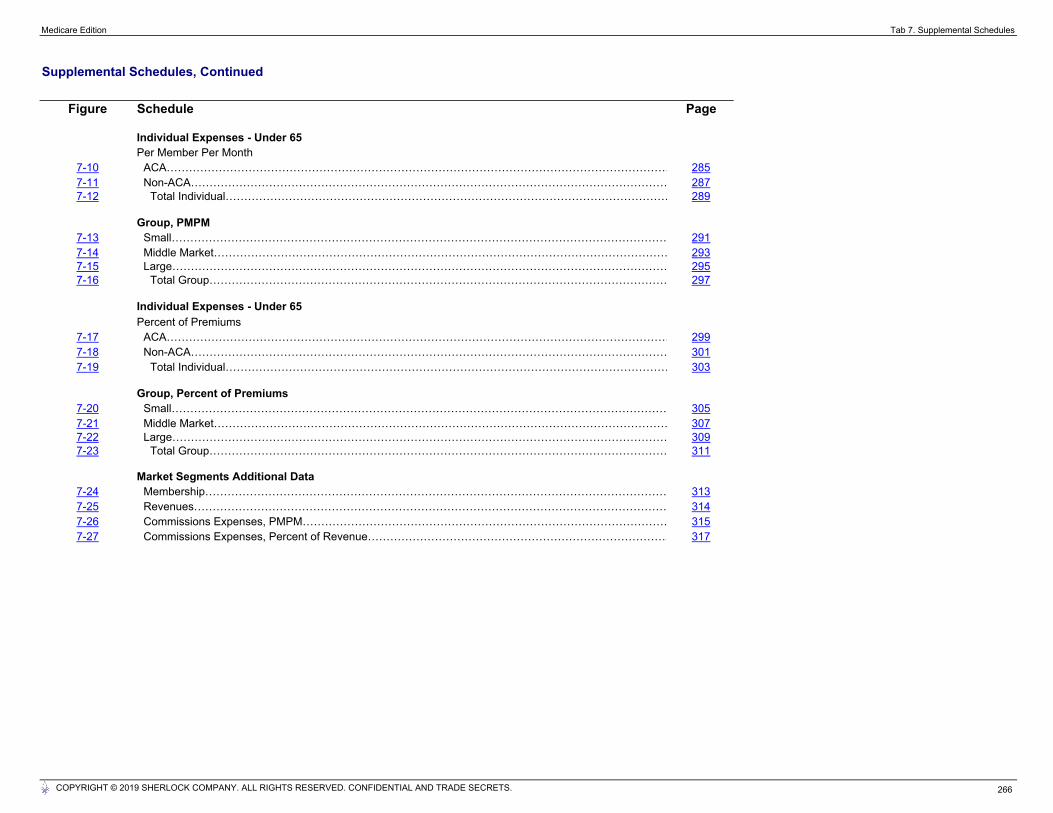
Supplemental Schedules, Continued
Figure Schedule Page
Individual Expenses - Under 65Per Member Per Month
7-10 ACA……………………………………………………………………………………………………………………… 2857-11 Non-ACA………………………………………………………………………………………………………………… 2877-12 Total Individual………………………………………………………………………………………………………… 289
Group, PMPM7-13 Small……………………………………………………………………………………………………………………… 2917-14 Middle Market…………………………………………………………………………………………………………… 2937-15 Large……………………………………………………………………………………………………………………… 2957-16 Total Group…………………………………………………………………………………………………………… 297
Individual Expenses - Under 65Percent of Premiums
7-17 ACA……………………………………………………………………………………………………………………… 2997-18 Non-ACA………………………………………………………………………………………………………………… 3017-19 Total Individual………………………………………………………………………………………………………… 303
Group, Percent of Premiums7-20 Small……………………………………………………………………………………………………………………… 3057-21 Middle Market…………………………………………………………………………………………………………… 3077-22 Large……………………………………………………………………………………………………………………… 3097-23 Total Group…………………………………………………………………………………………………………… 311
Market Segments Additional Data7-24 Membership……………………………………………………………………………………………………………… 3137-25 Revenues………………………………………………………………………………………………………………… 3147-26 Commissions Expenses, PMPM……………………………………………………………………………………… 3157-27 Commissions Expenses, Percent of Revenue……………………………………………………………………… 317
COPYRIGHT © 2019 SHERLOCK COMPANY. ALL RIGHTS RESERVED. CONFIDENTIAL AND TRADE SECRETS. 266
Tab 8Finance and Accounting Details
Figure Schedule Page
Stop-Loss8-1 Stop-Loss Sold Members as a Percent of Self-Insured Members………………………………………………… 323
8-1 Stop-Loss Only………………………………………………………………………………………………………… 323
8-2 Self-Insured Fees Plus Stop-Loss…………………………………………………………………………………… 3248-2 Self-Insured Premium-Equivalents Plus Stop-Loss………………………………………………………………… 324
Finance and Accounting Metrics8-3 Equity Turnover……………………………………………………………………….………………………………… 3258-3 Operating Return on Equity……………………………………………………………………….…………………… 3258-3 Days of Accounts Receivable……………………………………………………………………….………………… 3258-3 Days of Premiums Receivable……………………………………………………………………….………………… 3258-3 Current Ratio……………………………………………………………………….…………………………………… 3258-3 RBC Ratio……………………………………………………………………….……………………………………… 325
Property, Plant and Equipment8-4 Property, Plant and Equipment Value, PMPM………………………………………………………………….…… 3268-4 Non-Cash Expenses, PMPM………………………………………………………………….……………………… 3268-4 Non-Cash Expenses as a Percent of Total Function Administrative Expenses………………………………… 3268-4 Average Age in Years of Property, Plant and Equipment…………………………………………………………… 326
COPYRIGHT © 2019 SHERLOCK COMPANY. ALL RIGHTS RESERVED. CONFIDENTIAL AND TRADE SECRETS. 319
This includes Stop Loss metrics, which relates to Plan working capital as well as product design. Other topics include metrics of financial condition and liquidity, aging of Property, Plant and Equipment, non-cash expenses, capitalization vs. expense of strategic projects and an analysis of taxes stemming from health care reform.
Stop-Loss insurance is often sold to self-insured (ASO/ASC) customers of health plans. Since stop-loss has different economic characteristics than ASO/ASC but they are often sold together, it can be illuminating to look at stop-loss and ASO/ASC products as though they were combined. In this section, we report the proportion of ASO/ASC membership that purchases stop-loss coverage and the costs and revenues of the product on a stand-alone basis. We also report the combined economics of the ASO/ASC plus the stop loss insurance to get a complete view of these complementary products. These analyses are performed with and without prescription drug and mental health benefits, expenses and associated revenues.
This section also includes metrics of financial efficiency, financial strength, capital intensity, amortization policies, strategic projects and ACA taxes and fees.

Medicare Edition Tab 8. Finance & Accounting Details and Information Systems
Finance and Accounting Details, Continued
Figure Schedule Page
Strategic Projects - Capitalized vs. Expensed8-5 Per Member Per Month………………………………………………………………….……………………………… 3278-6 Percent of Projects………………………………………………………………….…………………………………… 3288-7 Information Systems vs. Other Functions as a Percent of Total Functions……………………………………… 3298-8 Additional Metrics………………………………………………………………….…………………………………… 330
ACA-Related Taxes and Fees8-9 Per Member Per Month………………………………………………………………………………………… 3318-9 Percent of Premiums and Fees……………………………………………………………………………………… 3318-9 Note: Membership and Revenue Denominators.............................................................................................. 331
COPYRIGHT © 2019 SHERLOCK COMPANY. ALL RIGHTS RESERVED. CONFIDENTIAL AND TRADE SECRETS. 320
Medicare Edition Tab 8. Finance & Accounting Details and Information Systems
Information Systems, Allocated by Supported Functional Areas
Figure Schedule Page
Information Systems Allocations8-10 Information Systems Allocations, PMPM……………………………………………………….…………………… 333
8-11 IS Allocations as a Percent Revenue……………………………………………………….………………………… 334
8-12 Percent of IS Costs Allocated to Each Functional Area……………………………………………………….…… 335
8-13 IS Loaded Functional Area Expenses PMPM……………………………………………………….……………… 336
8-14 IS Costs as a Percent of Loaded Functional Area Costs……………………………………………………….… 337
8-15 IS Staffing Costs as a Percent of Loaded Functional Area Costs………………………………………………… 338
Information Systems Applications Allocations8-16 Applications Information Systems Dollar Allocations, PMPM……………………………………………………… 339
8-17 Applications IS Dollar Allocations as a Percent Revenue……………………………………………………….… 340
8-18 Percent of Applications IS Costs Allocated to Each Functional Area……………………………………………… 341
8-19 Applications IS Loaded Functional Area Expenses PMPM……………………………………………………….… 342
8-20 Applications IS Costs as a Percent of Loaded Functional Area Costs…………………………………………… 343
COPYRIGHT © 2019 SHERLOCK COMPANY. ALL RIGHTS RESERVED. CONFIDENTIAL AND TRADE SECRETS. 321
This section provides an analysis of functional expenses, allocating Information Systems expense to the functional areas that it supports. These allocations are then analyzed to determine the impact on each functional area, how it varies between functional areas and the importance of staffing costs relative to the reallocated expenses.
The first analysis, "Information Systems Allocations," includes all IS expenses such as infrastructure and software. The second analysis is only for applications that can be traced to specific functional areas.
This analysis is based on Comprehensive Total data. Revenues are defined as premiums and self-funded fees. Premiums and fees exclude those of pharmacy and mental health, as do associated expenses. "Loaded" means that the information systems allocations have been added to the reported functional area costs.

Tab 9Costs of Medicare Offered by Other Universes
Figure Schedule Page
Medicare Advantage9-1 Independent / Provider - Sponsored (IPS) Per Member Per Month……………………………………………… 3469-2 Independent / Provider - Sponsored Percent of Revenue………………………………………………………… 348
9-3 Blue Cross Blue Shield (BCBS) - Per Member Per Month………………………………………………………… 3509-4 Blue Cross Blue Shield - Percent of Revenue……………………………………………………………………… 352
9-5 IPS and BCBS - Per Member Per Month…………………………………………………………………………… 3549-6 IPS and BCBS - Percent of Revenue………………………………………………………………………………… 356
9-7 Medicare, Medicaid, IPS, and BCBS - Per Member Per Month…………………………………………………… 3589-8 Medicare, Medicaid, IPS, and BCBS - Percent of Revenue……………………………………………………… 360
Medicare SNP9-9 Independent / Provider - Sponsored (IPS) Per Member Per Month……………………………………………… 3629-10 Independent / Provider - Sponsored Percent of Revenue………………………………………………………… 364
9-11 Blue Cross Blue Shield (BCBS) - Per Member Per Month………………………………………………………… 3669-12 Blue Cross Blue Shield - Percent of Revenue……………………………………………………………………… 368
9-13 IPS and BCBS - Per Member Per Month…………………………………………………………………………… 3709-14 IPS and BCBS - Percent of Revenue………………………………………………………………………………… 372
9-15 Medicare, Medicaid, IPS, and BCBS - Per Member Per Month…………………………………………………… 3749-16 Medicare, Medicaid, IPS, and BCBS - Percent of Revenue……………………………………………………… 376
Medicare Cost9-17 Independent / Provider - Sponsored (IPS) Per Member Per Month……………………………………………… 3789-18 Independent / Provider - Sponsored Percent of Revenue………………………………………………………… 380
9-19 Medicare, Medicaid, and IPS - Per Member Per Month…………………………………………………………… 3809-20 Medicare, Medicaid, and IPS - Percent of Revenue………………………………………………………………… 382
Medicare Part D*9-21 Blue Cross Blue Shield (BCBS) - Per Member Per Month………………………………………………………… 3849-22 Blue Cross Blue Shield - Percent of Revenue……………………………………………………………………… 386
*IPS and Medicaid Plans did not provided Medicare Part D data
COPYRIGHT © 2019 SHERLOCK COMPANY. ALL RIGHTS RESERVED. CONFIDENTIAL AND TRADE SECRETS. 345
This section provides an analysis of Medicare Advantage, Medicare SNP, Medicare Cost, and Medicare Part D plans that are offered by other universes in Sherlock Company's benchmarking study for 2019. Data is presented on a per member per month and a percent of revenue basis.
Revenues are defined as premiums or self-funded fees. Premiums and fees exclude those of pharmacy and mental health, as do associated expenses.

Tab 10Participant Characteristics
Figure Characteristic PageMembership
10-1 Member Months - Individual and Group (000's).................................................................................................................... 39310-2 Average Members - Individual and Group (000's)................................................................................................................ 39410-3 Average Members - Individual (000's).................................................................................................................................. 39510-4 Average Members - Group (000's)........................................................................................................................................ 39610-5 Change in Average Membership........................................................................................................................................... 397
10-6 Mix - Product Membership as a Percent of Total Comprehensive Membership................................................................... 39810-7 Mix - Individual Membership as Percent of Total Product Membership................................................................................ 39910-8 Mix - Group Membership as Percent of Total Product Membership..................................................................................... 400
10-9 Average Number of Groups Served...................................................................................................................................... 40110-10 Average Group Size (Member Months / Groups Months)..................................................................................................... 40210-11 Change in Average Number of Groups Served.................................................................................................................... 403
Revenues10-12 Premiums and/or Self Funded Fees (000,000's).................................................................................................................. 40410-13 Premiums and/or Premium Equivalents (000,000's)............................................................................................................. 40510-14 Premiums and/or Self Funded Fees (Excluding Rx and B.H.) (000,000's)........................................................................... 40610-15 Premiums and/or Premium Equivalents (Excluding Rx and B.H.) (000,000's)..................................................................... 407
10-16 Premiums and/or Self Funded Fees PMPM.......................................................................................................................... 40810-17 Premiums and/or Premium Equivalents PMPM.................................................................................................................... 40910-18 Premiums and/or Self Funded Fees PMPM (Excluding Rx and B.H.).................................................................................. 41010-19 Premiums and/or Premium Equivalents PMPM (Excluding Rx and B.H.)............................................................................. 411
10-20 Change in Gross Premiums/Self Funded Fees, PMPM........................................................................................................ 412
10-21 Mix - Premiums and Self-Funded Fees as a Percent of Overall Total Premiums and Self-Funded Fees............................ 41310-22 Mix - Premiums and Premium Equivalents as a Percent of Overall Total Prem. and Prem. Equivalents............................. 414
Health Care Costs10-23 Health and Other Benefit Costs PMPM................................................................................................................................. 41510-24 Health and Other Benefit Costs PMPM (Excluding Rx and B.H.)......................................................................................... 41610-25 Health Benefits Ratio (MLR) (Benefits / Premiums & Premium Equivalents)....................................................................... 41710-26 Health Benefits Ratio (MLR) (Benefits / Premiums & Premium Equivalents) (Excluding Rx and B.H.)................................ 418
10-27 Change in Net Health and Other Benefit Costs, PMPM........................................................................................................ 419
Administrative Expenses10-28 Administrative Costs PMPM (Excluding Rx and B.H.).......................................................................................................... 42010-29 Administrative Expense Ratio (Premiums and Fees) (Excluding Rx and B.H.).................................................................... 42110-30 Administrative Expense Ratio (Premium and Fees) (Including Rx and B.H.)....................................................................... 42210-31 Administrative Expense Ratio (Premium Equivalents) (Excluding Rx and B.H.).................................................................. 42310-32 Administrative Expense Ratio (Premium Equivalents) (Including Rx and B.H.).................................................................... 424
COPYRIGHT © 2019 SHERLOCK COMPANY. ALL RIGHTS RESERVED. CONFIDENTIAL AND TRADE SECRETS. 391
This section provides a profile of the respondents to this edition of the benchmarking study. We summarize membership, product mix, groups served, revenues, medical expenses, profit margin and other key attributes.This section provides a profile of the respondents to this edition of the benchmarking study. We summarize membership, product mix, groups served, revenues, medical expenses, profit margin and other key attributes.

Medicare Edition Tab 10. Participant Characteristics
Participant Characteristics, Continued
Figure Schedule Page
Profit10-33 Operating Earnings PMPM................................................................................................................................................... 42510-34 Operating Margin.................................................................................................................................................................. 426
Characteristics by Segment10-35 ACA, Under 65...................................................................................................................................................................... 42710-36 Non-ACA, Under 65.............................................................................................................................................................. 42810-37 Total Individual.................................................................................................................................................................... 429
10-38 Small Group.......................................................................................................................................................................... 43010-39 Middle Market........................................................................................................................................................................ 43110-40 Large Group.......................................................................................................................................................................... 43210-41 Total Group......................................................................................................................................................................... 433
COPYRIGHT © 2019 SHERLOCK COMPANY. ALL RIGHTS RESERVED. CONFIDENTIAL AND TRADE SECRETS. 392

SHERLOCK BENCHMARKS
www.sherlockco.com (215) 628-2289
2019 Medicare Plans Edition
Volume I – Financial Metrics