Embed Size (px)
Citation preview

ISSN 1742-206X
1742-206X(2011)7:7;1-8
www.molecularbiosystems.org Volume 7 | Number 7 | 1 July 2011 | Pages 2089–2332
PAPERBing Zhang et al.Relating protein adduction to gene expression changes: a systems approach
Indexed in
MED
LINE!

2118 Mol. BioSyst., 2011, 7, 2118–2127 This journal is c The Royal Society of Chemistry 2011
Cite this: Mol. BioSyst., 2011, 7, 2118–2127
Relating protein adduction to gene expression changes: a systems
approachw
Bing Zhang,*aZhiao Shi,
bcDexter T. Duncan,
aNaresh Prodduturi,
a
Lawrence J. Marnettdand Daniel C. Liebler
ad
Received 12th January 2011, Accepted 21st April 2011
DOI: 10.1039/c1mb05014a
Modification of proteins by reactive electrophiles such as the 4-hydroxy-2-nonenal (HNE) plays a
critical role in oxidant-associated human diseases. However, little is known about protein adduction
and the mechanism by which protein damage elicits adaptive effects and toxicity. We developed a
systems approach for relating protein adduction to gene expression changes through the integration
of protein adduction, gene expression, protein–DNA interaction, and protein–protein interaction data.
Using a random walk strategy, we expanded a list of responsive transcription factors inferred from
gene expression studies to upstream signaling networks, which in turn allowed overlaying protein
adduction data on the network for the prediction of stress sensors and their associated regulatory
mechanisms. We demonstrated the general applicability of transcription factor-based signaling
network inference using 103 known pathways. Applying our workflow on gene expression and
protein adduction data from HNE-treatment not only rediscovered known mechanisms of electrophile
stress but also generated novel hypotheses regarding protein damage sensors. Although developed for
analyzing protein adduction data, the framework can be easily adapted for phosphoproteomics and
other types of protein modification data.
Introduction
Reactive electrophiles generated from toxic drugs, environ-
mental chemicals, and endogenous oxidative stress represent a
significant threat to cells because they react with many
intracellular nucleophiles including DNA, RNA, phospholipids,
and proteins. Covalent modification of proteins by electro-
philes is known as protein adduction. Although protein
adduction has been widely implicated in cytotoxicity, the
mechanisms by which protein adduction elicits adaptive effects
and toxicity remain largely unclear.1 Traditional biology
studies focus on proteins involved in well-defined signaling
pathways and address the effect of their adduction on
the function of signaling networks and downstream gene
expression.2–4 Valuable information has been generated from
such focused studies but the pace of discovery has been slow.5
Moreover, a holistic view of electrophile stress cannot be
achieved through such a reductionist approach.
Recent technological advances that enable global gene
expression analysis and high-throughput identification of
modified proteins have provided an opportunity for a systems-
level investigation of protein adduction and its molecular
consequences.6–8 Using the lipid product 4-hydroxy-2-nonenal
(HNE) as an electrophile model, a proteomics study in human
RKO cells identified about 400 protein targets of HNE.6 In a
microarray study, the effect of HNE on gene expression in the
same cell line was investigated.8 Although these studies provided
rich information on electrophile stress from different perspectives,
we hypothesize that a systematic integration of protein modifica-
tions with gene expression changes may further elucidate the
signaling and transcriptional regulatory mechanisms through
which protein adduction triggers gene expression changes.
Methods have been developed to integrate gene expression
data and upstream regulatory data from high-throughput genetic
and phosphoproteomics studies for the inference of signaling
mechanisms.9–14 Because some adducted proteins can serve as
stress sensors to activate signaling and transcriptional regulatory
programs,2–4,15,16 protein adduction data hold information on
upstream regulators of observed gene expression changes, similar
to phosphoproteomics data. However, although it is likely
almost all the hits in a phosphoproteomics study are involved
in signaling events, we only expect a small fraction of adducted
proteins to be involved in signaling.6,17 Therefore, one unique
challenge in analyzing protein adduction data is to distinguish
stress sensors from other adducted proteins, which is not
aDepartment of Biomedical Informatics, Vanderbilt University Schoolof Medicine, Nashville, TN 37232, USA.E-mail: [email protected]
bAdvanced Computing Center for Research & Education,Vanderbilt University, Nashville, TN 37232, USA
cDepartment of Electrical Engineering and Computer Science,Vanderbilt University, Nashville, TN 37232, USA
dDepartment of Biochemistry, Vanderbilt University School ofMedicine, Nashville, TN 37232, USA
w Electronic supplementary information (ESI) available. See DOI:10.1039/c1mb05014a
MolecularBioSystems
Dynamic Article Links
www.rsc.org/molecularbiosystems PAPER
This journal is c The Royal Society of Chemistry 2011 Mol. BioSyst., 2011, 7, 2118–2127 2119
addressed by existing signaling network inference approaches
developed for phosphoproteomics data.
Bromberg and colleagues18 showed that it is possible to
make signaling network inference using a protein interaction
network and a list of conditionally activated transcription
factors, without using upstream regulatory data. Applying a
shortest path analysis, they built a cannabinoid receptor
signaling network starting from a list of transcription factors
activated by CB1R stimulation, which were identified in an
array-based chromatin immunoprecipitation study. Because
conditionally activated transcription factors can be identified
based on gene expression data,19–22 we reasoned that this
approach can be similarly used to expand a list of responsive
transcription factors identified in gene expression studies to infer
upstream signaling networks, which in turn would allow over-
laying protein adduction data on the network for the prediction
of stress sensors and their associated regulatory mechanisms.
However, although transcription factor-based signaling network
inference has been demonstrated in the cannabinoid receptor
signaling network, it is not clear how well this approach can be
generalized to different signaling pathways.
In this study, we developed a random walk based approach
that infers upstream signaling networks based on a list of
conditionally activated transcription factors. We demonstrate
the general applicability of transcription factor-based signaling
network inference using more than 100 NCI-Nature curated
signaling pathways. Accurate signaling network inference
allowed us to map protein adduction data to the inferred
network to identify candidate stress sensors. Our integrative
analysis of the gene expression data and protein adduction data
from HNE-treatment not only rediscovered known mechanisms
of electrophile stress, but also generated promising hypotheses on
protein damage sensors for experimental validation.
Results and discussion
Overview of the analysis workflow
Fig. 1 provides a schematic overview of our analysis workflow.
First, protein–DNA and protein–protein interaction data are
collected from public databases to build an interaction
network, in which mRNA and protein derived from the same
gene are modeled as different nodes. As a result, gene expression
data and protein adduction data can be mapped to the mRNA
nodes and protein nodes respectively. Although early studies
modeled mRNA and protein products from the same gene as a
single node,10,11,13 recent studies suggest that representing
mRNAs and proteins as separate nodes can help highlight
the regulatory role of proteins.9,14 Secondly, using well-established
over-representation analysis,19–22 gene expression data are
integrated with protein–DNA interaction data to infer
transcription factors underlying observed gene expression
changes. Next, a random walk with restart (RWR) analysis
in combination with rigorous statistical evaluation is used to
identify signaling proteins based on the assumption that these
proteins are located close to the responsive transcription
factors in the protein interaction network. RWR provides
a global distance measurement that captures similarity of
proteins in a network well.23,24 Finally, protein adduction
data are superimposed on the identified signaling networks
to infer candidate protein damage stress sensors and associated
regulatory mechanisms.
Evaluation of the random walk approach for signaling network
inference
A critical step in our workflow is the correct inference of
signaling networks on the basis of a list of conditionally
activated transcription factors. Based on the assumption that
signaling proteins and transcription factors in the same pathway
are located in proximity in a protein interaction network, we
adapted a global distance measurement computed by random
walk with restart (RWR) to score proteins according to their
closeness to the input transcription factors. Specifically, we let
the random walker start with equal probability from each
of the input transcription factors to search for additional
proteins in the signaling network. The walker iteratively
transmits to its neighborhood with equal probability. At each
step, it also has some probability to return to the transcription
factor. The restart probability controls how far the random
walker moves away from the transcription factor. The final
score of a protein is defined as the steady-state probability that
the walker will finally stay at the protein.
The score represents the overall network proximity of a
protein with regard to the transcription factors of interest. The
score defined by RWR has some important properties:25
compared with pair-wise metrics, it can capture the global
structure of the graph; compared with traditional graph
distances such as shortest path and maximum flow etc., it
can capture the multifaceted relationship between two nodes.
In protein interaction network-based candidate disease gene
prioritization, RWR significantly outperforms methods based
on local distance measures such as the shortest path.24
Some proteins may acquire a high score simply because of
the network topology. To assess the statistical significance of
the scores, we let the random walker start from the same
number of randomly selected transcription factors to calculate
random scores for each node (Fig. 1D). This process was
repeated many times to generate multiple sets of random
scores. To assess statistical significance, we performed two
statistical tests: the first test indexes each node score on a
‘local’ null distribution, estimated from all random scores of
the same node (pl); the second test indexes each node score on
a ‘global’ null distribution of random scores for all nodes (pg).
A significant pg indicates the overall significance of the protein
with regard to the input transcription factors, while a significant
pl ensures that the significance is not simply due to network
topology. Proteins with both significant local and global
p values were considered as candidate signaling proteins.
Using selected input lists, we performed analyses based on
1000 and 10 000 random repetitions. For all tested input lists,
both pl and pg showed extremely high correlation (Pearson’s
correlation coefficient4 0.99) for the two numbers of repetitions.
Therefore, 1000 repetitions were used for p value calculation in
this study. Based on the calculated p values, two levels of
significance were investigated in this study, with pl o 0.01 and
pg o 0.01 for a stringent level and pl o 0.05 and pg o 0.05 for
a loose level.

2120 Mol. BioSyst., 2011, 7, 2118–2127 This journal is c The Royal Society of Chemistry 2011
We used the pathways curated by NCI-Nature to test whether
the random walk approach was able to predict signaling proteins
given transcription factors in the same pathway. Transcription
factors were selected based on the Gene Ontology annotation
of ‘‘transcription factor activity’’ (GO:0003700), including
960 proteins. Among the 127 NCI-Nature curated pathways,
103 had at least one transcription factor. The sizes of the
103 pathways ranged from 5 to 418, with a median of 46. The
number of transcription factors in the pathways ranged from
1 to 85, with a median of 8.
We started the evaluation using a restart probability of 0.5.
For each pathway, we used the hypergeometric test to evaluate
whether predicted proteins significantly overlapped with those in
the pathway. To avoid bias, all transcription factors were
excluded from the hypergeometric test. The empirical cumulative
distribution function (cdf) of the hypergeometric p-values for all
the 103 predictions based on the loose cutoff level (pl o 0.05 and
pg o 0.05) was calculated and plotted as the solid red curve in
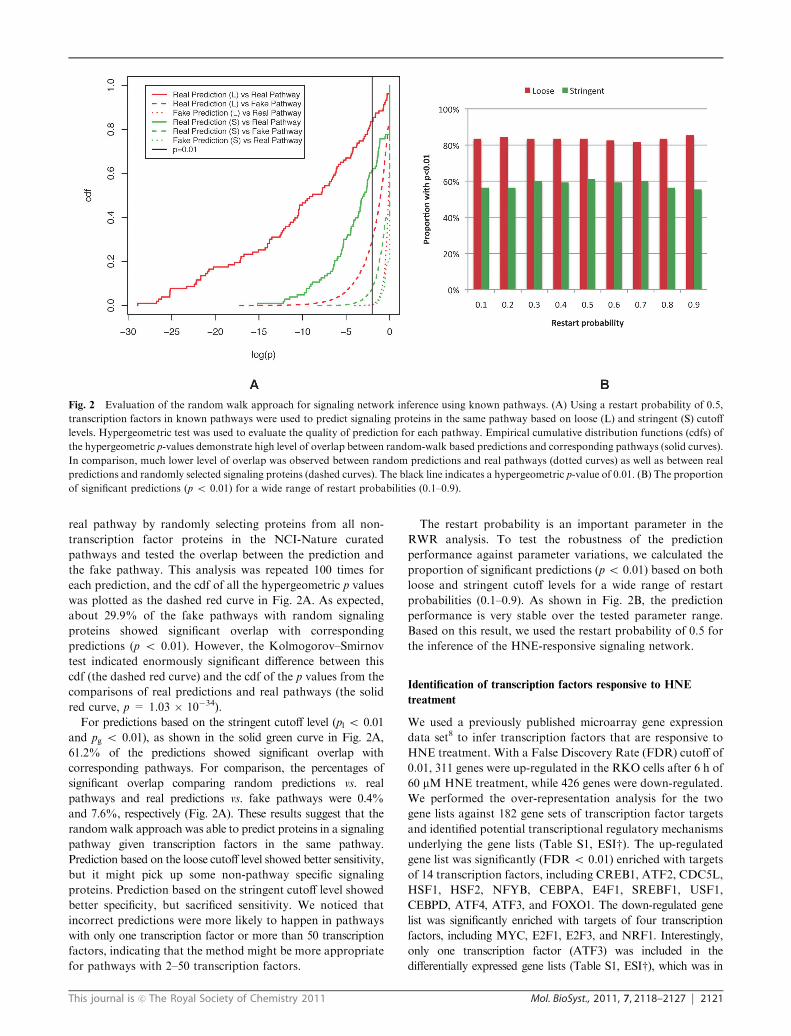
Fig. 2A. Some predictions highly significantly overlapped with
the real pathways with hypergeometric p values less than 10�25.
Most (83.5%) of the predictions showed significant overlap with
corresponding pathways (p o 0.01). For comparison, for each
prediction, we randomly selected the same number of proteins
from the protein interaction network and tested their overlap
with the corresponding pathway. This was repeated 100 times for
each prediction, and the cdf of all the hypergeometric p values
was plotted as the dotted red curve in Fig. 2A. Only 0.4% of the
fake predictions showed significant overlap with corresponding
pathways (p o 0.01).
Because proteins in the curated signaling pathways in
general are likely to be located closer to transcription factors
than other proteins, this result may simply reflect the ability of
our approach to identify signaling proteins in a non-pathway-
specific manner. Therefore, we further tested whether our
predictions were specific to individual pathways. For each
prediction, we created a fake pathway of the same size as the
Fig. 1 Overview of the systems approach for the integrative analysis of gene expression and protein adduction data. (A) Mapping data to
network. Protein–protein interaction (PPI) and protein–DNA interaction data are modeled in an integrative network. mRNAs and proteins
corresponding to the same gene are modeled separately in the PPI layer and the mRNA layer, with transcription factors (TFs) connecting these two
layers. Transcription factors, non-transcription factor proteins, and mRNAs are represented as square, round, and triangle nodes, respectively.
Gene expression data and protein adduction data are mapped to the network. In the mRNA layer, up-regulated genes, down-regulated genes, and
genes with no significant change are colored in red, green, and yellow, respectively. In the PPI layer, adducted proteins are highlighted with blue
circles around the nodes. (B) Transcription factor inference. Over-representation analysis is used to identify transcription factors that are
responsive to the treatment. Responsive transcription factors are colored in red, while non-responsive transcription factors are colored in yellow in
the PPI layer. (C) Walking the interactome. Random walk with restart is used to score all proteins in the PPI network for their network proximity
to the responsive transcription factors. Based on the scores, each node in the PPI layer is colored with a gradient from red to yellow (high score to
low score). (D) Significance evaluation. A global null score distribution for all nodes and a local null score distribution for each node are estimated
by scores generated from randomly created transcription factor sets (Rdm_1 through Rdm_n) and used to evaluate the significance of the real
scores for each node. (E) Subnetworks that constitute of significant proteins are defined as responsive signaling networks. Overlaying protein
adduction data on the inferred signaling networks allows the detection of candidate stress sensors and associated regulatory mechanisms.
This journal is c The Royal Society of Chemistry 2011 Mol. BioSyst., 2011, 7, 2118–2127 2121
real pathway by randomly selecting proteins from all non-
transcription factor proteins in the NCI-Nature curated
pathways and tested the overlap between the prediction and
the fake pathway. This analysis was repeated 100 times for
each prediction, and the cdf of all the hypergeometric p values
was plotted as the dashed red curve in Fig. 2A. As expected,
about 29.9% of the fake pathways with random signaling
proteins showed significant overlap with corresponding
predictions (p o 0.01). However, the Kolmogorov–Smirnov
test indicated enormously significant difference between this
cdf (the dashed red curve) and the cdf of the p values from the
comparisons of real predictions and real pathways (the solid
red curve, p = 1.03 � 10�34).
For predictions based on the stringent cutoff level (pl o 0.01
and pg o 0.01), as shown in the solid green curve in Fig. 2A,
61.2% of the predictions showed significant overlap with
corresponding pathways. For comparison, the percentages of
significant overlap comparing random predictions vs. real
pathways and real predictions vs. fake pathways were 0.4%
and 7.6%, respectively (Fig. 2A). These results suggest that the
randomwalk approach was able to predict proteins in a signaling
pathway given transcription factors in the same pathway.
Prediction based on the loose cutoff level showed better sensitivity,
but it might pick up some non-pathway specific signaling
proteins. Prediction based on the stringent cutoff level showed
better specificity, but sacrificed sensitivity. We noticed that
incorrect predictions were more likely to happen in pathways
with only one transcription factor or more than 50 transcription
factors, indicating that the method might be more appropriate
for pathways with 2–50 transcription factors.
The restart probability is an important parameter in the
RWR analysis. To test the robustness of the prediction
performance against parameter variations, we calculated the
proportion of significant predictions (p o 0.01) based on both
loose and stringent cutoff levels for a wide range of restart
probabilities (0.1–0.9). As shown in Fig. 2B, the prediction
performance is very stable over the tested parameter range.
Based on this result, we used the restart probability of 0.5 for
the inference of the HNE-responsive signaling network.
Identification of transcription factors responsive to HNE
treatment
We used a previously published microarray gene expression
data set8 to infer transcription factors that are responsive to
HNE treatment. With a False Discovery Rate (FDR) cutoff of
0.01, 311 genes were up-regulated in the RKO cells after 6 h of
60 mM HNE treatment, while 426 genes were down-regulated.
We performed the over-representation analysis for the two
gene lists against 182 gene sets of transcription factor targets
and identified potential transcriptional regulatory mechanisms
underlying the gene lists (Table S1, ESIw). The up-regulated
gene list was significantly (FDR o 0.01) enriched with targets
of 14 transcription factors, including CREB1, ATF2, CDC5L,
HSF1, HSF2, NFYB, CEBPA, E4F1, SREBF1, USF1,
CEBPD, ATF4, ATF3, and FOXO1. The down-regulated gene
list was significantly enriched with targets of four transcription
factors, including MYC, E2F1, E2F3, and NRF1. Interestingly,
only one transcription factor (ATF3) was included in the
differentially expressed gene lists (Table S1, ESIw), which was in
Fig. 2 Evaluation of the random walk approach for signaling network inference using known pathways. (A) Using a restart probability of 0.5,
transcription factors in known pathways were used to predict signaling proteins in the same pathway based on loose (L) and stringent (S) cutoff
levels. Hypergeometric test was used to evaluate the quality of prediction for each pathway. Empirical cumulative distribution functions (cdfs) of
the hypergeometric p-values demonstrate high level of overlap between random-walk based predictions and corresponding pathways (solid curves).
In comparison, much lower level of overlap was observed between random predictions and real pathways (dotted curves) as well as between real
predictions and randomly selected signaling proteins (dashed curves). The black line indicates a hypergeometric p-value of 0.01. (B) The proportion
of significant predictions (p o 0.01) for a wide range of restart probabilities (0.1–0.9).
2122 Mol. BioSyst., 2011, 7, 2118–2127 This journal is c The Royal Society of Chemistry 2011
agreement with previous reports that many transcription factors
are not regulated at the transcriptional level.21,26
Some of the transcription factors are known to be responsive
to HNE treatment, such as HSF1, CREB1, ATF2, NRF1,
MYC, and E2F family transcription factors.15,27–30 In addition,
several others are well-known players in stress response,
including ATF4, HSF2, SREBF1, and USF1. Interestingly,
although Nrf2 (NFE2L2) is a well-known transcription factor
in response to electrophile stress,4 it was not identified as
significant in our analysis. Among the 246 predicted targets of
Nrf2, only 4 overlapped with the 311 up-regulated genes
(enrichment FDR = 0.67) and 6 overlapped with the 426
down-regulated genes (enrichment FDR = 0.99). Because the
transcription factor target database used in the study was
constructed based on computational analysis,31 the failure to
identify Nrf2 might be due to false positive- and false negative-
predictions in the database. On the other hand, as the enrichment
analysis is reasonably robust against imperfect pre-defined gene
sets, it is also possible that the Nrf2-driven transcription program
was not altered in the cell line under the specific condition, i.e.,
time and dose of HNE treatment. We are designing experiments
to further investigate these possibilities.
Inferring the HNE-responsive signaling network based on
predicted transcription factors
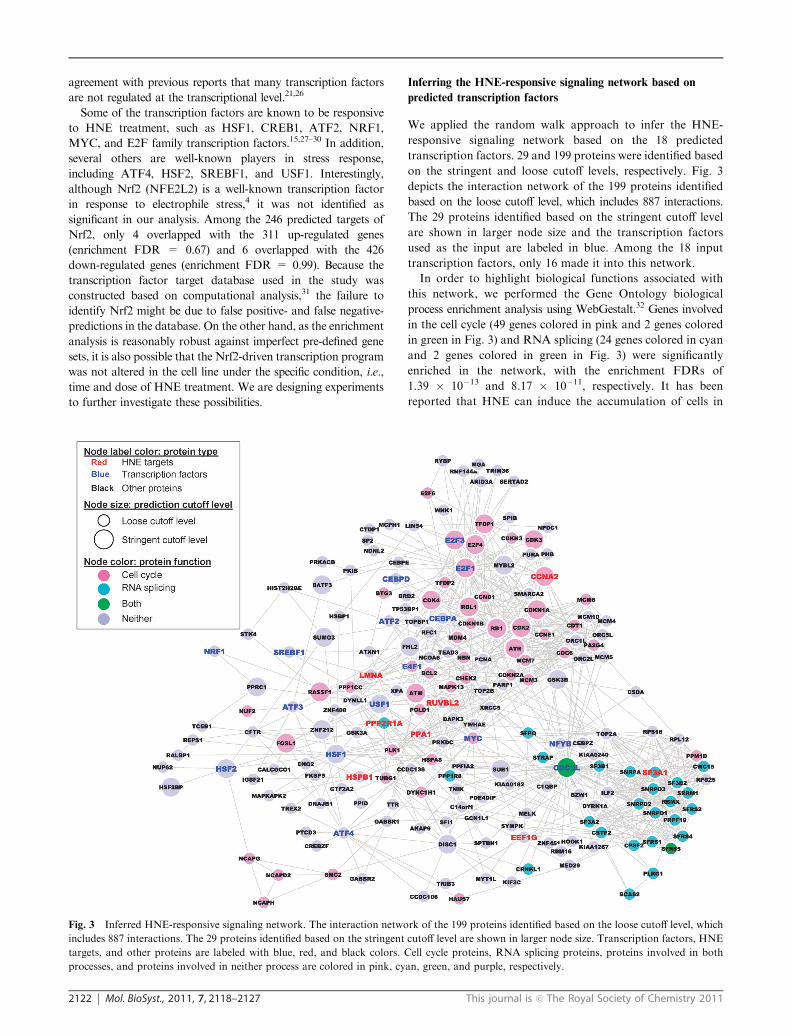
We applied the random walk approach to infer the HNE-
responsive signaling network based on the 18 predicted
transcription factors. 29 and 199 proteins were identified based
on the stringent and loose cutoff levels, respectively. Fig. 3
depicts the interaction network of the 199 proteins identified
based on the loose cutoff level, which includes 887 interactions.
The 29 proteins identified based on the stringent cutoff level
are shown in larger node size and the transcription factors
used as the input are labeled in blue. Among the 18 input
transcription factors, only 16 made it into this network.
In order to highlight biological functions associated with
this network, we performed the Gene Ontology biological
process enrichment analysis using WebGestalt.32 Genes involved
in the cell cycle (49 genes colored in pink and 2 genes colored
in green in Fig. 3) and RNA splicing (24 genes colored in cyan
and 2 genes colored in green in Fig. 3) were significantly
enriched in the network, with the enrichment FDRs of
1.39 � 10�13 and 8.17 � 10�11, respectively. It has been
reported that HNE can induce the accumulation of cells in
Fig. 3 Inferred HNE-responsive signaling network. The interaction network of the 199 proteins identified based on the loose cutoff level, which
includes 887 interactions. The 29 proteins identified based on the stringent cutoff level are shown in larger node size. Transcription factors, HNE
targets, and other proteins are labeled with blue, red, and black colors. Cell cycle proteins, RNA splicing proteins, proteins involved in both
processes, and proteins involved in neither process are colored in pink, cyan, green, and purple, respectively.

This journal is c The Royal Society of Chemistry 2011 Mol. BioSyst., 2011, 7, 2118–2127 2123
the G0/G1 phase of the cell cycle in both yeast and human
cancer cells.30,33 The inferred network included important
genes in cell cycle arrest such as CDKN1A, CDKN1B,
CDKN2A, CDKN3, MYC, NBN, PA2G4, RASSF1, and
RB1. The identification of mRNA splicing proteins was
unexpected. Recently, it has been suggested that mRNA
splicing may be an overlooked target of stressing agents, such
as heat shock.34 Different mechanisms have been proposed to
block constitutive mRNA splicing and to affect alternative
splicing regulation in order to modulate gene expression
during recovery from stress.
Intriguingly, the transcription factor CDC5L serves as a
hub in the inferred network with many connections to both
cell cycle proteins and RNA splicing proteins (Fig. 3). CDC5L
is the first transcriptional regulator shown to affect G2
progression and mitotic entry in mammalian cells.35 Moreover,
it has also been found to be an essential component of a non-
snRNA spliceosome, which contains at least five additional
protein factors and is required for the second catalytic step of
pre-mRNA splicing.36 Better understanding of the triple roles
of CDC5L in transcription, cell cycle, and RNA splicing
regulation may shed light on the complex molecular mechanisms
of HNE response.
Because DNA damage response is a hallmark of oxidative
stress and the DNA damage response network has been well
understood, we further compared the inferred network with
the DNA damage response network curated in the WikiPathways
database.37 Among the 199 proteins in the inferred network,
15 overlapped with the DNA damage response network
(p = 2.54 � 10�13 in the hypergeometric test for enrichment,
Fig. 4), reconfirming the biological relevance of the inferred
network. In contrast, among the 737 differentially expressed
genes in response to HNE treatment, only 5 were involved in
the curated DNA damage response network (p= 0.10, Fig. 4).
This result further highlights the ability of the network
inference approach in revealing signaling proteins that are
not visible by changes in mRNA concentrations.
Inferring stress-sensing proteins and associated regulatory
mechanisms
The ability to predict a biologically meaningful HNE-responsive
signaling network allowed us to map protein adduction data
to the network and to infer candidate HNE-sensing proteins.
Among the 417 HNE adducted proteins reported in ref. 16,
one of them, CCNA2, was included in the 29 proteins identified
based on the stringent cutoff level. Additionally, seven proteins
were identified based on the loose cutoff level, including
EEF1G, HSPB1, LMNA, PPA1, PPP2R1A, RUVBL2, and
SF3A1 (Table S2, ESIw). Associating these results with the
protein–DNA interaction data and the gene expression data
led to some interesting hypotheses on possible mechanisms
through which the adducted proteins trigger observed gene
expression changes. Some of the hypothesized mechanisms
are well supported by previous studies. Fig. 5 shows two
such examples for the inferred HNE-sensors CCNA2 and
RUVBL2.
CCNA2 was significantly down-regulated at the mRNA
level after the HNE treatment (FDR = 0.00038). Nevertheless,
its protein product Cyclin A2 displayed a statistically significant
increase in adduction with increasing HNE exposure
concentration,6 suggesting specific binding between HNE
and Cyclin A2. Cyclin A2 is essential for cell cycle progression
through G1/S and G2/M transitions.38 In mammalian cells,
the G1 checkpoint involves phosphorylation regulation of
retinoblastoma protein (pRb), the product of the RB1 gene.39
Cyclin A associated kinase activity is a rate limiting factor
for pRb phosphorylation.40 Phosphorylation of pRb by cyclin
Fig. 4 DNA damage response network. The network map was curated in the WikiPathways database. Cyan nodes represent proteins in the
inferred HNE-responsive signaling network. Red and green nodes represent proteins that are up or down-regulated at the mRNA level in response
to HNE treatment.

2124 Mol. BioSyst., 2011, 7, 2118–2127 This journal is c The Royal Society of Chemistry 2011
A/Cdk2 leads to the activation of E2F family transcription
factors,41 which have binding sites in the promoters of many
genes that are involved in cell cycle progression control.
Although CCNA2 itself was not listed as a target of E2F1
and E2F3 in the database derived from computational prediction,
two E2F binding sites have been reported in the promoter
region of cyclin A42 and the expression of cyclin A has been
found to be induced by E2F1.43 A previous study in leukemic
cells suggested that HNE inhibits cyclin A expression, causing
the dephosphorylation of pRb and an increase in the
pRb:E2F1 complex, which in turn inhibits the E2F-dependent
cell cycle gene expression.30 In addition to consistency with
this model, our results also raised the interesting possibility
that the adduction of cyclin A2 by HNE may initiate the arrest
of cell cycle progression. Moreover, we found that the E2F
target genes down-regulated by HNE were enriched not only
in cell cycle genes, but also in RNA splicing genes (Fig. 5A).
This complemented our signaling network analysis results
and suggested the inhibition of RNA splicing as a possible
mechanism in response to HNE-induced stress, in addition to
cell cycle arrest. Consistently, enrichment analysis of the 407
HNE adducted proteins against all pathways in theWikiPathways
database identified mRNA processing as the most signifi-
cantly enriched pathway (22 proteins, p = 1.63 � 10�21,
Fig. S1 (ESIw)). Although preliminary, these results raised the
possibility that the adduction of mRNA processing proteins
may serve as a general strategy to slow down gene expression
during stress recovery.
Activating transcription factor 2 (ATF2) is implicated in
transcriptional control of stress-responsive genes.44 Using a
yeast two-hybrid screen, the RUVBL2 product TBP-interacting
protein 49b (TIP49b), a component of the INO80 chromatin-
remodeling complex, was identified as an ATF2-interacting
protein.45 Forced expression of TIP49b increased TIP49b–
ATF2 association and efficiently attenuated ATF2 transcriptional
activities under normal growth conditions as well as after UV
treatment, ionizing radiation, or activation of p38 kinase.
Therefore, the interaction between ATF2 and TIP49b has
been proposed as a mechanism that serves to limit ATF2
transcriptional activities.45 Our results suggested that the
adduction of TIP49b by HNE may release ATF2 from TIP49b
and allow it to activate downstream gene expression in response to
HNE-induced stress. Consistently, ATF2 targets up-regulated
by HNE were enriched with genes involved in the regulation of
transcription and homeostatic process (Fig. 5B).
Besides CCNA2 and RUVBL2, possible regulatory
mechanisms associated with other predicted stress sensors
could also be inferred. For example, activation of heat shock
Fig. 5 Possible mechanisms for protein adduction mediated transcriptional regulation. (A) CCNA2 adduction-mediated repression of genes
related to DNA replication, cell cycle, and RNA splicing. (B) RUVBL2 adduction-mediated activation of genes related to regulation of
transcription and homeostatic process. mRNAs, transcription factors, and signaling proteins are represented by triangle, square, and round nodes,
respectively. Node color represents the log fold change at the mRNA level based on the microarray gene expression data, as indicated in the color
scale bar. Different types of interactions are represented by different edge styles, as indicated in the figure legend.
This journal is c The Royal Society of Chemistry 2011 Mol. BioSyst., 2011, 7, 2118–2127 2125
genes is a well-known response to HNE treatment.46 PPP2R1A,
the PR65 (A) subunit of protein phosphatase 2A has been
reported to interact with HSF2, an HSF family transcription
factor.47 HSF2 is physically associated with HSF1 under stress
conditions and the formation of heterocomplexes between
HSF1 and HSF2 results in enhanced activity to activate
the hsp70 promoter when compared with HSF1 or HSF2
homotrimers.48 It is possible that the modification of
PPP2R1A by HNE may release its interaction partner
HSF2, which forms heterocomplex with HSF1 to activate
down-stream gene expression in response to stress. Indeed,
HSF1 and HSF2 targets up-regulated by HNE were highly
significantly enriched with genes that are involved in response
to stimulus (p = 2.77 � 10�5). As another example, SF3A1
(subunit 1 of the splicing factor 3a, which is necessary for the
in vitro conversion of 15S U2 snRNP into an active 17S
particle that performs pre-mRNA splicing) physically interacts
with CDC5L.36 It is possible that the modification of SF3A1
by HNE may serve as a mechanism to allow CDC5L to move
from the RNA splicing role to the transcriptional regulation
role and activate downstream gene expression. To allow
biologists to explore the inferred HNE-responsive signaling
network for hypothesis generation, we have made the network
available in the eXtensible Graph Markup and Modeling
Language (XGMML) format (ESIw 1), which can be opened
in Cytoscape or other network visualization and analysis
tools.
In this study, the random walk-based inference of signaling
networks was developed for the analysis of protein adduction
data where only a small proportion of modified proteins were
expected to be involved in signaling.6,17 Therefore, protein
modification data were not used in the step of network
inference. However, this method can be easily extended to
accommodate other types of protein modification data that
are rich in signaling information, such as phosphoproteomics
data, by allowing the random walker to start from both
transcription factors and modified proteins. This will likely
increase the specificity of signaling network inference, which
was not ideal in our evaluation using only transcription factor
information, especially for the predictions based on the loose
cutoff level.
The performance of network inference is closely related to
the quality of the protein interaction networks, while the
current version of the protein interaction network undoubtedly
has many false positive and false negative interactions. To
evaluate the robustness of the RWR method against such
noise, we generated 1000 networks from the original network
by introducing 10% variations through edge switching and
compared the steady state scores for all nodes based on these
networks to those based on the original network. The scores
based on altered networks showed high correlation to those
based on the original network (average Pearson’s correlation
coefficient above 0.95), suggesting the robustness of the RWR
method. Although a binary protein interaction network was
used in this study, recent works suggest that it is beneficial to
include the reliability of the protein interactions in network
inference.9,14 The random walk-based approach can be extended
to incorporate this information by allowing the random
walker to transmit to its neighbors with the probability that
is proportional to corresponding interaction reliability.
Moreover, the interaction network used in this study was
context independent and included interactions that could
exist in various conditions. Better customization of the
protein interaction network based on protein expression and
co-expression data49 will help eliminate proteins and interactions
that are irrelevant to a specific context (e.g. cell line, disease
state, developmental stage, etc.).
The current analysis dichotomizes transcription factors into
responsive and non-responsive groups based on a statistical
cutoff, which may lead to the complete loss of information on
important transcription factors that do not make the cutoff. In
future studies, information on the reliability of transcription
factors and modified proteins can be integrated in the inference by
allowing the random walker to start from these nodes with
different probabilities.
Taking above considerations into account, we believe that
our method represents a general and flexible framework for
the inference of transcriptional and signaling regulatory
mechanisms through relating protein modification to gene
expression changes. Although most of the successful network
inference studies were carried out in yeast,9,12,14 our results
suggested that this type of analysis is also feasible in human
studies.
In summary, the random walk approach in combination
with the over-representation based transcription factor
identification allowed the inference of signaling networks from
microarray gene expression data, which in turn facilitated the
integration of protein adduction data to detect candidate
stress sensing proteins and mechanisms through which they
trigger observed gene expression changes. Proteins in the
inferred HNE-responsive signaling network significantly
overlapped with the curated DNA damage response network,
suggesting the biological relevance of our inference. The
inferred network was enriched with proteins involved in the
cell cycle and RNA splicing, signifying the importance of these
two processes in HNE response. Further integrative analysis
of the gene expression, protein adduction, protein–protein
interaction, and protein–DNA interaction data identified eight
candidate HNE sensing proteins and generated reasonable
hypotheses that related protein adduction to downstream gene
expression changes. Although developed for the analysis of
protein adduction data, our method represents a general and
flexible framework for the inference of transcriptional and
signaling regulatory mechanisms by integrating protein
modifications with gene expression changes.
Experimental
Data acquisition
The gene expression data were acquired from a previously
published study,8 in which microarray experiments were
conducted using RKO cells to explore transcriptional changes
induced following treatment for 6 or 24 h with 5, 20, or 60 mMHNE. We focused on the 6 h of 60 mM HNE treatment because
this is the most relevant to the protein adduction data set.
The protein adduction data were acquired from a previously
published study,6 in which RKO cells were exposed to 0, 50, or

2126 Mol. BioSyst., 2011, 7, 2118–2127 This journal is c The Royal Society of Chemistry 2011
100 mMHNE for 1 h and 417 proteins displaying a statistically
significant increase in adduction with increasing HNE
exposure concentration were identified as HNE targets.
Human protein interaction data were collected and integrated
from HPRD, MINT, intact, REACTOME, BioGRID, and DIP
in April 2010. Only experimentally determined interactions
supported by publications were considered to assure the reliability
of the network. The consolidated data set comprised 94146
interactions involving 11660 proteins.
Gene sets that contain genes that share a transcription
factor binding site were downloaded from the MsigDB
(http://www.broad.mit.edu/gsea/msigdb, version 2.5). The
gene sets were derived from a comparative analysis of the
human, mouse, rat and dog genomes31 and were organized by
transcription factor binding motifs. We further collected
known transcription factors for the binding motifs from
the Transfac database (http://www.gene-regulation.com,
professional version 12.1). Genes associated with different
binding motifs that correspond to a common transcription
factor were combined into one gene set. Gene sets associated
with binding motifs that have no known transcription factors
were not considered in this study. The final transcription
factor target gene sets contained 182 transcription factors
and 93 723 protein–DNA interactions.
The pathways curated by NCI-Nature were down-
loaded from the Pathway Commons database (http://www.
pathwaycommons.org/, the June 29, 2009 version), which included
127 pathways.
Differential gene expression analysis
Gene expression data from RKO cells with 6 h of 60 mMHNE
treatment were compared to those from the DMSO controls.
Each group consisted of three replicates. cel files from the six
chips were normalized using the Robust MultiChip Analysis
(RMA) algorithm50 as implemented in Bioconductor.51 Probe
set identifiers (IDs) were mapped to gene symbols based on the
mapping provided by the Gene Expression Omnibus (GEO)
database. Probe sets that mapped to multiple genes were
eliminated. When multiple probe sets were mapped to the
same gene, the median was calculated to represent the gene
expression level. Because there were only three replicates in
each group, the moderated t-test in the limma package52 was
used to identify differentially expressed genes between the two
groups. The moderated t-test uses an empirical Bayes method
to moderate the standard errors of the estimated log-fold
changes. This results in more stable inference and improved
power, especially for experiments with small number of arrays.
To account for multiple comparisons, False Discovery Rates
(FDRs) were further calculated based on p-values generated
from the moderated t-test using the Benjamini and Hochberg
correction.53 An FDR of 0.01 was used to select differentially
expressed genes.
Transcription factor inference
Following Rhodes et al.,21 we used the hypergeometric test to
evaluate the over-representation of the up- or down-regulated
genes in different transcription factor target gene sets. FDRs
were calculated based on p-values generated from the
hypergeometric test using the Benjamini andHochberg correction.
An FDR of 0.01 was used to select significant transcription factor
target gene sets and identify responsive transcription factors.
Random walk analysis
The random walk analysis was adapted from Kohler et al.24
The random walk technique exploits the global structure of a
network (graph) by simulating the behavior of a random
walker on a graph. From a starting node, the walker selects
a neighbor of it at random and moves to the neighboring node.
Then the walker selects a neighbor of this node at random and
moves to it, so on and so forth. The sequence of nodes selected
this way is a random walk on the graph.54 In a variant of the
random walk, the walker may also choose to teleport to the
start node with a certain probability, called restart probability.
The restart probability enforces a restriction on how far we
want the random walker to get away from the start node.
Random walk with restart (RWR) is formally defined as the
following equation:
pt+1 = (1 � r)Wpt + rp0
where r is the restart probability, W is the column-normalized
adjacency matrix of the graph, and pt is a vector of size equal
to the number of nodes in the graph where the i-th element
holds the probability of being at node i at time step t.
In this study, we modeled a protein–protein interaction
network with n proteins by an undirected graph and represent
it as an n � n binary adjacency matrix, where rows and
columns correspond to proteins and a value of 1 at the
position (i, j) indicates that the proteins i and j interact. Each
column in the matrix was further divided by its sum to
generate the column-normalized adjacency matrix W. The
initial vector p0 of size n was constructed such that an equal
probability of 1/k was assigned to the k nodes representing
transcription factors of interest, while a probability of 0 was
given to all other n–k nodes in the network. The final score of a
protein in the network was defined as the steady-state probability
that the random walker would stay at the node, which was solved
by iterating the equation until convergence. Specifically, the
iteration was continued untilPn
i¼1jptþ1i � pti j (i.e., the L1-norm of
the difference between pt and pt+1) fell below the predefined
threshold of 10�6.
To assess the statistical significance of the scores, we let the
random walker start from the same number of randomly selected
transcription factors to calculate random scores for each node.
This process is repeated to generate multiple (1000 in this study)
sets of random scores. Then, for each node, a local p value is
estimated by comparing the real score to random scores from the
same node, and a global p value is estimated by comparing the real
score to random scores from all nodes.
The software was developed in C++ on the GNU/Linux
operating system with support for multithreading. It can be
downloaded from http://bioinfo.vanderbilt.edu/netwalker.
Gene ontology and WikiPathways enrichment analysis
Gene Ontology and WikiPathways enrichment analysis were
performed using WebGestalt32 (http://bioinfo.vanderbilt.edu/
webgestalt).
This journal is c The Royal Society of Chemistry 2011 Mol. BioSyst., 2011, 7, 2118–2127 2127
Network visualization
Networks were visualized using Cytoscape.55
Acknowledgements
We acknowledge Dr Lily Wang for critical reading of the
manuscript. This work was supported by the National
Institutes of Health (NIH)/National Institute of General
Medical Sciences (NIGMS) through grant R01 GM088822
and NIH/National Institute of Environmental Health Sciences
(NIEHS) through grants P30 ES000267 and P01 ES013125.
This work was conducted in part using the resources of the
Advanced Computing Center for Research and Education at
Vanderbilt University, Nashville, TN.
References
1 D. C. Liebler, Chem. Res. Toxicol., 2008, 21, 117–128.2 C. Ji, K. R. Kozak and L. J. Marnett, J. Biol. Chem., 2001, 276,18223–18228.
3 A. Rossi, P. Kapahi, G. Natoli, T. Takahashi, Y. Chen, M. Karinand M. G. Santoro, Nature, 2000, 403, 103–108.
4 T. W. Kensler, N. Wakabayashi and S. Biswal, Annu. Rev.Pharmacol., 2007, 47, 89–116.
5 A. T. Jacobs and L. J. Marnett, Acc. Chem. Res., 2010, 43,673–683.
6 S. G. Codreanu, B. Zhang, S. M. Sobecki, D. D. Billheimer andD. C. Liebler, Mol. Cell. Proteomics, 2009, 8, 670–680.
7 A. Vila, K. A. Tallman, A. T. Jacobs, D. C. Liebler, N. A. Porterand L. J. Marnett, Chem. Res. Toxicol., 2008, 21, 432–444.
8 J. D. West and L. J. Marnett, Chem. Res. Toxicol., 2005, 18,1642–1653.
9 S. S. Huang and E. Fraenkel, Sci. Signaling, 2009, 2, ra40.10 T. Ideker, O. Ozier, B. Schwikowski and A. F. Siegel, Bioinformatics,
2002, 18(suppl 1), S233–240.11 M. S. Scott, T. Perkins, S. Bunnell, F. Pepin, D. Y. Thomas and
M. Hallett, Mol. Cell. Proteomics, 2005, 4, 683–692.12 C. T. Workman, H. C. Mak, S. McCuine, J. B. Tagne,
M. Agarwal, O. Ozier, T. J. Begley, L. D. Samson and T. Ideker,Science, 2006, 312, 1054–1059.
13 C. H. Yeang, T. Ideker and T. Jaakkola, J. Comput. Biol., 2004, 11,243–262.
14 E. Yeger-Lotem, L. Riva, L. J. Su, A. D. Gitler, A. G. Cashikar,O. D. King, P. K. Auluck, M. L. Geddie, J. S. Valastyan,D. R. Karger, S. Lindquist and E. Fraenkel, Nat. Genet., 2009,41, 316–323.
15 A. T. Jacobs and L. J. Marnett, J. Biol. Chem., 2007, 282,33412–33420.
16 F. Hong, K. R. Sekhar, M. L. Freeman and D. C. Liebler, J. Biol.Chem., 2005, 280, 31768–31775.
17 M. K. Dennehy, K. A. Richards, G. R. Wernke, Y. Shyr andD. C. Liebler, Chem. Res. Toxicol., 2006, 19, 20–29.
18 K. D. Bromberg, A. Ma’ayan, S. R. Neves and R. Iyengar, Science,2008, 320, 903–909.
19 R. Elkon, C. Linhart, R. Sharan, R. Shamir and Y. Shiloh,Genome Res., 2003, 13, 773–780.
20 S. J. Ho Sui, J. R. Mortimer, D. J. Arenillas, J. Brumm,C. J. Walsh, B. P. Kennedy and W. W. Wasserman, Nucleic AcidsRes., 2005, 33, 3154–3164.
21 D. R. Rhodes, S. Kalyana-Sundaram, V. Mahavisno,T. R. Barrette, D. Ghosh and A. M. Chinnaiyan, Nat. Genet.,2005, 37, 579–583.
22 Z. Shi, C. K. Derow and B. Zhang, BMC Syst. Biol., 2010, 4, 74.23 T. Can, O. Camoglu and A. K. Singh, Proceedings of the 5th
international workshop on bioinformatics, 2005.24 S. Kohler, S. Bauer, D. Horn and P. N. Robinson, Am. J. Hum.
Genet., 2008, 82, 949–958.
25 H. Tong, C. Faloutsos and J. Y. Pan, ICDM ’06: Proceedings ofthe Sixth International Conference on Data Mining, 2006.
26 Y. Liu and M. Ringner, Genome Biol., 2007, 8, R77.27 V. M. Fazio, G. Barrera, S. Martinotti, M. G. Farace, B. Giglioni,
L. Frati, V. Manzari and M. U. Dianzani, Cancer Res., 1992, 52,4866–4871.
28 H. Zhang, H. Liu, K. E. Iles, R. M. Liu, E. M. Postlethwait,Y. Laperche and H. J. Forman, Am. J. Respir. Cell Mol. Biol.,2006, 34, 174–181.
29 Q. Shi, F. Vaillancourt, V. Cote, H. Fahmi, P. Lavigne, H. Afif,J. A. Di Battista, J. C. Fernandes and M. Benderdour, ArthritisRes. Ther., 2006, 8, R159.
30 G. Barrera, S. Pizzimenti and M. U. Dianzani, Free Radical Biol.Med., 2004, 37, 597–606.
31 X. Xie, J. Lu, E. J. Kulbokas, T. R. Golub, V. Mootha,K. Lindblad-Toh, E. S. Lander and M. Kellis, Nature, 2005, 434,338–345.
32 B. Zhang, S. Kirov and J. Snoddy, Nucleic Acids Res., 2005, 33,W741–W748.
33 W. Wonisch, S. D. Kohlwein, J. Schaur, F. Tatzber,H. Guttenberger, N. Zarkovic, R. Winkler and H. Esterbauer,Free Radical Biol. Med., 1998, 25, 682–687.
34 G. Biamonti and J. F. Caceres, Trends Biochem. Sci., 2009, 34,146–153.
35 H. S. Bernstein and S. R. Coughlin, J. Biol. Chem., 1998, 273,4666–4671.
36 P. Ajuh, B. Kuster, K. Panov, J. C. Zomerdijk, M. Mann andA. I. Lamond, EMBO J., 2000, 19, 6569–6581.
37 A. R. Pico, T. Kelder, M. P. van Iersel, K. Hanspers, B. R. Conklinand C. Evelo, PLoS Biol., 2008, 6, e184.
38 M. Pagano, R. Pepperkok, F. Verde, W. Ansorge and G. Draetta,EMBO J., 1992, 11, 961–971.
39 J. Bartek, J. Bartkova and J. Lukas, Curr. Opin. Cell Biol., 1996, 8,805–814.
40 D. Resnitzky, L. Hengst and S. I. Reed, Mol. Cell. Biol., 1995, 15,4347–4352.
41 S. P. Chellappan, S. Hiebert, M. Mudryj, J. M. Horowitz andJ. R. Nevins, Cell (Cambridge, Mass.), 1991, 65, 1053–1061.
42 B. Henglein, X. Chenivesse, J. Wang, D. Eick and C. Brechot,Proc. Natl. Acad. Sci. U. S. A., 1994, 91, 5490–5494.
43 J. DeGregori, T. Kowalik and J. R. Nevins, Mol. Cell. Biol., 1995,15, 4215–4224.
44 J. Hayakawa, S. Mittal, Y. Wang, K. S. Korkmaz, E. Adamson,C. English, M. Ohmichi, M. McClelland and D. Mercola, Mol.Cell, 2004, 16, 521–535.
45 S. G. Cho, A. Bhoumik, L. Broday, V. Ivanov, B. Rosenstein andZ. Ronai, Mol. Cell. Biol., 2001, 21, 8398–8413.
46 J. D. West and L. J. Marnett, Chem. Res. Toxicol., 2006, 19,173–194.
47 Y. Hong and K. D. Sarge, J. Biol. Chem., 1999, 274,12967–12970.
48 H. He, F. Soncin, N. Grammatikakis, Y. Li, A. Siganou, J. Gong,S. A. Brown, R. E. Kingston and S. K. Calderwood, J. Biol.Chem., 2003, 278, 35465–35475.
49 J. Li, L. J. Zimmerman, B. H. Park, D. L. Tabb, D. C. Liebler andB. Zhang, Mol. Syst. Biol., 2009, 5, 303.
50 R. A. Irizarry, B. Hobbs, F. Collin, Y. D. Beazer-Barclay,K. J. Antonellis, U. Scherf and T. P. Speed, Biostatistics, 2003,4, 249–264.
51 M. Reimers and V. J. Carey, Methods Enzymol., 2006, 411,119–134.
52 G. K. Smyth, in Bioinformatics and Computational BiologySolutions using R and Bioconductor, ed. R. Gentleman,V. J. Carey, W. Huber, R. A. Irizarry and S. Dudoit, Springer,New York, 2005, pp. 397–420.
53 Y. Benjamini and Y. Hochberg, J. R. Stat. Soc. Ser. B(Methodological), 1995, 57, 289–300.
54 L. Lovasz, Combinatorics, Paul Erdos Is Eighty, Keszthely,Hungary, 1993, vol. 2, pp. 1–46.
55 P. Shannon, A. Markiel, O. Ozier, N. S. Baliga, J. T. Wang,D. Ramage, N. Amin, B. Schwikowski and T. Ideker, GenomeRes., 2003, 13, 2498–2504.