Embed Size (px)
Citation preview
VOLUME 40 NUMBER 3 SPRING 2014www.iijpm.com
The Voices of Influence | iijournals.com
JPM-Cover.indd 1 15/04/14 10:13 PM
THE JOURNAL OF PORTFOLIO MANAGEMENT SPRING 2014
Exploring Macroeconomic Sensitivities: How Investments Respond to Different Economic EnvironmentsANTTI ILMANEN, THOMAS MALONEY, AND ADRIENNE ROSS
ANTTI ILMANEN
is a principal of AQR Capital Management in London, [email protected]
THOMAS MALONEY
is a vice president of AQR Capital Management in London, [email protected]
ADRIENNE ROSS
is an associate at AQR Capital Management in Greenwich, [email protected]
A growing number of investors have come to view their portfolios as a collection of exposures to risk factors. “Risk-based investing”
can mean different things to different inves-tors, but the common feature is the emphasis on improved risk diversification. Although many investors identify risks primarily as asset class exposures, others may look at underlying macroeconomic exposures, such as inf lation sensitivity. The difficulty with the latter approach is that macroeconomic factors are not directly investable.
With this in mind, we provide a framework for investors to think about how investable return sources tend to relate to non-investable macro factors. We present empirical evidence on the sensitivity of investments (traditional long-only asset class premia and alternative long/short style premia)1 to macro risks (such as eco-nomic growth and inf lation).2 We begin by describing the key macroeconomic dimen-sions we study and the indicators we use to represent them. We follow earlier research in focusing on growth and inf lation dimensions and explore them with U.S. data,3 but later analyze three other dimensions: real yield, volatility, and liquidity. Such macro map-ping results can be presented through various lenses. Here, we focus on the variation of Sharpe ratios across different environments, providing some complementary correlation
and cumulative return results in an appendix. We provide evidence that style premia are less sensitive than are asset-class premia to macro-economic environments, and that diversified composites are more resilient than are a single asset class or single style portfolio.
Before we describe our approach in detail, we must stress the limitations of this type of analysis. Any empirical result is to some degree specif ic to the sample period (here, 1972 to 2013), as well as dependent on design choices. Moreover, if investors want to use environmental analysis for tactical timing decisions, they must be right in both their estimates of their investments’ sensitivities to the macro environment and their forecasts of the future macro environment itself. We believe a more valuable application is in con-structing well-diversified portfolios that may better withstand unexpected macro shocks.
WHICH MACRO ENVIRONMENTS MATTER?
One can debate the most important macroeconomic dimensions to study, but conventional wisdom suggests that eco-nomic growth and inf lation have the largest effects on investment returns. We agree and begin with these two; but we also study three other environments that can be challenging for many investments: real yields, volatility, and illiquidity. Data
JPM-ILMANEN.indd 87JPM-ILMANEN.indd 87 4/15/14 10:01:38 PM4/15/14 10:01:38 PM
EXPLORING MACROECONOMIC SENSITIVITIES: HOW INVESTMENTS RESPOND TO DIFFERENT ECONOMIC ENVIRONMENTS SPRING 2014
limitations restrict us to using U.S. macro indicators (we go back over 40 years), even though we study global asset returns and style premia. In practice, this may not matter much, because of the dominant role that the U.S. economy has on market trends. The U.S. has covered roughly half of the global capital market size in recent decades, and its economic developments empirically have inf luenced other countries. (“When the U.S. sneezes, the rest of the world catches a cold,” as the saying goes).
Numerous design decisions are required when con-structing macroeconomic indicators, with each choice having its pros and cons. For example, economic growth can be measured by asset-market data, such as the rela-tive performance of procyclic industries or commodities, or even just by using equity market returns as the growth indicator. However, the resulting high correlations and explanatory power would merely ref lect the closeness of the dependent and explanatory variables. (Is it inter-esting to explain U.S. stock market performance by a factor based on Canadian equity returns?) In an effort to capture more fundamental relations between finan-cial markets and underlying macro conditions, we elect to use macroeconomic data. This choice has its own problems, notably in timing, as macroeconomic data are backward looking, published with lags and subject to data revisions, while asset prices are forward looking.4 We can mitigate the impact of publication lags and the mismatch between backward- and forward-looking per-spectives by using longer windows. Thus, we use con-temporaneous annual economic data and asset returns throughout our analysis (with quarterly overlapping observations).
Our macro indicators, or macro factors, are shown in Exhibit 1. Each is a composite of two series, which are f irst normalized to z-scores by subtracting a his-torical mean from each observation and dividing by a historical volatility. Because there is no uniquely cor-rect way to capture any risk factor, averaging may make the results more robust and signals humility. For the real yield, volatility, and illiquidity indicators, we used both the level and change within each of the two sub-series. The series within each indicator are as follows:
• Growth: Chicago Fed National Activity Index and “surprise” in U.S. industrial production growth.5
• Inflation: Year-on-year inf lation rate and “surprise” in the U.S. Consumer Price Index.6
• Real Yields: Real long-term bond yield (subtracting a survey-based forecast of long-term inf lation from the 10-year Treasury yield) and real short-term rate (subtracting a survey-based forecast of next-year inf lation from the three-month Treasury bill rate).
• Volatility: Stock and bond market volatility based on daily returns of the S&P 500 and 10-year Trea-suries over the past year.
• Illiquidity: TED spread in money markets and a well-established price impact measure in equity markets.7
Even when we normalize the indicators to have a zero mean, our growth indicator is more often posi-tive, balanced by sharp negative troughs that corre-spond to recessions (1974, 1980, 1981, 1990, 2001, and 2008). In contrast, other macro indicators are more often negative (below average) and experience occa-sional sharp upward spikes. We therefore classify “up” and “down” environments for each macro indicator by comparing the estimated value to the median. This ensures an equal number of observations in the two environments.
HOW DO INVESTMENTS PERFORM ACROSS GROWTH AND INFLATION ENVIRONMENTS?
Investors have a range of portfolio building blocks to choose from. We focus on three traditional asset-class premia:
• Global stocks (MSCI World index in U.S. dollars).• Global bonds (a GDP-weighted composite of six
10-year government bonds).• Commodities (an equal dollar-weighted composite
of 24 commodities).
We also consider five simulated long/short style premia composites:
• Value (buy assets that are cheap relative to funda-mental value, short expensive assets).
• Momentum (buy assets that recently outperformed peers, short those that recently lagged).
• Carry (buy high-yielding assets, short low-yielding assets).
JPM-ILMANEN.indd 88JPM-ILMANEN.indd 88 4/15/14 10:01:38 PM4/15/14 10:01:38 PM

THE JOURNAL OF PORTFOLIO MANAGEMENT SPRING 2014
• Defensive (buy low-risk, high-quality assets, short more speculative assets).
• Trend-Following (buy assets with recent price rises, short assets with recent price falls).8
The market-neutral style premia series are more difficult to compile, especially because we apply these premia in numerous asset classes: stock selection; industry allocation; country allocation in equity, fixed-income, and currency markets; and commodities. Each of our four broad style composites is an equally weighted combination of stock selection and asset allocation. All four are scaled to target 10% annual volatility, and we subtract no trading costs or fees.9
In addition to four market-neutral style premia, we include the market-directional trend style, which applies 12-month trend-following strategies in four major asset classes. While the style is nearly uncorrelated with equity markets in the long run, at any point in time it can be directionally long or short.10
Exhibit 2 uses our macro indicators to classify time periods as binary “up” or “down” environments, so that we can compare Sharpe ratios in growth and inf lation environments independently (two pairs of bars in the middle), and then the interaction of the two (four bars to the right). For visual comparability, we use the same scale for each investment’s y-axis. In general, sensitivity to macro environments is shown by the variation in the size of the bars along each row (i.e., across different environments).
The most general finding is that these asset classes are more sensitive to macro risks than are style premia (bars vary as we move from left to right). The top three charts show that each asset class has a clear preference for a particular environment. Specifically, equities have favored growth; bonds, disinf lation; and commodities, inf lation. When we look at combinations of growth and inf lation, the patterns are even more pronounced; equities are hurt most when inf lation is up and growth is down, while bonds are hurt most when growth and inf lation are up. We can also see that global bonds and commodi-ties have exhibited particularly opposite growth-inf la-tion exposures, which makes sense given commodities’ inf lation-hedging properties and bonds’ recessionary protection. And it is not surprising that the notoriously difficult combination of a growth-down, inf lation-up (stagf lationary) environment is particularly unfavorable, with commodities being the least-bad option.
E X H I B I T 1Macroeconomic Indicators, 1972–2013
Source: AQR. The analysis covers the period through H1 2013.
JPM-ILMANEN.indd 89JPM-ILMANEN.indd 89 4/15/14 10:01:38 PM4/15/14 10:01:38 PM

EXPLORING MACROECONOMIC SENSITIVITIES: HOW INVESTMENTS RESPOND TO DIFFERENT ECONOMIC ENVIRONMENTS SPRING 2014
E X H I B I T 2Hypothetical Sharpe Ratios in Growth and Inflation Environments, 1972–2013
Source: AQR. All returns are gross of transaction costs and fees.
JPM-ILMANEN.indd 90JPM-ILMANEN.indd 90 4/15/14 10:01:39 PM4/15/14 10:01:39 PM
THE JOURNAL OF PORTFOLIO MANAGEMENT SPRING 2014
Institutional portfolios, which are often dominated by equity market risk, are likely to exhibit sensitivi-ties similar to those reported for equities—specifically, that performance suffers (and may be negative) when growth is down and inf lation is up. But investors who increase allocations to bonds and commodities can achieve more balanced risk exposures. This approach may provide more effective diversification across major economic risk factors—an outcome sought by risk parity investors.
Investors who look beyond traditional asset classes may be able to achieve even better risk diversification, because style premia exhibit more consistent perfor-mance across various environments. Although these long/short styles have a long history in academia, they are rarely explicitly represented in institutional portfo-lios. We argue that they deserve a place; the five style premia delivered positive Sharpe ratios in all growth and inf lation environments (consistent bars as we move from left to right in Exhibit 2).
There is some variation. “Value” and “carry” strat-egies seem to share bond-like tendencies, excelling in growth-down, inf lation-down environments. Con-versely, “momentum” seems to share commodities’ pref-erence for upward scenarios, doing better when growth and inf lation are up. However, these preferences are weaker for styles and are not statistically significant.11 Put differently, we do not find persuasive evidence to suggest that style premia can be expected to perform differently across growth and inf lation environments. These results have been consistent over time.12
Our focus is on Sharpe ratio differences within each investment, rather than absolute performance com-parisons across different investments. The style premia have higher Sharpe ratios than the asset-class premia, partly because the former have lower correlations across constituents (better diversification), but also because we are not adjusting for trading costs and fees.
It also bears repeating that these results might be specific to this sample or to our specifications of these style premia and macro environments. For example, macro-factor sensitivities could be more significant in long-only style-tilted portfolios, which can be highly market directional. Even long/short style premia can be more market directional in certain asset classes than in the broadly diversified style composites we analyze here; currency carry is a prominent example.
BEYOND GROWTH AND INFLATION
While growth and inf lation may be the most important macro dimensions, they are not the only ones. We now turn to three others: real yield, volatility, and liquidity conditions.13
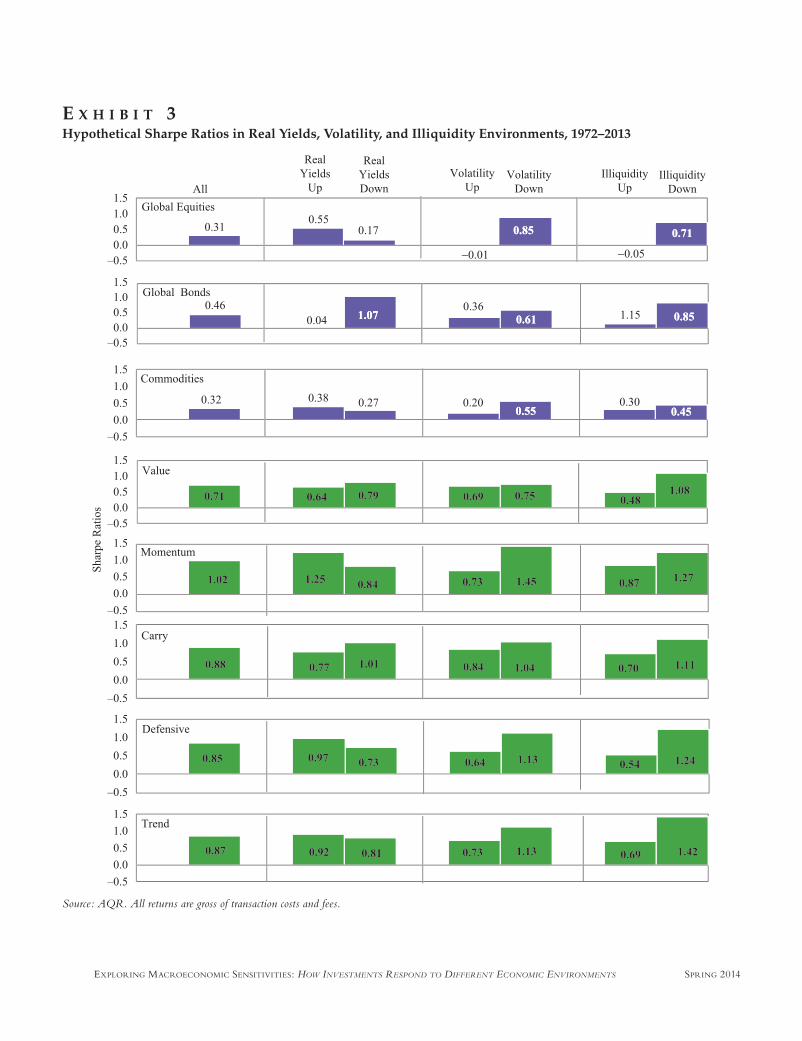
Exhibit 3 extends the previous analysis, showing Sharpe ratio variations across these three additional risk factors. The first three rows suggest that equities are particularly sensitive to volatile environments, while bonds suffer when real yields rise (no surprises there). Commodities’ performance is relatively robust across real yield, volatility, and illiquidity environments. This could be because commodities are a heterogeneous asset class, and here we are using an equally weighted (diver-sified) portfolio.
With regard to style premia, “momentum” appears to have experienced the greatest sensitivity to these macro risks. It tends to underperform when volatility is up, versus when volatility is down; high volatility may coincide with f lights to quality, followed by junk rallies that can hurt momentum strategies. “Value” seems to be the most resilient to real yield changes and volatile environments but still has demonstrated some sensitivity to illiquidity. Even so, the Sharpe ratios for all styles are positive, regardless of the macro environment.
Across the board, asset and style investments both seem to favor lower volatility and more-liquid environ-ments over volatile, illiquid ones. But when it comes to growth, inf lation, and real yields, style premia seems to have the clear advantage: they have exhibited more resilient performance, lower macroeconomic sensitivi-ties, and arguably more alpha-like behavior.
APPLICATIONS FOR PORTFOLIO CONSTRUCTION
Our previous results imply that a portfolio domi-nated by a single asset or strategy is more likely to be susceptible to macro conditions and that combining investments may be an effective way to reduce macro risk exposures. To assess this, we construct three simple portfolios: a global 60/40 stock/bond port-folio, a naïve global risk parity portfolio,14 and a simple, equally weighted hypothetical style portfolio of value, momentum, carry, defensive, and trend-following strat-egies (“style-5”).
JPM-ILMANEN.indd 91JPM-ILMANEN.indd 91 4/15/14 10:01:40 PM4/15/14 10:01:40 PM
EXPLORING MACROECONOMIC SENSITIVITIES: HOW INVESTMENTS RESPOND TO DIFFERENT ECONOMIC ENVIRONMENTS SPRING 2014
E X H I B I T 3Hypothetical Sharpe Ratios in Real Yields, Volatility, and Illiquidity Environments, 1972–2013
Source: AQR. All returns are gross of transaction costs and fees.
JPM-ILMANEN.indd 92JPM-ILMANEN.indd 92 4/15/14 10:01:40 PM4/15/14 10:01:40 PM

THE JOURNAL OF PORTFOLIO MANAGEMENT SPRING 2014
We examine variations in Sharpe ratios for these three portfolios. As noted earlier, the comparisons of the Sharpe ratio levels across portfolios can be misleading, as the inclusion of transaction costs and fees would have a sizable effect on performance for the style composite.15 Instead we focus on comparisons across environments for each portfolio of asset classes or styles. Exhibit 4 high-lights these sensitivities and provides further evidence on the potential benefits of building a well-diversified portfolio.
Diversification Benefits Across Asset Classes
The global 60/40 portfolio displays the greatest variation across the bars, suffering the most in a “growth down” and “inf lation up” environment. These results are intuitive, given the portfolio’s concentrated equity risk. The advantage of broader risk diversification can be seen here, with the risk parity portfolio providing higher risk-adjusted returns in adverse market condi-tions, lagging 60/40 only in the benign “growth up,” “inf lation down” environment. When real yields are down, volatility is up, or liquidity is tight, the more bal-anced risk exposures in risk parity tend to hold up better than does the 60/40 portfolio. Interestingly, the two portfolios achieve similar Sharpe ratios in “real yields up” environments over this sample.
Diversification Benefits Across Style Premia
Combining multiple long/short styles can pro-vide even greater diversif ication benefits. (Value and momentum in particular are negatively correlated, and so diversify aggressively). Indeed, the style-5 portfolio bars are virtually even across environments. Put dif-ferently, average performance is impressively stable if growth is up or down, inf lation is up or down, or any combination thereof. The same can be said of real yield environments, though the portfolio does have some sen-sitivity to volatility and illiquidity.
These results are consistent with our intuition that the least-diversif ied portfolio (in this case, the 60/40 portfolio) would exhibit the highest sensitivity to adverse macro conditions. It also makes sense that even a well-
diversified long/short portfolio (such as a style-5 port-folio) would favor liquid market conditions and remain vulnerable to liquidation environments.16
CONCLUSION
Understanding how investable return sources relate to different macro risks can provide a valuable, additional perspective when building a portfolio. We think the following key findings are useful for investors seeking to build a more robust portfolio:
• Certain environments are particularly challenging. Adverse growth conditions hurt many investments, but when slow growth coincides with high or rising inf lation, real yields, volatility, or illiquidity, it is difficult to find any asset class or style pre-mium that has matched or exceeded its long-run performance.
• Major asset classes have different sensitivities to macro environments. Among the most robust rela-tions are the opposite sensitivities of stocks and bonds to growth, as well as the opposite sensitivi-ties of commodities and bonds to inf lation. We believe that investors seeking effective diversifica-tion should try to balance these exposures in their long-only portfolios.
• Long/short-style premia generally have smaller macro risk exposures, which can make them valu-able diversifiers. Over the full period we analyze, we saw that all styles are profitable in both up and down environments for all five of our macro fac-tors. We did not observe this phenomenon in asset classes.
• Diversif ication across investments may further reduce macro sensitivities. Portfolios that capitalize on opposite macro exposures can be more robust across environments. Yet these portfolios are not completely independent of macro risk factors. For example, most portfolios fared better in stable and liquid market environments.
The relationships we document here are not pre-dictive and thus are less useful for tactical decisions than for strategic ones. For example, while our analysis may help investors build diversified portfolios that are less
JPM-ILMANEN.indd 93JPM-ILMANEN.indd 93 4/15/14 10:01:40 PM4/15/14 10:01:40 PM

EXPLORING MACROECONOMIC SENSITIVITIES: HOW INVESTMENTS RESPOND TO DIFFERENT ECONOMIC ENVIRONMENTS SPRING 2014
E X H I B I T 4Hypothetical Portfolio Sharpe Ratios in Growth, Inflation, Real Yields, Volatility, and Illiquidity Environments, 1972–2013
Source: AQR. All returns are gross of transaction costs and fees.
JPM-ILMANEN.indd 94JPM-ILMANEN.indd 94 4/15/14 10:01:40 PM4/15/14 10:01:40 PM
THE JOURNAL OF PORTFOLIO MANAGEMENT SPRING 2014
prone to underperformance in different macroeconomic environments, predicting those environments remains a challenge.
Despite these caveats,17 we believe these findings are valuable for investors. Since investors cannot be cer-tain of the future economic environment, they should try to prepare their portfolios for any eventuality. Just as a portfolio’s performance can be made more robust through better risk diversif ication across investable return sources, we believe it can also be improved by more balanced macro exposures.18 This complementary macro perspective to portfolio diversification can help investors enjoy an even better free lunch.
A P P E N D I X
Here we present three additional perspectives on the analysis: simple correlations, bivariate partial correlations, and cumulative returns in “up” versus “down” environments.
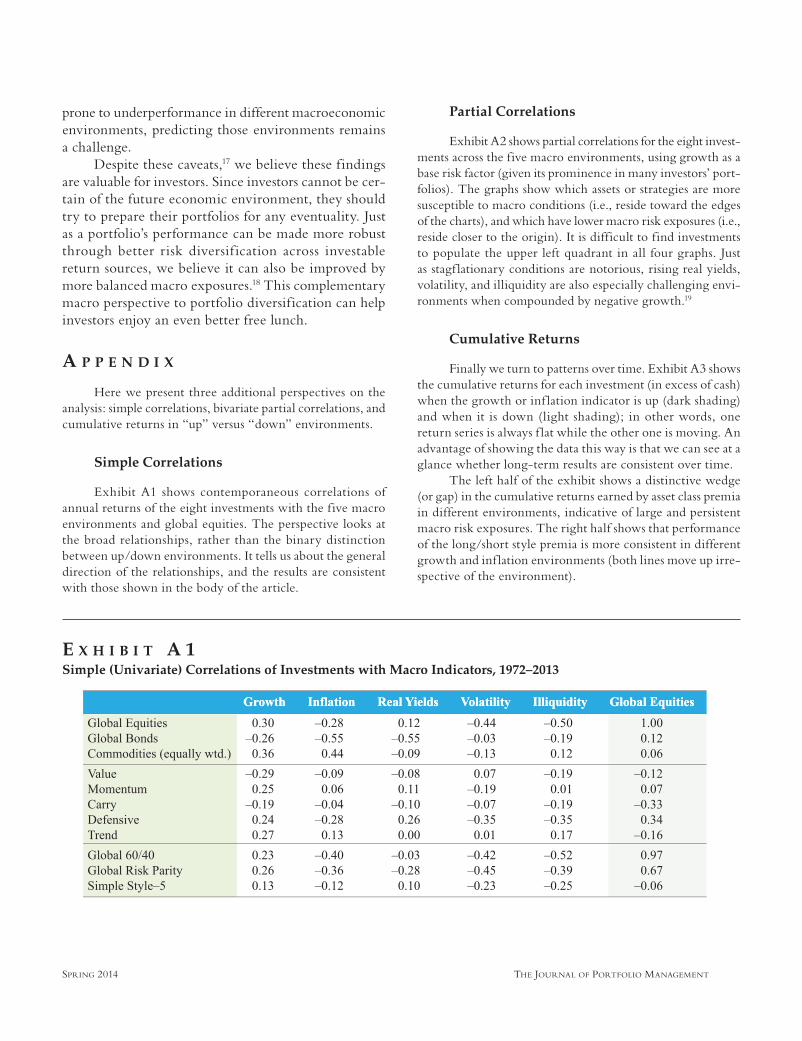
Simple Correlations
Exhibit A1 shows contemporaneous correlations of annual returns of the eight investments with the five macro environments and global equities. The perspective looks at the broad relationships, rather than the binary distinction between up/down environments. It tells us about the general direction of the relationships, and the results are consistent with those shown in the body of the article.
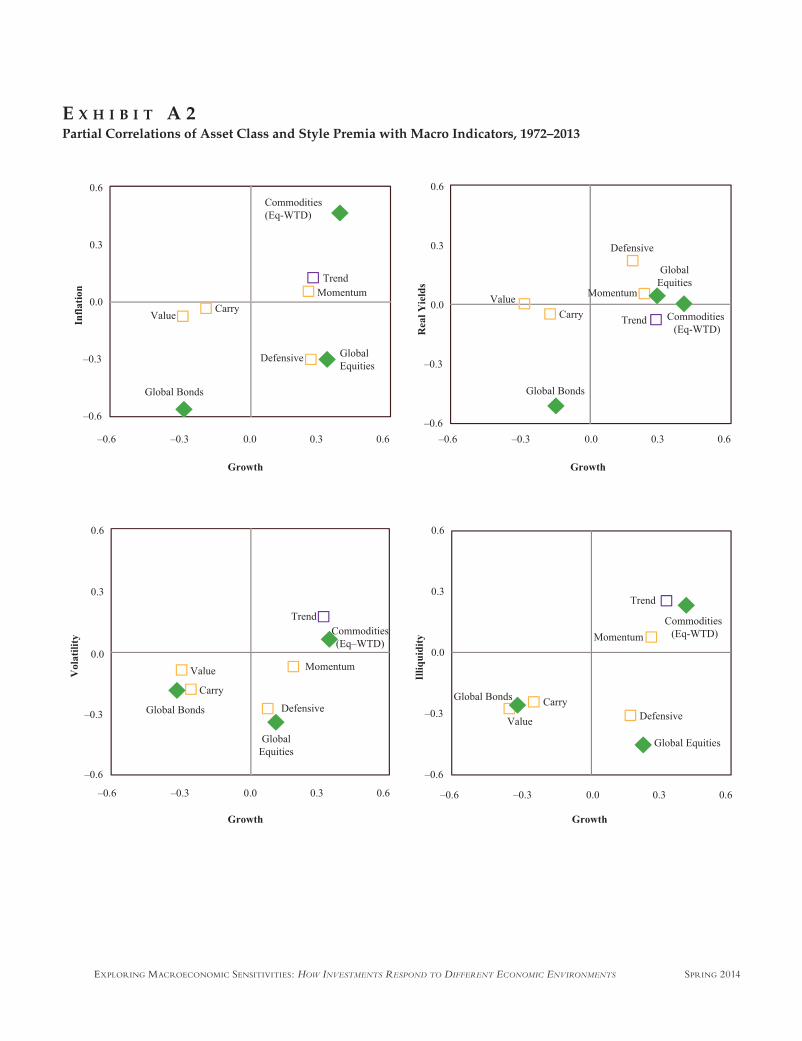
Partial Correlations
Exhibit A2 shows partial correlations for the eight invest-ments across the five macro environments, using growth as a base risk factor (given its prominence in many investors’ port-folios). The graphs show which assets or strategies are more susceptible to macro conditions (i.e., reside toward the edges of the charts), and which have lower macro risk exposures (i.e., reside closer to the origin). It is difficult to find investments to populate the upper left quadrant in all four graphs. Just as stagf lationary conditions are notorious, rising real yields, volatility, and illiquidity are also especially challenging envi-ronments when compounded by negative growth.19
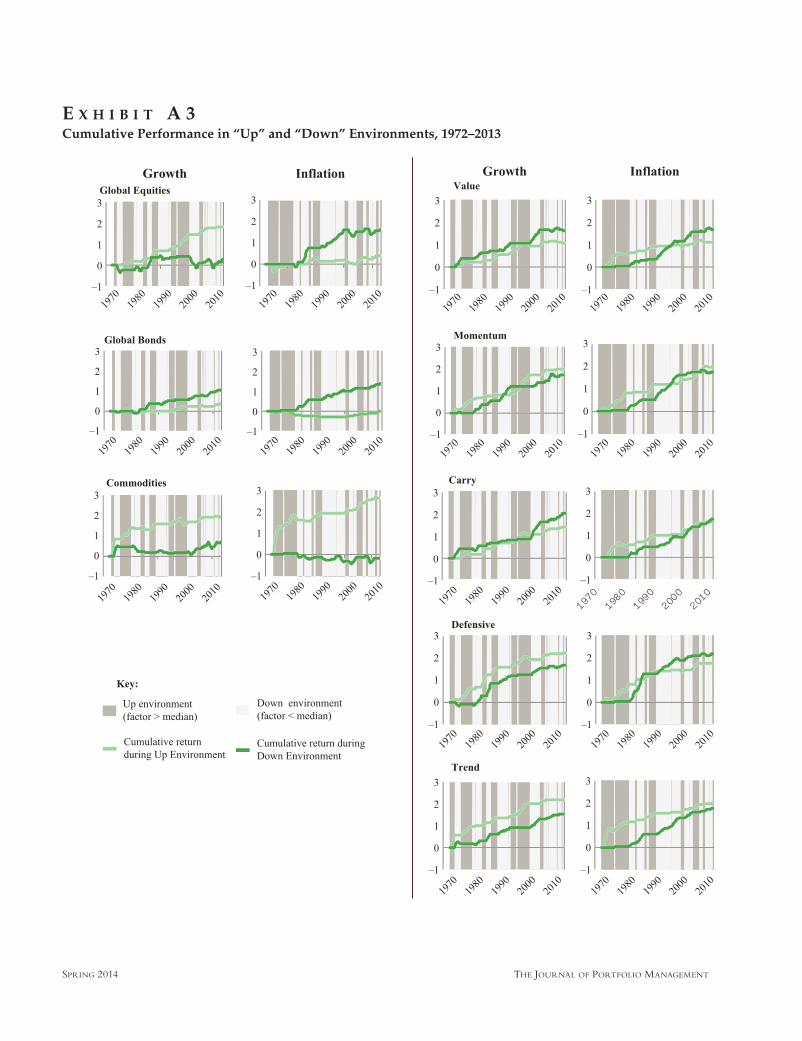
Cumulative Returns
Finally we turn to patterns over time. Exhibit A3 shows the cumulative returns for each investment (in excess of cash) when the growth or inf lation indicator is up (dark shading) and when it is down (light shading); in other words, one return series is always f lat while the other one is moving. An advantage of showing the data this way is that we can see at a glance whether long-term results are consistent over time.
The left half of the exhibit shows a distinctive wedge (or gap) in the cumulative returns earned by asset class premia in different environments, indicative of large and persistent macro risk exposures. The right half shows that performance of the long/short style premia is more consistent in different growth and inf lation environments (both lines move up irre-spective of the environment).
E X H I B I T A 1Simple (Univariate) Correlations of Investments with Macro Indicators, 1972–2013
JPM-ILMANEN.indd 95JPM-ILMANEN.indd 95 4/15/14 10:01:41 PM4/15/14 10:01:41 PM
EXPLORING MACROECONOMIC SENSITIVITIES: HOW INVESTMENTS RESPOND TO DIFFERENT ECONOMIC ENVIRONMENTS SPRING 2014
E X H I B I T A 2Partial Correlations of Asset Class and Style Premia with Macro Indicators, 1972–2013
JPM-ILMANEN.indd 96JPM-ILMANEN.indd 96 4/15/14 10:01:42 PM4/15/14 10:01:42 PM
THE JOURNAL OF PORTFOLIO MANAGEMENT SPRING 2014
E X H I B I T A 3Cumulative Performance in “Up” and “Down” Environments, 1972–2013
JPM-ILMANEN.indd 97JPM-ILMANEN.indd 97 4/15/14 10:01:42 PM4/15/14 10:01:42 PM
EXPLORING MACROECONOMIC SENSITIVITIES: HOW INVESTMENTS RESPOND TO DIFFERENT ECONOMIC ENVIRONMENTS SPRING 2014
ENDNOTES
Thanks to Gregor Andrade, Cliff Asness, Jordan Brooks, Jeremy Getson, Ronen Israel, David Kabiller, Michael Katz, John Liew, Michael Mendelson, Chris Palazzolo, Dan Vil-lalon, and Forrest Xiao for helpful comments. The views and opinions expressed herein are those of the authors and do not necessarily ref lect the views of AQR Capital Management, LLC and its affiliates.
1Style premia are broadly recognized, empirically tested, dynamically traded, historically lowly correlated sources of returns, which can be systematically harvested in multiple asset classes.
2Readers familiar with the cube in Ilmanen [2011] may recognize that the asset class premia correspond to the asset class perspective at the front of the cube, the style premia correspond to the strategy styles at the top, and the macro factors correspond to the underlying non-investable risk fac-tors at the side. To be clear, the third side (underlying risk factors) does not provide additional sources of diversification beyond those in the first two sides, but rather gives a more fundamental perspective on the portfolio.
3See Chen, Roll, and Ross [1986], Katz-Palazzolo [2010], Ilmanen [2011, chapters 16 and 26], and Doskov, Pekkala, and Ribeiro [2013] and references therein.
4Would you expect this quarter’s equity returns to be most affected by the past quarter’s economic growth (pub-lished this quarter), by the current quarter’s growth (on which markets get useful contemporaneous information), or by future growth (because markets have some ability to pre-dict—and inf luence—economic growth)? Empirically, the last one is the correct answer. In short, stock markets are typi-cally a leading, not lagging or contemporaneous, indicator on economic activity. Longer data windows help mitigate these problems. Thus, we study contemporaneous annual returns and macroeconomic developments (sampled quarterly).
5Arguably, composite growth surprise indices are the best proxies for economic growth news, but such composites are available at best going back to the 1990s. Forecast changes in economist surveys, as well as business and consumer confi-dence surveys, may be the next best choices, because they are reasonably forward-looking and timely. In a globalized world, it is not clear whether we should focus only on domestic macro developments, but data constraints make us focus on U.S. data.
6The “surprise” series for the growth and inf lation indi-cators uses IP production and CPI, respectively, relative to forecasts from the Survey of Professional Forecasters.
7The TED spread is the yield difference between Euro-dollar and Treasury bill rates (we use the three-month matu-rity). This spread tends to widen when market concerns on banking sector credit risk rise or funding liquidity conditions
deteriorate. The ILLIQ measure of a stock’s market-impact costs, developed by Amihud [2002] and often used in empir-ical studies, is the ratio of absolute return over volume. Intui-tively, the price change induced by a given dollar volume is higher for less-liquid stocks. The aggregate measure increases when overall market liquidity worsens.
8Momentum and trend-following are related to each other, but different in construction. Momentum strategies buy assets that have done relatively well versus their peers and sell the laggards, while trend-following strategies consider each asset independently. Thus, trend-following strategies can at times take highly market-directional positions.
9We splice data over two different time frames. Since 1990, we use value, momentum, carry, and defensive style premia as described in Israel, Ilmanen, and Moskowitz [2012], combining several indicators in each asset class to capture each style. For 1972 to 1989, we source value and momentum style returns from Asness, Moskowitz, and Pedersen [2013], defensive style returns from Frazzini and Pedersen [2013], and the stock selection carry style premium from dividend yield strategy returns from Ken French’s data library. For asset allocation carry before 1990, as well as early histories of asset allocation value, momentum, and defensive styles, we use AQR in-house back-tests.
When creating the composite asset allocation style premia, we use the same relative risk weights for asset classes as Israel, Ilmanen, and Moskowitz [2012]: 33% equity country allocation, 25% fixed income, 25% currencies, 17% com-modities. However, for stock selection, we use 50/50 risk weights between stock selection within industries and across industries (to be in line with the common but ineff icient practice of letting cross-industry positions matter as much as within-industry positions). The investment universe for market-neutral styles since 1990 is as follows. Stock-selection strategies: approximately 1,500 stocks across Europe, Japan, U.K., and U.S. country equity indices: 14 developed and 7 emerging markets. Bonds: 10-year futures for 6 markets. Interest rate futures: 5 markets. Currencies: 10 developed and 9 emerging markets. Commodities: 8 futures. Pre-1990 back-tests use a slightly narrower universe.
10We source trend style premia from Moskowitz, Ooi, and Pedersen [2012] and extend the series before 1985 using the same methodology.
11Although the performance differences across envi-ronments are not statistically significant for styles, they are for assets, based on the difference of means tests at the 5% level.
12Here we show full-sample results for 1972–2013. Consistency over time is best visualized in cumulative return charts, which capture the binary distinction between “up” and “down” periods (see appendix).
JPM-ILMANEN.indd 98JPM-ILMANEN.indd 98 4/15/14 10:01:43 PM4/15/14 10:01:43 PM
THE JOURNAL OF PORTFOLIO MANAGEMENT SPRING 2014
13To be clear, “iIlliquidity up” refers to environments where credit conditions tighten, market liquidity evaporates, and portfolio liquidations are more likely.
14The naïve risk parity portfolio combines global equi-ties, global bonds, and equally weighted commodities and uses the past 12 months’ volatilities and long-term correlation assumptions to estimate equal risk contributions.
15Very loosely, we would discount these gross style Sharpe ratios by about half, to give more realistic prospec-tive estimates. But this does not affect our study of macro sensitivities (comparisons across each row).
16We ran many sensitivity analyses on our f indings. Among these, perhaps the most interesting was to remove level effects in macro indicators (which may have less effect on asset returns). If we use only the change indicators (first eliminating levels and then replacing levels with an autore-gressive model), the broad results are similar as in Exhibits 2 through 4. The relative differences between “factor up” and “factor down” scenarios remain largely the same, though the magnitudes differ. However, there are a few specific differ-ences worth mentioning: some of style premia become less robust to growth and inf lation environments, but more robust to illiquidity environments, while the risk parity portfolio becomes generally more robust. In particular, three styles (momentum, defensive, trend) switch to faring better in the “illiquidity up” than “illiquidity down” environment, so the style-5 composite seems more resilient to illiquidity events.
17Even the contemporaneous relations we document between investable and non-investable factors may not be stable over time, thus limiting the practical usefulness of macro risk factors. Our findings are at least partly attribut-able to and specific to our design choices and the historical period we studied.
18Institutional investors may find it worthwhile to study the macro sensitivities of not just their financial assets, but also of their liabilities and indeed of the whole enterprise.
19Note that when we plotted several commodities indi-vidually (not shown), all commodities (except gold) were in the top-right quadrant of the growth and inf lation graph. Gold was in the top-left quadrant, suggesting it exhibited valuable positive inf lation and negative growth exposures during this sample.
REFERENCES
Amihud, Y. “Illiquidity and Stock Returns: Cross-Section and Time-Series Effects.” Journal of Financial Markets (2002), pp. 31-56.
Asness, C., T. Moskowitz, and L. Pedersen. “Value and Momentum Everywhere.” Journal of Finance, Vol. 68, No. 3 (2012), pp. 929-985.
Chen, N., R. Roll, and S. Ross “Economic Forces and the Stock Market.” Journal of Business, Vol. 59, No. 3 (1986), pp. 383-403.
Doskov, D., T. Pekkala, and R. Ribeiro. “Tradable Aggregate Risk Factors and the Cross-Section of Stock Returns.” Social Sciences Research Network working paper series, 2013.
Frazzini, A., and L. Pedersen. “Betting Against Beta.” Working paper, 2013.
Ilmanen, A. Expected Returns. Hoboken, NJ: John R. Wiley and Sons, 2011.
Israel, R, A. Ilmanen, and T. Moskowitz. “Investing With Style.” AQR white paper, 2012.
Katz, M., and C. Palazzolo. “Inf lation in 2010 and Beyond? Practical Considerations for Institutional Asset Allocation.” AQR white paper, 2010.
Moskowitz, T., Y.H. Ooi, and L. Pedersen. “Time Series Momentum.” Journal of Financial Economics, Vol. 104, No. 2, (2012), pp. 228-250.
To order reprints of this article, please contact Dewey Palmieri at [email protected] or 212-224-3675.
JPM-ILMANEN.indd 99JPM-ILMANEN.indd 99 4/15/14 10:01:43 PM4/15/14 10:01:43 PM