Embed Size (px)
Citation preview
Volume 16, Number 1 ISSN 1948-3147
Allied Academies International Conference
Orlando, Florida April 5-9, 2011
Academy of Accounting and Financial Studies
PROCEEDINGS
Copyright 2011 by the DreamCatchers Group, LLC, Arden, NC, USA
page ii Allied Academies International Conference
Orlando, 2011 Proceedings of the Academy of Accounting and Financial Studies, Volume 16, Number 1
All authors execute a publication permission agreement taking sole responsibility for the information in the manuscript. The DreamCatchers Group, LLC is not responsible for the content of any individual manuscripts. Any omissions or errors are the sole responsibility of the individual authors. The Academy of Accounting and Financial Studies Proceedings is owned and published by the DreamCatchers Group, LLC, PO Box 1708, Arden, NC 28704, U.S.A., (828) 507-9770. Those interested in the Proceedings, or communicating with the Proceedings, should contact the Executive Director of the Allied Academies at [email protected].
Copyright 2011 by the DreamCatchers Group, LLC, Arden, NC
Allied Academies International Conference page iii
Proceedings of the Academy of Accounting and Financial Studies, Volume 16, Number 1 Orlando, 2011
Table of Contents ARE THE ROMANIAN FIRMS READY FOR THE INTERNATIONAL STANDRADS ON AUDITING? ........................................................................................................................... 1
Gin Chong, Prairie View A&M University
Calin Gurau, Montpellier Business School
DETECTION AND DETERRENT OF FRAUD RISK ............................................................. 5
Gin Chong, Prairie View A&M University
WHY DO COMPANIES PAY CASH DIVIDENDS? ............................................................. 11
Christopher A. Briere, Longwood Universit
Frank W.Bacon, Longwood University
BEHAVIOR OF MONTHLY CHANGES OF DJIA: 1896 TO 2008 ................................... 17
Shaikh A. Hamid, Southern New Hampshire University
Tej Dhakar, Southern New Hampshire University
A MODEL TO EVALUATE DIVISIONAL MANAGERS WITHIN THE GENERALLY ACCEPTED ACCOUNTING PRINCIPLES FRAMEWORK .............................................. 19
John Hathorn, Metropolitan State College of Denver
Gregory Clifton, Metropolitan State College of Denver
Letitia Pleis, Metropolitan State College of Denver
ACCOUNTING FOR THE PARTIAL SALE OF OWNERSHIP INTERESTS WHEN THE PARENT RETAINS CONTROL ..................................................................................... 21
John Hathorn, Metropolitan State College of Denver
A DEMOGRAPHIC STUDY OF POLISH ATTITUDES TOWARD TAX EVASION ...... 23
Adriana M. Ross, Florida International University
Robert W. McGee, Florida International University
page iv Allied Academies International Conference
Orlando, 2011 Proceedings of the Academy of Accounting and Financial Studies, Volume 16, Number 1
MANAGING RISK IN UNCERTAIN TIMES: HOW INTERNAL AUDIT CAN HELP . 29
Gary P. Schneider, Quinnipiac University
Aamer Sheikh, Quinnipiac University
Kathleen A. Simione, Quinnipiac University
JUST-IN-TIME INVENTORY MANAGEMENT AND ITS FINANCIAL PERFORMANCE: CASES OF DELL AND WALMART ..................................................... 33
Seungjae Shin, Mississippi State University, Meridian
Kevin L. Ennis, Mississippi State University, Meridian
Harold D. White, Mississippi State University, Meridian
HOW DO SMALL FIRMS USE FINANCIAL STATEMENTS? ......................................... 35
Howard Van Auken, Iowa State University
Shawn M. Carraher, Minot State University/Severson Entrepreneurship Academy ..
DURATION OF CORPORATE DEBT ISSUES ..................................................................... 43
Fang Zhao, Siena College
Jim Moser, Commodity Futures Trading Commission, Washington, DC
Joe M. Pullis, Louisiana Tech University
BRICKS OR CLICKS IN ACCOUNTING EDUCATION? WHICH METHOD IS THE MOST BENEFICIAL TO THE ACCOUNTING STUDENT? .............................................. 45
Melinda Kushniroff, Millikin University
THE FEDERAL OPEN MARKET COMMITTEE AND THE FEDERAL FUNDS RATE: . A TEST OF MARKET EFFICIENCY ..................................................................................... 47
Michael Young, Longwood University
Frank Bacon, Longwood University
Allied Academies International Conference page 1
Proceedings of the Academy of Accounting and Financial Studies, Volume 16, Number 1 Orlando, 2011
ARE THE ROMANIAN FIRMS READY FOR THE INTERNATIONAL STANDRADS ON AUDITING?
Gin Chong, Prairie View A&M University Calin Gurau, Montpellier Business School
ABSTRACT In 1991 Romania has initiated the reform of its accounting system with the implementation of the Accounting Law. In 2001 the Accounting Law has changed to incorporate recommendations of the International Accounting Standards, while in 2009, the Romanian Auditing Board has included the International Standards on Auditing (ISA) in their nation’s auditing standards. These changes are preconditions for Romania joining the European Union in 2007. This paper reports a series of semi structured interviews with 12 respondents (CPAs and the Auditing Board) on the implications of the Standards. We look at the audit and non-audit ramifications, and suggest ways forward.
INTRODUCTION Literature on extent of Romanian audit firms adopting the International Standards on Auditing (ISA) is very scarce and limited. This could be due to language barrier and secrecy during the communist regime (Ernst and Young 2009). Post Communism has witnessed Romanian audit firms and auditees have adapted to and adopted the ISA. This paper fills the gap on identifying the impact of ISA on Romanian accounting firms and practices. With the collapse of communism in Eastern Central Europe countries (ECE) in late 1980s and early 1990s, many newly elected democratic governments were actively seeking for foreign investments to assist their transformation processes from the centrally planned system to a free market economy. These ECE include Poland, the Czech Republic, Slovakia, Hungary, Romania, Bulgaria, Albania, Serbia, Croatia, Bosnia, Slovenia, Macedonia, and they understand the needs of a reliable legal and financial framework to gain the confidence of investors, and audits are perceived as tools to add credibility to the financial results (Rolfe and Doupnik, 1995). Romania changed its Accounting Law (82/1991) in entirety by adopting the International Accounting Standards (IAS) in 2004 and, the Auditing Board added all the International Standards on Auditing (ISA) in the nation’s auditing standards in 2009. The Accounting Law (www.aneir-cpce.ro), effective from January 1, 1992 was drafted whereby all Romanian-registered firms were expected to change from the French model of chart of accounts (Richard, 2003:344, though McClure, 1984 argues that the chart of accounts are the Soviet model) to the EU model in 2007, subsequently to IAS in 2004. Similarly, accounting firms have revised their auditing processes catering for the changes, from government audits to IAS. We selected Romania for this study due to its adaptability from one process to another.
page 2 Allied Academies International Conference
Orlando, 2011 Proceedings of the Academy of Accounting and Financial Studies, Volume 16, Number 1
During the communist regime (1950-1989), the main thrust of accounting and reporting system was enabling the state compile information and evaluate the allocated economic resources have met the underlying objectives. The processes of planning, allocation and control of resources were closely guarded secrets. Apart from the state, no one else have access to information relating to performance of the government units. These reports were the basis for tax policy, allocating resources, raising revenues and completing the national statistics. Lack of audit processes questions the reliability of financial statistics. Window dressing is not uncommon.
HYPOTHESES H1 The auditing profession has changed its auditing processes from the traditional approach
to the ISA approach. H2 Audit firms face key challenges for adopting new auditing procedures.
METHODOLOGY
To gain insightful information on the audit procedures and to avoid possible non responses or misunderstanding the purposes of the study, we conduct a series of semi-structured interviews with 12 respondents in 2010. One of the authors of this study is a native Romanian who speaks fluent Romanian and English. The local national university in Oradea, a major city on the north west of Romania, contacted their networks for responding to our inquiries. Respondents
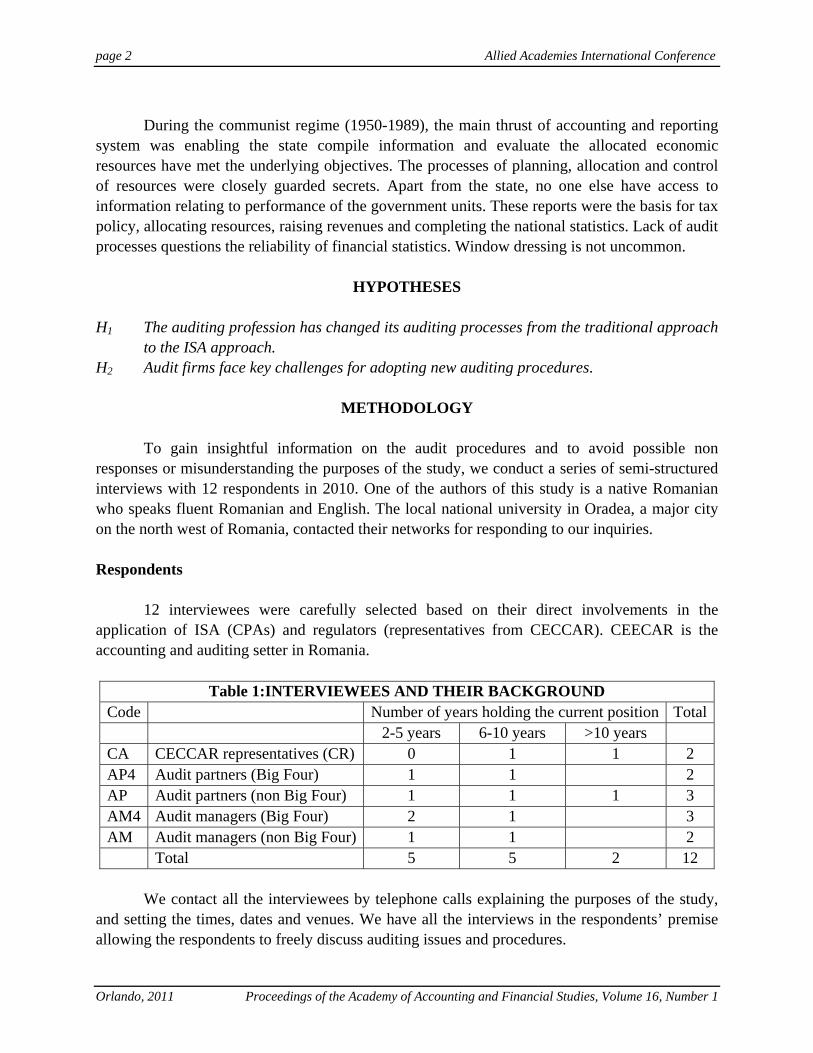
12 interviewees were carefully selected based on their direct involvements in the application of ISA (CPAs) and regulators (representatives from CECCAR). CEECAR is the accounting and auditing setter in Romania.
Table 1:INTERVIEWEES AND THEIR BACKGROUND Code Number of years holding the current position Total
2-5 years 6-10 years >10 years CA CECCAR representatives (CR) 0 1 1 2 AP4 Audit partners (Big Four) 1 1 2 AP Audit partners (non Big Four) 1 1 1 3 AM4 Audit managers (Big Four) 2 1 3 AM Audit managers (non Big Four) 1 1 2 Total 5 5 2 12
We contact all the interviewees by telephone calls explaining the purposes of the study,
and setting the times, dates and venues. We have all the interviews in the respondents’ premise allowing the respondents to freely discuss auditing issues and procedures.
Allied Academies International Conference page 3
Proceedings of the Academy of Accounting and Financial Studies, Volume 16, Number 1 Orlando, 2011
FINDINGS We identify the interviewees as AP4a (audit partner of Big Four firm a), AP4b (audit partner of Big Four firm b), and APa (audit partner of a non Big Four firm a). Average interview duration is 54 minutes. Results of findings Apart from members of CECCAR, all the 10 respondents confirmed incorporating ISA in their audit procedures. Firms made huge changes in their audit procedures prior to Romania joining the EU (in 2007) including audit sampling (AP4a), materiality thresholds (AP4b), risk-based audits (AP4b), and use of analytical audit procedures (all AMs), use of substantive and compliance testing (all AMs), and follow ISA format on audit opinions (all respondents). As such, we support H1 that is the auditing profession has changed its auditing processes from the traditional approach to the ISA approach. From the interviews, we identify the following issues to support the second hypothesis. These issues include lack of resources, costs of compliance, lack of skilled and qualified personnel and clients’ misconception on audit purposes. Lack of resources Audit firms face a lack of resources, in terms of timeline and manpower. Romania short timeline to change its auditing procedures from government-focus audits to ISA-audits. Apart from Big Four, local firms have limited resources securing for manpower (all APs) and audit assignments (APa, APc). Tight audit deadlines on turning in the audit opinions after the financial year end and having a common financial year end (December 31) made audit firms’ resources stretched thinly (all APs and AMs). Costs of compliance To update the audit staff, firms have invested large portion of their budgets on conducting regular in-house training and sending their audit staff for attending the continuous professional development courses (both AP4). Increasing responsibilities have pressured firms to increase their insurance premium on audit liabilities (all APs). Shortage of qualified staff causes retentions challenging (both AP4). Further, ISA requires firms to maintain proper working papers and retain them for six accounting years have caused shortage of space (all APs and AMs). Auditees’ reactions Audit shopping has increased due to increasing audit costs of compliance (all APs). Further, to comply with ISA, firms were discouraged to engage in non audit services. This
page 4 Allied Academies International Conference
Orlando, 2011 Proceedings of the Academy of Accounting and Financial Studies, Volume 16, Number 1
reduces non-audit revenues for audit firms, and options available for the auditees (all APs). To comply with ISA, auditees are required to ensure that audit evidence are adequate and reliable and readily available within six years after an audit (both CAs). This needs space and rent (all APs). As such, we support H2 that is, audit firms face key challenges for adopting new auditing procedures.
CONCLUSIONS AND WAYS FORWARD A lack of literature on the impact of ISA in Romania has prompted for this study. Scarcity of auditing literature on Romania is due to language barrier and sensitivities of financial information during the communist regime. Post Communism has witnessed Romanian audit firms and auditees have readily adapted to and adopted the ISA. The transitional period of adoption has made challenges to all parties with escalating costs of compliance and insurance premium. Compliance costs will reduce in a long run, but not the insurance premium due to higher expectations and increasing demand for transparency from the stakeholders. The study suffers limitations on size, range and geographical distribution of samples. Future research could include auditees (CFOs) and users (investors, representatives from the Treasury and tax authorities, bank managers, lawyers, analysts and academics). A wider geographical spread of study in other major financial centers like Bucharest, Timisoara, Brasov and Constanta, may reveal different findings. Additional audit requirements, competitions among audit firms and not engaging in non-audit services will bring opportunities to many smaller audit practices and local CPAs. The tasks and challenges of CECCAR are far from over, and it is worth revisit the findings in a near future.
REFERENCES CECCAR, Corpul Expertilor Contabili si Contabililor Autorizati din Romania (http://www.ceccar.ro/?lang=en) Ernst and Young (2009 `Financial reporting and auditing in Romania’ www.tipograph21.ro Richard, J. (2003)`Accounting in Eastern Europe: from communism to capitalism’. In Walton, P., Haller, A. and
Raffournier, B. (eds) International Accounting. London: Thompson Learning, 2nd edition, Chapter 14, 332-47.
Rolfe, R.J. and Doupnik, T.S. (1995) `Accounting revolution in East Central Europe’, Advances in International
Accounting, vol. 8:223-46.
Allied Academies International Conference page 5
Proceedings of the Academy of Accounting and Financial Studies, Volume 16, Number 1 Orlando, 2011
DETECTION AND DETERRENT OF FRAUD RISK
Gin Chong, Prairie View A&M University
ABSTRACT Statement on Auditing Standards (SAS) No. 99, Consideration of Fraud in a Financial Statement Audit identifies fraud risk. This paper reports results of semi-structured interviews with auditors and stakeholders on detecting and deterring fraud. The results show that all respondents concur that systematic audit processes including brainstorming sessions help identify fraud risk. This study has wide implications to the audit profession, stockholders and regulators.
INTRODUCTION Is brainstorming is an appropriate preventive actions for fraud risk? This paper reports the results of two separate brain-storming sessions involving three auditors from a Big Four firm, a CPA, a stock broker and a bank manager as stakeholders. The two sessions provide interesting perspectives on fraud risk and preventive actions. Prior studies cover specific stockholders, for example Brazel et al (2010) and Carpenter (2007) on the auditors’ perspective, while Hill (1982) and Diehl and Stroebe (1987) on the students’ perspective. This paper covers both auditors’ and stakeholders’ perspectives, a hybrid approach that helps fill the gap. Statement on Auditing Standards (SAS) No. 99 (AICPA, 2002), Consideration of Fraud in a Financial Statement Audit identifies factors that lead to fraud risk, it omits the preventive measures. Fraud remains an ongoing and global issue. In the US, the Inland Revenue Services (2010) reports the number of fraud cases has increased from 179 (in 2008), 181 (2009) to 242 (in 2010), while In the UK, the Daily Express Reporter (2009) reports the Inland Revenue has more than £40 billion (equivalent to US$64 billion) of taxes went uncollected in 2009 due to fraud, evasion and tax-system flaws. These reflect high volume of fraud. PwC (2005) surveys 3,000 corporate officers in 34 countries reveals a 140 percent increase in the discovered financial misrepresentations, from 10 percent of firms reporting financial misrepresentation in the 2003 survey to 24 percent in the 2005 survey. Fraud exists due to greed, weak internal control systems and opportunities, and has caused concerns for stakeholders. Apart from stakeholders, SAS 99 (2002) has called upon auditors to identify and report fraud.
BACKGROUND AND HYPOTHESES DEVELOPMENT Factors affecting financial fraud Statement on Auditing Standards (SAS) No. 99, Consideration of Fraud in a Financial Statement Audit (2002) identifies three elements that lead to fraud risk. First, incentives or pressure for fraudsters to commit fraud, secondly, opportunities for fraud to perpetrate due to weak controls or ability of management to override controls, and thirdly, attitude or
page 6 Allied Academies International Conference
Orlando, 2011 Proceedings of the Academy of Accounting and Financial Studies, Volume 16, Number 1
rationalization o f s t a f f a n d ma n a g e me n t . These three constitute the fraud triangle. Bell and Carcello (2000) use logistic regression model to predict the incidence of fraud, and conclude a close interaction between these three elements, and existence of risk factors associated with fraud including a firm’s rapid growth strategies, weak control environment, and management attitudes and incentives in meeting unrealistic analysts’ forecasts. The external pressure has forced the management and senior staff to manage earnings and make dishonest communications with the external auditor. Rezaee (2005) finds support for the relationships within the fraud triangle. These elements co-exist but lacks of known study on how management and auditors deal with the fraud risk. Incentives or Pressures Management are under constant pressure and huge incentives to mismanage earnings to meet the analysts’ forecasts, to meet the compensation and incentive structures, to meet the needs of the external financing, and to override the unexpected poor financial results. Dechow et al. (1996) and Beneish (1999) find that if a firm is subject to SEC-accounting enforcement actions, its managers are likely to dispose of their equity holdings and exercise stock appreciation rights when the firm inflates its earnings, while Efendi et al. (2007) report that firms are likely to misstate their financial statements if their CEOs have a sizable amount of in-the-money stock options, and if the firms are under constrain by debt covenants, pressure to raise new debt or equity capital, and have CEOs who also chair the board. All these suggest management earnings and insider trading that lead to fraud (e.g. Summers and Sweeney, 1998; Lie, 2005). Opportunities SAS 99 lists risk factors include nature of the industry and a firm’s operations such as extent of related party transactions, ineffective monitoring of management and employees, extreme complicated organizational structure with cross ownerships among the entities and individuals, and poor internal controls. Albrecht and Albrecht (2003) identify ineffective internal control systems, while Farber (2005) conclude that f i rms with less independent board members, with a unitary structure for chairman and CEO, and the CEO is also the firm’s founder are prompt to fraud. In short, firms with dominated management and with weak internal controls increase the opportunity for fraud. Attitudes/Rationalizations Appropriate and clear accounting standards help improve accounting transparencies and reporting, thereby reduce the opportunity and attitude toward fraudulent financial reporting. Nelson et al. (2002) report precision in accounting standards deters managers toward earnings management, and integrity, honesty, and ethics help deter fraud. In summary, there is a close
Allied Academies International Conference page 7
Proceedings of the Academy of Accounting and Financial Studies, Volume 16, Number 1 Orlando, 2011
relationship between incentives, opportunities and attitudes toward fraud risk. With this, I draw the following hypothesis: H1 Fraud triangle serves as a good guide on identifying existence of fraud Auditors’ Responsibilities to Detect Fraud An audit provides a reasonable assurance that financial statements are free from material misstatements whether the misstatements were caused by errors or fraud (PCAOB 2005), but reasonable assurance, limitations on audit methods to identify fraud, and cost constraints constitute toward fraud risk. SAS’ No. 99 (2002) checklist on risk factors help raise the `red flags’ but does not include weights on each fraud risk (Patterson and Noel 2003). Both Wilks and Zimbelman (2004) and Hackenbrack (1993) find that auditors tend to place more emphasis on the opportunities to commit fraud for a larger client than a smaller one, due to control structures and effects of fraud detection. With this, I draw upon H2 External auditors should help identify existence of fraud Brainstorming and Fraud Brazel et al (2010) find that those auditors who use brainstorming sessions to collect information relating to risk of material misstatement tend to synthesize information to help support fraud risk assessments. Hunton and Gold (2010) report effectiveness of brainstorming sessions.
METHOD Participants I use SAS 99 as a checklist to conduct two separate semi structured interviews with three auditors (one partner and two managers) from one Big Four and three stakeholders (1 CPA as a preparer, 1 stock broker and1 bank manager) on effects of brainstorming the fraud risk factors. Having two separate brainstorming sessions allows the two groups transpire their views and expectations on fraud preventions. I sent the checklist to the participants two weeks before the sessions. At the start of each brainstorming session, I went through the checklist and then semi-structured interviews with each participant.
page 8 Allied Academies International Conference
Orlando, 2011 Proceedings of the Academy of Accounting and Financial Studies, Volume 16, Number 1
RESULTS Hypotheses Testing Fraud triangle serves as a good guide on identifying existence of fraud H1 posits that fraud triangle serves as a good guide for identifying fraud. Both brain-storming teams support fraud exists due to opportunities, pressure and rationalization, poor internal control, weak governance mechanism, and greed and excuses from the individuals. The interviewees find that the guide is too rigid, lacks weighting and not applicable in all situations. With these, I support H1.
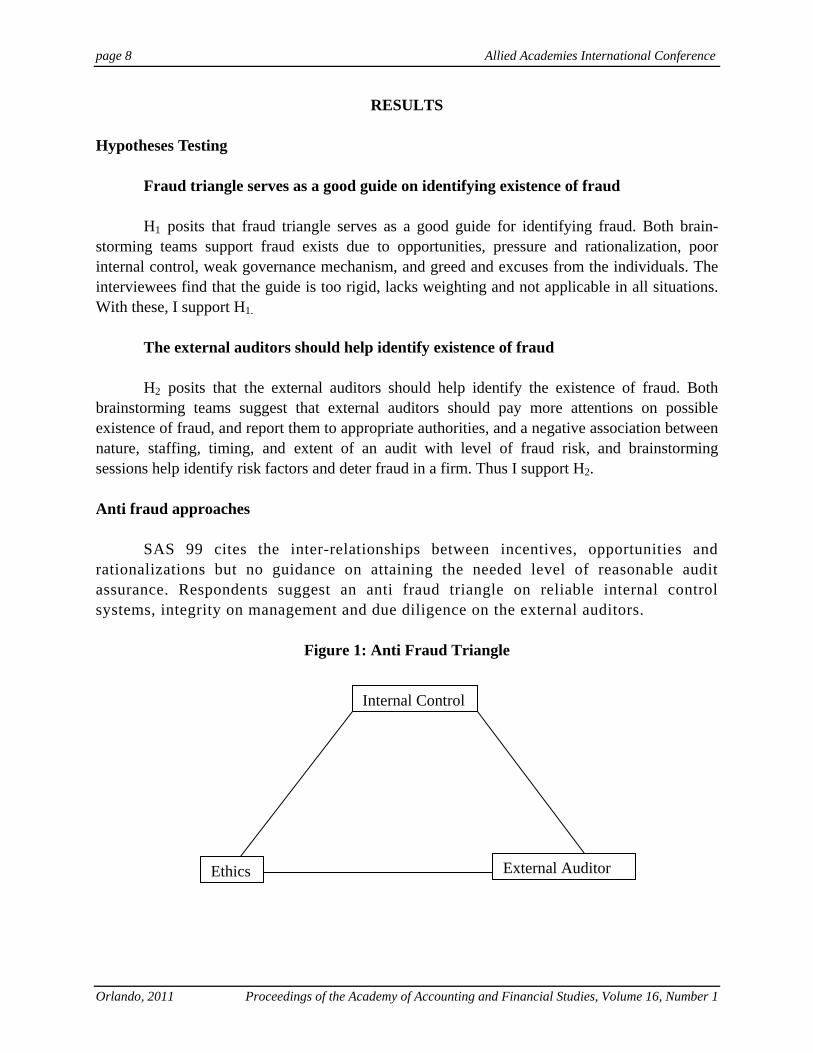
The external auditors should help identify existence of fraud H2 posits that the external auditors should help identify the existence of fraud. Both brainstorming teams suggest that external auditors should pay more attentions on possible existence of fraud, and report them to appropriate authorities, and a negative association between nature, staffing, timing, and extent of an audit with level of fraud risk, and brainstorming sessions help identify risk factors and deter fraud in a firm. Thus I support H2. Anti fraud approaches SAS 99 cites the inter-relationships between incentives, opportunities and rationalizations but no guidance on attaining the needed level of reasonable audit assurance. Respondents suggest an anti fraud triangle on reliable internal control systems, integrity on management and due diligence on the external auditors.
Figure 1: Anti Fraud Triangle
Ethics External Auditor
Internal Control
Allied Academies International Conference page 9
Proceedings of the Academy of Accounting and Financial Studies, Volume 16, Number 1 Orlando, 2011
Authorities including SEC, professional bodies and IRS should act swiftly on all reported fraud, professional bodies strike off non-complying members, and courts impose heavy financial penalties and imprisonments.
CONCLUSIONS AND SUGGESTIONS Brainstorming helps identify possible fraud situations, but all stakeholders need to project positive attitude of being ethical, accountable, integrity and are responsible to discharge their duties of care. Though the SAS checklist is useful, auditors need to adapt and adopt it to situations and clients’ nature of business. Future research could combine both audit and non-audit participants in a brain storming session. Brainstorming sessions allow close interactions between practitioners and users on identifying, reporting and preventing fraud, and eventually narrowing the expectation gap. Fraud remains a red-flag issue. All stakeholders, including regulators, should join hands to fight and deter it.
REFERENCES Albrecht, W. S., & C. O. Albrecht (2003). Fraud Examination and Prevention. Mason, OH: Thompson-
Southwestern. American Institute of Certified Public Accountants (AICPA) (2002). Consideration of Fraud in a Financial
Statement Audit. Statement on Auditing Standards No. 99. New York, NY: AICPA. Bell, T. B., & J. V. Carcello ( 2000). A decision aid for assessing the likelihood of fraudulent financial
reporting. Auditing: A Journal of Practice & Theory, 19(1), 169–184. Beneish. M. (1999). Incentives and penalties related to earnings overstatements that violate GAAP. The Accounting
Review, 74(4), 425–457. Brazel, J.F., T.D. Carpenter & J. G. Jenkins (2010). Auditors’ Use of brainstorming in the Consideration of Fraud:
Reports from the Field. The Accounting Review, 85(4), 1273-1301 Carpenter, T. D. (2007). Audit team brainstorming, fraud risk identification, and fraud risk assessment: Implications
of SAS No. 99. The Accounting Review, 82(5), 1119-1140. Daily Express Reporter (2009). Up to £40billion of taxes went uncollected last year due to fraud, evasion and tax-
system flaws. December 15, 2009. Retrieved March 1 2011 from http://www.express.co.uk/posts/view/146078/-40bn-lost-in-tax-revenue-due-to-fraud-and-evasion
Dechow, P. M., R. G. Sloan & A. P. Sweeney (1996). Causes and consequences of earnings manipulation: An
analysis of firms subject to enforcement actions by the SEC. Contemporary Accounting Research, 13(Spring), 1–36.
Diehl, M. & W. Stroebe (1987). Productivity loss in brainstorming groups: Toward the solution of the riddle. Journal
of Personality and Social Psychology, 53(3), 497-509.
page 10 Allied Academies International Conference
Orlando, 2011 Proceedings of the Academy of Accounting and Financial Studies, Volume 16, Number 1
Efendi, J., A. Srivastava & E. Swanson (2007). Why do corporate managers misstate financial statements? The role of option compensation and other factors. Journal of Financial Economics, 85(3), 667–708.
Farber, D. (2005). Restoring trust after fraud: Does corporate governance matter? The Accounting Review, 80(2),
539–561. Hackenbrack, K. ( 1993). The effect of experience with different sized clients on auditor evaluations of fraudulent
financial reporting indicators. Auditing: A Journal of Practice & Theory, 12(1), 99–110. Hill, G. W. ( 1982). Group versus individual performance: Are N 1 heads better than one? Psychological
Bulletin, 91(3), 517-539. Hunton, J. & A. Gold (2010). A field experiment comparing the outcomes of three fraud brainstorming
procedures: Nominal group, round robin and open discussion. The Accounting Review, 85(3), 911-935. Inland Revenue Services (2010). Criminal Investigation Management Information System. IRS website. Retrieved
on March 1, 2011 from http://www.express.co.uk/posts/view/146078/-40bn-lost-in-tax-revenue-due-to-fraud-and-evasion
Lie, E. (2005). On the timing of CEO stock option awards. Management Science, 51(5), 802–812. Lynch, A. L., U. S. Murthy & T. J. Engle (2009). Fraud brainstorming using computer-mediated communication:
The effects of brainstorming technique and facilitation. The Accounting Review, 84(4), 1209-1232. Nelson, M. W., J. A. Elliott & R. L. Tarpley (2002). Evidence from auditors about managers’ and auditors’
earnings management decisions. The Accounting Review, 77(Supplement), 175-202. Patterson, E. & J. Noel ( 2003). Audit strategies and multiple fraud opportunities of misreporting and
defalcation. Contemporary Accounting Research, 20(Fall), 519–549. PricewaterhouseCoopers (PwC) (2005). Global Economic Crime Survey. Retrieved on March 1, 2011 from
http://www.pwc.com. Public Company Accounting Oversight Board (PCAOB) (2005). PCAOB Standing Advisory Group Meeting:
Meeting Agenda (September 8–9). Retrieved on March 1, 2011 from http://www.pcaobus.org/News_and_Events/Events/2004/09-08-09.aspx.
Rezaee, Z. ( 2005). Causes, consequences, and deterrence of financial statement fraud. Critical Perspectives on
Accounting, 16 (April), 277-298. Summers, S. L. & J. T. Sweeney (1998). Fraudulently misstated financial statements and insider trading: An
empirical analysis. The Accounting Review, 73(January), 131-146. Wilks, T. J. & M. F. Zimbelman (2004). Using game theory and strategic reasoning concepts to prevent and detect
fraud. Accounting Horizons, 18(3), 173-184.
Allied Academies International Conference page 11
Proceedings of the Academy of Accounting and Financial Studies, Volume 16, Number 1 Orlando, 2011
WHY DO COMPANIES PAY CASH DIVIDENDS?
Christopher A. Briere, Longwood University Frank W.Bacon, Longwood University
ABSTRACT What influences a company to pay cash dividends to their investors and what leads the company to decide the amount per share to pay? This research project attempts to declare the main reason why companies pay dividends and to measure the impact of several variables on the amount of dividends paid. By using Value Line this study examines about 1400 different companies, and uses their financial data to test how each variable impacts the company’s decision to pay dividends or not. Through the results of this study I will be able to determine whether or not the variables parallel past results from similar studies. In addition, the results found from this study should confirm the theories that are illustrated through the writings of many prestigious authors.
INTRODUCTION Many theorists and researchers have tested and hypothesized why companies pay cash dividends to their investors. There are several different theories, but there is no clear reasoning behind the matter in question. Some studies show that it is beneficial to pay dividends while others prove differently. Some believe that paying dividends is a strong strategy for influencing investors to purchase stock in their company, and some believe that paying dividends is merely the throwing away of money that could be used otherwise. Are dividends a useful technique or are they a waste of money? The purpose of this study is to examine which dividend theory most frequently motivates a company to pay cash dividends and how different variables affect the amount of cash dividends. A regression will produce various results that will demonstrate how each variable affects cash dividends. These results should propose an answer to the question with the support of quantitative evidence.
LITERATURE REVIEW There are four main hypotheses that researchers believe to be the main motives behind distributing stock dividends. Each of these hypotheses has been rigorously researched, but no single answer has been concluded to why companies should or should not pay cash dividends. The following hypotheses are explained in detail and are supported by past studies that have produced strong evidence.
page 12 Allied Academies International Conference
Orlando, 2011 Proceedings of the Academy of Accounting and Financial Studies, Volume 16, Number 1
SIGNALING THEORY Some believe that dividends merely deplete funds from a company’s budget which could be used to strengthen the overall company. Others believe that the payment of dividends makes the company’s stock appear more desirable to potential investors. This belief is called the signaling hypothesis. Investors are attracted to stocks that pay dividends because dividends show an optimistic outlook for a company’s future and also give the investor an immediate cash inflow. Eisemann and Moses examined 80 NYSE firms that paid a cash dividend of 25% or less and 89 firms that did not pay a dividend in 1974. Through their research Eisemann and Moses found that most managers leaned towards the signaling hypothesis. The managers believed that stock dividends allowed them to show their confidence in their company’s future. In addition to giving investors a confident outlook on a company, they found that firms pay dividends to maintain the historical practice of paying their investors a portion of the profit earned. Once dividends are first issued investors expect them to continue to come. If the dividends are eliminated this might scare investors and convince them to sell their shares and stop investing in the certain company In addition to Eisemann and Moses, many other researchers, including Grinblatt, have found a positive correlation between the announcement of the dividends and the company’s stock price. Doran and Nachtmann as well as McNichols and David proved that there is a major increase in the amount of earnings following the issuance of dividends (Baker, 1993).
TRADING RANGE THEORY The trading range hypothesis is said to be able to move a stock into its optimal price range. Keeping the stock price within this optimal range allows investors to be able to buy round lots of a given stock. Being able to buy round lots instead of odd lots saves the investors money by cutting down transaction costs. By paying dividends companies are able to influence investors to buy their stock and keep the stock price within this desired range. Studies regarding the trading range hypothesis have shown that keeping a stock price within its optimal price range dramatically increases its attractiveness. Author H. Kent Baker supports his thoughts on the trading range theory: Moving the stock into this range theoretically makes the market for trading in the stock wider or deeper by attracting more investors, which increases liquidity. Elgers and Murray [4] find that firms with low stock prices are more inclined to issue small stock distributions. They conclude that managers do not find small stock dividends useful tools to reduce high share prices. Lakonishok and Lev [7] also conclude that price is not a major motive for stock dividend distributions (Baker, 1993).
Allied Academies International Conference page 13
Proceedings of the Academy of Accounting and Financial Studies, Volume 16, Number 1 Orlando, 2011
LIQUIDITY THEORY The liquidity hypothesis suggests that stock dividends enhance liquidity by creating additional shares that generate greater trading and ownership dispersion of the firm (Baker, 1993). The liquidity hypothesis is backed by little empirical evidence. There are a few studies that show relative data to either prove or disprove this theory. Murray and Lakonishok found that the highest trading volume of a company’s stock exists during the month that the announcement of dividends takes place. Murray finds that stock dividends do not affect the percentage bid-ask spreads in the short or long run. These results are inconsistent with the belief that dividends improve liquidity (Baker, Phillips, and Powell).
CASH SUBSTITUTE THEORY The cash substitute hypothesis states that companies may issue shares of stock instead of a cash dividend in order to conserve cash. This can be beneficial when companies are on a tight budget and need to save their available cash. One alternative to paying cash dividends is paying scrip dividends. Scrip dividends are basically shares of stock, but they differ from stock dividends in the US because the recipient is not taxed. John and Williams (1985) and Miller and Rock (1985) both found that companies with a lack of funds use scrip dividends to retain cash. Lesfer found that firms that pay scrip dividends usually have high dividend yields which result in a major savings in cash. She also found that many shareholders would decide not to accept scrip dividends due to the fact that the gains are likely to be less than the costs of receiving them. Taxation does not drive firms to pay scrip dividends (Lesfer, 1997). This alternative allows the firm to save cash without sending a negative signal to their investors by reducing cash dividends. Researchers such as: Asquith, Healy, and Palepu (1989), and Peterson, Millar, and Rimbey (1996); propose that offering scrip dividends give managers confidence about keeping the dividends standard or increasing them. They believe that firms offering scrip dividends are more likely to acquire larger earnings in order to increase their dividends. These firms will also incur greater capital gains than those companies that are only offering cash dividends (Lesfer, 1997). Baker and Phillips conducted an experiment to determine which of these stated theories companies tend to support the most. Through a questionnaire type study of 121 different firms they found that dividends do have a psychological impact on their investors. This result is consistent with many findings that are published in other studies. They found that 68% of the participants that responded to their questionnaire agreed that the company’s stock price rose due to the announcement of dividends. As far as the theories are concerned; the signaling theory received the most support. The results showed a 78% agreement rate proving that most investors and managers believe that dividends show a positive outlook for a company’s future. Participants in this study showed various responses to the other 3 hypotheses, but the trade range theory was agreed upon by 54.6% (Baker, 1993).
page 14 Allied Academies International Conference
Orlando, 2011 Proceedings of the Academy of Accounting and Financial Studies, Volume 16, Number 1
In addition to these hypotheses, there are multiple variables (these will be mentioned later) that are believed to have a major impact on the amount of dividends paid. My quantitative research and results show the relationship between the variables and the amount of dividends paid to investors.
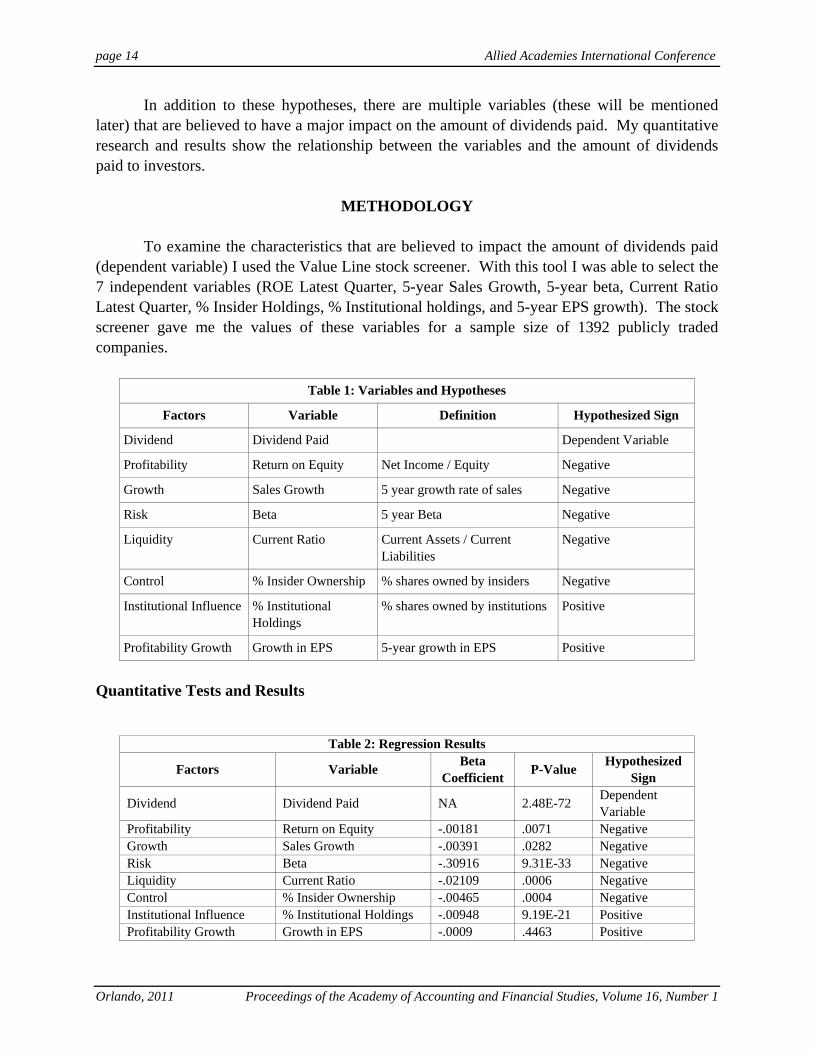
METHODOLOGY To examine the characteristics that are believed to impact the amount of dividends paid (dependent variable) I used the Value Line stock screener. With this tool I was able to select the 7 independent variables (ROE Latest Quarter, 5-year Sales Growth, 5-year beta, Current Ratio Latest Quarter, % Insider Holdings, % Institutional holdings, and 5-year EPS growth). The stock screener gave me the values of these variables for a sample size of 1392 publicly traded companies.
Table 1: Variables and Hypotheses
Factors Variable Definition Hypothesized Sign
Dividend Dividend Paid Dependent Variable
Profitability Return on Equity Net Income / Equity Negative
Growth Sales Growth 5 year growth rate of sales Negative
Risk Beta 5 year Beta Negative
Liquidity Current Ratio Current Assets / Current Liabilities
Negative
Control % Insider Ownership % shares owned by insiders Negative
Institutional Influence % Institutional Holdings
% shares owned by institutions Positive
Profitability Growth Growth in EPS 5-year growth in EPS Positive
Quantitative Tests and Results
Table 2: Regression Results
Factors Variable Beta Coefficient P-Value Hypothesized
Sign
Dividend Dividend Paid NA 2.48E-72 Dependent Variable
Profitability Return on Equity -.00181 .0071 Negative Growth Sales Growth -.00391 .0282 Negative Risk Beta -.30916 9.31E-33 Negative Liquidity Current Ratio -.02109 .0006 Negative Control % Insider Ownership -.00465 .0004 Negative Institutional Influence % Institutional Holdings -.00948 9.19E-21 Positive Profitability Growth Growth in EPS -.0009 .4463 Positive
Allied Academies International Conference page 15
Proceedings of the Academy of Accounting and Financial Studies, Volume 16, Number 1 Orlando, 2011
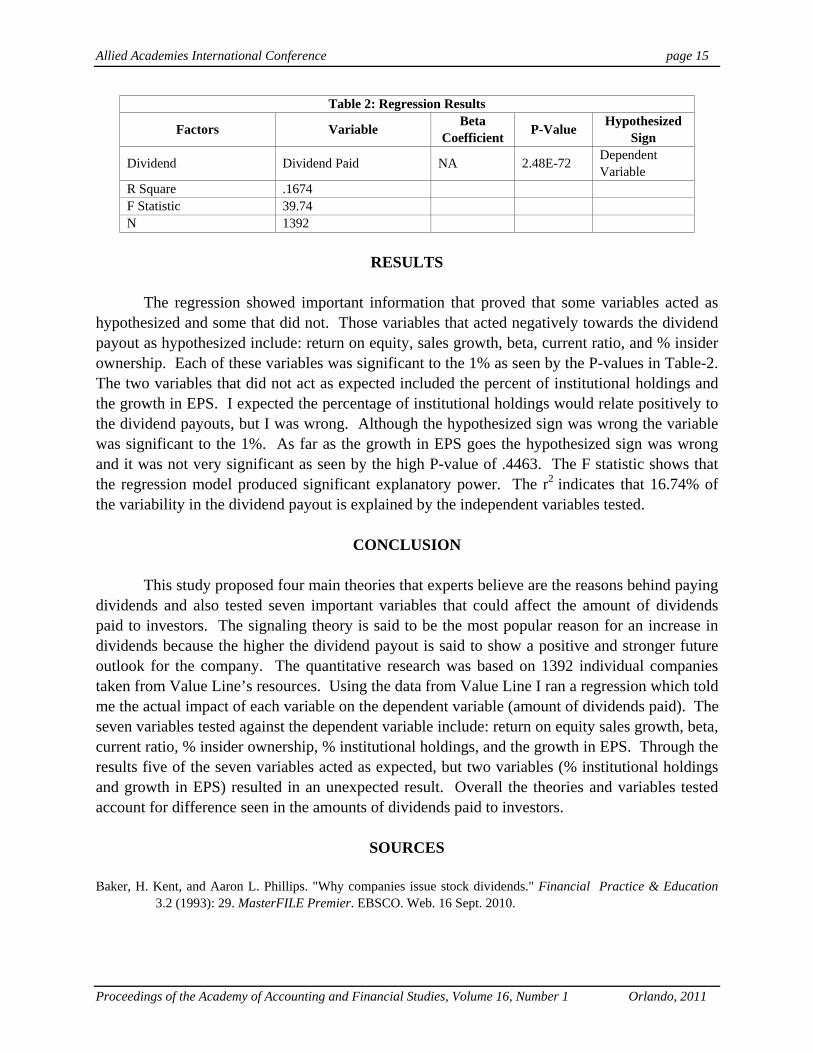
Table 2: Regression Results
Factors Variable Beta Coefficient P-Value Hypothesized
Sign
Dividend Dividend Paid NA 2.48E-72 Dependent Variable
R Square .1674 F Statistic 39.74 N 1392
RESULTS
The regression showed important information that proved that some variables acted as hypothesized and some that did not. Those variables that acted negatively towards the dividend payout as hypothesized include: return on equity, sales growth, beta, current ratio, and % insider ownership. Each of these variables was significant to the 1% as seen by the P-values in Table-2. The two variables that did not act as expected included the percent of institutional holdings and the growth in EPS. I expected the percentage of institutional holdings would relate positively to the dividend payouts, but I was wrong. Although the hypothesized sign was wrong the variable was significant to the 1%. As far as the growth in EPS goes the hypothesized sign was wrong and it was not very significant as seen by the high P-value of .4463. The F statistic shows that the regression model produced significant explanatory power. The r2 indicates that 16.74% of the variability in the dividend payout is explained by the independent variables tested.
CONCLUSION This study proposed four main theories that experts believe are the reasons behind paying dividends and also tested seven important variables that could affect the amount of dividends paid to investors. The signaling theory is said to be the most popular reason for an increase in dividends because the higher the dividend payout is said to show a positive and stronger future outlook for the company. The quantitative research was based on 1392 individual companies taken from Value Line’s resources. Using the data from Value Line I ran a regression which told me the actual impact of each variable on the dependent variable (amount of dividends paid). The seven variables tested against the dependent variable include: return on equity sales growth, beta, current ratio, % insider ownership, % institutional holdings, and the growth in EPS. Through the results five of the seven variables acted as expected, but two variables (% institutional holdings and growth in EPS) resulted in an unexpected result. Overall the theories and variables tested account for difference seen in the amounts of dividends paid to investors.
SOURCES Baker, H. Kent, and Aaron L. Phillips. "Why companies issue stock dividends." Financial Practice & Education
3.2 (1993): 29. MasterFILE Premier. EBSCO. Web. 16 Sept. 2010.
page 16 Allied Academies International Conference
Orlando, 2011 Proceedings of the Academy of Accounting and Financial Studies, Volume 16, Number 1
Baker, Kent H, Aaron L. Phillips, and Gary E. Powell. "The Stock Distribution Puzzle: A Synthesis of the Literature on Stock Splits and Stock Dividends." Print.
"Distibuting excess cash: the role of specially designated dividends." Financial Services Review. 14.2 (2005): 111.
Print Lasfer, M. Ameziane. "On the Motivation for Paying Scrip Dividends." Financial Management. 26.1 (1997): 62-80.
Print. Kania, Sharon L. "WHAT FACTORS MOTIVATE THE CORPORATE DIVIDEND DECISION?" (2005): Print.
Allied Academies International Conference page 17
Proceedings of the Academy of Accounting and Financial Studies, Volume 16, Number 1 Orlando, 2011
BEHAVIOR OF MONTHLY CHANGES OF DJIA: 1896 TO 2008
Shaikh A. Hamid, Southern New Hampshire University
Tej Dhakar, Southern New Hampshire University
ABSTRACT We have explored three types of monthly anomalies in the DJIA for the period 1896 to 2008, and for four subperiods delineated based on structural changes in the economy. The only significant month effect occurred in September (mean of monthly percentage changes being negative and significantly less than for the other eleven months). The mean monthly change of September was negative for the entire data set as well as for each subperiod. However, the negative September effect was significant not in the first three subperiods, rather in the last subperiod, as well as for the entire data set. Two of the subperiods exhibited negative February effect at 3% level. For the entire data set, negative February effect was at a level of significance of 6.6% level. In the third subperiod, positive December effect was significant at 1% level, whereas it was significant at 8.8% level in the last subperiod. The negative September effect does not go away if we delete monthly changes of ±15% and ±10%. We also find that the negative September effect is more a result of the second half of September than first half. The second half of December experienced the highest mean change (1.51%) which was significantly higher than for the other 23 half-month periods, and the standard deviation was significantly lower compared to the other periods. We find the month effect varies with the time period we consider. One would expect the DJIA stocks to be free from seasonal patterns since each one of them are closely followed by a large number of analysts, and the existence of month effect would be surprising. However, given that no consistent pattern is detectable is a reflection of efficiency of the DJIA stocks to a large degree. We will add results from bootstrapping methodology to analyze if the negative September effect is validated by a very large data set.

page 18 Allied Academies International Conference
Orlando, 2011 Proceedings of the Academy of Accounting and Financial Studies, Volume 16, Number 1
Allied Academies International Conference page 19
Proceedings of the Academy of Accounting and Financial Studies, Volume 16, Number 1 Orlando, 2011
A MODEL TO EVALUATE DIVISIONAL MANAGERS WITHIN THE GENERALLY ACCEPTED ACCOUNTING
PRINCIPLES FRAMEWORK
John Hathorn, Metropolitan State College of Denver Gregory Clifton, Metropolitan State College of Denver
Letitia Pleis, Metropolitan State College of Denver
ABSTRACT
This paper develops a performance metric for the evaluation of divisional managers that is based on generally accepted accounting principles. We show that is possible for a decentralized entity to adopt an economic value concept within the parameters of the accounting framework. This is achieved when the head office leases the assets to the division at the rate of return implicit in the capital budget proposal. If the divisional managers performance is as per the proposal then the residual cash flow at the end of each accounting period will be zero. By linking the performance measure to the capital budgeting process we ensure that the divisional managers do not significantly overestimate their cash flow projections since this will be captured by the performance metric. We also prove that our model is robust regardless of whether the head office chooses to classify the arrangement as an operating or a capital lease.

page 20 Allied Academies International Conference
Orlando, 2011 Proceedings of the Academy of Accounting and Financial Studies, Volume 16, Number 1
Allied Academies International Conference page 21
Proceedings of the Academy of Accounting and Financial Studies, Volume 16, Number 1 Orlando, 2011
ACCOUNTING FOR THE PARTIAL SALE OF OWNERSHIP INTERESTS WHEN THE PARENT
RETAINS CONTROL
John Hathorn, Metropolitan State College of Denver
ABSTRACT In December 2007, the Financial Accounting Standards Board (FASB) issued Statement of Financial Accounting Standards 160, Noncontrolling interests in consolidated financial statements, which is now incorporated in Accounting Standards Codification (ASC) 810. The philosophy behind the FASB recommendations is the fair value concept or what is termed the acquisition method. Under this concept, the consolidated group is considered to be one economic unit for financial reporting purposes (Moonitz, 1942, 1951). The acquired business is consolidated in total regardless of the percentage of controlling ownership of the acquiring company. This approach incorporates the full fair value of the net assets of the subsidiary at the date of acquisition and noncontrolling interests are considered part of owners’ equity. One outcome of the adoption of the economic unit approach is that changes in the ownership interests, when the parent retains control, are considered equity transactions. This means that, from the group perspective, no gain or loss can be recognized as a result of a sale where ownership is retained. The purpose of this paper is to clarify and demonstrate the correct way to account for equity transaction sales in the books of the parent company and on consolidation.

page 22 Allied Academies International Conference
Orlando, 2011 Proceedings of the Academy of Accounting and Financial Studies, Volume 16, Number 1
Allied Academies International Conference page 23
Proceedings of the Academy of Accounting and Financial Studies, Volume 16, Number 1 Orlando, 2011
A DEMOGRAPHIC STUDY OF POLISH ATTITUDES TOWARD TAX EVASION
Adriana M. Ross, Florida International University
Robert W. McGee, Florida International University
ABSTRACT A number of studies have examined the relationship between tax collection and various demographic variables. However, until recently most of those studies have involved a United States sample population. The Internal Revenue Service provides demographic data for researchers on a regular basis. The present study goes beyond those studies in several important ways. For one, it uses data on Poland taken from the World Values database. Not much work has been done on the post-communist Polish tax or public finance system. Thus, the present study expands on the very limited research done on Polish public finance. The present study expands on existing literature in at least two other ways as well. For one, it examines how various demographics interact with attitudes toward tax evasion. Secondly, we examine several demographic variables that were not examined in prior studies. One of the questions in the World Values database asked whether it would be justifiable to cheat on taxes if it were possible to do so. Respondents were asked to choose a number from 1 to 10 to indicate the extent of their support for tax evasion. This study examines those responses, both overall and through the prism of more than 20 demographic variables. A trend analysis is also done to determine whether Polish attitudes regarding tax evasion have changed in recent years. A comparison is made with other ethical issues to determine the relative seriousness of tax evasion. The study found that attitudes toward the justifiability of tax evasion often do vary by demographic variable. Tax evasion was found to be a less serious offense than wife beating, accepting a bribe or claiming government benefits to which you are not entitled and more serious than avoiding a fare on public transport or prostitution. Tax evasion has become less justifiable since the dismantling of the Berlin Wall but the trend has not been linear. Although the present study focuses on Poland, the methodology used in the present study could serve as a template for research on other countries or regions.
INTRODUCTION Many studies have been conducted in various areas of taxation and public finance. Practitioner journals focus on technical aspects of the tax code. Legal journals examine the tax code and various court cases. Economics and public finance journals emphasize the microeconomic and macroeconomic aspect of various tax systems. A few studies have examined ethical aspects of tax systems, most notably the issue of tax fairness or tax evasion.
page 24 Allied Academies International Conference
Orlando, 2011 Proceedings of the Academy of Accounting and Financial Studies, Volume 16, Number 1
The present study examines Polish attitudes on the ethics of tax evasion. Most prior studies on tax evasion have taken a technical approach. Scholars have examined some factors that enhance or deter tax evasion. Some studies have even speculated on how to determine optimal tax evasion by weighing the relative costs and benefits of attempting to deter tax evasion. A number of studies have examined various demographic variables in connection with tax collection and tax evasion. Most of these studies, until recently at least, have involved a USA sample population, mostly because the U.S. Internal Revenue Service publishes data for scholarly research on a regular basis. Non-U.S. studies that examine demographic variables are far less common, partly because of a lack of data. Social scientists have gathered the Human Beliefs and Values survey data in more than 80 countries. The surveys asked hundreds of questions on a wide variety of topics. One question involved attitudes toward tax evasion. The present study uses the data gathered from the Polish sample in the most recent survey. The vast majority of prior tax evasion studies have not examined the issue of when, or whether tax evasion is ethical. The underlying assumption may be that tax evasion is always unethical, or perhaps the scholars conducting the study may not recognize ethical aspects of tax evasion as a topic they wish to examine or discuss, especially if their study involves some technical issues that apparently have little or nothing to do with ethics. That may account for the relative lack of ethical discussion for tax evasion studies. However, a body of literature exists on the ethics of tax evasion. Most of it has appeared in the philosophical literature, which may be one reason why studies that have appeared in accounting, tax, economics or public finance journals have not addressed the ethical issues that are inherent in tax evasion. The present study attempts to partially correct that oversight in the literature review section. Prior studies, both in the United States and elsewhere, either have not examined demographic variables in connection with tax collections or tax evasion, or have limited themselves to a few demographic variables, such as gender, age and income levels. The present study goes beyond those three variables. It includes more than 20 demographic variables, several of which have not been examined in prior studies. The present study also compares attitudes toward tax evasion in Poland over time to see whether there is a trend either toward or away from justifying tax evasion. The relative seriousness of tax evasion is also determined by comparing attitudes on tax evasion to attitudes on some other ethical issues that were gathered in the World Values surveys.
METHODOLOGY Groups of social scientists all over the world have been conducting coordinated surveys of the world’s population since the 1980s. Some surveys have solicited the opinions of more than 200,000 people in more than 80 countries. The surveys included hundreds of questions on a wide range of subjects. One question in the most recent surveys addressed attitudes toward tax evasion:
Allied Academies International Conference page 25
Proceedings of the Academy of Accounting and Financial Studies, Volume 16, Number 1 Orlando, 2011
Please tell me for each of the following statements whether you think it can always be justified, never be justified, or something in between: Cheating on taxes if you have a chance. The range of responses used a 10-point Likert Scale where 1 = never justifiable and 10 = always justifiable. The surveys collected data on a number of demographic variables, including level of education, gender and age. The present study uses the data gathered in the most recent survey on Poland. More that 20 demographic variables are examined using t-tests and ANOVAs to determine whether any differences are significant at the 5 percent level. The ANOVA was used to analyze mean score differences between groups as a whole. The ANOVA scores are reported in the “b” tables. T-tests were sometimes made to compare the mean scores of two particular groups. Those scores, where made, are reported in the “a” tables.
FINDINGS The findings are presented below by demographic variable. The sample size for the age variable was 949. Sample sizes for the other demographic variables were about the same but varied somewhat, depending on variable. Age H1: There is no relationship between age and views on the justifiability of tax evasion. H1: Rejected. Education Level H2: There is no relationship between level of education and views on the justifiability of tax evasion. H2: Rejected. Employment Status H3: There is no relationship between employment status and views on the justifiability of tax evasion. H3: Rejected. Gender H4: There is no relationship between gender and views on the justifiability of tax evasion. H4: Cannot be rejected. Income H5: There is no relationship between income level and views on the justifiability of tax evasion. H5: Rejected. Institution of Occupation H6: There is no relationship between institution of occupation and views on the justifiability of tax evasion. H6: Rejected. Occupation H7: There is no relationship between occupation and views on the justifiability of tax evasion. H7: Rejected.
page 26 Allied Academies International Conference
Orlando, 2011 Proceedings of the Academy of Accounting and Financial Studies, Volume 16, Number 1
Marital Status H8: There is no relationship between marital status and views on the justifiability of tax evasion. H8: Rejected. Number of Children H9: There is no relationship between number of children and views on the justifiability of tax evasion. H9: Rejected. Religious Practice H10: There is no relationship between religious practice and views on the justifiability of tax evasion. H10: Rejected. Size of Town
H11: There is no relationship between the size of the town where a person lives and views on the justifiability of tax evasion.
H11: Rejected. Social Class H12: There is no relationship between social class and views on the justifiability of tax evasion. H12: Cannot be rejected. Feeling of Happiness
H13: There is no relationship between how happy a person feels and views on the justifiability of tax evasion.
H13: Cannot be rejected. State of Health
H14: There is no relationship between the state of a person’s health and views on the justifiability of tax evasion.
H14: Rejected. Self Positioning in Political Scale H15: There is no relationship between a person’s position on the political scale and views on the
justifiability of tax evasion. H15: Cannot be rejected. Income Equality
H16: There is no relationship between a person’s view on income equality and views on the justifiability of tax evasion. H16: Rejected.
Private vs. State Ownership of Business
H17: There is no relationship between a person’s view on the ownership of business and views on the justifiability of tax evasion. H17: Cannot be rejected (generally).
Allied Academies International Conference page 27
Proceedings of the Academy of Accounting and Financial Studies, Volume 16, Number 1 Orlando, 2011
Government Responsibility H18: There is no relationship between a person’s view on government responsibility and views on the justifiability of tax evasion. H18: Cannot be rejected.
Competition – Good or Harmful
H19: There is no relationship between a person’s views on the harmfulness or beneficial effects of competition and views on the justifiability of tax evasion. H19: Rejected.
Hard Work Brings Success
H20: There is no relationship between a person’s view on the relationship between hard work and success and views on the justifiability of tax evasion. H20: Cannot be rejected.
Wealth Accumulation
H21: There is no relationship between a person’s view on wealth accumulation and views on the justifiability of tax evasion. H21: Cannot be rejected.
Confidence in Government
H22: There is no relationship between a person’s confidence in government and views on the justifiability of tax evasion. H22: Rejected.
Confidence in the Justice System
H23: There is no relationship between a person’s confidence in the justice system and views on the justifiability of tax evasion. H23: Rejected.
CONCLUDING COMMENTS
This study found several interesting relationships between attitude toward tax evasion and 23 demographic variables. It is perhaps the most comprehensive demographic study of the Polish tax system done to date examining the relationship between certain demographic variables and attitude toward tax evasion. The methodology used in this study can also serve as a template for studies of other countries and regions. Some of the demographic variables included in this study have not been used in prior studies, which breaks new ground and may serve as the basis for further research into these variables.

page 28 Allied Academies International Conference
Orlando, 2011 Proceedings of the Academy of Accounting and Financial Studies, Volume 16, Number 1
Allied Academies International Conference page 29
Proceedings of the Academy of Accounting and Financial Studies, Volume 16, Number 1 Orlando, 2011
MANAGING RISK IN UNCERTAIN TIMES: HOW INTERNAL AUDIT CAN HELP
Gary P. Schneider, Quinnipiac University
Aamer Sheikh, Quinnipiac University Kathleen A. Simione, Quinnipiac University
ABSTRACT In recent years, companies have faced increased levels of uncertainty in their operating environments. After two bubbles (technology and housing), a financial crisis, a recession that approached Great Depression levels, lingering unemployment, wildly fluctuating raw commodity and oil prices, and unpredictable political upheavals, managers are seeking ways to control risk without missing opportunities that involve risk. This paper examines how such increased uncertainty gives the internal audit function an evolving role in helping management identify and maintain appropriate levels of risk exposure.
INTRODUCTION Internal audit departments, introduced into U.S. firms after World War II, were usually rather small operations that performed complaince work and tested internal controls (Flesher, 1991). The responsibilities and scope of operations of internal audit departments expanded dramatically with the enactment of the Foreign Corrupt Practices Act (FCPA, 1977). That legislation provided, among other things, severe penalties for executive officers of companies found to have insufficient systems of internal control in place. The prospect of these penalties motivated top managers to increase funding for internal audit so they could be confident that their internal control systems were sufficient to defend against prosecution under the FCPA (Flesher, 1991). In response to the expanded role of internal auditors, the Institute of Internal Auditors (IIA), the professional organization that sets standards for the work of internal auditors, underwent its own evolution. Operating as the generally recognized international governing body for internal auditors, the IIA continues to establish guidelines and create training materials based on research that it funds through its foundation (Flesher, 1991). In the decade following the enactment of the FCPA, the role of internal auditors grew beyond the review of controls to include providing assurances that internal organization policies were being followed and laws were being obeyed. As the importance of internal audit departments grew, many organizations identified the benefits of having them act more independently. Increasingly, fewer internal audit departments were reporting to chief financial officers and more were reporting to the board of directors or the audit committee of the board of directors (Moeller, 2009).
page 30 Allied Academies International Conference
Orlando, 2011 Proceedings of the Academy of Accounting and Financial Studies, Volume 16, Number 1
INTERNAL AUDITORS AND RISK MANAGEMENT In subsequent years, further developments such as the enactment of Sarbanes-Oxley (2002) and the creation of the Public Companies Accounting Oversight Board (PCAOB) caused internal audit departments to expand their activities to include risk assessment (Hass and Burnaby, 2010). Today, internal audit departments provide assurance and consulting services to management regarding the achievement of business risk goals as often as they engage in their traditional roles as testers of internal controls and assessors of compliance with organizational policies and external regulations (Moeller, 2009).
ELEMENTS OF RISK MANAGEMENT Risk management is the process an organization has for setting risk objectives (also called risk appetite) and for identifying, analyzing, assessing, and controlling those risks. One commonly used formal definition of risk management is as follows: “a process, effected by an entity’s board of directors, management, and other personnel, applied in strategy setting and across the enterprise, designed to identify potential events that may affect the entity, and manage risk to be within its risk appetite, to provide reasonable assurance regarding the achievement of entity objectives” (COSO, 2004, 2). Risk has become one of the greatest concerns of senior management in recent years because shareholder activism and the high expectations of the financial markets demand that companies achieve optimal mixtures of risk. In response to this concern, a wide array of financial and business have issued white papers, guidance, and standards related to the growing importance of comprehensive, enterprise-wide risk management initiatives and monitoring systems (COSO, 2004, Deloitte, 2010; Frigo and Anderson, 2011; KPMG, 2009; Moeller, 2009). An optimal risk appetite accepts certain risks so that above-average returns can be generated and allows the company to engage in risky behavior to pursue opportunities that arise. An ideal risk appetite prevents the company from unnecessary exposure to unwarranted risks yet does not impair its ability to remain competitive (Deloitte, 2009). Bond rating agencies and equity analysts regularly assess the appropriateness of individual company’s risk exposure as part of their analyses (Hespenheide, Pundmann, and Corcoran, 2007). Dickhart (2008) agrees that risk management has become an integral part of the governance process and cites the frequent use of the phrase governance, risk, and compliance (GRC) as indicating the importance that effective risk management now plays in achieving effective corporate governance.
RESPONSIBILITY FOR RISK MANAGEMENT The involvement of line and senior managers in establishing the parameters of the risk appetite is important, although costly. These costs are more than offset by the gains in collective organizational knowledge gained by the results of the risk management effort. The ability of the company to achieve its long-term strategic objectives is enhanced tremendously by such efforts (Burnaby and Hass, 2009).
Allied Academies International Conference page 31
Proceedings of the Academy of Accounting and Financial Studies, Volume 16, Number 1 Orlando, 2011
Financial managers play key roles in setting risk appetite, promoting compliance with risk appetite levels, managing risks within their areas of responsibility, and reporting risks they identify (Bekefi, Epstein, and Yuthas; 2008). Once management determines the risk appetite, the company must assess identified risks and opportunities, then develop strategies that exploit the opportunities and minimize the exposure to unnecessary or avoidable risk (Frigo and Anderson, 2009). Although managers can develop the risk appetite and formulate strategies for dealing with identified risks in consultation with the internal audit department, they must understand that they are responsible for the final decisions in these areas (Spira and Page, 2003). Internal audit cannot set risk appetite, nor can it finalize strategies for dealing with the outcomes of the risk management process. To do so would impair the independence of the internal audit function (Moeller, 2009). The role of the internal audit function is to provide assurance and consulting services related to evaluation of the effectiveness of their companies’ governance, risk, and control processes (Moeller, 2009). Internal auditors are required to understand the interrelationship among all three as they operate together in an overall process (Dickhart, 2008). Internal auditors can help financial managers to establish effective governance processes by providing advice and coordinating the management, assessment, and monitoring of risks. They can also assess control activities related to specific risks (KPMG, 2009). When performing control testing and evaluation of particular departments or processes, internal auditors can make inquiries of management regarding the quality of specific risk assessment procedures and the level of coordination undertaken with related departments (Dickhart, 2008). In some cases, it is helpful for the internal audit director to serve as an advocate for risk management awareness within the organization. Although many companies have undertaken risk management initiatives, a significant number have either not undertaken them or have underfunded and understaffed them (KPMG, 2009).
SUMMARY AND CONCLUSIONS Internal auditors have particular skills that they bring to the task of risk management, including their experience with information technology and summarizing findings into meaningful assurance reports for top management and boards of directors. By integrating their efforts with those of line and financial managers in the organization, internal auditors can contribute in important ways to the evolution of an effective risk monitoring and management process in their organizations.
REFERENCES Bekefi, T., M. Epstein, and K. Yuthas. (2008). Creating growth: Using opportunity risk management effectively.
Journal of Accountancy, June, 72-78. Burnaby, P. and S. Hass. (2009). Ten steps to enterprise-wide risk management. Corporate Governance, 9(5), 539-
545.
page 32 Allied Academies International Conference
Orlando, 2011 Proceedings of the Academy of Accounting and Financial Studies, Volume 16, Number 1
Committee of Sponsoring Organizations of the Treadway Commission (COSO). (2004). Enterprise risk management: Integrated framework. New York: COSO.
Deloitte. (2009). Risk intelligence in a downturn: Balancing risk and reward in volatile times. London: Deloitte
Touche Tohmatsu Limited. Deloitte. (2010). Global risk management survey, seventh edition. London: Deloitte Touche Tohmatsu Limited. Dickhart, G. (2008). Risk: Key to governance. The Internal Auditor, 65(6), December, 27-34. Flesher, D. (1991). The Institute of Internal Auditors: Fifty years of progress through sharing. Altamonte Springs,
FL: Institute of Internal Auditors. Foreign Corrupt Practices Act (FCPA). (1977) 15 USC 78. Frigo, R. and J. Anderson. (2009). Strategic GRC: Ten steps to implementation. The Internal Auditor, 66(3), June,
33-38. Frigo, R. and J. Anderson. (2011). Embracing enterprise risk management: Practical approaches for getting started.
New York: Committee of Sponsoring Organizations of the Treadway Commission. Hass, S. and P. Burnaby. (2010). The evolution of important competencies and knowledge for internal auditors in
the United States. Internal Auditing, 25(6), November/December, 3-14. Hespenheide, E., S. Pundmann, and M. Corcoran. (2007). Risk intelligence: Internal auditing in a world of risk.
Internal Auditing, 22(4), July/August, 3-8. Institute of Internal Auditors (IIA). (2004). Position statement: The role of internal audit in enterprise-wide risk
management. Altamonte Springs, FL: IIA. Institute of Internal Auditors Global Audit Information Network (IIAGAIN). (2009). A world in economic crisis:
Key themes for refocusing internal audit strategy. Altamonte Springs, FL: IIAGAIN. KPMG. (2009). KPMG Survey: Many enterprise risk management programs lack fundamentals. New York: KPMG,
LLP. Moeller, R. (2009). Brink’s modern internal auditing: A common body of knowledge. New York: Wiley. Pundmann, S. and J. Peirson. (2009). Achieving risk intelligence in volatile times. Internal Auditing, 24(4)
July/August, 3-8. Sarbanes-Oxley Act (2002). PL 107-204, 116 Stat 745. Spira, L. and M. Page. (2003) Risk management: The reinvention of internal control and the changing role of
internal audit. Accounting, Auditing & Accountability Journal, 16(4), 640-661.
Allied Academies International Conference page 33
Proceedings of the Academy of Accounting and Financial Studies, Volume 16, Number 1 Orlando, 2011
JUST-IN-TIME INVENTORY MANAGEMENT AND ITS FINANCIAL PERFORMANCE: CASES OF DELL AND
WALMART
Seungjae Shin, Mississippi State University, Meridian Kevin L. Ennis, Mississippi State University, Meridian
Harold D. White, Mississippi State University, Meridian
ABSTRACT JIT is an innovative approach to reduce operating costs with the control of inventory. With the help of the Internet and IT technology, the efficiency of the JIT inventory system has increased. Some of the well-known JIT inventory case studies are Dell computer and Walmart. In their annual reports, trends of inventory assets and gross profit are investigated, and cost efficiency of JIT inventory systems is confirmed.

page 34 Allied Academies International Conference
Orlando, 2011 Proceedings of the Academy of Accounting and Financial Studies, Volume 16, Number 1
Allied Academies International Conference page 35
Proceedings of the Academy of Accounting and Financial Studies, Volume 16, Number 1 Orlando, 2011
HOW DO SMALL FIRMS USE FINANCIAL STATEMENTS?
Howard Van Auken, Iowa State University
Shawn M. Carraher, Minot State University/Severson Entrepreneurship Academy
ABSTRACT
Financial statements are prepared so that the financial information can be used by stakeholders to better understand and mange the firm. An important aspect of using financial statements is to help make better decisions, especially as related to the financial impact of the decisions. Effective interpretation and use of financial statements is important because poor financial capitalization is a leading cause for small firm failure (Coleman, 2000 and Carter and Van Auken, 2005). Because poor decisions can lead to financial stress and failure, the role of financial statements is central to maintaining firm competitiveness and solvency (Coleman, 2000; Wiklund and Shepherd, 2005). In this paper we examined factors associated with whether SME owners: (1) use financial statements and (2) comfort with their ability to interpret financial statements. Both issues are important to examine because of the importance of financial statements among all stakeholders. The vast majority of the research on the use of financial information and financial statements has been focused on large firms. There appears to be few papers on how SMEs use financial statements in making decisions (Shields, 2010).
INTRODUCTION The financial impact of firm decisions can present some of the greatest challenges to firms, but are important to viability. The importance of the financial impact of decisions is evident from the role of poor financial management in the high failure rate among small firms (van Praag, 2003). Owners of small firms often lack strong business skills and thus have a weak understanding of the impact of their decisions on the financial impact of their decisions. Inappropriate decisions can threaten a small firm's financial viability in a way that can affect all areas of the firm’s operations, creating problems such as unreliable operations, ineffective marketing, and inability to hire qualified personnel (Timmons and Spinelli, 2004). Financial statement information can provide valuable information to managers in making decisions and is used for both planning and control. Planning incorporates selecting a performance measure and selecting a goal over a specified time period (Garrison, et al, 2010; Horngren et al, 2009). Financial statements provide information for SMEs to manage their business using detailed, and economically relevant information that is needed to operate a business efficiently and effectively (Shields, 2011). Few published studies have examined the use of financial statements by small businesses. Holmes and Des Nichols (1988) found that the annual use of balance sheets, cash flow statements, and income statements was associated with firm characteristics demographics.
page 36 Allied Academies International Conference
Orlando, 2011 Proceedings of the Academy of Accounting and Financial Studies, Volume 16, Number 1
McMahon (2001) reported evidence that comprehensive financial statements were associated with higher annual revenue. Lack of financial skills can signal a need for and provide an opportunity for or businesses to provide training on how to use financial statements when making decisions (Bressler and Bressler, 2006). Early work by McMahon (2001) and McMahon and Holmes (1991) suggested that larger firms are more financially sophisticated than SMEs. Additionally, SMEs that have more employees have greater revenue use more varied and more frequent financial reports because of their internal needs. His research suggested a lack of evidence for growth and/or performance benefits from using sophisticated financial reporting, and that pragmatic owners likely expect a higher growth rate and improved financial performance before adopting many available financial reports. The quality of information available to owners of small firms impacts the effectiveness of their decisions (Berger and Udell, 1998; Gibson, 1992). In appropriate use or not using financial statements can also affect the risk structure of the small firm because of the associated impact on firm operations. Risk assessment by associated with poor decisions can ultimately affect the possibility of the firm not being able to meet obligations (Cassar, 2004). Because many business owners are not knowledgeable about issues related to the impact of decisions on their firms, they may accept business risks greater than the potential rewards from the business (Van Auken, 2001). Busenitz and Barney (1997) noted that entrepreneurs may underestimate risk due to their limited experience and over-confidence. Small firms are especially vulnerable to the impact of poor financial decisions because of their limited resources. Good information is the basis for making good. However, entrepreneurs must often make decisions before all the necessary information is available. A questionnaire was developed during fall, 2010. In addition to the findings from a focus group discussions, the questionnaire was based on past research on small firm financing decisions, including Van Auken (2005), Carter and Van Auken (2005), Busenitz et al, (2003), Kuratko, Hornsby, and Naffiziger (1997), McMahon and Stanger (1995), Petty and Bygrave (1993), and Ang (1992). The final questionnaire was pre-tested and further revised. The questionnaire consisted of two sections: (1) demographic information and (2) information associated with use and understanding of financial statements. The first section asked respondents about characteristics of their firms, including the age of the business, organizational structure, type of firm, total assets, gender of owner, revenue. The second section of the questionnaire asked respondents their use of financial statement, including frequency of financial statement preparation, confidence in the accuracy of the financial statements, and ability to interpret financial statement information. The sample consisted of small firms located in a southwestern state and was designed to represent the structure of the region following the stratified sampling principles in finite population. The southern tier of the state was initially segmented into districts. Subsequently, ten small firms within each district were selected to participate in the study. Business owners were then contacted by telephone to determine if they would participate. If the business owner declined, then another business from the district was contacted. Owners were used for the study because of their importance as decision makers and their perceptions shape strategic behavior (Van Gills, 2005; O’Regan and Sims (2008)). This process resulted in a total of 312 useable questionnaires. Isolating the sample to a single state
Allied Academies International Conference page 37
Proceedings of the Academy of Accounting and Financial Studies, Volume 16, Number 1 Orlando, 2011
has several advantages. First, this focus facilitates data collection. This benefit is especially relevant in the context of regional differences that might exist among owners of small firms. Second, using data from a single state minimizes the number of extraneous variables. For example, various states have different educational programs, different levels of support for small firms, and variations in banking practices associated with financial statement requirements (Carter and Van Auken, 2005). The results were initially summarized using univariate statistics to provide a better understanding of the respondents and characteristics of the responding companies. Percentages for categories were calculated for educational level of owner, gender, type of business, total assets, and revenue. T-tests of differences in mean rankings were also calculated that compared responses by owners that did versus those that did not use financial statements to make decisions were calculated. Spearman correlations between the independent variables were calculated to assess the significance of relationships between the control and independent variables. Because no significant correlations exist between the independent variables, multicollinearity was not a problem. Spearman correlations coefficient estimation is a non-parametric technique based on ranks rather than value of responses. This non-parametric technique was used because of uncertainty about the population distribution. Two regression models were used in the analysis. The first regression used generalized least squares analysis to examine the relationship between the owners’ comfort in using financial statements to make decisions (dependent variable; 1-7 Likert scale ranking) and whether financial statements are prepared internally or externally (independent variable), level of revenue (independent variable), how often the financial statements were prepared (independent variable), and education (control variable). The second regression used logit regression analysis to examine the relationship between whether owners used financial statements to make decision (dependent variable) and the owner’s comfort with interpreting financial statements (independent variable), ), how often the financial statements were prepared (independent variable), level of revenue (independent variable)education (control variable). The two regression model were: OC = a0 + b1Prep+ b2Rev + b3Fin + b4Edu UD = a0 + b1OC + b2Prep + b3Rev + b4Edu where: OC = Owners’ Comfort in Using Financial Statements to Make Decisions UD = Whether Financial Statements Used to Make Decisions Prep = Whether financial statements are prepared internally or externally (1=internal and 2=external) Edu = Owner’s Level of Education Rev = Firm’s Total Revenue During Previous Year Fin = How Often Financial Statements Are Prepared
page 38 Allied Academies International Conference
Orlando, 2011 Proceedings of the Academy of Accounting and Financial Studies, Volume 16, Number 1
REFERENCES Buckley, M., Carraher, S.M., & Cote, J. (1992). Measurement issues concerning the use of inventories of job
satisfaction. Educational and Psychological Measurement, 52, 529-542. Buckley, M., Fedor, D., Carraher, S.M., Frink, D., & Marvin, D. (1997). The ethical obligation to provide recruits
realistic job previews. Journal of Managerial Issues, 9 (4), 468-484. Buckley, M., Fedor, D., Veres, J., Wiese, D., & Carraher, S.M. (1998). Investigating newcomer expectations and
job-related outcomes. Journal of Applied Psychology, 83, 452-461. Buckley, M., Mobbs, T., Mendoza, J., Novicevic, M., Carraher, S.M., & Beu, D. (2002). Implementing realistic job
previews and expectation lowering procedures: A field experiment. Journal of Vocational Behavior 61 (2), 263-278.
Budd, J. & Carraher, S.M. (1998). Validation of an inventory to measure attributes of strategic management.
Psychological Reports, 82 (3 Pt 2), 1220-1222. Carland, J & Carland, J. (1995). The case of the reluctant client. Journal of the International Academy for Case
Studies, 1(2), 76-79. Carland, J. & Carland, J. (1997). A model of potential entrepreneurship: Profiles and educational implications.
Journal of Small Business Strategy, 8 (1), 1-13. Carland, J. & Carland, J. (2003). Pawn takes queen: The strategic gameboard in entrepreneurial firms. Academy of
Strategic Management Journal, 2, 93-104. Carland, J. & Carland, J. (2004). Economic development: Changing the policy to support entrepreneurship.
Academy of Entrepreneurship Journal, 10(2), 104-114. Carland, J. & Carland, J. (2006). Eminent domain: What happens when the state takes part of your land? The
Entrepreneurial Executive, 11, 95-113. Carland, J.A., Carland, J.W., & Stewart, W.H. (1996). Seeing what’s not there: The enigma of entrepreneurship.
Journal of Small Business Strategy 7 (1), 1-20. Carland, J., Carland, J., & Carland, J. (1995). Self-actualization: The zenith of entrepreneurship. Journal of Small
Business Strategy, 30-39. Carland, J.W., Carland, J.A., Hoy, F., & Boulton, W.R. (1988). Distinctions between entrepreneurial and small
business ventures. International Journal of Management, 5 (1), 98-103. Carland, J.W. III, Carland, J.W., Carland, J.A., & Pearce, J.W. (1995). Risk taking propensity among
entrepreneurs, small business owners and managers. Journal of Business and Entrepreneurship, 7 (1), 12-23.
Carland, J.W., Hoy, F., Boulton, W.R., & Carland, J.A.C. (1984). Differentiating entrepreneurs from small
business owners: A conceptualization. Academy of Management Review, 9 (2), 354-359. Carland, J.W., Hoy, F., & Carland, J.A.C. (1988). Who is an entrepreneur? is the wrong question. American
Journal of Small Business, 12 (4), 33-39.
Allied Academies International Conference page 39
Proceedings of the Academy of Accounting and Financial Studies, Volume 16, Number 1 Orlando, 2011
Carraher, S.M. (1991). A validity study of the pay satisfaction questionnaire (PSQ). Educational and Psychological
Measurement, 51, 491-495. Carraher, S.M. (1991). On the dimensionality of the pay satisfaction questionnaire. Psychological Reports, 69,
887-890. Carraher, S.M. (1993). Another look at the dimensionality of a learning style questionnaire. Educational and
Psychological Measurement, 53 (2), 411-415. Carraher, S.M. (1995). On the dimensionality of a learning style questionnaire. Psychological Reports, 77 (1), 19-
23. Carraher, S.M. (2003). The father of cross-cultural research: An interview with Geert Hofstede. Journal of Applied
Management & Entrepreneurship, 8 (2), 97-106. Carraher, S.M. (2005). An Examination of entrepreneurial orientation: A validation study in 68 countries in
Africa, Asia, Europe, and North America. International Journal of Family Business, 2 (1), 95-100. Carraher, S. (2006). Felt fair pay of small to medium sized enterprise (SME) owners in Switzerland: An
examination of Jaques’ equity construct. Journal of International Business and Entrepreneurship Development, 3 (1/2), 109-120.
Carraher, S.M. (2009). Business Education Accreditation and the Changing Global Marketplace: John Fernandes of
AACSB. Journal of Applied Management & Entrepreneurship, 14 (1), 128-138. Carraher, S.M. (2011). Turnover prediction using attitudes towards benefits, pay, and pay satisfaction among
employees and entrepreneurs in Estonia, Latvia, & Lithuania. Baltic Journal of Management 6 (1), 25-52.
Carraher, S.M., Buchanan, J.K., & Puia, G. (2010). Entrepreneurial Need for Achievement in China, Latvia, and
the USA. Baltic Journal of Management, 5 (3), 378-396. Carraher, S.M. & Buckley, M. R. (1996). Cognitive complexity and the perceived dimensionality of pay
satisfaction. Journal of Applied Psychology, 81 (1), 102-109. Carraher, S.M. & Buckley, M.R. (2008). Attitudes towards benefits and behavioral intentions and their relationship
to Absenteeism, Performance, and Turnover among nurses. Academy of Health Care Management Journal, 4 (2), 89-109.
Carraher, S.M., Buckley, M.R., & Carraher, C. (2002). Cognitive complexity with employees from entrepreneurial
financial information service organizations and educational institutions: An extension & replication looking at pay, benefits, and leadership. Academy of Strategic Management Journal, 1, 43-56.
Carraher, S.M., Buckley, M.R., & Carraher, C.E. (2008). Research challenges in sustainable strategic management:
Change and sustainability. International Journal of Sustainable Strategic Management, 1 (1), 2-15. Carraher, S.M., Buckley, M. & Cote, J. (1999). Multitrait-multimethod information management: Global strategic
analysis issues. Global Business & Finance Review, 4 29-36.
page 40 Allied Academies International Conference
Orlando, 2011 Proceedings of the Academy of Accounting and Financial Studies, Volume 16, Number 1
Carraher, S.M., Buckley, M., & Cote, J. (2000). Strategic entrepreneurialism in analysis: Global problems in research. Global Business & Finance Review, 5 (2), 77-86.
Carraher, S.M., Buckley, M., Scott., C., Parnell, J., & Carraher, C. (2002). Customer service selection in a global
entrepreneurial information services organization. Journal of Applied Management and Entrepreneurship, 7 (2), 45-55.
Carraher, S.M. & Carraher, C. (1994). ISO 9000 - theories of management. Polymer News, 19, 373-376. Carraher, S.M. & Carraher, C. (1996). ISO environmental management standards: ISO 14,000. Polymer News, 21,
167-169. Carraher, S.M. & Carraher, C. (1996). ISO 9000. Polymer News, 21, 21-24. Carraher, S.M. & Carraher, S.C. (2006). Human resource issues among SME’s in Eastern Europe: A 30 month
study in Belarus, Poland, and Ukraine. International Journal of Entrepreneurship. 10, 97-108. Carraher, S.M., Carraher, S.C., & Mintu-Wimsatt, A. (2005). Customer service management in Western and
Central Europe: A concurrent validation strategy in entrepreneurial financial information services organizations. Journal of Business Strategies, 22, 41-54.
Carraher, S.M., Carraher, S.C., & Whitely, W. (2003). Global entrepreneurship, income, and work norms: A seven
country study. Academy of Entrepreneurship Journal, 9, 31-42. Carraher, S.M. & Chait, H. (1999). Level of work and felt fair pay: An examination of two of Jaques' constructs of
felt fair pay. Psychological Reports, 84 (2), 654-656. Carraher, S.M., Hart, D., & Carraher, C. (2003). Attitudes towards benefits among entrepreneurial employees.
Personnel Review, 32 (6), 683-693. Carraher, S.M., Gibson, J. W., & Buckley, M.R. (2006). Compensation satisfaction in the Baltics and the USA.
Baltic Journal of Management, 1 (1), 7-23. Carraher, S.M., Mendoza, J, Buckley, M, Schoenfeldt, L & Carraher, C. (1998). Validation of an instrument to
measure service orientation. Journal of Quality Management, 3, 211-224. Carraher, S.M. & Michael, K. (1999). An examination of the dimensionality of the Vengeance Scale in an
entrepreneurial multinational organization. Psychological Reports, 85 (2), 687-688. Carraher, S.M. & Parnell, J. (2008). Customer service during peak (in season) and non-peak (off season) times: A
multi-country (Austria, Switzerland, United Kingdom and United States) examination of entrepreneurial tourist focused core personnel. International Journal of Entrepreneurship, 12, 39-56.
Carraher, S.M., Parnell, J., Carraher, S.C., Carraher, C., & Sullivan, S. (2006). Customer service, entrepreneurial
orientation, and performance: A study in health care organizations in Hong Kong, Italy, New Zealand, the United Kingdom, and the USA. Journal of Applied Management & Entrepreneurship, 11 (4), 33-48.
Carraher, S.M., Parnell, J., & Spillan, J. (2009). Customer service-orientation of small retail business owners in
Austria, the Czech Republic, Hungary, Latvia, Slovakia, and Slovenia. Baltic Journal of Management, 4 (3), 251-268.
Allied Academies International Conference page 41
Proceedings of the Academy of Accounting and Financial Studies, Volume 16, Number 1 Orlando, 2011
Carraher, S.M. & Paridon, T. (2008/2009). Entrepreneurship journal rankings across the discipline. Journal of Small Business Strategy, 19 (2), 89-98.
Carraher, S.M., Scott, C., & Carraher, S.C. (2004). A comparison of polychronicity levels among small business
owners and non business owners in the U.S., China, Ukraine, Poland, Hungary, Bulgaria, and Mexico. International Journal of Family Business, 1 (1), 97-101.
Carraher, S.M., Sullivan, S. & Carraher, S.C. (2005). An examination of the stress experience by entrepreneurial
expatriate health care professionals working in Benin, Bolivia, Burkina Faso, Ethiopia, Ghana, Niger, Nigeria, Paraguay, South Africa, and Zambia. International Journal of Entrepreneurship, 9 , 45-66.
Carraher, S.M., Sullivan, S.E., & Crocitto, M. (2008). Mentoring across global boundaries: An empirical
examination of home- and host-country mentors on expatriate career outcomes. Journal of International Business Studies, 39 (8), 1310-1326.
Carraher, S.M. & Welsh, D.H.B. (2009). Global Entrepreneurship. Dubuque, IA: Kendall Hunt Publishing. Carraher, S. & Whitely, W. (1998). Motivations for work and their influence on pay across six countries. Global
Business and Finance Review, 3, 49-56. Carraher, S.M., Yuyuenyongwatana, R., Sadler, T., & Baird, T. (2009). Polychronicity, leadership, and language
influences among European nurses: Social differences in accounting and finances, International Journal of Family Business, 6 (1), 35-43.
Chait, H., Carraher, S.M., & Buckley, M. (2000). Measuring service orientation with biodata. Journal of
Managerial Issues, 12, 109-120. Crocitto, M., Sullivan, S.E. & Carraher, S.M. (2005). Global mentoring as a means of career development and
knowledge creation: A learning based framework and agenda for future research. Career Development International, 10 (6/7), 522-535.
Deng, F.J., Huang, L.Y., Carraher, S.M., & Duan, J. (2009). International expansion of family firms: An
integrative framework using Taiwanese manufacturers. Academy of Entrepreneurship, 15 (1), 25-42. Francis, D., Huang, L., & Carraher, S.M. (2004). Top management teams and friendship: Results from the USA
and Taiwan. International Journal of Family Business, 1, 73-86. Hart, D. & Carraher, S.M. (1995). The development of an instrument to measure attitudes towards benefits.
Educational and Psychological Measurement, 55 (3), 498-502. Huang, L.Y. & Carraher, S.M. (2004). How effective are expatriate management and guanxi networks: Evidence
from Chinese Industries. International Journal of Family Business, 1, 1-23. Lester, D., Parnell, J.A. & Carraher, S.M. (2010). Assessing the desktop manager. Journal of Management
Development, 29 (3), 246-264. Lockwood, F., Teasley, R., Carland, J.A.C., & Carland, J.W. (2006). An examination of the power of the dark side
of entrepreneurship. International Journal of Family Business, 3, 1-20. Paridon, T. & Carraher, S.M. (2009). Entrepreneurial marketing: Customer shopping value and patronage
behavior. Journal of Applied Management & Entrepreneurship, 14 (2), 3-28.
page 42 Allied Academies International Conference
Orlando, 2011 Proceedings of the Academy of Accounting and Financial Studies, Volume 16, Number 1
Paridon, T., Carraher, S.M., & Carraher, S.C. (2006). The income effect in personal shopping value, consumer self-
confidence, and information sharing (word of mouth communication) research. Academy of Marketing Studies Journal, 10 (2), 107-124.
Parnell, J. & Carraher, S.M. (2001). The role of effective resource utilization in strategy’s impact on performance.
International Journal of Commerce and Management, 11 (3), 1-34. Parnell, J. & Carraher, S.M. (2003). The Management Education by Internet Readiness (MEBIR) scale:
Developing a scale to assess one’s propensity for Internet-mediated management education. Journal of Management Education, 27, 431-446.
Parnell, J., Carraher, S.M., & Holt, K. (2002). Participative management’s influence on effective strategic
diffusion. Journal of Business Strategies, 19 (2), 161-180. Scarpello, V. & Carraher, S. M. (2008). Are pay satisfaction and pay fairness the same construct? A cross country
examination among the self-employed in Latvia, Germany, the U.K., and the U.S.A. Baltic Journal of Management, 3 (1), 23-39.
Sethi, V. & Carraher, S.M. (1993). Developing measures for assessing the organizational impact of information
technology: A comment on Mahmood & Soon's paper. Decision Science, 24, 867-877. Sturman, M.C. & Carraher, S.M. (2007). Using a Random-effects model to test differing conceptualizations of
multidimensional constructs. Organizational Research Methods, 10 (1), 108-135. Sullivan, S.E., Carraher, S.M., Baker, L., Cochrane, D., & Robinson, F. (2009). The entrepreneurial dilemma:
Grow or status quo?: A real case. Journal of Applied Management & Entrepreneurship, 14 (4), 37-53. Sullivan, S.E., Forret, M., Carraher, S.M., & Mainiero, L. (2009). Using the kaleidoscope career model to examine
generational differences in work attitudes. Career Development International, 14 (3), 284-302. Welsh, D.H.B. & Carraher, S.M. (2009). An examination of the relationship between the mission of the university,
the business school, and the entrepreneurship center: An application of Chandler’s strategy and structure hypothesis. Journal of Applied Management & Entrepreneurship, 14 (4), 25-36.
Williams, M.L., Brower, H.H., Ford, L.R., Williams, L.J., & Carraher, S.M. (2008). A comprehensive model and
measure of compensation satisfaction. Journal of Occupational and Organizational Psychology, 81 (4), 639-668.
Yuyuenyongwatana, R. & Carraher, S.M. (2008). Academic journal ranking: Important to strategic management
and general management researchers? Journal of Business Strategies, 25 (2), 1-8.
Allied Academies International Conference page 43
Proceedings of the Academy of Accounting and Financial Studies, Volume 16, Number 1 Orlando, 2011
DURATION OF CORPORATE DEBT ISSUES
Fang Zhao, Siena College Jim Moser, Commodity Futures Trading Commission, Washington, DC
Joe M. Pullis, Louisiana Tech University
ABSTRACT Previous research investigates how corporate finance managers make their bond- maturity decisions. This paper is exploratory, investigating the relationship between duration and bond characteristics. The relationship between firm features and the durations of 8,627 corporate debt issues placed by U.S. corporations in public markets between 1990 and 2002 is examined. The major finding of the study is that firm quality, as measured by credit rating, is directly related to bond duration. The findings also suggest that bond duration is inversely related to firm size, that regulated non-financial firms have longer bond duration, and that syndicated offerings have longer duration than non-syndicated offerings.

page 44 Allied Academies International Conference
Orlando, 2011 Proceedings of the Academy of Accounting and Financial Studies, Volume 16, Number 1
Allied Academies International Conference page 45
Proceedings of the Academy of Accounting and Financial Studies, Volume 16, Number 1 Orlando, 2011
BRICKS OR CLICKS IN ACCOUNTING EDUCATION? WHICH METHOD IS THE MOST BENEFICIAL TO THE
ACCOUNTING STUDENT?
Melinda Kushniroff, Millikin University
ABSTRACT Although some research has been done in the internet-based learning discipline, user satisfaction of the relationship of internet-based classes to traditional classroom-based learning requires more attention and research due to the substantial and continued growth in this area. During the 2010 Fall semester, 720 university undergraduate students, internet-based and traditional classroom-based, were randomly sampled with the only requirement that the students be participating in at least one internet class and one traditional classroom-based learning during that same period. Student Course Evaluation Responses to the research questions were obtained with the answers anonymously submitted. Additionally, invitations were e-mailed to other participants such as faculty who have taught or are currently teaching internet and traditional classroom-based learning, university internet-based learning administration, and university internet-based learning technology management and additional students to complete the survey. The results of the study were based upon the opinions of the respondents and suggested that internet-based learning, when set up and administered correctly, is as an effective methodology of learning for individuals as compared to the traditional classroom-based learning.

page 46 Allied Academies International Conference
Orlando, 2011 Proceedings of the Academy of Accounting and Financial Studies, Volume 16, Number 1
Allied Academies International Conference page 47
Proceedings of the Academy of Accounting and Financial Studies, Volume 16, Number 1 Orlando, 2011
THE FEDERAL OPEN MARKET COMMITTEE AND THE FEDERAL FUNDS RATE:
A TEST OF MARKET EFFICIENCY
Michael Young, Longwood University Frank Bacon, Longwood University
ABSTRACT
The purpose of this study is to examine the movement of bank stocks in the days surrounding an FOMC meeting and the subsequent press release, using standard event study methodology. Specifically it is to analyze the movement of bank stocks traded on the NYSE and their reactions compared to the S&P 500 on the days that the FOMC finishes their meeting and puts out a press release. The meeting that will be examined is an unscheduled meeting that took place January 21, 2008 with the press release coming out January 22. The press release date will be considered the event date, because it is when the information became public. This study will also test the efficient market hypothesis. The three levels of market efficiency test the ability of an investor to gain an abnormal return depending on when information is released. This will test the semi strong form; history shows that there is a positive reaction to monetary policy changes so an investor should not be able to make an abnormal return on the day of the announcement.
INTRODUCTION
The Federal Open Market Committee (FOMC) has 8 regularly scheduled meetings during
each calendar year. The FOMC is the committee that sets the federal funds rate. It is made up of the Chairman of the Federal Reserve, the President of the New York Fed and the other Federal Reserve presidents sit on the committee on a rotational basis. The federal funds rate is the rate that banks charge each other when they are lending to other institutions. These loans are usually very short term, most being overnight. The federal funds rate has always been closely monitored by investors because it is the only rate that the Federal Reserve actually controls. Starting in the summer of 2007 the economic outlook started to look worse and worse. From 2004-2006 the federal funds rate increased by 25 basis points at almost every meeting that the FOMC held. In late 2007 the rate started to fall and in January of 2008 they held an unscheduled meeting where the rate was dropped by 75 basis points. Even though the FOMC historically holds eight scheduled meetings per year, if they feel that they need to take immediate action, they will call an unscheduled meeting,
page 48 Allied Academies International Conference
Orlando, 2011 Proceedings of the Academy of Accounting and Financial Studies, Volume 16, Number 1
This drop of 75 points was one of the largest in the previous 5 years. Lowering the federal funds rate is usually a sign that they want to try and boost the economy by increasing the amount of lending. Therefore, the rate is usually very low in times of economic slumps and higher during economic high periods.
This paper will also test the market efficiency as it relates to the release of the decisions made at the FOMC meetings. Market efficiency can be split into three forms: weak, semi-strong and strong. It is how fast the market reacts to public information that determines what form of efficiency the market has.
PROBLEM AND PURPOSE
The purpose of this study is twofold; first to see the impacts that FOMC meetings and the following announcements have an impact on Bank stocks and second to see how quickly the market reacts to these announcements. To determine the answer to the first part of the study, the return of the stocks will be compared to the return of the market during the event period. The second part of the study is where we will determine the market efficiency as it pertains to the speed to which the market reacts to the announcement of the change in the federal funds rate by the FOMC.
The study will use ten stocks found on yahoo finance and the January 21, 2008 FOMC meeting found on the Federal Reserve Bank website along with standard event study methodology. After looking at the days before and after the event date, it will be possible to determine the relationship between the movements of the stocks around the date compared to the market. Once this relationship is established, we will be able to determine if the movement around the event date is abnormal when compared to regular movements of the stocks during non-event periods.
LITERATURE REVIEW
Previous research on the effect FOMC on stocks has been done as well as the speed as to which these stocks react to the announcement. Goukasian and Whitney (2008) show us that when it comes to the market’s reaction to the announcements by the FOMC it is common to see positive abnormal returns on broad market indexes. These positive movements do not come on the event date; most of these are seen on the day following the event date. This shows that it takes some time for the market digest the decision and reacts to it.
The time that it takes for the market to react shows us it efficiency, which is explained by Ross (433). The first form of market efficiency is the weak form. This states that all past information is already incorporated into the price of a stock, and that an investor cannot make an abnormal return on the basis of past information. Ross explains this when talking about the past movements of a stock. If an investor notices that a particular stock moved in a cyclical pattern, he could buy at the low points and sell at the high points. In a weak form efficient market, everyone would see this trend and the ability to make profit on it would be competed away.
Allied Academies International Conference page 49
Proceedings of the Academy of Accounting and Financial Studies, Volume 16, Number 1 Orlando, 2011
The semi strong form is the next form of market efficiency and it is the most often tested. As explained by Ross (435) a market is efficient at the semi strong form level it incorporates all public information in its price making it impossible for an investor to outperform the market.
The final form of market efficiency is the strong form. If a market is efficient at the strong form level, it incorporates all information, public and private into the price of a stock (Ross435). This would mean that any piece of information that could affect a stock, no matter how few people know about it, would already be reflected in the stock price. Basically, if a market is strong form efficient, insider trading would not yield above normal return. Almost all evidence shows that markets are not efficient at the strong form level.
METHODOLOGY
This study includes ten large bank stocks and their reaction to the January 21, 2008 meeting. All of the banks, while not all American, are all traded on the NYSE. The stocks and historical prices were found on Yahoo Finance and the meeting date was found on the Federal Reserve website.
Bank
Bank of America
Citibank
Wells Fargo
Royal Bank of Canada
Bank of Montreal
Sun Trust
Capital One
JP Morgan
Barclays
Deutsche Bank
In order to test the Semi-Strong Market in relation to the announcement FOMC decisions
on the federal funds rate the follow hypotheses are formulated: H10:The Risk Adjusted Return of the stock price of the sample of bank firms is not significantly
affected by the FOMC press release information on the announcement date.
H11: The Risk Adjusted Return of the stock price of the sample of bank firms is significantly affected in a positive way by the FOMC press release information on the announcement date.

page 50 Allied Academies International Conference
Orlando, 2011 Proceedings of the Academy of Accounting and Financial Studies, Volume 16, Number 1
H20: The Risk Adjusted Return of the stock price of the sample of bank firms is not significantly affected by the FOMC press release information around the announcement date, as defined by the event period.
H21: The Risk Adjusted Return of the stock price of the sample of bank firms is significantly affected in a positive way by the FOMC press release information around the announcement date, as defined by the event period.
The Standard Risk Adjusted Event Study methodology will be used. The historical prices for both the firms and the S&P 500 will be retrieved from Finance.Yahoo.com and the FOMC meeting dates will be retrieved from federalreserve.org.
All of the information about the stock price and market index within the duration of -180 days to +30 days is attained. The time period from Day -30 to Day 30 is referred to as the event period.
The holding period return (HPR) for the firms (R) and the market (Rm) will be calculated by using the following formula:
(Current day close price - Previous day close price) Previous day close price
Using the HPR from each firm and the S&P 500 (market) a regression was performed
using OLS. The return on the market is the independent variable and the firm’s return is the dependant variable. The regression will cover all of the days from 180 trading days before the meeting to 30 trading days after the meeting to find the intercept alpha and the standardized coefficient beta.
Firm Alpha Beta
Bank of America -.00049 1.25052
Citibank .000475 1.471422
Wells Fargo .000412 1.395922
Capital One .000404 1.488824
Sun Trust .00112 1.650411
Bank of Montreal .000845 1.096437
Royal Bank -.0002 1.022482
JP Morgan -.0003 1.328753
Barclays .001036 2.456882
Deutsche Bank -0.00079 1.332052

Allied Academies International Conference page 51
Proceedings of the Academy of Accounting and Financial Studies, Volume 16, Number 1 Orlando, 2011
The Risk-Adjusted method was used to get the normal expected returns. The expected returns for each stock, for each day during the event period (Day -30 to day +30) was calculated using the following formula: E(R) = alpha + Beta (Rm), Rm is the return on the market.
The Excess Return (ER) was calculated using: ER = the Actual Return (R) – Expected Return E(R) Average Excess Returns (AER) were calculated from days -30 to +30 by simply averaging all of the excess returns AER= sum of the excess returns for day/number of firms (15) Cumulative AER, or CAER, was found by adding the AERs from each day from -30 to +30. Graphs of the AER and the CAER from days -30 to +30 were then created.
QUANTITATIVE TESTS AND RESULTS
The purpose of this study was to look at the movement of stock prices around an event date to measure if it was possible for an investor to make an above normal return. The question is simply whether or not it is possible to outperform the market. With the introduction of new information, such as the changing of the Federal Funds Rate, it would be expected that the Average Actual Return and the Average Expected Return, in the event period would be different. If there is a significant difference in the two returns then the hypothesis that says the information did increase or decrease the stock price should be supported.
The two graphs below, The Average Excess Return (AER) and the Cumulative Average Excess Return (CAER), show the efficiency of the market. Both the AER and the CAER graphs are show in relationship to time, specifically the event date (Day 0). After reviewing the CAER graph it is easy to see that the announcement of the change in the Federal Funds Rate did have an impact on the stock prices. From day -20 to day -3 there is a slow and somewhat volatile upward movement in the stock prices. These unscheduled meetings are not announced to the public, so the speculation of the results from a meeting cannot be the reason for the movement. From day -2 to day +6 there is a clear above normal positive return on the group of stocks. This increase after the event date shows that there is a possibility to earn an above normal profit on the announcement of a change in the Federal Funds Rate by the FOMC. However, the market does show signs of being Semi-Strong Market Efficient on Day 12, as the prices move back to equilibrium.
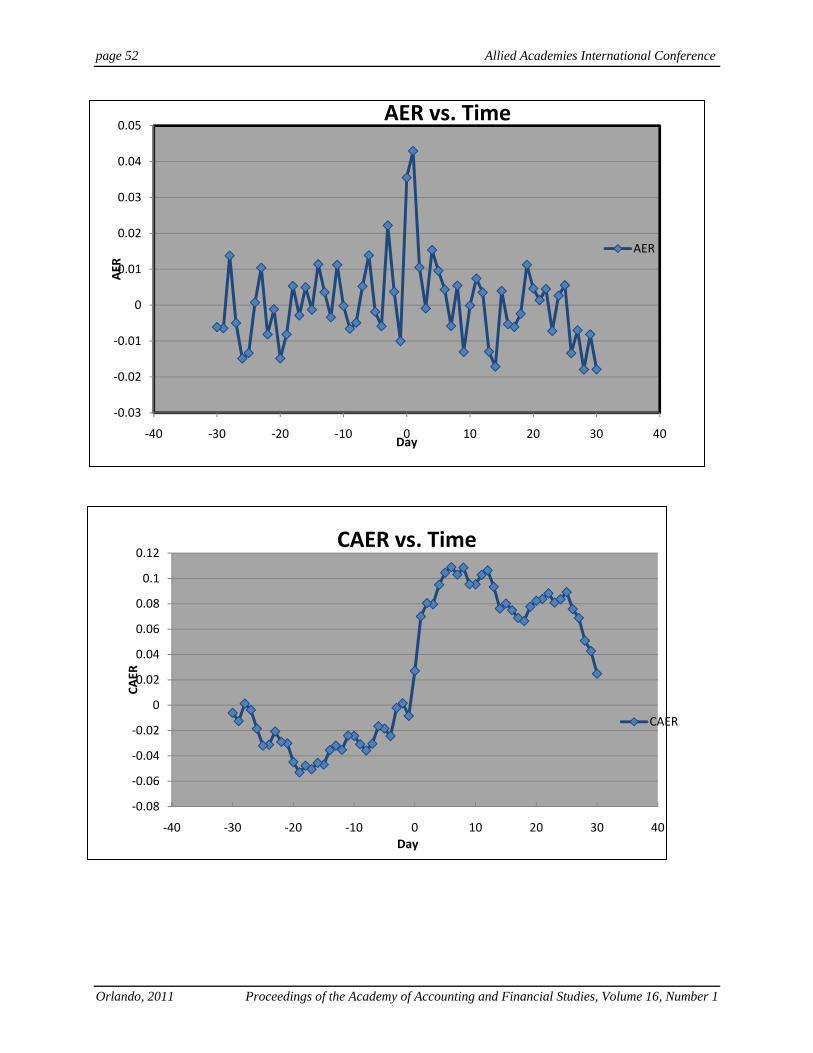
page 52 Allied Academies International Conference
Orlando, 2011 Proceedings of the Academy of Accounting and Financial Studies, Volume 16, Number 1
‐0.03
‐0.02
‐0.01
0
0.01
0.02
0.03
0.04
0.05
‐40 ‐30 ‐20 ‐10 0 10 20 30 40
AER
Day
AER vs. Time
AER
‐0.08
‐0.06
‐0.04
‐0.02
0
0.02
0.04
0.06
0.08
0.1
0.12
‐40 ‐30 ‐20 ‐10 0 10 20 30 40
CAER
Day
CAER vs. Time
CAER
Allied Academies International Conference page 53
Proceedings of the Academy of Accounting and Financial Studies, Volume 16, Number 1 Orlando, 2011
CONCLUSION
This event study examined the effects of a change in the Federal Funds rate by the Federal Open Market Committee on price of bank stocks, testing the Market Efficiency. Ten Banking firms were used as the sample for the study with stock prices obtained from Yahoo Finance 180 days prior to the meeting and subsequent press release and 30 days after. They were all traded on the NYSE. The Standard Risk Adjusted Event Study methodology, as provided from finance literature, was used to compare the firm’s returns to the Market returns (S&P 500 Index).
The analysis shows that there definitely is action in the stock price around Day 0. Specifically, the stock started to move in a positive direction on day -1, this is when the meeting took place, but no information from it had been released. So it does seem that the market does not adjust right away to these meetings and it is possible to make and abnormal return. The Semi-Strong Efficiency theory begins to show signs in the 30 days after the announcement. If a larger sample is taken and tested over multiple FOMC announcement dates these signs would probably become more obvious.
It is hard to say definitively if these unscheduled meetings are a positive indicator for multiple reasons. First, the rate can be increased or decreased and both of those send very different signals and the direction of the movement of the rate is not know before the meeting. Historically the rate has been its lowest in times of recession. So, a decrease in the rate such as the one in January of 2008 should be an indicator that the FOMC is preparing for a downturn in the economy or trying to boost the economy. The lower rate does mean cheaper money for banks, but it does seem like the market could be reacting to the Feds action in general. If the market believes the Feds actions are going to help, then that would account for the abnormal returns after the announcement.
Goukasian and Whitney showed us that there are abnormal returns on broad market indexes, such as the S&P 500, after FOMC announcements. If the S&P 500 is experiencing abnormal returns and the selected bank stocks are outperforming the S&P, then holders of bank stock should be optimistic about returns after FOMC meetings.
REFERENCES
http://www.federalreserve.gov/monetarypolicy/fomc.htm Finance.Yahoo.com Goukasian, Levon, and L. Keith Whitney. "Does the stock market under react to the federal reserve bank’s monetary policy actions?." Review of Business Research 8.2 (2008): 217-231. Business Source Complete. EBSCO. Web. 7 Dec. 2010. Ross, S. (2008). Corporate Finance (Stephen A. Ross, Randolph W. Westerfield, Jeffery Jaffe.- 8th ed.). United States: McGraw-Hill Companies.

page 54 Allied Academies International Conference
Orlando, 2011 Proceedings of the Academy of Accounting and Financial Studies, Volume 16, Number 1