Embed Size (px)
Citation preview

Volume 15 NOS. 1 & 2 2011

Address for Correspondence
The Managing Editor, JOSPA
USP-IRETA, Alafua Campus
Private Mail Bag
Apia SAMOA
Telephone : (685) 22372/21671
Fax: (685) 22347 / 22933
Email: [email protected] or [email protected]
Sales and Distribution
IRETA Publications
USP, Alafua Campus
Private Mail Bag
Apia
SAMOA
Telephone : (685) 22372/21671 Fax: (685) 22347 / 22933
Email: [email protected]
Annual Subscription
Free to agricultural workers in USP member countries.
US $40.00 (including postage for non-USP member countries).
Paper Contribution
Authors wishing to submit papers are advised to refer to the Guide for Authors on the last pages of this volume.
Layout:
Adama Ebenebe
Cover Design:
Ejiwa Adaeze Ebenebe
Printed by:
IRETA Printery
USP Alafua Campus
Samoa
ISSN 1016-7774
Copyright ©USP-IRETA 2011

Associate Professor Mareko Tofinga (Farming Systems/Agronomist)
SAFT-USP
Samoa
Mr. Mohammed Umar
(Agriculture Project Development & Management) IRETA-USP
Samoa
Mr. David Hunter
(Scientific Research Organisaion of Samoa)
SAFT, USP Samoa
Dr. Joel Miles
(Crop Protection)
Republic of Palua
Professor E. Martin Aregheore (Animal Science)
Marfel Consulting
Canada
Professor Umezuruike Linus Opara (Postharvest Technology)
Stellenbosch University
South Africa
Professor Anthony Youdeowei (Consultant)
United Kingdom
Dr. Lalith Kumarasingh
(MAF Biosecurity) New Zealand
Acknowledgement The Journal of South Pacific Agriculture hereby acknowledges the generous contributions of those who reviewed
manuscripts for this volume.
JOURNAL OF SOUTH PACIFIC AGRICULTUREJOURNAL OF SOUTH PACIFIC AGRICULTUREJOURNAL OF SOUTH PACIFIC AGRICULTURE The Journal of South Pacific Agriculture (JOSPA) is a joint publication of the Institute for Research, Extension and TrainingThe Journal of South Pacific Agriculture (JOSPA) is a joint publication of the Institute for Research, Extension and TrainingThe Journal of South Pacific Agriculture (JOSPA) is a joint publication of the Institute for Research, Extension and Training iiin n n Agriculture (IRETA) and the School of Agriculture and Food Technology (SAFT) of The University of the South Pacific (USP)Agriculture (IRETA) and the School of Agriculture and Food Technology (SAFT) of The University of the South Pacific (USP)Agriculture (IRETA) and the School of Agriculture and Food Technology (SAFT) of The University of the South Pacific (USP)
Managing Editor Dr. Adama Ebenebe
School of Agriculture and Food Technology
Alafua Campus
Apia, Samoa
BOARD OF TECHNICAL EDITORS
i

Table of Contents
A descriptor list for giant swamp taro (Cyrtosperma merkusii) and its cultivars
in the Federated States of Micronesia
Shiwangni Rao, Mary Taylor and Anjeela Jokhan ..........................................................................1
Value of Leucaena leucocephala, Gliricidia sepium and Ipomea batatas supplements
for apparent nutritional adequacy and maintenance of adult Anglo-Nubian x Fiji
local goats on a basal diet of Elephant grass (Pennisetum purpureum) in the dry season
Simon Baete and Eroarome Martin Aregheore................................................................................10
Forging Fijian Camaraderie: The cultural significance and social uses of kava
(yaqona) (Piper methysticum Forst. f) in three upper watershed communities in
north western Viti Levu (Fiji Islands)
Dan F. Orcherton..............................................................................................................................19
Approach to address bean acidity problems in Papua New Guinea cocoa using
solar dryer technology
Noel Y. Kuman ................................................................................................................................35
Optimization of flowering, pollen quantity and seed production in taro
(Colocasia esculenta var. esculenta)
Rosalene Sharma, Mary Taylor and Anjeela Jokhan .......................................................................41
Observations on off-take and nutrient composition of milk from Papua New
Guinea goats
Atmaleo Aguyanto and Workneh Ayalew........................................................................................53
Effect of blending sweet potato silage with commercial pellet feed or farm-made
concentrate (fish meal and copra meal) on the performance of local crossbred
pigs in Papua New Guinea (PNG)
Michael Dom, Workneh Ayalew and James Tarabu…………...…………………......……...........62
Evidence of environmental effects on cocoa flavour attributes Noel Y. Kuman…………...…………………………………………………………..........…........71
Comparative study of mutant and normal segregant seedlings of cocoa
(Theobroma cacao L.)
Eremas Tade, Doug A. George, Richard R. Williams and Peter Bapiwai…..…………..…............76
Climate change and food security – some conceptual considerations Eberhard H. Weber………………………………………...……………….........…........................85
What Ails Rural Economy of Fiji? A Diagnosis and Prescription
Sunil Kumar and Jagdish Prasad Bhati………………………...…………………….......…...........98
Food production and climate change in Pacific Islands Countries and
Territories Morgan Wairiu, Viliamu Iese and Murari Lal…..…….………...…………….……......…............110
Constraints and gender involvement in relation to canarium nut marketing
in Kakalano and Bitaama areas of Malaita Province, Solomon Islands
Ramona S. Sulifoa and Sonny Lameta…………..…….………...…………….……......…...........122
Guide for authors...........................................................................................................................136
ii
Journal of South Pacific Agriculture, Volume 15: Nos. 1 & 2, 2011

1
A descriptor list for giant swamp taro (Cyrtosperma merkusii) and its
cultivars in the Federated States of Micronesia
Shiwangni Rao1, Mary Taylor2 and Anjeela Jokhan3
ABSTRACT
Atoll islands are the diversity hot spots for Cyrtosperma merkusii (giant swamp taro) and its
traditional knowledge, especially in the Federated States of Micronesia (FSM). In these atoll
islands the giant aroid is given high importance in the food, cultural and traditional systems.
Despite this, a significant lack of knowledge and threat of salt water intrusion in the face of
climate change exists for the aroid. To curb the issue, a classification descriptor list using the taro
descriptors IPGRI (1999) and traditional knowledge of the FSM farmers was developed. The
descriptor list was then employed to classify the many cultivars present in FSM. The list consisted
of 37 morphological traits divided into plant habitat, leaves, petiole, inflorescence, root, corm,
taste and special characteristics. Using this descriptor list, 40 distinct FSM cultivars were
classified, three of which were unknown to the locals namely: ‗PF1‘, ‗Semes rao‘ and ‗Nah‘. The
results of the classification provided some knowledge of the various cultivars and also showed that
diversity did exist within the gene pool of the aroid. With further research and documentation, the
diversity that exist within the gene pool of the aroid can be explored and utilized to buffer the
impacts of salt water intrusion, while conserving the aroid and building its knowledge base.
Key words: Giant swamp taro, diversity, descriptor, atoll, Cyrtosperma merkusii.
INTRODUCTION
There are four types of taro which are
normally found in the Pacific, these include
the common taro Colocssia esculenta, Xanthosoma sagittifolium , Alocasia
macrorrhiza and the giant swamp taro
Cyrtosperma merkusii (syn. Cyrtosperma
chamissonis). Of these four types of taro,
Cyrtosperma is the largest reaching up to 5
meters in height (Dunn, 1976; Iese, 2005;
Webb, 2007). It also takes the longest to reach
maturity, and is known for its hardy qualities
of surviving in atoll environments (Thaman,
2002; Manner, 2009). Giant swamp taro is one
of the root crops that have spread across the
Pacific reaching as far as the Makatea Island
on the northwest of Henderson Island in the
Tuamotu Archipelago (Hather, 2000).
Hay (1990) and Lebot (1992) state the
origin of the giant aroid to be the high lands of
Papua New Guinea, while on the other hand,
some have concluded it to be of Indonesian or
Indo-Malayan origin (Bradbury, 1988). While
it has been perceived that giant swamp taro
was domesticated in Indonesia, the Indo-
Malayan region is the region which holds the
greatest diversity of the root crop (Bradbury,
1988; Iese, 2005). However, employing
techniques of archaeobotanical analysis,
Hather (2000) found that ―…Cyrtosperma was
an aboriginal introduction across Polynesia
except for New Zealand and Easter Island
where climate plus cultural preferences may
have discouraged its growth...‖. He also found
that Cyrtosperma merkusii was present as far
back as 1451 A.D.
The production levels of this giant
aroid in the atolls are now under threat from
the effects of climate change related sea level
rise. The increased frequency and intensity of
king tides and sea swell bring huge waves
inundating the low lying atoll islands (Liz,
1.University of the South Pacific, Suva, Fiji. Ph: 8744220. Email: [email protected]. 2Centre for Pacific Crops and Trees. Secretariat of the Pacific Community. Suva, Fiji. Phone: 332 0966. Email: [email protected] 3Faculty of Science, Technology and Environment. University of the South Pacific, Suva, Fiji. Phone: 323 2567. Email: [email protected]
Corresponding address: [email protected].
A descriptor list for giant swamp taro - Shiwangni Rao, Mary Taylor & Anjeela Jokhan
Journal of South Pacific Agriculture, Volume 15: Nos. 1 & 2, 2011

2
2007; White & Falkland, 2010). This
inundated sea water percolates into the
groundwater lens increasing the fresh
groundwater lens salinity (Woodraffe, 1989;
Mimura, 1999; Gerald, 2007). Along with this,
the disturbance caused by rise in sea level to
the sensitive balance of the groundwater lens
results in seawater intrusion which adds to the
increasing salinity levels (White & Falkland,
2010).
In addition, modernization has played a
pivotal role in shaping the present trends in
lifestyle preferences with nutritional Pacific
staple crops being replaced by nutritionally
poor imported foods. Giant swamp taro is no
exception and has also fallen victim to
modernization, as where in the Indo-Pacific
region it once was a major food source, but is
now being replaced by western food at an
accelerating pace. Foods such as instant
noodles, rice, flour, and biscuits are not only
replacing giant swamp taro but other local
food crops such as pandanus, taro, yams,
breadfruit and many others.
Therefore, the objective of this paper is
to present a detailed descriptor list for
classification, conservation and documentation
of FSM giant swamp taro cultivars.
METHODOLOGY
The descriptor list was developed
during a two day workshop conducted in
Pohnpei, FSM with the help of the locals. The
workshop consisted of 37 participants, 27
framers and 10 agriculture field technicians of
Pohnpei Agriculture Department. There was
an equal distribution of age ranging from
young to old framers, while a 3:1 gender ration
for men to women was present in the
workshop. Using a giant swamp taro
descriptor list composed by Iese (2005)
consisting of 27 descriptors, along with IPGRI
(2007) full descriptor list for Taro Colocasia
esculenta (taro) a detailed draft descriptor was
prepared. This was then presented on a
PowerPoint presentation and explained to the
participants with translations in Pohnpeian
from the Pohnpei Chief Agriculture Officer
Mr. Adelino Lorens. Through an open
discussion the participants at the workshop,
worked through the various descriptors to
select the most pertinent descriptors to swamp
taro. There was common agreement among the
participants for all the selected descriptors
across both age range and gender. Mr. Adelino
Lorens from his previous trips to the outer
islands of FSM had collected approximately
50 proposed cultivars and had planted these in
the Pilot farm. The Pilot farm presented a fair
collection of all FSM cultivars, hence it was
used for characterization of the aroid cultivars
using the developed descriptor list with the
help of four agriculture field technicians.
RESULTS AND DISCUSSION
Descriptor
Divided into eight sections namely
plant habitat, leaves, petiole, flower, root,
corm, taste, and special characteristics, 37 key
morphological traits where identified. Plant
habitat had three traits, namely plant span,
height at maturity and number of suckers
(Table 1). Leaves had 10 traits, leaf base
shape, spread of leaf lobes, blade colour, main
vein colour, presence of appendages/
cataphylls (small leaf like structures emerging
on the underside of leaves), arrangement,
number of leaves, lamina length: width ration
and petiole junction pattern (Tables 2a and
2b). Petiole had nine traits, colour of top,
middle and bottom thirds of petiole, presence
of stripes, shape of petiole, presence of spines,
number of spines, spine colour and size
(Tables 3a and 3b). Inflorescence or flower
had eight traits, formation, stalk colour, spathe
colour, spadix colour, berries colour, seeds
viability, exposure of flower male portion,
degree of fertility (Table 4). Corm had four
traits, corm size, cortex colour, central corm
colour, and fiber colour (Table 5). General
descriptions were given for root, taste and
special characteristics as it is difficult to pose
closed more structured questions for these
traits (Table 6).
While all the 37 descriptor traits were
useful in characterizing the cultivars, there
were a few outstanding ones that were key to
effective characterization. These included
number of suckers, presence of cataphylls,
spread of lobes, leaf arrangement, traits related
to spines on petiole and color of spathe.
Journal of South Pacific Agriculture, Volume 15: Nos. 1 & 2, 2011
A descriptor list for giant swamp taro - Shiwangni Rao, Mary Taylor & Anjeela Jokhan

3
Trait Variability Leaf base shape
(petiole attachment)
1. Hastate (Having the shape of
an arrowhead but with the
basal lobes pointing outward
at right angles.)
2. Peltate (Having a flat circular
structure attached to a stalk
near the center, rather than at
or near the margin; shield-
shaped.)
Spread of leaf lobes 1. Overlapping
2. Acute angles (<45°)
3. Right angles (90°)
Leaf blade margin 1. Entire (not wavy)
2. Undulate (wavy)
3. Sinuate (very wavy)
Leaf blade colour 1. Whitish
2. Yellow/Yellow green
3. Light green
4. Dark green
5. Pinkish green
6. Reddish green
7. Purplish
8. Blackish
Hastate Peltate
Wavy margin
lobes
Overlapping
lobes Acute lobes
Entire margin
Journal of South Pacific Agriculture, Volume 15: Nos. 1 & 2, 2011
Table 1. Plant habitat descriptors.
Trait Variability
Plant span/ spread
Narrow (<50cm) Medium (50-100cm)
Large (>100cm)
Plant height at maturity
1.Short (3-4ft) 2.Medium (5-10ft)
3.Long (>10ft)
Number of suckers (direct shoots)
1.Many (<10) 2.Few (5-10)
3.Less (>5)
Table 2a. Leaf descriptors.
A descriptor list for giant swamp taro - Shiwangni Rao, Mary Taylor &Anjeela Jokhan
Direct suckers
Span
Height

4
Journal of South Pacific Agriculture, Volume 15: Nos. 1 & 2, 2011
A descriptor list for giant swamp taro - Shiwangni Rao, Mary Taylor &Anjeela Jokhan
Table 2b. Leaf descriptors.
Trait Variability
Leaf lamina
appendages/
cataphylls
1. Absent
2. Present
Leaf main vein color
1. Whitish
2. Yellow/ Yellow green
3. Light green
4. Dark green
5. Pinkish green
6. Reddish green
7. Purplish
8. Blackish
Leaf arrangement
(la)
1. Counter-clockwise
2. Clockwise
Number of leaves
(nol)
1. Few (<5)
2. Normal (5-10)
3. Many (>10)
Leaf lamina length :
width ratio
Describe
Petiole junction
pattern
Describe
Leaf main vein
Clockwise Counter-clockwise
Length
Width
Cataphylls
Characterization
Using the developed descriptor list for
giant swamp taro, 40 distinctive cultivars were
characterized of the 50 cultivars present in
FSM Pilot farm. These were: Mwahng pwiliet,
Nah, Liha mwahu, Semes rao, Pah weitata,
Mwahng wel/nihn danis, nihn dihjon/saimon,
Mwahng sehm, PF1 Nihn Doahm, Nihn Eneri,
Mwahng wiklale, Omp 1, Omp 2, Loahr,
Smihden 1, Smihden 2, Smihden 3, Smihden
4, Inpahrau, Nein serin, Mwahng Palau,
Mwahng Meir, Mwahng Nukuwer, Mwahng
so kalewe, Mwahng weitahta takateki, Pah
rotorot, Nein Aidai, Anetchimo 1, Anetchimo
2, Smihden en nukuro, Mwahng seri,
Mohotuwa, Neni sehm 2, Neni sehm 3, Neni
sehm 4, Fanal en nukuro, Weito, Pula fabul,
and Pularis. Of the 50 proposed cultivars pre-
sent in the pilot farm, only 40 were
characterized as some cultivars had been
severely damaged (hence inadequate for
characterization), lost, or were a duplicate.
During the characterization it was
found that four of the 40 cultivars found in
FSM were not distinguished by locals hence
these were named Nah, Liha mwahu, Semes
rao and PF1. The first unknown cultivar was
named Nah, as the cultivar originated from the

5
Trait Variability
Color of top third (P/c/t/third) 1. Whitish
2. Yellow/ Yellow green
3. Light green
4. Dark green
5. Pink-Pinkish green
6. Red-Reddish green
7. Purple
8. Black
Color of middle third
(P/c/m/third)
Same as above
Color of lower third (P/c/l/third) Same as above
Petiole stripes 1. Absent
2. Present
Petiole shape (top) (ps top) 1. Straight
2. Curved
3. Swan‘s
neck
Petiole with
fine printed
stripes
Bottom
Middle
Top
Straight neck
Curved neck
Journal of South Pacific Agriculture, Volume 15: Nos. 1 & 2, 2011
A descriptor list for giant swamp taro - Shiwangni Rao, Mary Taylor &Anjeela Jokhan
Table 3a. Petiole descriptors.
island of Nah. Liha mwahu, meaning ‗nice
lady‘, was the name given to the second
unknown cultivar as a form of appreciation for
the author‘s contribution to towards the
farmers crop. Semes rao was the name given
to the third unknown cultivar as this cultivar
was identified by the field technician Semes
and the author Rao. PF1 was the name given to
the fourth unknown cultivar to acknowledge
the Pilot Farm (PF) the cultivars was identified
on. These names were given by the
participants of the workshop and were in
Swan neck

6
Journal of South Pacific Agriculture, Volume 15: Nos. 1 & 2, 2011
A descriptor list for giant swamp taro - Shiwangni Rao, Mary Taylor &Anjeela Jokhan
Table 3b. Petiole descriptors.
Trait Variability
Petiole thorns/spine/(pthorns) 1. Absent
2. Present
Number of spines 1. Very little
2. Few
3. Plenty
Petiole spine color(p/t/(col) 1. Green
2. Dark green
3. Yellow
4. Red
5. Pink
6. Purple
Spine size(p/t/size) 1. Short (<2mm)
2. Medium (2-3mm)
3. Long (3-4mm)
4. Very long
(>4mm)
Thorns/
Spines
agreement with everyone.
While generally flowers of the giant
swamp taro are not known to have fragrance it
was found that the cultivar Semes rao had a
frangipani like fragrance, therefore similar to
the flowers of Colocasia esculenta. The flower
of Semes rao has a light yellow Spathe and a
white spadix, unfortunately specific use of the
flower is unknown but can be used as floral
decoration. Another outstanding cultivar
which is easily distinguished is the Mwahng
nukuwer due to the presence of cataphylls, it is
the only cultivar that had these appendages
and similar to the Paipaitalinga found in
Tuvalu.
CONCLUSION
From the Workshop in Pohnpei,
Federated States of Micronesia a descriptor list
for Cyrtosperma merkusii (swamp taro) was
prepared and many of the FSM cultivars in the
collection characterized. While the descriptor
list has many of the morphological and some
physiological descriptors present. It can be
improved through further use, by either or
addition of traits to make it more effective.
The use of molecular markers would also add
another dimension to the characterization
process. For effective conservation, collections
have to be described and therefore descriptors
list are essential. They help to rationalize an
existing collection, thereby saving resources
and they can assist in identifying unique
accessions for safe conservation and
duplication. The existing threats of climate
change and modernization means that it is vital
to conserve the diversity of this important and
unique crop. The Secretariat of the Pacific
Community, Centre for Pacific Crops and
Trees (SPC CePaCT) based in Fiji is working
towards conserving and documenting the
Pacific aroids which includes the species of
the atolls, giant swamp taro.
In addition, not all the varieties are
cultivated as preference varies according to
taste use, ease of cultivation and so on (Iese,
2005). So apart from the effects of climate
change and modernization current-day
preferences may also contribute to the
extinction of some of the varieties.
It is essential not only to conserve
these varieties but also to document it, so that
the valuable information about these varieties
is not lost. Currently a handful of the varieties
are threatened as many of these have evolved
in isolation on the islands, such as the four
cultivars that were unknown to the locals.
Apart from being a food crop giant
swamp taro is also woven into the island
culture and traditions, which makes this a

7
Trait Variability
Flower formation 1. Absent
2. Present
Flower stalk colour 1. Whitish
2. Yellow/ Yellow green
3. Light green
4. Dark green
5. Pink-Pinkish green
6. Red-Reddish green
7. Purple
8. Black
Spathe (flower cover)
color top/ bottom and
young/old
Describe
Spadix/ pollen colour Same as for flower stalk
colour
Berry color Same as for flower stalk
colour
Seeds Viability (sv)
1. Viable (grow)
2. Non-viable (don't
grow)
Male portion of flower 1. Enclosed
2. Exposed
Fertility of the female
part of the inflorescence
1. None
2. Low (<40% fertile
flowers)
3. Intermediate (<80%)
4. High (almost 100%)
Stalk
Spadix
Spathe
Berries/ seeds
Indicator of fertility
Journal of South Pacific Agriculture, Volume 15: Nos. 1 & 2, 2011
A descriptor list for giant swamp taro - Shiwangni Rao, Mary Taylor &Anjeela Jokhan
Table 4. Inflorescence or flower descriptors.
particular crop of major significance for these
island nations. Loss of this species will not
only have implications for food security but
also for culture, traditions and to some extent
identity.
References
BRANDBURY, J. H & HOLLOWAY, W. G. 1988. Chemistry of tropical Root crops;
Significance for nutrition and agriculture in the Pacific. ACIAR Monograph , 6, 201.
DUNN, E. 1976. Report on a visit to the island of Tuvalu. Noumea, New Caledonia: SPC.
GERALD, D. M., FENSTER, M. S., ARGOW, A. B & BUYNEVICH, I. V. 2007. Coastal
Impacts due to sea level rise.
HATHER, J. & WEISLER, M. I. 2000. Prehistoric Giant Swamp taro (Cyrtosperma merkusii)

8
Journal of South Pacific Agriculture, Volume 15: Nos. 1 & 2, 2011
A descriptor list for giant swamp taro - Shiwangni Rao, Mary Taylor &Anjeela Jokhan
Table 5. Corm descriptor.
Trait Variability
Corm Size 1. Small
2. Medium
3. Large
Corm Cortex Color 1. White
2. Yellow3. Orange
4. Pink
5. Red
6. Purple
7. Other
Corm flesh color central
part
Same as above
Corm flesh Fiber color Same as above
Corm
Roots Central part
Cortex
Table 6. Descriptors of root, taste and special characteristics.
Trait Variability
Roots Describe
Taste 1. Very Hard
2. Itchy/irritating
3. Good
4. Very good
Special characteristics e.g. drought
or salinity tolerance
Describe
from Herderson Island, Southeast Polynesia. Pacific Science, 54:149-156.
IESE, V. 2005. Characterisation of Giant swamp taro (Cyrtosperma chamissonis (Merr) Schott)
using morphological features, genetic finger printing and traditional knowledge from
framers. Suva, Fiji: University of the South Pacific.
IPGRI. 1999. Descriptors for Taro (Colocasia esculenta). International Plant Genetic Resource
institute, Rome, Italy.
LIZ, M. 2007. The Tides are getting higher and higher: A Pacific voice on Climate change. Just
Change, 10:22-23.
MANNER, H. T. 2009. 4. Farm and Forestry production and Marketing Profile for Giant Swamp
taro (Cyrtosperma chamissonis). Holualoa, Hawai‘i.: Permanent agricultural resources.
MIMURA, N. 1999. Vulnerability of Island countries to sea level rise and climate change. Climate
research.
TALIA, M. 2009. Towards fatele Theology: A Contextual Theological response in addressing
threats to global warming in Tuvalu. Taiwan, Tainan Theological college and Seminary
Tainan.
THAMAN, R. 2002. Threats to Pacific island biodiversity and biodiversity conservation in the

9
Journal of South Pacific Agriculture, Volume 15: Nos. 1 & 2, 2011
A descriptor list for giant swamp taro - Shiwangni Rao, Mary Taylor &Anjeela Jokhan
Pacific Islands. Suva, Fiji.: University of the South Pacific.
WEBB, A. 2007. Assessment of salinity of groundwater in swamp taro (Cyrtosperma chamissonis)
“Pulaka” pits in Tuvalu. SOPAC Technical Report 75. Suva, Fiji, SOPAC.
WHITE, I. & FALKLAND, T. 2010. Management of freshwater lens on Small Pacific Islands.
Hydrogeology Journal, 18(1):227-246.
WOODRAFFE, C. 1989. Salt water intrusion into ground water: an assessment of effects on small
island states due to rising sea level. Australia: University of Wollongong.

10
Value of Leucaena leucocephala, Gliricidia sepium and Ipomea batatas
supplements for apparent nutritional adequacy and maintenance of adult Anglo
-Nubian x Fiji local goats on a basal diet of Elephant grass (Pennisetum
purpureum) in the dry season
Simon Baete1 and Eroarome Martin Aregheore2
ABSTRACT
Four adult Anglo-Nubian x Fiji local goats; 2-3 years old, pre-trial body weight of 25.6 kg were
used in a 4 x 4 Latin Square design to investigate the value of Gliricidia sepium (GS), Ipomea
batatas (IB) and Leucaena leucocephala (LL) to a basal diet of Elephant grass (EG) (Pennisetum
purpureum). Treatments were EG-sole diet; EG + GS; EG + IB and EG +LL. Dry matter intake
(DMI) of EG-sole diet was 1008 g/d/goat, while EG + GS; EG + IB and EG +LL was 766; 898
and 902 g/d/goat. Total voluntary feed intake (TVFI) (grass + browse) EG + GS; EG + IB and EG
+LL was 1158 1332 and 1375 g/d/goat, respectively. There was an initial rejection of EG + GS by
the goats. Intake of EG and EG + GS were lower than EG + IB and EG +LL (P<0.05). DMI of EG
was 350.8 g while EG + GS; EG + IB and EG +LL was 367.0; 430.9 and 490.3 g/d/goat. Daily
protein intake was 7.04; 9.76; 10.42 and 11.37 g/kg0.75/day in EG; EG + GS; EG + IB and EG
+LL, respectively. DM, CP, NDF, ADF, NFE, OM; ME (MJ/kg) digestibility and TDN was high
in EG + GS, EG + IB and EG +LL than in EG (P<0.05). Digestible energy (MJ/kg DM) and NVI
(KJ/kg0.75/d) were low in EG + IB and EG + GS, respectively. The treatments can be ranked as:
EG + LL> EG+ IB > GE+ GS > GE-sole diet in meeting apparent nutritional adequacy of adult
goats .
Key words: Adult goats, elephant grass, voluntary feed, dry matter intake, daily protein intake,
nutritive value index.
INTRODUCTION
The productivity of ruminants‘
livestock during adverse weather conditions
(drought or dry season) is dependent upon the
use of available pasture resources for
maintenance, growth and reproduction. The
goat is an indispensable ruminant livestock in
the Pacific Island countries region due to its
effective utilization of fibrous feeds, and the
ability to adapt to different climatic conditions
under varying management systems. The goat
can also survive in areas, where cattle and
sheep cannot because of their digestive
efficiency. These attributes have contributed to
make the goat appreciated by smallholder
farmers in the Pacific island countries (PICs)
where available land mass permits.
Elephant or Napier grass (Pennisetum
purpurem) is one of the natural pasture grasses
in PICs that withstand heavy grazing and yet
provide a substantial bulk feed to large and
small ruminants. It is the main fodder grown
by over 70 % of livestock farmers in PICs, and
usually provides over 40 % of feed
requirements in silage or cut-and carry system,
in the dry season (Aregheore, 2005). It makes
excellent hay if cut when young but get too
coarse if cut late. In comparison with other
grass species, it is the most promising and high
yielding fodder giving dry matter yields that
surpass most tropical grasses (Skerman &
Riveros, 1990; Humpreys, 1994), however, its
digestibility and palatability decrease rapidly
after the heads appear. Small ruminants reared
on elephant grass only have problems meeting
their maintenance need or maintain body
weight gained in the rainy season during the
dry season. Elephant grass, despite its
availability, has high-lignin content in the dry
season.
Value of Leucaena, Gliricidia and Ipomea supplements for goats - Simon Baete & Martin Aregheore
Journal of South Pacific Agriculture, Volume 15: Nos. 1 & 2, 2011
1Agricommerce Department, Massey University, Palmerston North 4442, New Zealand. 2Marfel Consulting (Agricultural and Educational Services): Independent Institution/Consultancy. Corresponding address: [email protected]; [email protected]

11
Productivity of small ruminants in PICs
is less than their genetic potential due to large
fluctuations in quantity and quality of
available forage. Supplementation with
available, cheap, feed resources is necessary to
overcome the nutritional constraint. Poor-
quality diets from forage in terms of protein;
vitamins and minerals can be improved with
leaves, shoots and twigs of browses, legumes
and multipurpose trees of indigenous and
introduced browse species that abounds in
PICs. Leucaena leucocephala, Gliricidia
sepium, Calliandra calothyrus and Moringa
oleifera to mention but four extensively
studied as supplements to poor quality
roughage. Aregheore (2004, 2005), however,
limited data exist on the potentials of vines of
sweet potatoes (Ipomea batatas [L] Lam) as a
source of nutrients for small ruminant
livestock in the PICs. Sweet potatoes (I.
batatas) widely grown in Fiji Islands,
Vanuatu, Solomon Islands, Papua New
Guinea, the Cook islands and a host of other
PICs as ―a store of goodness‖ (SPC, 1983), but
after the harvest of the tubers, the vines
considered a waste and, therefore,
underutilized (Moat & McL Drylen, 1993;
Aregheore, 2004, 2005).
The leaves, twigs, and seeds of
browses, legumes and multipurpose trees have
become an integral part of ruminant feeding
systems, and their importance stressed in
ruminant nutrition in the tropics and sub-
tropics in the dry season (Orden et al., 2000;
Aregheore et al., 2004; Bamikole & Ikhatua,
2010). While these legumes do exist, most
small holder farmers, the crank handler of
ruminant production in PICs seems to have
little or no knowledge of them as cheap protein
supplements for the growth, reproduction,
production and maintenance of meat goats.
The objective of this study, therefore, was to
investigate the importance of L. leucocephala,
G. sepium and I. batatas supplementation on
apparent nutritional adequacy and maintenance
of adult Anglo-Nubian x Fiji local goats on a
basal diet of elephant grass (P. purpureum) in
the dry season.
MATERIALS AND METHODS
Location of Study
The study was carried out during the
dry season at the goat unit of the University of
the South Pacific, School of Agriculture,
Alafua Campus, Apia, Samoa (Latitude
13.50S, longitude 172.50W). Dry season in
Samoa lasts from April to September with
temperature of 27-300C.
Feeds preparation
L. leucocephala, G. sepium and
elephant grass (the basal diet) were harvested
from re-growth. Sweet potato foliage (leaves,
petioles including stems (vines) were
harvested from the student‘s plot within
Alafua Campus. Leaves of Leucaena;
Gliricidia and sweet potato were harvested
fresh daily. The elephant grass component was
harvested fresh daily from a re-growth and
chopped with a manual chaff cutter into pieces
of 3-5 cm, length. Stems were removed from
the leaves to ensure that the fodder
composition was uniform. The reduction in
length was necessary to minimize its wastage
by the goats.
The four dietary treatments consisted
of the following:
100 % Elephant grass only (Control) (EG-
sole diet)
72 % Elephant grass + 28 % Gliricidia
sepium (EG+GS)
70 % Elephant grass + 30 % Ipomea
batatas vines (EG+IB)
75 % Elephant grass + 25 % Leucaena
leucocephala (EG+LL)
The above proportions were mixed thoroughly
to reduce selection and offered as a whole diet
in the trough (Theng Kouch et al., 2003). The
levels of supplementation were calculated as
percentage of ad libitum daily forage
allowance of adult goats. The ratios were
mixed to contain between 13.4 – 14.6 % CP
levels.
Animals, experimental design and
procedure
Four adult Anglo-Nubian x Fiji local
goats, 2 bucks and 2 does; 2-3 years with mean
pre-trial body weights of 25.6kg were allotted
in a randomized 4 x 4 Latin square design and
individually housed in metabolic crates under
a common roof, fed and watered. The goats
were fed on each dietary treatment for 21 days
before the treatment was changed. The first 10
days were dietary adaptation period and adjust-
Journal of South Pacific Agriculture, Volume 15: Nos. 1 & 2, 2011
Value of Leucaena, Gliricidia and Ipomea supplements for goats - Simon Baete & Martin Aregheore

12
ment, while the final 11 days were for intake
measurement and faecal collection prior to
been allocated to new dietary treatment. The
assigned dietary treatment was offered daily
beginning at 0900hr, and additional feed was
offered to ensure ad libitum access to forage
while minimizing wastage.
However, the feed offered were
adjusted daily based on increased and
decreased intake by keeping the refusal rate at
10-20%. Feed refusals were collected each day
and weighed to assess intake before any new
feed was offered (Aregheore, 2007). Grab
samples of browses, elephant grass and dietary
treatments were taken on a daily basis each
time mixture was weighed for each goat.
These samples were placed in paper bags and
dried to a constant weight at 50°C for DM
determination.
Record of daily intake and refusals
were recorded and kept. The goats also had
access to ample drinking water and mineral
lick salt (Summit multi-mineral, Auckland,
New Zealand). The quantity of leaf materials
eaten by an individual animal was calculated
by the difference between weight of leaves
given (gDM) and the weight of leaves refused
(gDM) (Mtenga et al., 1999).
Digestibility studies
During each phase, faeces voided were
collected for 5 days and weighed to know
total, faecal output for each goat before a 25 %
sample was collected for dry matter
determination. Samples of collected feeds and
faeces were dried in forced draught oven at
700C for 48 hours, until constant weight was
achieved. These were sampled and bulked for
each goat, milled with a simple laboratory mill
and stored in air-tight bottles until required for
analysis.
Analytical Procedures
AOAC (1995) method was used for
proximate analysis of samples. All analysis
was done in triplicate. Dry matter was
determined by drying at 102˚C for 24 hours,
ash by placing samples in a muffle furnace and
firing at 600˚c for 24 hours and protein by the
micro-kjeldah procedure (N x 6.25). Fibre
fractions were determined using the procedure
of Van Soest et al. (1991). Hemicellulose was
calculated as the difference between neutral
detergent fibre (NDF) and acid detergent fibre
(ADF). Gross energy (MJ/kg) values of
forages and faecal samples were determined
by a Bomb calorimeter (Adiabatic bomb, Parr
Instrument Co. Moline, IL) using chemical
benzoic acid as standard. All samples were
done in triplicate.
Statistical Analysis
Data on voluntary feed intake, dry
matter intake, and nutrient digestibility were
statistically evaluated using analysis of
variance (ANOVA) with goats, period and
dietary treatment included as main effects and
significant differences between means were
compared using least significant difference
(LSD).
RESULTS
Table 1 presents proximate chemical
composition of individual feedstuffs used in
the study. Elephant grass had higher fibre
contents than the browses. Among the
browses, sweet potato (Ipomea batatas) had
lowest dry matter (DM), CF, NDF, ADF, ash
and ME contents. LL had higher CP and M E
(MJ/kg) followed by GS; and IB the lowest.
OM of EG-sole diet was close to IB while GS
and LL were similar in OM value.
Table 2 presents the proximate
chemical composition of the dietary treatments
fed to the goats. The CP of EG-sole diet was
lower than the CP value of EG+GS; EG+IB
and EG+LL. The CP of EG+GS; EG + IB and
EG+LL ranged from 11.4-14.6%. All the
dietary treatments including EG- sole diet had
high organic matter content. Except for the
high ADF in EG- sole diet, other fibre
fractions (CF, NDF and hemicelluloses) were
numerically similar in EG-sole diet; EG+GS;
EG+IB and EG+LL.
Data on feed intake and apparent
nutrient digestibility of the goats are presented
in Table 3. Voluntary dry matter intake of the
basal diet was 1008; 766; 898 and 902 g/d/
goat, for EG- sole diet; EG + GS; EG + IB and
EG +LL, respectively. Goats on EG-sole diet
had higher forage intake (P<0.05) and
followed by EG +LL and EG + IB while EG +
GS was the least in the intake of the basal diet.
The percentage (%) of browse in total
voluntary feed intake was similar however,
Journal of South Pacific Agriculture, Volume 15: Nos. 1 & 2, 2011
Value of Leucaena,Gliricidia and Ipomea supplements for goats - Simon Baete & Martin Aregheore

13
Journal of South Pacific Agriculture, Volume 15: Nos. 1 & 2, 2011
Value of Leucaena, Gliricidia and Ipomea supplements for goats - Simon Baete & Martin Aregheore
Table 1. Proximate chemical composition of Elephant grass and the browses.
Forage/browses*
Nutrients Elephant
grass
Gliricidia sepium Leucaena
leucocephala
Sweet potato (Ipomea
batatas)
DM 55.8 58.7 50.8 37.3
CP 11.4 19.5 24.2 18.3
OM 85.0 90.5 90.5 88.5
CF 26.5 9.2 12.2 8.6
Ash 14.9 9.5 12. 11.5
NDF 54.4 47.7 48.1 39.6
ADF 41.5 25.3 32.2 20.3
HEM 22.9 22.4 15.9 6.8
ME (MJ/kg) 13.1 14.0 16.4 9.5
*DM, dry matter; CP, crude protein; OM, Organic matter; NDF, Neutral detergent fibre; ADF, Acid detergent fibre; HEM,
hemicellulose; ME, Metabolizable energy
Table 2. Proximate chemical composition of dietary treatments.
Diets*
EG-sole diet EG+GS EG+IB EG+LL
Proportion of Grass: Browse 100:0 72:28 70:30 75:25
Nutrients as percentage (%) of DM
Dry matter (DM) 55.8 56.6 50.3 54.6
Crude protein (CP) 11.4 13.6 13.3 14.6
Organic matter (OM) 85.0 86.5 86.1 88.4
Crude fibre (CF) 26.5 24.1 20.3 24.1
Ash 14.9 13.4 13.9 12.9
Neutral detergent fibre (NDF) 54.4 52.5 45.3 52.8
Acid detergent fibre (ADF) 41.5 37.6 35.1 39.1
Hemicellulose 12.9 14.9 10.2 13.7
Nitrogen free extract (NFE) 45.1 46.2 49.0 49.9
Metabolizable energy (MJ/kg DM) 13.1 13.4 12.0 13.9
* EG-sole = Elephant grass–sole diet; EG+GS = EG+ Gliricidia sepium; EG+IB = EG+ Ipomea batatas; EG+LL = EG+ Leucaena leucocephala
total voluntary forage intake (grass + browse)
was 1158, 1332 and 1375 g/d/goat for EG+GS;
EG+IB and EG+LL respectively (P<0.05).
Browse supplementation ranged from 25-30%
increasing daily DMI with statistical
significant difference (P<0.05).
There was an initial rejection of EG +
GS by goats and this affected intake. However,
its intake was close to EG-sole diet but lower
than EG+IB and EG+LL. DMI of goats on EG
-sole diet was 562.5 while the total DMI of
goats on EG+GS; EG+IB and EG+LL was
527.8; 655.8 and 632.4 g/d/goat, respectively.
DMI of EG-sole diet was higher than EG+GS
while EG+IB and EG+LL were similar but
statistically different from EG-sole diet and
EG+GS (P<0.05).
Except for the goats on EG+GS, total
DMI was higher in EG+IB and EG+LL
(browse supplemented diets) than in EG-sole
diet. The intake of D3 (EG+IB) was followed
by EG+LL and the least in EG+GS.

14
Journal of South Pacific Agriculture, Volume 15: Nos. 1 & 2, 2011
Value of Leucaena, Gliricidia and Ipomea supplements for goats - Simon Baete & Martin Aregheore
Table 3. Voluntary feed intake, total dry matter intake, daily protein intake and apparent nutrient digestibility of goats.
Diets*
Proportion of Grass: Legumes EG EG+GS EG+IB EG+LL SEM+
100:0 72:28 70:30 75:25
Parameters
Forage (grass) intake (g/d/goat) 1008 766 898 902 51.0
Browse intake (g/d/goat) - 392 434 473 10.0
Total voluntary feed intake (grass + browse) (g/d/goat)
1008b 1158b 1332a 1375a 108.2
% of elephant grass in total intake 100 66.0 67.4 65.6 10.1
% of browse in total voluntary feed intake - 34.0 32.6 34.4 0.5
Total grass dry matter intake (g) 562.5 427.4 493.9 503.3 28.9
Total browse dry matter intake (g) - 100.4b 161.9a 129.1b 15.7
Total dry matter intake (grass + browse) (g) 562.5b 527.8c 655.8a 632.4a 39.7
Apparent nutrient digestibility (%)
Dry matter 47.5b 58.6a 59.6a 63.1a 3.9
Crude protein 61.8b 72.9a 75.5a 77.9a 4.1
Crude fibre 50.3 55.2 57.4 51.2 2.2
Nitrogen free extract 47.8b 60.2a 65.0a 68.2a 5.0
Organic matter 52.9b 60.3a 64.2a 65.5a 3.3
Total digestible nutrient (TDN) 46.5b 53.5b 53.6b 64.4a 3.9
Energy 73.7b 70.7b 73.7b 87.9a 4.6
Digestible dry matter intake (g/kg0.75/day) 26.4 30.9 39.0 39.9 4.3
Daily protein (N x 6.25) intake (g/kg0.75/day) 7.0 9.8 10.4 11.4 1.1
Daily organic matter intake (g/kg0.75/day) 45.0b 52.0a 56.7a 57.4a 3.4
Digestible energy (MJ/kg DM) 9.65 9.47 8.84 12.22 0.87
Nutritive value index (KJ/kg0.75/d)** 543bc 500c 588b 773a 68.8
* EG- Elephant grass –sole die; EG+ G. sepium; EG+ Ipomea batatas and EG + L. leucocephala
** Nutritive value index: relative intake x percent energy digestibility (Crampton et al., 1960)
+SEM – Standard error of mean a, b, cMeans for each response variable followed by the same letter are not different at P>0.05 using LSD.
Apparent digestibility coefficients in the
grass+ browse mixtures were higher compared
to the sole diet. Digestible DMI was 26.4,
30.9, 39.0 and 39.9 (g/kg0.75/day). Daily
protein (N x 6.25) intake was 7.0, 9.8; 10.4
and 11.4 (g/kg0.75/day) for EG-sole diets; EG
+ GS; EG + IB and EG +LL respectively.
Digestible energy (MJ/kg DM) was lowest in
GE+IB at 8.84 MJ/kg DM compared to GE-
sole diet, GE+GS and GE+LL. Nutritive value
index (KJ/kg0.75/d) of GE+LL at 773 KJ/
kg0.75/d was the highest (P<0.05).
DISCUSSION
Chemical composition of feed stuffs and
dietary treatment
The chemical composition of EG
(Pennisetum purpureum), GS, IB and LL are
similar in values to those reported in the
literature by Ash (1990), Moat & McL Drylen
(1993), and Aregheore (2004). Crude protein
of GE-sole diet and dietary treatments ranged
from 11.4-14.6% above the level that was
suggested by NRC (1981) to meet the
maintenance and fattening requirement of

15
adult goats stall fed with minimal activity.
Metabolizable energy contents of EG-sole diet
and EG+GS; EG+IB and EG+LL are
consistent with published estimates for forages
fed in the tropics and sub-tropical countries
(Butterworth, 1964).
Voluntary feed intake
Feed supplements did not adversely
affect the intake of basal diet. Voluntary DMI
of the goats on EG-sole diet was
comparatively higher. The differences between
the goats EG-sole diet and those on EG+GS;
EG+IB and EG+LL seems to implicate
substitution effects of the basal diet by the
supplements. The EG+GS; EG+IB and
EG+LL diets were consumed better than the
single component diet (EG-sole diet) and this
is consistent with the utilization of mixed diets
(Aregheore et al., 2002). Total dry matter
intake of goats on EG+IB was comparatively
higher, and the low DMI of EG+GS was due
to an initial rejection of Gliricidia by goats.
The presence of inhibiting allelochemicals
such as coumarins (Griffiths, 1962; Aregheore,
2005), flavanols (Manner & Jurd, 1979;
Aregheore, 2005; Jose & Reddy, 2010; Reddy
& Jose, 2010) and strong odour (Nochebuena
& O'Donovan, 1986) are implicated to cause
palatability problems and low intake of fresh
GS foliage (Smith & van Houtert, 1987) even
when mixed with other palatable forage. The
initial reluctance of goats for EG+GS concurs
with earlier reports that both anti-nutritive
factors mask and depress intake of GS based
diets (Chadhokar, 1982; Carew, 1983;
Brewbaker, 1986; Aregheore, 2005).
After the adaptation period of about 5
days, the goats freely consumed and utilized
the EG+GS mixture without detrimental
effects, and thereafter no rejection. Aregheore
et al. (2004) reported about 4-6 days for goats
to adapt to Gliricidia leaves. The intake of
EG+LL concurs with Abdulrazak et al. (1996)
who reported higher intakes of LL than GS in
sheep and cattle when both browses were used
as supplements to Napier grass in Kenya.
Behavioural and intake studies showed that
Leucaena is the most preferred among browse
and GS least preferred (Mtenga et al., 1993).
The presence of secondary plant metabolites
such as beta-carotene and xanthophyll in LL
makes it most preferred among browses
(Meulen et al., 1979), however in our study,
GS had no adverse effect on adult goats.
Goats were observed to spend more
time in eating, selecting the feed and
ruminating. However, more feed was
consumed to compensate for the energy lost
due to some feeding behavioural activities. We
also observed that DMI was influenced by
standard of tastiness (preference and
palatability) and level of protein in the browse
+ grass mixtures, and this agreed with earlier
studies on forage preference and palatability
phenomena of goats (Marten, 1978; Real et al.,
2001; Theng Kouch et al., 2003; Aregheore et
al., 2006).
Daily protein intake (DPI) ranged from
7.0 to 11.4 (g/kg 0.75/day), value higher than
that suggested by NRC (1981) to meet
maintenance requirement of goats in the
tropics and sub-tropics. The goats maintained
their live-weight throughout the experimental
period.
Apparent digestibility coefficient
Goats on EG-sole diet had the lowest
digestibility (Table 3). The high apparent
digestibility coefficients in the mixed diets
(EG+GS; EG+IB and EG+LL) is consistent
with (Norton, 1994; Aregheore, 2004) that the
inclusion of legumes in grass based diets
improves digestibility, nutrients utilization and
performance of goats. Foliage of legumes,
browses and multipurpose trees (Topps, 1992)
and Ipomea batatas vines (Scott, 1992;
Aregheore, 2004) are richer in CP, minerals
and digestible nutrients than grass alone.
Supplementation of grass based diets increased
voluntary intake, improved apparent
digestibility coefficient and nutrient utilization
for maintenance of adult goats in the dry
season period.
Data on DMI, DM digestibility and
nutritive value index (KJ/kg 0.75/d) (Table 3)
are consistent with the three qualitative effects
of stimulative, additive and substitutive
reported by Huston (1993). Goats on EG-sole
diet, and EG+GS, EG+LL and EG+IB
exhibited all three qualitative effects in each of
phase of our trial.
Organic matter digestibility (OMD) is
used to predict the value of metabolizable
energy. Organic matter digestibility (OMD) in
all the dietary treatments was above 50 % but
Journal of South Pacific Agriculture, Volume 15: Nos. 1 & 2, 2011
Value of Leucaena, Gliricidia and Ipomea supplements for goats - Simon Baete & Martin Aregheore

16
lower than values reported by Theng Kouch et
al. (2003) when the foliage was offered
hanging compared to feeding troughs used in
our study. OMD, digestible energy (MJ/kg
DM) and daily protein (N x 6.25) intake (g/
kg0.75/day) values demonstrated that the diets
had enough energy and protein that were
efficiently utilized to sustain nutritional
adequacy of adult goats during each phase. A
biological/nutritional explanation for the
difference observed in digestible energy (MJ/
kg DM) of the dietary treatments may be due
to the metabolizable content of diets.
Although, the EG-sole diet had higher
nutritive value index (KJ/kg0.75/d), the addition
of LL, GS and IB leaves improved the intake
and utilization of EG. This subsequently
helped to overcome the problem of weight loss
and low productivity; the usual characteristics
experienced in grazing ruminants during the
dry season period (Aregheore, 2001).
CONCLUSION
Available data suggest that leaves of
LL, GS, and IB are potential supplements to
elephant grass in meeting nutritional
requirements of adult goats‘ in PICs. Leaves
of Ipomea batatas (IB) provided cheap
nitrogen source in adult goat‘s diet (Nambi et
al., 2001; Katongole et al., 2009). Ipomea
batatas high foliage yield and CP content; and
palatability implicate it as a suitable protein
supplement for animals on low quality forage
in the dry season. The leaves of IB are
underutilized protein supplement in the
nutrition of small ruminants.
Among the dietary treatments the vines
of IB were more acceptable than GS. EG+IB
compared favourably with EG+LL in daily
forage intake of adult goats. Based on apparent
digestibility coefficients and potential
utilization, the dietary treatments can be
ranked in the following order: EG+LL>
EG+IB > EG+GS > EG-sole diet in meeting
maintenance requirements of adult goats.
Leaves of the browses and vines of sweet
potato can be incorporated in the daily forage
allowance of adult goats without deleterious
effects on apparent nutritional adequacy during
the dry season in PICs.
Journal of South Pacific Agriculture, Volume 15: Nos. 1 & 2, 2011
Value of Leucaena, Gliricidia and Ipomea supplements for goats - Simon Baete & Martin Aregheore
Acknowledgements
The senior author is grateful to The University of the South Pacific Research Committee for funds;
Mr. Daya Perera and Staff of the Central Laboratory, The University of the South Pacific, School
of Agriculture and Food Technology, Alafua Campus, Apia, Samoa for the initial laboratory
analyses; and Mr. Peter Corbett and staff of the Chemistry Laboratory, National Agricultural
Research Institute, Boroko, NCD Papua New Guinea for the fibre and gross energy analyses.
References
ABDULRAZAK, S. A., MUINGA, R. M., THORPE, W. & ORSKOV, E. R. 1996. The effects of
supplementation with Gliricidia sepium or Leucaena leucocephala forage on intake,
digestion and live-weight gains of Bos Taurus X Bos indicus steers offered Napier grass.
Animal Science, 63:381-388.
AOAC. 1995. Official Methods of Analysis, 16th edition (Association of Official Analytical
Chemists, Arlington, VA).
AREGHEORE, E. M. 2004. Nutritive value of sweet potato (Ipomea batatas (L.) Lam) forage as
goat feed: voluntary intake, growth and digestibility of mixed rations of sweet potato and
batiki grass (Ischaemum aristatum var. indicum). Small Ruminant Research, 51:235-241.
AREGHEORE, E. M. 2005. Feeds and forages in Pacific Island farming systems. http://
www.fao.org/ag/AGP/AGPC/doc/Newpub/feeds_forages/feeds_forgaes.htm
AREGHEORE, E. M., PERERA, D. & YAHAYA, M. S. 2004. Nutritive value of batiki grass
(Ischaemum aristatum var. indicum) supplemented with leaves of browses (Gliricidia
sepium and Leucaena leucocephala) on performance of goats. International Journal of
Agriculture and Biology, 6(1):143-148.
AREGHEORE, E. M., ALI, I., OFORI, K. & RERE, T. 2006. Studies on grazing behaviour of

17
Journal of South Pacific Agriculture, Volume 15: Nos. 1 & 2, 2011
Value of Leucaena,Gliricidia and Ipomea supplements for goats - Simon Baete & Martin Aregheore
goats in the Cook Islands: The Animal-Plant complex in forage preference/palatability
phenomena. International Journal of Agriculture and Biology, 8(2):147-152.
BAMIKOLE, M. A. & IKHATUA, U. J. 2010. Nutritional evaluation of Ficus thonningii-
Panicum maximum mixtures in West African dwarf goats. Nutrition and Food Science, 40
(3):280-288.
BREWBAKER, J. L. 1986. Leguminous trees and shrubs for Southeast Asia and South Pacific. In:
BLAIR, G. J., IVORY, D. A. & EVANS, T. R. (eds), Forages in Southeast Asia and South
Pacific Agriculture. Proceedings of a workshop held at Cisarua, Indonesia. ACIAR
Proceedings No. 12. ACIAR, Canberra, pp. 43-50.
BUTTERWORTH, M. H. 1964. The digestible energy contents of some tropical forages. Journal
of Agriculture Science (Cambridge), 64:319-321.
CHADHOKAR, P. A. 1982. Gliricidia maculata: a promising legume fodder plant. World Animal
Review, 44:36-43.
CRAMPTON, E. W., DONNEFER, E. & LLOYD, L. E. 1960. A nutritive values index for
forages. Journal of Animal Science, 19:538-544.
GRIFFITHS, L. A. 1962. On the co-occurrence of coumarin, O-coumaric acid and melilotic acid
in Gliricidia sepium and Dipteryx odorata. Experimental Botany, 13:169-175.
HUMPHREYS, L. R. 1994. Tropical forage: Their role in sustainable agriculture. Longman,
Harlow, UK. 414p.
HUSTON, J. E. 1994. Effects of supplemental feeding on intake by kid, yearling and adult Angora
goats on Rangeland. Journal of Animal Science, 72:768-773.
JOSE, B. & REDDY, L. J. 2010. Evaluation of antibacterial activity of the leaf and flower
essential oils of Gliricidia sepium from South India. International Journal of Applied
Pharmaceutics, 2(2):20-22.
KATONGOLE, C. B., BAREEBA, F. B., SABIITI, E. N. & LEDIN, I. 2009. Intake, growth and
carcass yield of indigenous goats fed market wastes of sweet potato vines (Ipomea batatas)
and scarlet eggplant (Solanum aethiopicum). Tropical Animal Health and Production, 41
(8):1623-1631.
MANNER, G. D. & JURD, L. 1979. Additional flavonoids in Gliricidia sepium. Phytochemistry,
18(6):1037-1042.
MARTEN, G. C. 1978 The animal-plant complex in forage palatability phenomena. Journal of
Animal Science, 46:1470-7
MEULEN, U. S., STRUCK, E. A. & HARITH, E. C. 1979. A review of nutritive value and toxic
aspects of Leucaena leucocephala. Tropical Animal Production, 4:113-126.
MOAT, M. & MCL DRYLEN, G. 1993. Nutritive value of sweet potato forage (Ipomea batatas
(L) Lam) as ruminant animal feed. Papua New Guinea Journal of Forestry and Fisheries,
36(1):79-85.
MTENGA, L. A., KOMWIHANGILO, D. M. & KIFARO, G. C. 1999. Selectivity in sheep and
goats fed Albizia, Gliricidia, Leucaena and Tamarind multipurpose trees.
LEBBIE, S. H. B., REY, B. & IRUNGU, E. K. 1993. Small Ruminant Research and Development
in Africa. Proceedings of the Second Biennial Conference of the African Small Ruminant
Research Network, AICC, Arusha, Tanzania, 7-11 December 1992. ILCA (International
Livestock Centre for Africa)/CTA (Technical Centre for Agricultural and Rural Co-
operation). ILCA, Addis Ababa, Ethiopia. 268 pp.
NAMBI, J., MUTETIKKA, D. & BAREEBA, F. B. 2001. Performance of lactating dairy goats fed
diets of sweet potato vines, banana peels and maize leaves, supplemented with legume tree
foliage. Makerere University Agricultural Research Institute, Kabanyolo Research Bulletin
Vol. 4:43.

18
Journal of South Pacific Agriculture, Volume 15: Nos. 1 & 2, 2011
Value of Leucaena,Gliricidia and Ipomea supplements for goats - Simon Baete & Martin Aregheore
NOCHEBUENA, G. & O'DONOVAN, P. B. 1986. The nutritional value of high-protein forage
from Gliricidia sepium. World Animal Review, 57:48-49.
NORTON, B. W. 1994. Anti-nutritive and Toxic Factors in Forage Tree Legumes. In: Ross C.
Gutteridge and H. Max Shelton (Eds.) Forage Tree Legumes in Tropical Agriculture. CAB
International, Wallingford, Oxon OXIO 8DE, UK. Chapter 4.
NRC (National Research Council). 1981. Nutrient requirements of goats: Angora, dairy and meat
goats in Temperate and tropical countries. No.15. National Academy of Science,
Washington DC.
ORDEN, E. A., ABDULRAZAK, S. A., CRUZ, E. M., ORDEN, M. E. M., ICHINOHE, T. &
FUJIHARA, T. 2000. Leucaena leucocephala and Gliricidia sepium supplementation in
sheep fed with ammonia treated rice straw. Effects on intake, digestibility, microbial
protein yield and live-weight changes. Asian-Australasia Journal of Animal Science,
13:1659-1666.
REAL, D., GORDON, I. L. & HODGSON, J. 2001. Statistical modelling of grazing preference of
sheep when presented with a range of plant types. Journal of Agricultural Science,
(Cambridge), 136:111-117.
REDDY, L. J. & JOSE, B. 2010. Chemical composition and antibacterial activity of the volatile
oil from the bark of Gliricidia sepium. International Journal of Pharmacy and
Pharmaceutical Sciences, 2(3):177-179.
SCOTT, G. J. 1992. Sweet potatoes animal feed in developing countries: present patterns and
future prospects. In: Machin, D., Nyvold, S. (Eds), Roots, Tubers, Plantains and Bananas in
Animal Feeding. Health FAO Animal Production Paper, 95:183-199.
SKERMAN, P. J. & RIVEROS, F. 1990. Tropical grasses. FAO, Rome. pp. 832.
SMITH, O. B. & VAN HOUTERT, M. F. J. 1987. The feeding value of Gliricidia sepium: a
review. World Animal Review, 57:57-68.
SPC (South Pacific Commission). 1983. Sweet potato. South Pacific foods. Leaflet 13.
Community Education Training Centre, Suva, Fiji.
THENG KOUCH, PRESTON, T. R. & LY, J. 2003. Studies on utilization of trees and shrubs as
the sole feedstuff by growing goats; foliage preferences and nutrient utilization. Livestock
Research for Rural Development, 15(17), 2003. http://www.lrrd.org/lrrd15/7/kouc157.htm
TOPPS, J. H 1992. Potential, composition and use of legume shrubs and trees as fodders for
livestock in the tropic. Journal of Agricultural Science (Cambridge), 118:1-8.
VAN SOEST, P. J., ROBERTSON, J. B. & LEWIS, B. A. 1991. Methods for dietary fibre, neutral
detergent fibre and non-starch polysaccharides in relation to animal nutrition. Journal of
Dairy Science, 74:3583-3597.

19
Forging Fijian Camaraderie: The cultural significance and social uses of kava
(yaqona) (Piper methysticum Forst. f) in three upper watershed communities in
north western Viti Levu (Fiji Islands)
Dan F. Orcherton1
ABSTRACT
Kava (yaqona) (Piper methysticum Forst. f) is an important non-timber forest product for many
Pacific Island cultures. Three villages (Navala, Nadrugu and Nakoroboya) in north-western Viti
Levu (Fiji Islands) were part of a FORENET/USP/PACE-SD (International Forestry and
Environmental Network/University of the South Pacific/ Pacific Centre for Environment and
Sustainable Development) sponsored, socio-economic and bio-cultural study (April to June 2011).
Part of this field work focused on the anthropology of kava, using participant observation and
ethnographic analysis in traditional bure settings. Results revealed that Navala villagers had a
more intense and profound symbolic meaning and cultural understanding of kava and elders
upheld and safeguarded kava protocols, stories and traditions. Nadrugu and Nakoroboya however
exhibited a less cultural understanding of kava based on varying degrees of acculturation and
changing traditional mores and customs. The cultural significance and social uses of kava
(yaqona) were important in all three villages studied and contributed to forging strong social and
cultural relationships.
Key words: Kava, cultural significance, social issues, biocultural diversity, traditional ecological
knowledge, sevusevu and ni tautau.
INTRODUCTION
Kava and its importance in the Pacific
Kava (yaqona) (Piper methysticum
Forst. f) has long been at the social, cultural
and economic centre of many Pacific island
cultures (Lebot et al., 2007), and often
characterised as a valuable non-timber forest
product. Kava is profoundly important as a
way of bringing people together, along with its
ethno-botanical and ethno-pharmacological
properties. Yaqona in the Fijian vernacular is
also "grog dope" or "yaqona ke nasha".
According to legend (Go-Fiji, 2012):
"the word ―yaqona‖ (pronounced yang-
GO-na) was derived from the Fijian
god Degei, whose name means ―from
heaven to the soil and through the
Earth.‖ He had three sons, all of whom
he had given two sacred crops, vuga (a
type of tree) and yaqona, so that they
could receive wisdom from them. In
turn, the sons gave them to their other
people, and the legend states that to
this day, the crops grow wherever
Fijian descendents" (p.1).
Kava carries with it symbolic and ritualistic
traditional ecological knowledge (TEK), that
has been passed down through the generations.
Depending on the culture and specific local
socio-cultural milieu‘s, kava occupies an
important place in forging spiritual sources of
wisdom to seek ancestral favour (Lebot et al.,
1997:121) that encompasses the use of this
1Cultural Anthropologist and Rural Sociologist. Senior Lecturer (Climate Change) & FORENET Project Coordinator. University of the South Pacific PACE-SD (Pacific Centre for Environment and Sustainable Development) Private Bag, Laucala (Lower)
Campus, USP, Suva, Fiji Islands. Telephone: (Office) (+679) 323-2376, Mobile (+679) 9479399. Email: [email protected] 2Which included its symbolic meaning and cultural understanding that sustains its central place within Pacific Islander social life,
and highlighted the uses of kava (yaqona) as a valuable exchange item within social relationships? 3A series of three community sevusevu‘s and departure i tautau ceremonies were conducted as well as 10 in-depth kava-sessions
were completed in all three communities. The author combined visualism and collaborative ethnographic methods to be socio-
cultural determinants (departure points) from which observations and conclusions were made. Prior and informed consent was
agreed upon involving the village headman (Turaga ni Koro) and other men and women participants.
Forging Fijian Camaraderie - Dan F. Orcherton
Journal of South Pacific Agriculture, Volume 15: Nos. 1 & 2, 2011

20
mildly psychotropic drug4.
Pre-historical memoirs of the discovery
and settlement of the remote Pacific Islands,
has been characterised by historians as
speculative and dubious since the 1700‘s
(Lebot et al., 1997). The same author reiterates
that it ―seems clear that Pacific Island peoples,
along with most of their domesticated plant
and animal assemblages, originated in
Southeast Asia‖ (p.5). Human populations first
colonized Sahul; a large land area of New
Guinea and Australia (then connected by land
bridge ), at least 40,000 years ago (Bellwood,
1978). This affirmation is also substantiated by
Nunn (1994; 1998). The nearby islands of
Western Melanesia were reached later in
history (e.g. New Ireland circa 32,000 B.P), and
the western Solomon Islands circa 29,000 B.P;
(Allan et al., 1989). Until about 4000 years B.P,
human settlements in the Pacific were
restricted to these Western most Islands of
Melanesia. Since then, migrants and sailing
canoes have located and populated all of the
remaining inhabitable tropical and subtropical
islands of the central and eastern Pacific.
When European explorers first arrived on the
remote Pacific Islands, kava was used in many
societies an integral part of religious, political
and economic life (Figure 1), which
transcended into its habitual and ritualistic
uses in ceremonies.
As far as its origin, Kava is a Pacific
plant domesticate (Yen, 1985), and suggests
that ―the Oceanian‘s5 retained (or reinvented)
the ethno botanical concepts of domestication
throughout their geographical spread and
individual paths of development (p.5)‖. The
plant itself is a Pacific domesticate that
originated outside of Southeast Asia and New
Guinea. Some suggestions by Yen (1985)
highlight that in the northern Islands of
Vanuatu is a species and as vegetatively
4Its active principle, are a series of kavalactones that are concentrated in the rootstock and roots. Islanders in just these psychoactive chemicals I drinking cold water infusions of chewed, ground, pounded, or otherwise macerated kava stumps and roots (Lebot et al.,
1997, p.1). 5The islands of the southern, western, and central Pacific Ocean, including Melanesia, Micronesia, and Polynesia. The term is sometimes extended to encompass Australia, New Zealand, and the Malay Archipelago. (Free Dictionary, 2012. Retrieved from:
http://www.thefreedictionary.com/Oceanians).
Figure 1. Paulaho King of the Friendly Islands (Tonga) Drinking Kava. (Source : J, Webber artist on James Cook‘s third voyage to the Pacific (Courtesy of Hawaii State Archives, Honolulu).
Journal of South Pacific Agriculture, Volume 15: Nos. 1 & 2, 2011
Forging Fijian Camaraderie - Dan F. Orcherton

21
propagated root crop. The same author
suggests that kava is very young domesticate-
perhaps less than 3000 years old, and that it
originated from Vanuatu; carried eastward into
Fiji and Polynesia and then westerward into
scattered areas of New Guinea and into two
islands of central Micronesia (Lebot et al.,
1997).
From a linguistic anthropological
perspective, affinity exists between the name
malohu in the reconstructed term maloku
(kava) from Portal-North Central Vanuatu
(Lebot et al., 1997). According to Crowley
(1990), ―is the language ancestral to probably
all of the languages spoken between Efate and
the Torres in Vanuatu‖ (Crowley, 1990;1991).
The same author reports that maloku also has
Fijian reflexes that mean ―quiet‖ or
―subdued‖ ( Lebot et al., 1997). This brief
linguistic history or heritage could date kava‘s
domestication to before the breakup of Proto-
North Central Vanuatu language some 3000
years ago. Recent speculation from a socio-
cultural perspective that a large number of
present-day kava cultivars supports linguistic
clues to partially explain its antiquity in
Vanuatu (Lebot et al., 1997; Allan et al.,
1989).
Kavettes6
The way in which kava is prepared and
consumed various greatly between Pacific
islands such as Vanuatu, Papua New Guinea
and American Samoa. In Vanuatu for example,
during a circumcision ceremony, kava is
prepared with the roots and root stocks and the
stump is cut to smaller pieces and cleaned,
then "chewers" masticate the kava and drank
from three chewed mouthfuls of honoured
guests. In the Western Province of Papua New
Guinea, men move indoors and prepare kava
(Lebot, 1997). Hosts harvest the kava plants
earlier that day and "empower" the roots by
yelling "yikay". In an act of whooping and
stomping, the men carry them to their
longhouse7, in which all members of the
community reside. Men burn the leaves of a
forest palm to sweeten the kava. Others chew,
spitting mouthfuls of pulp into a bowl made
from the spathe of palm inflorescence. Both
hosts and guests contribute multiples to the
growing communal pile of chewed kava. Leaf
ashes mixed into the masticated kava which is
then divided into servings, each in a coconut
spathe bowl. Water is added and, is squeezed
by hand to infuse the drug (Lebot, 1997:162).
According to Holmes (1967, 1974) and
Malauulu et al. (1974), kava preparation and
consumption in American Samoa, starts with
the presiding chief, who selects a kava root
and hands it to one of the younger members of
the aumaga (the younger untitled men of the
village). This man cuts the kava into pieces
and uses a hammer stone to pound them into
pulp on the concave surface of the stone
mortar. Other aumaga members are washing a
large, multi-legged wooden kava bowl and
fetching water in plastic buckets. Conversation
is kept at a minimum and often workers smoke
is the work of preparation proceeds. Three
members of the aumaga carried a massive
bowl to the back of the house and sit behind it.
Patterns of kava consumption in American
Samoa are based on strict protocol. The village
manaia, the leader of the aumaga, who
prepares the kava sits directly behind the
bowl8. The manaia takes off his shirt and turns
up his lavalava (waistcloth) not extend below
his knees. He turned to his right to wash his
hands for beginning to prepare the kava
infusion. Kava pulp is then strained through
the inner bark of Hibiscus tiliaceus (‗fau’), and
twists the fau, as to allow the strained kava to
pour back into the bowl. The manaia inspects
the color, cleanliness and the sound of
splashing, and signifies its readiness. In
response, the collective chiefs clap their hands
together several times. At this point, the
manaia wipes the rim of the bowl with the fau
and lays his hands upon the size of the
container. The tulafale (orators or "talking
chiefs"), begin kava service by conducting
rollcall of drinkers (Lebot, 1997:166). In
Samoa, as elsewhere in Polynesia and Fiji,
drinking order is politically charged and
6Lebot refers to these as "Kavettes" (derived from the term "vignettes"), that describe kava use and consumption in various island
communities (adopted from Labot, 1997:155). 7Single building about 23 m long in which all members of the community reside (Lebot, 1997:162). 8In other Pacific island contexts, this place is taken by the taupau, the ceremonial village virgin.
Forging Fijian Camaraderie - Dan F. Orcherton
Journal of South Pacific Agriculture, Volume 15: Nos. 1 & 2, 2011

22
culturally significant. The most prestigious
positions in the roll calls differ from place to
place, but are usually at the beginning and the
end of the drinking order.
Cultural importance of the kava ceremony
in Fiji
Historically and according to Singh
(1986:1992) and Anon. 2012b, "Kava was
used as a social drink for high-ranking chiefs
and elders, and drank as a form of welcome for
honoured guests, consumed for preparation
and completion of an event or of work, to
validate status, observe births, marriages and
deaths, to relieve stress, remedy illnesses etc
(p.2). Kava was also drank in kinship and
chiefship rituals, for public atonement of
misdeeds. Many people were pardoned for
their crimes after a kava ceremony" (p. 1).
Kava's historical significance continues in the
Pacific (and more specifically in Fiji) yaqona
is also referred to locally as wai ni vanua
(water of the land, people and culture). Work
by Aporosa (2011) suggests that many Fijians
refer to this as a ingestible manifestation of
their vanua; a drinkable representation of the
people, the land, culture and cultural practice
(Tomlinson, 2009:111-112). The drinking of
yaqona is encouraged as it demonstrates,
externalizes and personifies "Fijian-ness‟ and
the Fijian way, therefore further enhancing
cultural identity (Ratuva, 2007:92-6, 98-9;
Vakabua, 2007:103). Former Fijian Methodist
Church President Talatala Ilaitia Tuwere stated
yaqona importance in ―hold[ing] the people
and land together [to] save them from
alienation like overseas countries" (1999:16).
Tuwere (1999) comments that Fijian custom
considers the drinking of yaqona a moral
obligation (p.16) with consumption guided,
informed, and founded upon the central ethos
of vakaturaga (Ravuvu, 1987:26, 235). In
essence, Vakaturaga (and its parallel
vakamarama; womanly character traits)
encapsulates the Fijian ideal, comprising
"Chiefly" values irrespective of one‘s status
such as veidokai (respect), vakarokoroko
(humility), kila na i yatu (knowing ones place
in the community), qaravi tavi (fulfilling
obligations), veiwasei kei na veikauwaitaki
(sharing and caring), veivosoti (forgiveness),
veivukei (helpfulness) and yalo malua (a quiet
demeanour) and ideals. Ravuvu (1987:18-19,
235) argues that this reinforces cultural
identity and strengthens. Turner (1986)
describes the kava ritual is a form of sacrifice,
allowing the participants to communicate
directly with supernatural (p. 203).
Aporosa (2011:230) further describes
yaqona's significance within ritual practice as
"deemed to be beyond measure and quantity,
therefore 100 grams has the same value and
importance as 1 kilogram, and visa-versa
(Arno, 1993:79). This author further describes
that "once prepared in its aqueous beverage
form, yaqona becomes a sacred and living
entity; one that both embodies mana and has
the ability to enhance a person's mana
" (Turner, 1986:209; Tomlinson, 2004:669). It
was also noted in Ravuvu (1983:41), that
certain aspects of kava ritualistic drinking
formalities are observed as an automatic
response by drinkers in less formal social
drinking occasions. These traditional purposes
for Kava use in ceremonies still hold true
today, but vary in terms of the intensity and
overall significance, depending on the type of
ceremony/ritual or cultural activity being
performed.
METHODOLOGY
Three upper watershed communities
(Navala, Nadrugo and Nakoroboya) in
northwestern Viti Levu (Fiji Islands), were
part of a FORENET/USP/PACE-SD
sponsored in-depth socio-economic and
biocultural study from April to June 2011. One
of the study‘s socio-cultural objectives was to
focus on the anthropology of kava; which
includes its symbolic meaning and cultural
understanding that sustains its central place
within Fijian social life. This study also
highlighted the uses of kava (yaqona) as a
valuable exchange item within social
relationships and the spiritual and religious
significance of kava consumption (Lebot et al.,
2007). Part icipant observat ion and
ethnographic analysis were used within an
informal village settings in traditional bure’s
(Photo 2). A series of three community
traditional sevusevu’s and departure ni tautau
sessions were conducted as well as 10 kava
sessions in all three communities. Anon.
Forging Fijian Camaraderie - Dan F. Orcherton
Journal of South Pacific Agriculture, Volume 15: Nos. 1 & 2, 2011

23
(2012a) and Lester (1941) reported that
Sevusevu ceremonies are based similar
activities and protocols and that most Fiji
communities follow these rituals. Further
explanation of the actual ceremony can be
found in Appendix 1. Sevusevu sessions were
used as ethnographic determinants (socio-
cultural departure points) from which overall
observations and conclusions were made.
Figure 2. Kava drinking in Nakoroboya village in traditional bure setting. (With permission from partici-pants.) Photo by Sainimere Veitata, Research Assistant with FORENET Project.
Free, Prior and Informed Consent (FPIC)
There was the needed to incorporate
free, prior and informed consent as an ethical
and rights-based approach to research,
especially dealing with human subjects and the
analysis of livelihood strategies (IFAD, 2005).
Essentially, ―Free, prior and informed consent
recognizes indigenous peoples‘ inherent and
prior rights to their lands and resources and
respects their legitimate authority to require
that third parties enter into an equal and
respectful relationship with them, based on the
principle of informed consent‖ (IFAD, 2005).
This approach was adopted in the introduction
phase of the PACE-SD methodology
(Appendix 2).
RESULTS AND DISCUSSIONS
Brief socio-cultural characterisation of
three upper watershed communities
Table 1 and Table 2 show summaries
of socioeconomic services and livelihood
activities, respectively, in three villages in
Upper Ba watershed.
Kava (Piper methysticum Forst.f), a
member of the pepper family (Piperaceae),
sustains a central place within upland Fijian
culture and social life, based on its profound
Forging Fijian Camaraderie - Dan F. Orcherton
Journal of South Pacific Agriculture, Volume 15: Nos. 1 & 2, 2011
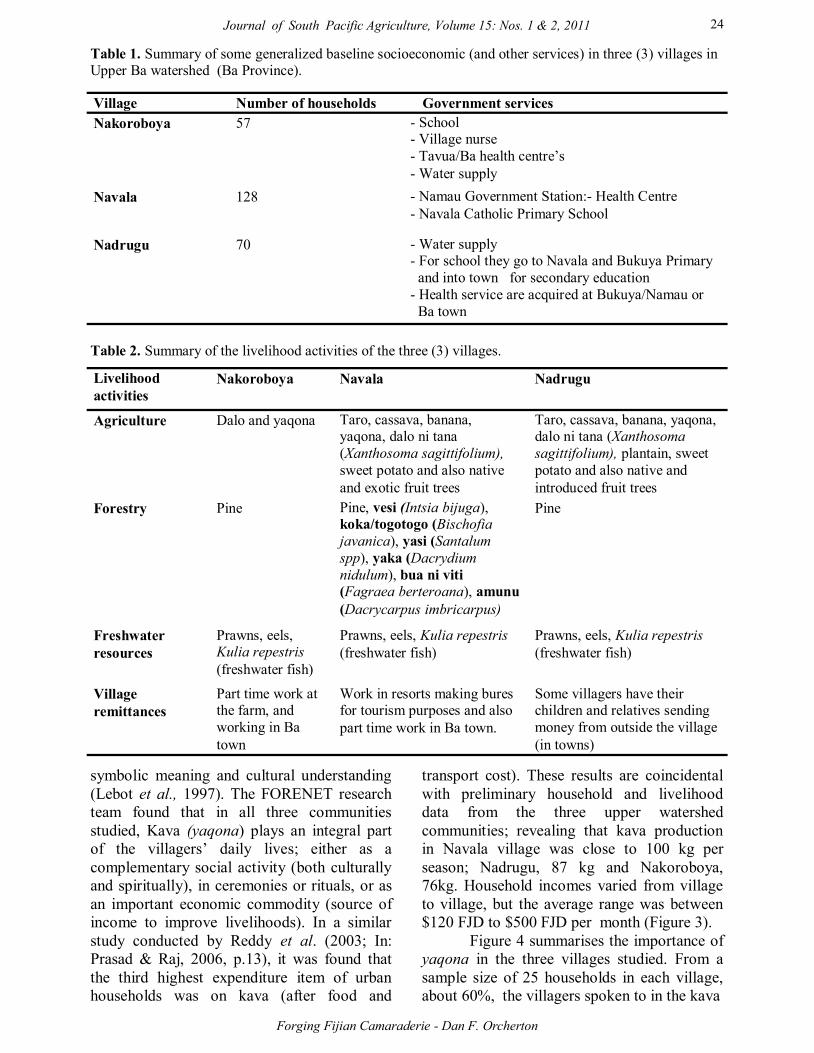
24
Forging Fijian Camaraderie - Dan F. Orcherton
Journal of South Pacific Agriculture, Volume 15: Nos. 1 & 2, 2011
symbolic meaning and cultural understanding
(Lebot et al., 1997). The FORENET research
team found that in all three communities
studied, Kava (yaqona) plays an integral part
of the villagers‘ daily lives; either as a
complementary social activity (both culturally
and spiritually), in ceremonies or rituals, or as
an important economic commodity (source of
income to improve livelihoods). In a similar
study conducted by Reddy et al. (2003; In:
Prasad & Raj, 2006, p.13), it was found that
the third highest expenditure item of urban
households was on kava (after food and
transport cost). These results are coincidental
with preliminary household and livelihood
data from the three upper watershed
communities; revealing that kava production
in Navala village was close to 100 kg per
season; Nadrugu, 87 kg and Nakoroboya,
76kg. Household incomes varied from village
to village, but the average range was between
$120 FJD to $500 FJD per month (Figure 3).
Figure 4 summarises the importance of
yaqona in the three villages studied. From a
sample size of 25 households in each village,
about 60%, the villagers spoken to in the kava
Table 2. Summary of the livelihood activities of the three (3) villages.
Livelihood
activities
Nakoroboya Navala Nadrugu
Agriculture Dalo and yaqona Taro, cassava, banana, yaqona, dalo ni tana
(Xanthosoma sagittifolium),
sweet potato and also native
and exotic fruit trees
Taro, cassava, banana, yaqona, dalo ni tana (Xanthosoma
sagittifolium), plantain, sweet
potato and also native and
introduced fruit trees
Forestry Pine Pine, vesi (Intsia bijuga), koka/togotogo (Bischofia
javanica), yasi (Santalum
spp), yaka (Dacrydium
nidulum), bua ni viti
(Fagraea berteroana), amunu
(Dacrycarpus imbricarpus)
Pine
Freshwater
resources
Prawns, eels, Kulia repestris
(freshwater fish)
Prawns, eels, Kulia repestris
(freshwater fish)
Prawns, eels, Kulia repestris
(freshwater fish)
Village
remittances
Part time work at the farm, and
working in Ba
town
Work in resorts making bures for tourism purposes and also
part time work in Ba town.
Some villagers have their children and relatives sending
money from outside the village
(in towns)
Table 1. Summary of some generalized baseline socioeconomic (and other services) in three (3) villages in Upper Ba watershed (Ba Province).
Village Number of households Government services
Nakoroboya 57 - School - Village nurse
- Tavua/Ba health centre‘s
- Water supply
Navala 128 - Namau Government Station:- Health Centre
- Navala Catholic Primary School
Nadrugu 70 - Water supply - For school they go to Navala and Bukuya Primary
and into town for secondary education
- Health service are acquired at Bukuya/Namau or
Ba town

25
sessions considered kava (compared to other
forms of social/cultural activities) to be very
important (48%); about 38% said that yaqona
was somewhat important, and a smaller
majority (13%) said that it was not that
important.
Some women and non-drinkers
(comprising the other 40% of the same sample
size from each village) said that kava was not
important and commented of its detrimental
effects, addictive properties and overall
misuse, which in turn contributed to tardiness
(related to completing household tasks),
laziness, as well as family disruptions and
breakups.
Kava and its social, cultural and economic
importance
Most kava drinkers in the villages
considered that its importance rests primarily
Figure 3. Average production (kg) and average household income ($FJD) derived from Kava
(Piper methysticum Forst.f) in three villages in Upper Ba Watershed.
Figure 4. Importance of yaqona in all six villages in Upper Ba watershed. Results based on ethnographic analysis and participant observation.
Forging Fijian Camaraderie - Dan F. Orcherton
Journal of South Pacific Agriculture, Volume 15: Nos. 1 & 2, 2011

26
Figure 5. Washing kava in Nadrugu village, in preparation for drying. (With permission
from participant.) Photo by D. Orcherton, 2011.
Forging Fijian Camaraderie - Dan F. Orcherton
Journal of South Pacific Agriculture, Volume 15: Nos. 1 & 2, 2011
on the fact that it is a source of income (mainly
because of stable market prices, availability of
local markets – Ba Town or Nadi). Local
consumption of Kava in Navala village
accounts for roughly 45%, and the remaining
55% is sold in markets (e.g. Ba town being the
closest urban center where most of kava is
marketed and sold). Smaller amounts are sold
in markets in Tavua and Rakiraki, as well as
Nadi. Similar results were obtained for
Nadrugu village (30% local consumption; 70%
local market mainly Ba) and Nakoroboya with
a higher proportion of kava (85%) being
consumed locally and the remaining 15% sold
in markets; presumably because the
opportunity costs of selling kava in markets
(mostly Ba) was lower than consuming it
locally. Respondents explained that it was
more costly for them to transport to Ba market
even with the high market prices for dry-kava
roots. On almost all the farms in all three
villages, Kava plants themselves maintain high
rates of on-farm productivity. Most farmers
commented on ease of accessibility to plants,
cultivars and/or seed-plants (Figure 5), but
complained that it was getting harder to find
plants that can withstand drought or heavy
rains, due to the effects of climate change.
Respondents commented that due to
unpredictable seasonal changes and intensity
of extreme rainfall events, kava plants become
stunted and necrotic (yellowing of leaves) due
to excess water on poorly drained soils. Kava
tends to grow slower than usual even with the
same amount of care and maintenance.
Drought periods are becoming
noticeably longer (particularly in "El Niño
years") which affects the ability of the kava
plant to produce strong, well-formed root
systems. Slash-and-burn (or migratory
agriculture) practices and deforestation causes
upland forest degradation and soil erosion,
which ultimately affects kava production. As
an innovative adaptation strategy to the
impacts of climate change, farmers in Bukuya
(close to Nadrugu) for example are using an
N² fixer Leucaena leucocephala (Lam.) De Wit
(referred to as vaivai) as partial shade between
young kava to supplement nitrogen and
prevent soil erosion on slopes >20% (Figure
6).
Villagers also commented the spiritual
and cultural significance of yaqona as a
socialising tool to ―break down barriers‖ and
bestows upon them a feeling of ―friendship
and camaraderie‖. Some villagers, however,

27
don‘t partake in the consumption of kava,
which is considered an acceptable anomaly,
depending on the circumstances or whether
kava is used for ceremonies or other
community events, or not. Other motives
behind why Kava was not consumed in the
villages, was considered to mildly ‗neo-
religious‘ (introduction of new forms of
―religion‘ (e.g. Seventh-day Adventists,
Jehovah's Witness, and Baptists), which
discourage intoxicating beverages or other
stimulants as part of their doctrine. This
―missionary‖ rhetoric or influence particularly
with respect to the cultivation and
consumption of kava, has been at the center of
its symbolic meaning and cultural
understanding more than a millennium and has
also shaped villagers‘ appreciations (or
dislikes) of its many attributes.
The author considers ―traditional‖
Fijian communities in this study as those that
demonstrated a closer (tangible) association
with historical, cultural, social and spiritual
practices9 for the past decade, through
manifested oral histories, historical archives,
anthropological and varied ethnographic
research. The author also noted that more
traditional communities like Navala village
had a broader cultural respect for kava, and
seem to not misuse it as much as other
communities in the same watershed. This was
primarily based on its deep-rooted cultural
significance and symbolism with respect to the
villagers‘ overall holistic understanding of the
plant. Elders in Navala village, for example,
keep a ‗watchful eye‘ on the use of kava in the
community. Nadrugu and Nakoroboya
villagers (including the elders present in kava
sessions) has less regard for misuse of kava,
mainly because it was acceptable to drink kava
for the ―sake of drinking-it‖, or because it was
easily available. In all three villages, special
events such as funerals, births, or other
festivals, were considered important, but seen
as ways to indulge without too much concern
for protocol; Navala village, however
exhibited more rigor and rules that were
adhered to in terms of kava use (or misuse). It
was observed that women are permitted in
the kava sevusevu ceremony in Navala village,
and participated in the open-ended focus group
discussion sessions. The presence of women in
was also consistent with village protocol
during sevusevu and ni-tautau sessions in
Nadrugu and Nakoroboya villages (Figure 7).
Regardless of religious beliefs or new-
Figure 6. Community facilitator explaining the use of an ―A-frame‖ for soil conservation on hillsides. Farmers are using vaivai (Leucaena leucocephala (Lam.) De Wit, as light-shade for their
kava, and use an A-frame for planting on-contour to improve soil conservation on steep hillsides.
Photo by Matthew Kensen.
9Mainly refers to the maintenance/practice of traditional agriculture, soil conservation, Fijian folklore, transmission of life-stories and oral narratives, maintenance of traditional folkways, use of medicinal plants , , care and maintenance of crops for food security,
as well as maintenance of traditional livelihoods.
Forging Fijian Camaraderie - Dan F. Orcherton
Journal of South Pacific Agriculture, Volume 15: Nos. 1 & 2, 2011

28
Figure 7. Assistant Turaga ni Koro in Navala village mixing kava with women in traditional bure. (With permission from participants.) Photo by D. Orcherton, 2011.
Forging Fijian Camaraderie - Dan F. Orcherton
Journal of South Pacific Agriculture, Volume 15: Nos. 1 & 2, 2011
found devotions, yaqona was seen by Navala
villagers‘ as an ―acceptable and accepting
beverage that is used to welcome outsiders
and collaborators‖. Kava consumption
promotes tranquility, sociability and enables
peacefulness among villagers. Many
commented on its abilities of kava to calm
the nerves and promote negotiations were
tensions are sometimes high. Some villagers
commented that kava sessions are good for
negotiating land tenure, work in matagali’s
and planning for crop or tree planting and
harvesting.
Kava drinking practices have carried
over to shape the ways that these villagers
use alcohol (and more recently introduced
drug): consumption is typically social rather
than solitary; people drink quickly; men
drink more than women; drinkers empty
entire bottles at once, just as they drink the
bottom of the comparable; and so on (Lebot
et al., 1997, p.140). Historically however
drinkers normally sat silently, as noise and
bright lights can spoil kava affects (Lebot et
al., 1997). In much of Vanuatu example,
kava drinkers quietly listen to the effects of
the drug and to the voices of their ancestors
(Ashby,1984; Emerson 1903). Emerson
(1903) also noted that ―this idea which so
prevails among Hawaiians that [kava]
drunkenness is a goal of the drinker, has this
tendency, when they give themselves to the
use of alcohol stimulants, to make them hard
drinkers‖ (p. 3). Expectations of social and
peaceful kava drunkenness from villagers in
Navala, Nadrugu and Nacoroboya, contrasts
with what to expect from alcohol
(Lindstrom, 1982). In many cases, Pacific
Islanders understand that alcohol makes it
drinkers unruly and violent whereas
‗peaceful kava‘ invokes the coexistence of
two psychoactive drugs in many Pacific
societies are strengthened by these opposed
expectations of their effects (Philibert, 1986).
In other words, peaceful kava informs
disorderly alcohol, and vice versa (Lebot et
al., 1997, p. 140). Very little influence of
alcohol was present, even in habitual kava
drinkers in all three villages studied.
Origin myths (Malinowski, 1948)
have been at the centre of Pacific societies
for a long time, and myths themselves often

29
10Matagalis are land-based divisions based on clan or kinship relations in communities. Many of the mataglis that are known are based on historical and cultural understanding of their land–based resources. 11The kava presented in sevusevu has to be dried roots (not powder). The newspaper wrapping around the roots is less significant than the cultural/spiritual gestures during the ceremony itself.
Forging Fijian Camaraderie - Dan F. Orcherton
Journal of South Pacific Agriculture, Volume 15: Nos. 1 & 2, 2011
serve as a kind of narrative deed or claim to
land and other important resources; they also
function as sacred constitutions for existing
social groups (Malinowski, 1948). The
underlying narrative structures and core
symbols concerning origin myths encapsulated
specific Fijian worldviews; na Kalao (God); na
Vanua (including the land, people, ancestors,
spirits, environment, landscape, seas, and water
bodies); Na Tamata (human beings). Villagers
commented as well on a spiritual dimension
that yaqona helps to ―bring to the surface‖,
particularly in Vugalei (where there are places
or spots that are known to be tawa (occupied/
filled with spirits). Vugalei believe that there is
a power of darkness in their world that could
be avoided if people were widely informed of
one's rai (Baba, 2006, p.47). One of the things
that were discovered in the kava sessions was
this connectedness to their spirit-world, and
that Vugalei Fijians believe in the force or
spiritual power of mana- the power with which
most things in the vanua are said to have life.
Most ceremonial presentations in the three
villages involved giving of mana to people,
and it is spoken of in daily life (Baba, 2007,
p.49).
Kava‘s origin myths are recounts of
external provenience that centered on ancestral
heroes and descended from heaven that
bestowed kava to the people (Lebot et al.,
1997). For the villagers of Nadrugu and
Nakaroboyo (Figure 8), and as described in the
open-ended sessions, yaqona comes from and
causes death, but for the villagers of Navala
(Figure 9), origin myths are commonly
associated with sugar-cane myths, due to the
villages‘ close association with Fijian cane
growing cultures, descendent from immigrant
Indians. These origin myths coincide with
findings from Malinowski (1948) where often
these were interpreted as social charters, and as
a kind of narrative deed or claim to land and
other important resources. According to Lebot
et al. (1997), origin myths also served as
sacred constitutions for existing social groups
(Malinowski, 1948, in Lebot et al., 1997). In
terms of kava‘s life giving properties,
respondents also told of kava‘s apparent
medical uses and are associated with garden
fertility magic and first fruits ceremonies. This
coincides with Sahlins‘ findings that kava
resembles symbolizes life giving fluids (semen
or mother‘s milk) (Sahlins, 1981). Within the
Fijian culture, rules define social status and
create and nurture relationships and social
status, but these relationships also regularly
access to the drug. Villagers in Nadrugu and
Nakoro bo ya co mmu nit ie s ( t hough
unintentionally) seem to misuse kava and
undermine its legitimacy in a social or cultural
context, which in turn destabilizes the
communities public health and well-being.
Some of the habitual drinkers have skin
problems, breathing difficulties and other
ailments that seem attributed to chronic
substance abuse. There seems to a better
response from Navala villagers in terms of
gauging overuse, which was coincidental with
more traditional uses of kava for medicinal and
therapeutic purposes.
In terms of social consumption and
exchange, all three communities exhibited
similar characteristics; that kava ceremonies
promoted tranquility, sociability and
acceptance of the local political hierarchies.
Many of the community-based land
organizations and working relationships were
divided into matagalis10 and clan-based
kinship relations are strengthened by kava
preparation and consumption, which fortified
farming tasks and responsibilities. Navala
village exhibited stronger traditional ties held
together by both utilitarian and ceremonial
exchange however in all three villages kava
was used to improve and sustain social
relations among family members and among
village residents. The most valuable exchange
tokens were the yaqona wrapped in
newspaper11 (Figure 10) but more importantly,
were people themselves. These observations
coincide with results from Lebot et al.,1997,
and Toren, 1988) where kava exchange is
ritually formalised for important social
occasions (Lebot et al., 1997), and is a form of
conflict resolution and building political
alliances.

30
Figure 8. Village Head man (left) and wives discuss the importance of Kava as part of their daily livelihood and family economy. (With permission from respondents in Nanoko village.) Photo by
D. Orcherton, 2011.
Figure 9. Stories are often told by villagers during kava sessions. (With permission from Navala
Village Development Committee.) Photo by Sainimere Veitata, 2011.
Forging Fijian Camaraderie - Dan F. Orcherton
Journal of South Pacific Agriculture, Volume 15: Nos. 1 & 2, 2011

31
The traditional rites of passage (e.g.
weddings, funerals, male and female
initiations) of Fijian societies still exists,
however in recent years there has been more
influence of the Catholic Church and other
religious denominations in these villages that
has deterred people from more traditional/
ceremonies or traditional means of exchange
(Lebot et al., 1997).
In all villages studied, the mixing of
kava seemed ritualistic and according to
protocol, however traditional roles and
responsibilities were less defined in Nadrugu
(Figure 2) and Nakaroboyo. Rhythmic hand-
clapping was common in kava preparation
ceremonies which varied slightly from village
to village. Elders commented that cupped hand
clapping was a way to awaken their awareness
and bring more ―life to the supernatural‖.
Laughing, noise and social exchange of jokes,
stories and legends were also quite common in
all three villages and a way of forging
camaraderie and social relations (Figure 5).
CONCLUSIONS
The study concluded that kava remains
at the social, cultural and economic centre of
many Fijian cultures and communities,
particularly in the upper Ba watershed of Viti
Levu. Kava is especially important
economically for these villages, and provides
an important peacemaking function. Navala
village represented a more intense and
profound symbolic meaning and cultural
understanding of kava based on historical
accounts and spiritual connectedness to the
plant. Village elders upheld and safeguarded
kava protocols, stories and traditions. Nadrugu
and Nakoroboya however exhibited a less
intense cultural understanding of kava based
on progressive and/or varying degrees of
acculturation and changing traditional mores
and customs. Though the economics of yaqona
was beyond the scope of this study, elders
from these later two communities attributed
yaqona’s use value more from an economic
Forging Fijian Camaraderie - Dan F. Orcherton
Journal of South Pacific Agriculture, Volume 15: Nos. 1 & 2, 2011
Figure 10. Jale Turaga (Forestry Department/FORENET volunteer researcher) presenting the kava root (wrapped in newspaper) at sevusevu ceremony (Navala Village). (With permission from
Navala Village Development Committee.) Photo by D. Orcherton, 2011.

32
standpoint rather than emphasising its spiritual
or cultural importance. The cultural
significance and social uses of kava (yaqona)
are important in all three communities studied
and contribute to forging strong social and
cultural relationships.
Acknowledgements
This trip would not have been a success if it was not for the contribution from Sainimere Veitata
Research Assistant with FORENET. Some work was also done by his assistant Daiana Taoba on
the socioeconomics surveys and translation of vital community ethnographic information. The
author also wishes to thank Mr. Rokotamana Vitinaqailevu Junior; Project Research Assistant
(FORENET) for his contributions to data gathering on farms in the three communities. Many
thanks to the kind people of Nakoroboya, Navala, Nadrugu villages for their free-prior and
informed consent and assistance in the completion of the reconnaissance phase of this project. The
FORENET team would also like to thank the many EV414 post graduate climate change students
(Semester I) that kindly offered their time and assistance in gathering some relevant baseline
socioeconomic and biophysical information in Navala village. The FORENET Team would like to
profoundly thank the village headmen in all three villages and especially Mr. Mikaele Kubu
(FORENET-Community Liaison Officer from Navala Village), who traveled with the team and
carried out the traditional protocol in the villages. We are also grateful for the funders CIFOR for
their project funding assistance.
References
ALLEN, J. C., GOSDEN. R. & WHITE, J. P. 1988. Pleistocene dates for the human occupation of
New Ireland, Northern Melanesia. Nature, 331:707-709.
ANONYMOUS. 2012a. The Fiji-Kava-Ceremony.[Online].Fiji Taro and Kava 2012. Available at: http://www.fiji-taro-and-kava.com/fiji-kava-ceremony.html
ANONYMOUS. 2012b. What is Kava. [Online]. Available at: http://kavaroot.com/
aboutkava_frames.htm
APOROSA, S. 2011. Yaqona (kava), Education and Development in Fiji. In R. Gounder (Ed.),
Community development and managing change for growth among Pasifikans (pp. 227-
253). Auckland: Masilamea Press.
ASHBY, G. 1984. Sakau in Pohnpei. Glimpses of Micronesia, 24(3):38-40.
BABA, U. N. 2007. Knowing learning: An indigenous Fijian approach. The University of the
South Pacific Library Catalogue. IPS publications, PIAS-DG. p.165.
BELLWOOD, P. 1978. Man's conquest of the Pacific: the prehistory of Southeast Asia and
Oceania. New York: Oxford University press. p.120.
CROWLEY, T. 1990. Proto-who drank kava? Paper presented at meeting, Austronesian
Terminologies: Continuity and change, Australian National University Canberra. October
18-21.
CROWLEY, T. 1991. The National Drink and National Language. Paper presented at the 17th
Pacific science Congress. Honolulu, Hawaii.
EMERSON, O. P. 1903. The awa habit of the Hawaiians. The Hawaiian Annual. p.130-140
FREE DICTIONARY. 2012. Retrieved from: http://www.thefreedictionary.com/Oceanians).
GO FIJI. 2012. Fiji's Kava Culture. Retrieved from: http://www.go-fiji.com/kava.html (January
2012).
IFAD. 2005. Free Prior Informed Consent and Beyond: The Experience of IFAD. Department of
Economic and Social Affairs. Division for Social Policy and Development. Secretariat of
the Permanent Forum on Indigenous Issues. International Workshop on Methodologies
Regarding Free Prior and Informed Consent and Indigenous Peoples. (New York, 17-19
January, 2005).
Forging Fijian Camaraderie - Dan F. Orcherton
Journal of South Pacific Agriculture, Volume 15: Nos. 1 & 2, 2011

33
LEBOT V., MERLIN. M., & LINDSTROM, L. 2007. The Pacific Elixer. The Definitive Guide to
its Ethnobotany, History and Chemistry. Healing Arts Press. Vermount. USA. 253p.
LESTER, R. H. 1941. Kava drinking in Vitu Levu, Fiji. Oceania 12: 97-124.
LINDSTROM, L. 1982. Spitting on Tanna. Oceania, 50:228-234.
MALINOWSKI, B. 1948. Magic, science and religion. New York Free Press.
NUNN, P. D. 1998. Pacific island landscapes. Landscape and geological development of
Southwest Pacific islands especially Fiji, Samoa and Tonga. Institute of Pacific studies.
University of the South Pacific.
NUNN, P. D. 1994. Oceanic Islands. Library of Congress Publication. UK. BPCC. Wheetons Ltd.
PHILIBERT, J. M. 1986. The politics of tradition: towards a generic culture in Vanuatu. Mankind
16:1-12.
PRASAD, N. & RAJ, S.2006. The potential of small-scale informal sector businesses in
small developing countries: Fiji‘s kava industry . International Conference Successful
Small Business & Entrepreneurship from Small Islands Malta, 2-4 February 2006.
RATUVA, S. 2007. Na kilaka a vaka-Viti ni veikabula: Indigenous knowledge and the Fijian
cosmos: Implications for bio-prospecting. In A. T. P. Mead & S. Ratuva (Eds.), Pacific
genes & life patents: Pacific indigenous experiences & analysis of the commodification &
ownership of life (pp. 90-101). Wellington: Call of the Earth Llamado de la Tierra and the
United Nations University of Advanced Studies.
RAVUVU, A. 1983. Vaka i Taukei. The Fijian way of life. Institute of Pacific Studies. The
University of the South Pacific. p. 112.
REDDY, M., NAIDU, V. & MOHANTY, M. 2003. The urban informal sector in Fiji: results from
a survey. Fijian Studies, (1),1:127-154.
SAHLINS, M. D. 1981. The Stranger King. Dumesil among the Fijians. Journal of Pacific
History. 16:107-132.
SINGH, Y. N. 1992. Kava: an overview. Journal of Ethnopharmacology, 37:13-45.
TOREN, C. 1988. Making the present, revealing the past: The mutability and continuity of
tradition as process. Man, 23:696-717.
YEN, D. E. 1985. Wild plants and domestication in Pacific Islands. In: Recent advances in Indo-
Pacific Prehistory, ed. V.N.M Misra and P. Bellwood. New Delhi: Oxford University Press
and INH.
Forging Fijian Camaraderie - Dan F. Orcherton
Journal of South Pacific Agriculture, Volume 15: Nos. 1 & 2, 2011

34
APPENDIX 1
The Fiji kava ceremony
At each fiji-kava-ceremony the following are required:
1. Pounded kava and water,
2. Kava Strainer,
3. Tanoa; a wooden bowl carved explicitly for this purpose, with a length of woven coconut coir
attached to a "bulivula" (Ovula ovum) - akin to a golden cowrie seashell,
4. Kava bowls; fashioned usually from coconut shells,
5. A person to mix the kava, flanked by two others on either side of him,
6. A person to deliver the kava bowl to the main guest, and for dignitaries
7. A group to chant the kava dance mantra, for the cup bearer to dance his way to deliver the
VIP's bowl of kava.
The "sevusevu"
If the welcoming party is aware of the visiting delegation, it is customary they present their
"sevusevu" first before the visitors reciprocate.
After this "sevusevu" presentation, a round of kava drinking ensues from the mixture made ready
before the "sevusevu" was presented.
Alternatively, if the visitor arrives unannounced then the visiting delegation ought to present their
"sevusevu" first.
After the visitors or welcoming party have presented their "sevusevu", it is received with great so-
lemnity by the leader of the unit, or one of his nominees.
After the "sevusevu" presentations have ended, small talk then ensues which should lead into the
matter to be discussed. It should be noted that at some point before the meeting is ended, both par-
ties' kava "sevusevu" should be drunk, as fulfillment of the reception
[Adopted from: Fiji Taro and Kava (2012), and Lester, R.H. (1941), Kava drinking in Viti Levu.
Oceania 12: 97-124 ).
APPENDIX 2
Free, Prior and Informed Consent Procedures
Step 1: Determined who the main stakeholders were, and why they were interested in the project.
Step 2: Requested information from the project and distributed this to key community stake-
holders.
Step 3: Held discussions with the community. This was done through previous contact in the post
graduate level Climate Change post graduate level course (EV414).
Step 4: Identified community facilitators or negotiators for undertaking the project.
Step 5: Sought independent advice through the USP-PACE-CCA (Climate Change Adaptation)
project and other experts in community based vulnerability and assessments.
Step 6: Made community decisions (by consensus) and joint collaborative efforts locally.
Step 7: Maintained on-going communication with FORENET Project.
Forging Fijian Camaraderie - Dan F. Orcherton
Journal of South Pacific Agriculture, Volume 15: Nos. 1 & 2, 2011

35
Approach to address bean acidity problems in Papua New Guinea cocoa using
solar dryer technology
Noel Y. Kuman1
ABSTRACT
Dried cocoa beans from an adaptive solar dryer trial shown a markedly reduced acidity, hence
improved other ancillary cocoa flavour attributes. High level of bean acidity would otherwise
mask other desirable cocoa flavour attributes. Analysis of variance of solar and conventional dried
beans indicated a significant difference in acidity (P ≤ 0.05) and bitterness (P ≤ 0.05). Solar dryers
technology also has the potential to totally eliminate smoke contamination resulted from beans
dried using kiln dryers, which is widely used by cocoa growers in Papua New Guinea.
Key words: Solar dried beans, flavour characteristics.
INTRODUCTION
Papua New Guinea (PNG) cocoa is perceived
to contain high levels of acidity and smoke
contamination, which reduces its acceptability
by consumers. Acidity of beans is one of the
major quality problems affecting cocoa
produced by non-traditional producers such as
of South East Asian origin, including PNG.
The bean acidity problem is the result of acids
produced during fermentation which migrate
into the bean kernel; beans in the pods are
usually sterile and have a neutral pH. During
drying, most of the volatile acids that build up
inside the bean kernel during fermentation are
evaporated, while mostly non-volatile acids
remain in the beans, eventually giving rise to
an acid taste. Bean acidity is measured in pH
and Titratable Acids (TA). Detailed investiga-
tion of bean acidity has confirmed a very
strong correlation (r = 0.98***) between pH
and total TA (Chong et al., 1978). A study of
the citric acid cycle and carboxylic acid,
carried out to determine the cause of low pH
of cocoa, indicated that carboxylic acid (acetic
and lactic) appears to contribute most to low
pH (Rohan & Stewart, 1965).Traditional box
fermentation of South East Asia produces
beans that have excessive acidity (pH 4.4-4.7).
Chocolate derived from these beans is not
entirely acceptable having bitter taste and
lacking chocolate flavour strength (Shepherd,
1976). Biehl et al. (1985) reported that cocoas
exhibiting lower than desirable levels of
chocolate flavour may have higher levels of
acidity. Generally, the levels of acetic and
lactic acids are considerably higher in beans
produced by non-traditional cocoa producers
imparting the overall flavour balance of cocoa
(Wood & Lass, 1985). The broad ranges of
acids found in cocoa beans are acetic, lactic,
citric, malic, oxalic, propionic, succinic and
tatartic acids. The major acids found in large
proportions are lactic and acetic acids.
Holm & Aston (1993) proposed that
lactic acid had a greater influence on the acidic
taste of cocoa than acetic acid; the latter plays
a secondary role. While acetic acid greatly
influences pH and TA, it does not influence
acidic flavour, unlike lactic acid which
suppresses desirable flavour characteristics.
The oxalic acid concentration correlates
positively with cocoa flavour and is associated
with desirable flavour characteristic. Holm and
Aston‘s results may elucidate a possible
correlation between flavour and organic acids
but not all the compounds that have the
potential to affect flavour were investigated.
PNG has been marketing its cocoa
based on it unique flavour attributes that need
to be protected and improved. However, the
future marketing prospects of PNG cocoa
would decline, including losing its current and
potential consumers, if the current quality 1 Former senior research scientist, working with the Papua New Guinea Cocoa & Coconut Research Institute. Corresponding address: [email protected]
Journal of South Pacific Agriculture, Volume 15: Nos. 1 & 2, 2011
Bean acidity problems in PNG cocoa - Noel Y. Kuman

36
problems are not seriously addressed. Given
that cocoa remains as the major source of
income for a majority of smallholder famers in
the coastal regions of the country, any changes
in marketing of cocoa would affect their main
source of income. A study by Yabro & Nobel
(1989) indicated that between 80-100 percent
of the smallholder farmers in East New
Britain, East Sepik and Oro province depend
on cocoa as their main crop for cash income.
Smallholder farmers contribute 75 percent of
PNG‘s total cocoa export volume, while the
remaining quantities are supplied by the
plantation sector.
The flavour potential of any genotype
cannot be fully appreciated if the beans are not
correctly processed. Defects in post-harvest
processing such as in fermentation and drying
can alter or misrepresent the flavour profile.
Non-fermented (slaty) or partly fermented
(violet in colour) beans lack cocoa flavour.
Slaty beans produce an acid and stringency
flavour profile, while violets beans produce a
bitter and harsh flavour (Kattenberg &
Kemmin, 1993). Over-fermentation produces
beans with dark-coloured cotyledon and little
chocolate flavour (Wood, 1975). A putrefying
odour is produced from over-fermented beans
or beans from failed fermentation.
Deterioration in export bean quality is
one of the major problems affecting the PNG
cocoa industry. Major importers of PNG cocoa
such as European buyers have raised concerns
about poor bean quality (PNGCCRI, 1988).
The major quality and flavour concerns raised
are bean acidity and smoke contamination.
Cocoa flavour is contaminated when beans are
dried using kiln dryers that are not properly
constructed or lack proper maintenance
(PNGCCRI, 1995). Smoke contaminated
beans cause a smokey off-flavour in the
chocolate, which cannot be removed during
the chocolate manufacturing process (BCCCA,
1996). Smoke contamination generally results
from processing deflect but some genotypes
are also known to produce smoky and phenolic
off-flavours (Clapperton, 1994).
Under the Cocoa Quality Improvement
Program (CQIP) of the PNG Cocoa and
Coconut Research Institute (PNGCCRI),
funded by the Australian International
Development Assistance Bureau (AIDAB), the
major quality issues including high bean
acidity and smoke contamination were
addressed. Solar dryer technology is
considered as an alternative drying method
that has the potential to alleviate high bean
acidity and smoke contamination problems.
Different types of solar dryer prototype models
were developed and tested to assess suitability
and performance under the agro-ecological
conditions of PNG (Kuman, 1997). A suitable
solar dryer prototype developed from this trial
would provide an alternative method of drying
cocoa beans to address smoke contamination
and reduce bean acidity. From the research conducted, a solar
dryer prototype was selected based on its
performance and suitability. The new solar
dryer is constructed as an A-frame of timber
and clear laminated plastic sheeting. Black
painted rocks heat up in the sun and the warm
air passes by convection through the drying
rack (Hollywood et al., 1996). A total of 30
solar dryers of the selected prototype were
constructed and distributed to smallholder
farmers around the Gazelle area of East New
Britain province during 1996-1998 to assess
their performance under field conditions. The
solar dried beans from the adaptive trial were
collected on a weekly basis and their
organoleptic attributes were analyzed. The
average results of the quality assessment are
presented and discussed in this paper.
Objective
A relative assessment of the
organoleptic properties of cocoa dried using
solar or kiln and diesel fired dryers.
MATERIALS AND METHODS
Experimental design
Cocoa beans were fermented using the
mini- fermentation box described by Kuman &
Hollywood, 2009.
Sample collection & preparation
Approximately 500 g of dried beans
were collected from each of the 30 solar dryers
distributed throughout the Gazelle area of East
New Britain province on a weekly basis from
1996 to 1998. Representative samples from the
solar drier trial were randomly collected
together with equal quant it ies of
conventionally dried beans. The samples were
Bean acidity problems in PNG cocoa - Noel Y. Kuman
Journal of South Pacific Agriculture, Volume 15: Nos. 1 & 2, 2011

37
prepared at the PNGCCRI cocoa quality
laboratory. The samples were oven dried
(Contherm, New Zealand) at 115 oC for 15
minutes to standardize moisture content to less
than 7 % before being emptied into a
quartering device and thoroughly mixed. The
samples were bagged and sent to Nestle, UK,
for flavour assessment. Ghana samples were
used as an industrial standard for ―bulk‖ cocoa
and were included as references for
organoleptic assessments.
Flavour assessment
Organoleptic evaluation was conducted
by trained taste panelists following a described
procedure (BCCCA, 1996; Sukha, 2001). The
flavour intensity was estimated using a 0-10
scale, with 0 being weak and 10 being strong.
Individual flavour attribute scores from the
flavor profiling were used to determine the
mean. Variance component were investigated
using analysis of variance (ANOVA) to
determine significant differences between
treatments and the significance of interactions.
RESULTS
Figure 1 shows that solar dried beans
on average have lower levels of acidity. The
mean pH values for solar and conventionally
dried beans were 4.80 units with a TA of 0.243
and 4.60 units and 0.26 milligrams equivalent
(meq) citric acid /100 g respectively (Table
1). In a few cases, acidity levels of solar dried
beans were the same as conventionally dried
beans as the result of a bed loading less than
50 kg /square meter (kg / sqm). The solar dryer
prototype has the potential to dry cocoa at a
bed loading rate of 70-72 kg / sqm, which is
equivalent to 280-290 kg of fermented beans
(Kuman, 1997).
The solar dried beans on average have
lower level of residual acidity as compared to
conventionally dried beans which are
expressed by the pH and TA values.
The cut test results in Table 2 indicate
that solar drying produced a higher percentage
of brown and partly brown beans with less
purple as compared to beans dried using
conventional dryers.
Bean acidity problems in PNG cocoa - Noel Y. Kuman
Journal of South Pacific Agriculture, Volume 15: Nos. 1 & 2, 2011
Figure 1. A comparison of acidity levels of artificially and solar dried beans.
Table 1. Mean quality attributes of solar and conventionally dried beans.
Note: The higher the pH value, the lower the acidity, or vice versa. The higher the TA value, the lower the
acidity or vice versa.
Table 2. Average cut test result of solar dried beans from adaptive trials.
Mode of drying pH Titratable acidity (TA)
Solar dried bean 4.80 (±1) 0.24 (± 0.2)
Commercially dried beans 4.6 (± 0.6) 0.26 (±1 0.1)
Quality attributes
Mode of drying Brown Partly brown
Purple Germinated Slaty Criollo Mouldy
Solar dried beans 44 32 20 - - 4 -
Artificially dried beans 39 30 27 - - 4 -

38
Table 3. Comparison of flavour profiles of solar dried beans against conventionally dried beans and the Ghana reference sample.
*P ≤ 0.05 **P ≤ 0.01 ***P ≤ 0.001 Not significant (NS) P > 0.05
i) The chocolate flavour of Ghana cocoa is significantly (***P ≤ 0.001) different to cocoa flavours of conventionally and solar dried beans. The flavours (acid & bitter) of conventionally dried beans are significantly (*P ≤ 0.05) different to cocoa flavours of solar dried beans and Ghana samples. Brown fruity and floral flavours of Ghana cocoa are significantly (***P ≤ 0.001, *P ≤ 0.05)
different to cocoa flavours of solar and conventionally dried beans.
ii) Flavour intensity was estimated using 0-10 scale, with 0 being weak and 10 being strong. Flavour intensities scale: low intensities 1-3; Medium intensities 3-6; strong intensities 7-10.
The flavour profile results shown in
Table 3 indicate that PNG cocoas are
dominated by strong fruity and acidic flavours
which are quite different from the Ghana
reference sample. There are significant
differences in bitterness and acidity between
solar dried and conventional dried beans.
Discussion
Analysis of variance of solar dried and
conventionally dried beans has indicated that
there are no significant differences (P > 0.05)
in any flavour attributes except acidity (P ≤
0.05) and bitterness (P ≤ 0.05). However, there
are clear differences in fruity (P ≤ 0.001),
acidity (P ≤ 0.05), cocoa (chocolate) (P ≤
0.001) and bitterness (P ≤ 0.05) flavour
attributes of both solar and conventional dried
beans when compared to the Ghana reference
sample. PNG cocoa does not achieve the
chocolate, brown fruit/winey flavour
intensities like the Ghana reference samples.
The other important achievement for the solar
technology is that it totally eliminates smoke
contamination, which addresses one of the
biggest complaints regarding PNG cocoa
resulting from beans dried using kiln dryers
that are not properly maintained.
The solar dried beans have lower
residual acidity as indicated by higher pH and
lower TA values as compared to commercial
fermented beans (Table 1). Solar dried beans
were dried at a slower drying rate allowing
more volatile acetic acid to evaporate. The
permeability of the bean shell is maintained
over a longer period of time, providing
adequate time for the volatile acids to
evaporate. On the other hand, beans dried
using kiln or diesel dryers are dried at a faster
rate resulting in a more rapid hardening of
bean shells which prevents evaporation of all
volatile acids thus giving rise to high levels of
bean acidity. Sensory tests for solar dried
beans have shown them to have distinct
chocolate and other ancillary flavours with
lower astringency and bitterness as compared
to kiln and artificially dried beans (Kuman,
2009).
The slower drying rates of solar dryers
also allow sufficient time for completion of
oxidative reactions resulting in the conversion
of bitter polyphenols to insoluble tannins and
browning of beans. Polyphenols are
responsible for bitterness and astringency
(Rehm & Reed, 1983). Browning of beans is
considered to be the most important change
Bean acidity problems in PNG cocoa - Noel Y. Kuman
Journal of South Pacific Agriculture, Volume 15: Nos. 1 & 2, 2011
Flavour attributes PNG standard (conventionally
dried bean)
Solar dried
beans
Ghana reference
sample
Cocoa (chocolate flavour) 6.5 7.5 9.5***
Acid (acetic) 5.0 3.6* 2.9***
Bitter 4.4 3.9* 3.4
Burnt 1.6 1.0 1.4
Winey 8.5 7.8 9.4
Brown fruit 3.1 5 2***
Floral/fruity 3.7 2.6 3.2*
Green 3.1 2.1 1.8
Astringency 4.7 3.6 2.6

39
which starts during fermentation and continues
during the initial stages of drying.
There were dominant fruity and acid
flavours present in all PNG cocoa samples.
The fruitiness resembles fresh ripe banana
with fruit acid notes balanced with a good
basal flavour. The fresh ripe fruit, acids and
sometimes ―winey‖ flavours distinguish PNG
cocoa from the Ghana reference samples
(Table 2). The unique flavour characteristic of
PNG cocoa could be the result of the local
breeding and selection programmes, the role
and influence of local growing conditions
(climatic and edaphic - e.g. volcanic soil) or
other exogenous factors leading to local
adaptability. There are significant differences
in acidity (P ≤ 0.05) and bitterness (P ≤ 0.05)
between solar and artificially dried beans.
However, PNG cocoa produces pronounced
fruitiness though it does not achieve the cocoa,
brown fruit/winey flavour intensities of the
Ghana reference samples.
CONCLUSIONS
Solar dried beans have the potential to
reduce the bean acidity problem, one of the
major quality problems of the PNG cocoa
industry, once the solar dryer prototype
developed and tested is adequately promoted
and widely adopted by the cocoa growers in
recommended agro-ecological zones within
the country. Reduction in bean acidity has
shown to improve other ancillary flavour
attributes that would otherwise be masked by
the high level of bean acidity. Solar dried
beans also have a significantly lower level of
bitterness as the result of slower drying rate in
solar dryers which allows completion of
oxidative reactions responsible for converting
bitter polyphenol compounds into insoluble
tannins as well as producing a high percentage
of brown beans. PNG produces cocoa with
unique fruity flavour attributes very specific to
local growing conditions as compared to the
reference Ghana sample. PNG needs to
continue marketing its cocoa by improving and
at the same time preserving its specific unique
blend of flavour characteristic which is
favoured by different manufacturers. Farmers
need to follow all standard post-harvesting
processing techniques to produce a consistent
quality of beans with optimum desirable
flavour attributes.
Furthermore, solar dried beans have the
potential to totally eliminate smoke
contamination resulting from beans dried
using poorly maintained kiln dryers, another
major quality problem encountered by the
PNG cocoa industry. There is no fixed
discount on cocoa which is tainted with smoke
contamination but it is estimated that a
discount of $US135-150 per tonne is usual.
Solar technology may provide the best solution
of the smoke contamination problem of PNG
cocoa. The PNG cocoa industry needs to
promote and fully exploit the solar dryer
prototype that has the potential to address
these two of the major quality problems of the
cocoa industry. Cocoa growers need to be
supported to adopt the solar dryer technology
which is cheap, durable and environmentally
friendly. For wetter regions of the country,
trials will be conducted to combine solar with
kiln dryers or converting existing wood-fired
dryers to combined solar and fuel-fired dryers.
Bean acidity problems in PNG cocoa - Noel Y. Kuman
Journal of South Pacific Agriculture, Volume 15: Nos. 1 & 2, 2011
References
BIEHL, B, E., PASSERN, D., QUESNEL, V. C., ADOMAKO, D. 1985. Acidification, proteolysis
and flavour potential in fermentation cocoa beans. Journal of the Science of Food and
Agriculture, 36:583-598.
BISCUIT CAKE CHOCOLATE AND CONFECTIONARY ALLIANCE (BCCCA). 1996. Cocoa
beans-Chocolate Manufacturers Quality Requirements. 4 th edition. BCCA, London, 27
pp.
CHONG, C. F., SHEPHERD, R., POON, Y. C. 1978. Mitigation of cocoa bean acidity-fermentery
investigation. In: Proceeding of International Conference on Cocoa and Coconut. Kuala
Lumpur, Malaysia.
CLAPPERTON, J. F. 1994. A review of research to identify the origin of cocoa flavour
characteristics. Cocoa Growers Bulletins, 48:7-16.

40
HOLLYWOOD, N., BROWN, S. & TOREU, B. 1996. A design for improved efficiency in solar
drying of cocoa. Cocoa Growers Bulletins, 50:38-45.
HOLM, C. S. & ASTON, J. W. 1993. The effects of the organic acids in cocoa on the flavour of
chocolate. Journal of the Science of Food and Agriculture, 61:65-71.
KATTENBERG, H. R. & KEMMIN, K. A. 1993. The flavour of cocoa in relation to the origin
and processing of the cocoa beans. In: Charalambous, B.V.G. (Eds.), ‗Food Flavour,
Ingredients and Composition‘, Elsevier Science Publisher.
KUMAN, N. Y. 1997. Report on adaptive trial on solar dryer and minibox technology. Papua
New Guinea Cocoa and Coconut Research Institute (PNGCCRI), Tavilo, 26 pp.
KUMAN, N. Y. 2009. Testing the efficiency of mini-fermentation box to ferment small quantities
of cocoa beans. Papua New Guinea Journal of Agriculture, Forestry and Fisheries, 52:9-
12.
PAPUA NEW GUINEA COCOA AND COCONUT RESEARCH INSTITUTE. 1988. Papua New
Guinea quality improvement project-implementation report. Queensland Department of
Primary Industry, Queensland, Australia, 201 pp.
PAPUA NEW GUINEA COCOA AND COCONUT RESEARCH INSTITUTE. 1995. Papua New
Guinea Cocoa and Coconut-A manual for Papua New Guinea. Cocoa quality improvement
project, Tavilo, Rabaul, 186 pp.
REHM, H. J. & REED, G. 1983. Biotechnology-Cocoa fermentation. Vol.5 Verlag, Chemie,
Veinheim.
ROHAN, T. A., & STEWART, T. 1965. The precursors of chocolate aroma: the distribution of
free amino acids in different commercial varieties of cocoa beans. Journal of Food
Science, 30:416-419.
SHEPHERD, R. 1976. Large scale processing of cocoa beans temperature and acidity trends. The
Planters (Kuala Lumpur), 52:311-322.
SUKHA, D. A. 2001. Strategy for the organoleptic assessment of cocoa samples. In: Proceeding,
Initial Workshop on project to establish the physical, chemical and organoleptic
parameters to establish the difference between fine and bulk cocoa. Macoya, Trinidad, 31st
Jan - 2rd February, 2001.
WOOD, G. A. R. 1975. Cocoa. Tropical Agriculture Series, Longmans Group Limited, London,
292 pp.
WOOD, G. A. R. & LASS, R. A. 1985. Cocoa. 4th edition. Tropical Agriculture Series, Longmans
Group Limited, London.
YABRO, S. & NOBEL, S. 1989. Small production, processing and marketing of cocoa and copra
in Papua New Guinea: A baseline survey. Working paper No. 10 ACIAR Project 9734,
Canberra.
Bean acidity problems in PNG cocoa - Noel Y. Kuman
Journal of South Pacific Agriculture, Volume 15: Nos. 1 & 2, 2011

41
Optimization of flowering, pollen quantity and seed production in taro
(Colocasia esculenta var. esculenta)
Rosalene Sharma1, Mary Taylor2 and Anjeela Jokhan1
ABSTRACT
Taro (Colocasia esculenta var. esculenta) is tremendously known for its importance in Pacific
people‘s traditions, and its fundamental role in national food security, economic, sustainable and
rural development in the South Pacific region. This paper aimed to optimize flowering and seed
production in taro. This was carried out by researching the environmental and physical conditions
that best suited to achieve maximal seed production. Taro (Colocasia esculenta var. esculenta) of
the PNG cultivar was used for the purpose of this study. Gibberellic acid at a concentration of 500
ppm was used to promote flowering and hand pollination was carried out to promote fertilization.
Taro exhibited a requirement for long day length, total light radiation, warm temperature, and
nutrition and water availability to flower efficiently. The success of pollination was dependent on
the weather, skills used, the receptivity of the female flowers, quantity of pollen applied on the
female flowers and the well-being of the plants. It was obvious that pollen production was specific
to warmer temperatures. Berries developed in fruit heads in approximately a week and matured in
30-40 days. The seeds in the berries of the fruit heads that dried up before 30 days were immature.
A range of 1-15 seeds were found in different berries and even within the berries of the same fruit
head. This research will not only be useful for taro conservation and propagation purposes, but
will also benefit taro breeding programmes and related research work.
Key words: Taro, Colocasia esculenta var. esculenta, flowering, pollen quantity, seed production.
INTRODUCTION
Taro (Colocasia esculenta (L.) Schott)
is principally propagated vegetatively using
suckers (Shaw, 1975; Strauss et al., 1979;
Kuruvilla & Singh, 1981; Ivancic, 1992) since
many taro cultivars do not flower naturally.
Some cultivars of Colocasia have been
reported to flower naturally and in some of
these locations naturally set seeds have been
collected and germinated (Wilson, 1984).
Nevertheless, it has been well documented that
applications of gibberellic acid promoted
flowering in taro (Hanson & Imamuddin,
1983; Wilson, 1990; Ivancic, 1992). Ivancic
(1992) observed that there were several other
possibilities for promoting flowering other
than the treatment with gibberellic acid,
though these were specific to diploid plants
only. They are possibly the removal of
cormels, suckers, stolon and leaves from well-
developed plants, replanting old plants when
one flowering cycle is over to enable a new
cycle to start and finally inducing stress by
drought and excess or cold temperature.
However, the effects vary from species to
species, from cultivar to cultivar within the
same species, from region to region as well as
from season to season (Ivancic, 1992).
Generally, plants flower or respond to
environmental stimuli, which set off flowering
when they have completed a certain period of
vegetative growth (Opik & Rolfe, 2005). The
timing of the transition from vegetative phase
to flowering phase is of paramount importance
in agriculture, horticulture and plant breeding
because flowering is the first step of sexual
reproduction (Bernier et al., 1993). A number
1School of Biological and Chemical Sciences, Faculty of Science, Technology and Environment, The University of the South Pa-
cific, Private Mail Bag, Suva, Fiji Islands. Emails: [email protected]; [email protected] 2Centre for Pacific Crops and Trees, Land Resources Division, Secretariat of the South Pacific Community, Private Mail Bag, Suva,
Fiji. Email: [email protected]
Corresponding address: [email protected]
Journal of South Pacific Agriculture, Volume 15: Nos. 1 & 2, 2011
Optimization of flowering in taro - Rosalene Sharma, Mary Taylor & Anjeela Jokhan

42
of environmental factors such as temperature,
day length and endogenous plant rhythms have
been identified as being either essential or may
hasten or perhaps delay flowering in plants.
Autonomous factors such as size and age of
plants, and the nutritional status may also
regulate flowering in plants that may be
interactive (Taiz & Zeiger, 1998).
The quantity of pollen produced is also
of chief importance since they control and
dominate the pollination process, which is the
integral part of seed production. Several
environmental factors such as temperature,
herbivory, soil fertility and mycorrhizal
infection have been found to affect pollen
production in plants by altering pollen grain
size, flower number and/or pollen production
per flower, and growth and/or competitive
ability of pollen tubes of the pollen producing
parent (Lau & Stephenson, 1994). In addition,
a few studies have demonstrated that
environmental conditions during anther
development can also affect the chemical
composition of pollen (Herpen & Linskens,
1981; Lau & Stephenson, 1994). The
environmental effects to taro flowering and
pollen production have not been extensively
studied (Wilson, 1984), but Onwueme (1999)
confirmed that long day conditions promoted
flowering in taro.
Taro is a monoecious angiosperm plant
where male and female flowers form on the
same individual. Cultivars of Colocasia
esculenta var. antiquorum were found to
produce large amounts of seeds while cultivars
of Colocasia esculenta var. esculenta yielded a
very low number of seeds (Jackson & Pelemo,
1980; Strauss et al., 1980). Wilson (1990)
pointed out that taro was basically a cross-
pollinated species since pollen was carried by
water (rain), wind or some insects. The degree
of cross-pollination depended on the openness
of flower, flower type, weather conditions,
wind velocity, presence of insects, nutrition,
variety, density of flowering plants, shade and
other factors (Ivancic, 1992).
Receptivity in Colocasia appears to be
variable. Stigma has been found to be
receptive before pollination (Ivancic, 1992) for
up to 1 to 3 days prior to pollination (Jos &
Vijaya Bai, 1977; Jackson & Pelemo, 1980;
Pardales, 1980). However, Wilson (1990)
disputed this stating that depending on the
location and taro cultivar, female flowers may
be receptive one day prior or the same day as
or one day after pollen shed. Self-pollination
in taro was believed to be extraordinary due to
the unique arrangement of the male and female
flowers that were located in separate regions in
the spadix (Prakash & Nayar, 2000). However,
pollination can be easily accomplished by
hand.
This paper reports the studies on the
optimization of flowering, pollen quantity and
seed production in taro of the Papua New
Guinea (PNG) cultivar in relation to the
autonomous factors and environmental
conditions that best suit flowering, pollen and
seed production in taro that will be of practical
importance. This study will compliment the
effectiveness of taro seed conservation,
breeding programmes and also appreciate the
relationship between flowering, quantity of
pollen produced and seed production in taro.
MATERIALS AND METHODS
Study species
Taro (Colocasia esculenta var.
esculenta) of the Papua New Guinea (PNG)
cultivar is a monoecious plant belonging to the
genus Colocasia, within the sub-family
Colocasioideae of the family Araceae
(Onwueme, 1999). It is a herbaceous plant that
grows to a height of 1-2 m. The plant consists
of a central corm that is the main stem, leaves,
fibrous roots and stolons that grow laterally
along the surface of the soil for some distance
and root down at intervals to give rise to new
plants. The distinguishing feature of the PNG
cultivar is the purple colour of its petiole. PNG
cultivar was selected for this study as it is
incapable of natural flowering. Experimenting
on this variety showed that the methods used
for seed production could work with any taro
cultivar if it worked well with the present
cultivar.
Study site
This experiment was performed in the
glasshouse and the experimental plot land at
the University of the South Pacific in Laucala
Bay, Suva, Fiji (18°09' S, 178°27' E) from
June 2007 till January 2010. The climate was
warm and wet during November through April
Optimization of flowering in taro - Rosalene Sharma, Mary Taylor & Anjeela Jokhan
Journal of South Pacific Agriculture, Volume 15: Nos. 1 & 2, 2011

43
and cool and dry from May through October.
Taro suckers were planted in five different
batches at different times of the year and in
different locations to understand its flowering,
pollen and seed production at different seasons
and environmental conditions. Suitable
environment for flowering was created inside
the glasshouse by illuminating the glasshouse
with 12 hours of light daily and using two
1000 watts lights (30 000 lux) to provide
warmth. The soil used for planting was a
mixture of one part of poultry manure, one
part of river sand and five parts of garden soil.
Normal agronomic practices were carried out
to maintain the good health of the plants. Data
loggers were used to measure the ambient
temperature and humidity in the glasshouse
and in the field. The temperature in the field
ranged from 22-26 °C during the cool months
and 28-34 °C during the warm months whilst
the temperature in the glasshouse ranged from
23-27 °C and 29-35 °C, respectively during the
cool and warm months. The relative humidity
ranged from 61-87 % in the glasshouse and 61
-88 % in the field.
Flower induction, pollination, harvesting,
seed extraction and drying
Flower induction, pollination, harvest-
ing, seed extraction and drying were carried
out using the procedures described by Wilson
(1990) and Tyagi et al. (2004).
Pollen production
The effect of temperature on pollen
production was evaluated at two different
times of the year: during the cool season (25±1
°C, 50-65 % RH and 10 hours day length) and
during the warm season (30±1 °C, 70-85 %
RH and 12 hours day length). Data loggers
were used to measure the temperature and
relative humidity. The pollen production was
evaluated by observing pollen grains. Good
pollen production was recorded when the male
spadix was completely covered with pollen
and also some pollen that had fallen off was
collected in the spathe, and poor production
was recorded when there was little pollen
shed.
Taro seed extraction and seed drying
Matured fruit heads that had become
soft were harvested from plants and soaked in
10 % sodium hypochlorite solution for two
minutes to kill any fungi that might have been
present in it. The seed extraction and drying
were carried out as described by Wilson
(1990) and Tyagi et al. (2004). Caution was
observed not to keep the seeds near the fan or
windy area where the seeds had a chance to
blow away after being dried. The data on the
mean number of seeds per individual berries
was obtained by counting the number of seeds
present in ten randomly selected independent
berries of the same fruit head. The seed count
was repeated for ten randomly selected fruit
heads.
RESULTS
Flowering in taro
The effects of gibberellic acid were
observed as the signs of flowering that were
evident 30 to 60 days after the application of
gibberellic acid depending on the season. The
observable signs of flowering were patches of
purple colour on the leaves that correlated with
the colour of the inflorescences, enlarged
leaves, elongated petioles, production of more
suckers and stolons than usual, incomplete
inflorescences and flagged leaves. Suckers that
were planted and treated with gibberellic acids
during the cool months and short day lengths
had more vigorous growth and took a longer
time to flower than the suckers that were
planted during warm conditions and long day
lengths or under controlled conditions.
Flowering initiated after 90-120 days
following the application of gibberellic acid
during the cool season and 60-90 days during
the warm season (Table 1).
The inflorescences appeared from the
shoot apical meristem and also from the
stolons, which was rare. All the plants, planted
irrespective of the time of the year and applied
with gibberellic acid had flowered (Table 1).
There was a significant difference (P < 0.05)
between the number of inflorescences
produced in plants kept under various
conditions during the flowering period. The
plants that were under full sunlight, watered
daily and supplied with nutrients had produced
significantly (P< 0.05) the most inflorescences
per plant (an average of eight inflorescences
per plant) during its flowering period than the
plants that were kept under other various
conditions. An average of seven inflorescences
Optimization of flowering in taro - Rosalene Sharma, Mary Taylor & Anjeela Jokhan
Journal of South Pacific Agriculture, Volume 15: Nos. 1 & 2, 2011

44
per plant was produced under full sunlight +
daily watering + no fertilizer, six
inflorescences per plant under full sunlight +
water stress + fertilizer, five inflorescences per
plant under shade + daily watering + fertilizer,
four inflorescences per plant under both shade
+ daily watering + no fertilizer and full
sunlight + water stress + no fertilizer, three
inflorescences per plant under shade + water
stress + fertilizer and two inflorescences per
plant under shade + water stress + no fertilizer
(Figure 1).
Optimization of flowering in taro - Rosalene Sharma, Mary Taylor & Anjeela Jokhan
Journal of South Pacific Agriculture, Volume 15: Nos. 1 & 2, 2011
Table 1. The relationship between the approximate number of days when flowering initiated after the application of gibberellic acid, the percentage of plants that flowered and the environmental conditions
during the vegetative and reproductive phases.
a Controlled environment in the glasshouse during the cool season.
Batch Approximate no.
of days when
flowering initiated
Percentage of
flowering
(%)
Environmental Conditions
During vegetative During reproductive
phase phase
1 120 100 cool and short day lengths warm and long day lengths
2 60 100 warm and long day lengths warm and long day lengths
3 60 100 warm and long day lengths warm and long day lengthsa
4 60 100 warm and long day lengthsa warm and long day lengthsa
5 90 100 towards the end of cool season and short day lengths
warm and long day lengths
Figure 1. The number of inflorescences produced per plant during its flowering period under the various
conditions. Values with ± SEM were derived from 10 plants that were randomly chosen.

45
Taro inflorescence
The length of the inflorescences ranged
from 150-300 mm and the length of the male
spadix ranged from 19-52 mm, which all
depended on the health and length of the
plants, which ranged from 610-1838 mm
(Tables 2 and 3). The taro inflorescence was
elongate and consisted of a spadix enclosed in
a spathe. A few flowers were found to be
enclosed in double spathes. The spadix was
separated into the male flower (staminate), the
constricted region of sterile flowers that
divided the male and female flowers, the
female flower (pistillate) and the sterile tip.
Male flowers were located in the upper region
while the female flowers were located on the
lower region. The male part of the spadix was
yellow in colour whereas the sterile band and
the female part of the spadix were purple. The
flowers were small and sessile, though the
inflorescence was attached to the peduncle.
Cracks in the spathes were obvious when the
female flowers were receptive with the
intention to be pollinated. Female flowers
were only observable if the spathe surrounding
them was removed. Fertile flowers were mixed
with sterile flowers that were scattered and
found in varying numbers. The fertile female
flowers were green with characteristic stigmas
whereas the sterile flowers were purple in
colour. The male flowers were observable
when the spathe cracked open.
Pollen production
Pollen grains were shed mostly early in
the morning if the weather was fine and were
found clumped together as a white powdery
substance on the male spadix. The spathe
opened widely when the pollen was shed.
Male flowers produced little or no pollen
during the cool months (Table 2) compared to
a high production during the warm months
(Table 3). The quantity of pollen produced was
also proportionate to the health and height of
the plants and inflorescences, and the length of
the male spadix.
Seed set in taro
Out of all the inflorescences that were
pollinated from the five different batches, a
high percentage (over 85 %) of the
inflorescences had developed into fruit heads
(Table 4). However, 17 % of the developed
fruits were damaged by cyclone Gene in Fiji in
January 2008 from the first batch. Each berry
was a fruit and a group of compactly packed
berries formed a fruit head. Seed set took place
in almost one week following hand-
pollination. Only the fertile female flowers
developed into fruits. The fruits were green in
colour during the early stages of seed set and
turned to brown and succulent upon maturity.
The berries became soft and black. The
peduncle dried when the fruit head matured
fully in 30-45 days after fertilization and was
ready for seed extraction.
Taro seed
When matured, taro seeds had the
characteristics as described by Tyagi et al.
(2004). The difference between the lengths of
the fruit heads and the number of seeds present
in the individual berries were statistically
significant (P < 0.05) (Table 5). Generally,
fruit heads measuring from 46-57 mm had
higher number of seeds, with the exception of
that measuring 51 mm.
DISCUSSION
Flowering in taro
Flowering in PNG cultivar did not
occur naturally, but was promoted artificially
by the application of gibberellic acid at a
concentration of 500 ppm when the plants
were in their fifth leaf stage. Flowering
initiated in 90 to 120 days during the cool and
short day length conditions and in 60 to 90
days during the warm and long day length
conditions. However, all the plants that were
planted in different batches and sprayed with
gibberellic acid at different periods throughout
the year had flowered (Table 1). It was clear
that flowering was delayed in cool months
with short day conditions, though vegetative
growth was vigorous. The plants had set off
flowering after completing a certain period of
vegetative growth.
Plants spend a lot of their energy in
producing flowers; as a result, an effective and
adequate amount of photosynthesis is required
by the plants to switch from vegetative to
reproductive phase. It was observed that
healthy plants had more and bigger leaves with
a higher chance of more photosynthesis taking
place and such plants produced more
Optimization of flowering in taro - Rosalene Sharma, Mary Taylor & Anjeela Jokhan
Journal of South Pacific Agriculture, Volume 15: Nos. 1 & 2, 2011

46
Optimization of flowering in taro - Rosalene Sharma, Mary Taylor & Anjeela Jokhan
Journal of South Pacific Agriculture, Volume 15: Nos. 1 & 2, 2011
Table 2. The relationship between the plant height, length of inflorescence, length of male spadix, type of the plant and the quantity of pollen shed at 25±1 °C, 50-65 % RH and 10 hours day length in taro (C.
esculenta var. esculenta) cv. PNG.
(No pollen shed -, little pollen shed +, sufficient pollen shed ++).
Plant height
(mm) Length of
inflorescence (mm) Length of male
spadix (mm) Type of plant Quantity of
pollen shed
610 150 19 weak -
690 153 20 weak -
844 177 23 weak -
932 198 27 weak -
939 207 30 weak -
1132 213 31 healthy +
1150 217 34 healthy +
1180 226 40 healthy +
1687 272 45 healthy +
1766 289 48 healthy ++
Table 3. The relationship between the plant height, length of inflorescence, length of male spadix, type of the plant and the quantity of pollen shed at 30±1 °C, 70-85 % relative humidity and 12 hours day length in
taro (C. esculenta var. esculenta) cv. PNG.
(No pollen shed -, little pollen shed +, sufficient pollen shed ++).
Plant height
(mm) Length of
inflorescence (mm) Length of male
spadix (mm) Type of plant Quantity of
pollen shed
610 150 19 weak -
690 153 20 weak -
844 177 23 weak -
932 198 27 weak -
939 207 30 weak -
1132 213 31 healthy +
1150 217 34 healthy +
1180 226 40 healthy +
1687 272 45 healthy +
1766 289 48 healthy ++
Table 4. The percentage of successful pollination from five different batches in C. esculenta var. esculenta cv. PNG. The value in parentheses represents the percentage of developed fruit heads that were damaged
during cyclone Gene in Fiji in January 2008.
aBatch of taro suckers planted in the field. bBatch of taro suckers planted in pots and kept inside the glasshouse.
Batch Number of successful pollinations (%)
1a 80 (17)
2b 83
3b 86
4b 89
5a 92

47
inflorescences. The potential factors such as
photoperiod, temperature and water
availability are perceived by the different parts
of the plants. Photoperiod and irradiance are
perceived by the matured leaves, temperature
is perceived by all parts of the plant and water
availability by the root system (Bernier et al.,
1993). This highlights the importance of
maintaining the good health of the plants
throughout their lifecycle.
The production of more suckers per
plant was an added advantage since the
number of flowers produced per plant had
increased. The weak plants examined
produced a mean number of four
inflorescences per plant during its flowering
period while the healthy plants produced a
mean number of seven inflorescences per
plant. The flowering period lasted in
approximately 60 days. The inflorescences had
appeared from the shoot apical meristem while
a few had also appeared from the stolons,
which was rare. Physiological process taking
place in the shoot apical meristem making it
competent to develop inflorescences are
accompanied by the biochemical changes
taking place at the apex by cytokinins. The
colour of the spathe was predominantly purple
and correlated with the pigmentation of the
whole plant. Autonomous factors were also
found to regulate flowering in plants. The
plants that were under the conditions of full
sunlight, adequate water availability and
nutrient supply had produced significantly (P <
0.05) more inflorescences per plant (Figure 1).
The inflorescences had a distinctive
aroma similar to the smell of an unripe
pawpaw, which was apparent when the female
flowers were receptive and ready to be
pollinated. However, the male flowers
dominated the pollination process. The pollen
was shed as a cluster of white powdery
substance on the male spadix in almost a week
following the initiation of the inflorescence
formation. The spathe opened widely after the
pollen was shed. The lifetime of an
inflorescence was no more than a week.
Nevertheless, it should be noted that not all the
varieties of taro flower with the same intensity.
Flowering in taro was found to vary from
variety to variety, from region to region and
from season to season (Ivancic, 1992).
Environmental conditions that trigger flower
formation
In this study, it was noticed that taro
plants of the PNG cultivar delayed flower
despite its vigorous vegetative growth after the
application of gibberellic acid as compared to
the suckers that were planted during warm
season. Hence, side suckers, extra leaves and
stolons had been carefully removed to
suppress vegetative growth. This enabled the
plants to complete their life cycle faster and
also left the plants with no other choice than to
finally flower. The cost in terms of reduced
growth would have resulted in a trade-off
between sexual reproduction and vegetative
growth (Fenner & Thompson, 2005). Removal
of stolons would have resulted in a build up of
gibberellic acids in the plant that accelerated
flowering or even directed photosynthates to
unproductive growth.
All the plants of the respective batch
had started to flower at about the same time
and this emphasized the importance that all
individuals of a species must flower
synchronously for successful cross pollinations
Optimization of flowering in taro - Rosalene Sharma, Mary Taylor & Anjeela Jokhan
Journal of South Pacific Agriculture, Volume 15: Nos. 1 & 2, 2011
Table 5. The number of taro (Colocasia esculenta var. esculenta) cv. PNG seeds present in each berry of five different fruit heads.
aFruit head from a weak plant. bFruit head from a healthy plant. The values in parenthesis represent the length of the fruit head (mm).
Fruit heads Number of seeds
Berry 1 Berry 2 Berry 3 Berry 4 Berry 5
1a (40) 8 10 7 9 10
2a (44) 8 1 3 6 4
3b (58) 12 11 9 13 10
4b (61) 11 15 14 13 13
5b (54) 12 15 15 10 11

48
and also to complete their sexual reproduction
under favourable external conditions (Bernier
et al., 1993). Longer day lengths and warmer
climate favoured flowering. This confirmed
that taro plants used environmental cues to
regulate the transition to flowering. A possible
interaction between exogenously applied
gibberellic acid, temperature and daylight had
existed. Since taro is a tropical and sub-
tropical crop, it was clear that warmer climates
and long day lengths triggered flowering in
taro. Similar observations were made by
Onwueme (1999). Taro suckers were planted
under controlled conditions in the glasshouse
and flowering initiated in 60 days after the
application of gibberellic acid without any
delay.
Physiological role of gibberellins
Gibberellins are the growth hormones
that trigger the reproductive development in
plants (Taiz & Zeiger, 1998). The
physiological effect of gibberellins in taro
plants is to promote flowering by substituting
for the long day requirement. However, the
present results support this theory and there
was a requirement for warm temperature as
well that was interactive. When exposed to
long days, the content of active gibberellic
acid increases in plants causing the stem to
elongate and eventually the flowers are
produced (Opik & Rolfe, 2005). The
physiological reasons for spraying gibberellic
acid to the leaves either early in the morning
or late in the afternoon is due to the fact that
generally the stomata in the leaves open fully
when exposed in the light, but close in the dark
and also when the plants are water stressed.
Both the upper and the lower surfaces of the
leaves are applied with gibberellic acid since
stomata is present on both the surfaces of the
leaves with the lower surface possessing
approximately twice as many. Though, the
number of stomata is relatively low in
Colocasia when compared with other plant
species (Strauss, 1983).
Pollen production in taro
It was shown that size and health of
plants does not significantly influence number
of inflorescences produced. However, size of
inflorescences and pollen production are
dependent on size and health of plants. The
number of pollen grains varied in different
inflorescences. The quantities of pollen
produced were proportionate to the size of the
male spadix. It was also found that the longer
inflorescences of healthy plants produced
more pollen compared to the smaller
inflorescences of weak plants due to the fact
that that taller and healthier taro plants showed
a tendency of longer male spadixes.
Furthermore, this character was particularly
correlated with plant height. It was obvious
that the plants that were healthy and tall
produced bigger inflorescences than the weak
and short plants (Tables 2 and 3).
Poor pollen production was one of the
serious factors that curtailed fertilization.
Pollen production was found to be temperature
specific. There were little or no pollen
production in flowers during the cool months
compared to a lot of production during the
warm months (Tables 2 and 3). High humidity
and longer day lengths (about 12 hours) during
the warm months as well as the healthy plants
was also found to favour pollen production
compared to the low humidity and shorter day
lengths (about 10 hours) during the cool
months and also the weak plants. Differences
in the geographical location, soil fertility
levels and weather conditions may also have
affected the rate of pollen germination. On the
other hand, Wilson (1990) found that poor
pollen production also occurred in naturally
produced inflorescence and suggested that it
may not be related to gibberellic acid
application, but may be genetic or due to
environmental stress.
Protocol to optimize flowering and pollen
quantity in taro
1. Plant taro suckers closer to warmer seasons
and long day lengths.
2. Plant taro suckers in fertile soil for healthy
plant growth. Healthy plants produce
healthy and more flowers, and high
quantity of pollen.
3. Use large and healthy taro suckers for
planting and agronomic practices such as
applying nutrients such as nitrogen,
phosphorous and potassium in particular
and weeding should be strictly performed
in order to achieve healthy flowers.
4. Water the plants frequently and always
keep the soil moist.
Optimization of flowering in taro - Rosalene Sharma, Mary Taylor & Anjeela Jokhan
Journal of South Pacific Agriculture, Volume 15: Nos. 1 & 2, 2011

49
5. Apply gibberellic acid at a concentration of
500 ppm to plants at five leaf stage early in
the morning on a fine day when no rain is
expected. Two to three drops of dish
washing detergent should be mixed with
the prepared gibberellic acid solution as a
surfactant. Since the taro leaves are waxy,
surfactants are used to aid the gibberellic
acid solution to stick and stay on the leaves
for better results.
6. Spray gibberellic acid gently and evenly on
both the upper and the lower surfaces of
the leaves as well in the cup formed by the
petioles.
7. Maintain a warm temperature around the
plants during the flowering period.
8. Maintain high humidity for two to three
days around the male flowers in order to
achieve maximum pollen production. The
inflorescence can be covered with a plastic
bag to maintain humidity just before pollen
is shed since covering the inflorescences
with plastic or pollinating bags for a longer
period of time may cause the environment
around the flowers to become hot and
humid and will cause them to become
soggy and rot.
Pollination in taro
The male portion of the inflorescence
controlled the pollinating process. The
inflorescence could only be pollinated when
pollen was shed by the male flowers in almost
a week after the initiation of its formation. It
was also found that the stigmas of the female
flowers were receptive one day before till one
day after the pollen shed since the flowers that
were pollinated at these different times also
had their seed set in berries. However, on the
day of pollen shed the ‗crack‘ at the base of
the spathe had closed and become tight around
the band of sterile flowers. This behaviour of
the inflorescences seemed to indicate that the
inflorescences responded in such a manner to
protect the little self-pollination that might
have occurred (Wilson, 1980). There were
three cases of apomixis (development of fruit
without pollination) observed as Ivancic
(1992) had experienced a few cases in the
Solomon Islands.
Large plants with large inflorescences
displays and with large quantities of pollen
produced do not necessarily produce more
seeds per berry. The number of seeds largely
depends on the success of fertilization.
Though, this was in response to the quantity of
pollen produced. Large amounts of pollen
production increase the chance of successful
fertilization, thus the amount of pollen arriving
on a flower can be an important determinant
of seed production. The weather, vigour of the
plants, type of inflorescences used for
pollinating and the skill used to pollinate
affected the success rate of hand-pollination.
Like flowering, pollination was also weather-
dependant. Unsuccessful pollination was likely
due to factors such as longer periods of heavy
rain that caused the peduncles of the
inflorescence to become soft and fall off. In
addition, the female flowers of the spadix may
not have been receptive when pollinated or the
female flowers were not covered well with
pollen due to poor pollen production or the
peduncles might have been damaged while
emasculating. Flower predators such as ants
were also present in most of the flowers and
may have fed on the pollen grains before
fertilization took place.
Seed set
The high percentage of female flowers
that were fertilised successfully after
pollinating had their seeds set in
approximately one week (Table 4) whereas the
female flowers that did not set seeds dried and
fell off after about two weeks. Some of the
possible reasons as to why the female flowers
failed to set seeds after pollination could
probably be due to the female flowers not
being receptive when pollinated, the pollen
being unviable, or the environmental
conditions such as low humidity was not
favourable for fertilization to occur. Seed set
was also weather-dependant similar to
flowering and pollination. Fruit heads matured
30- 45 days after pollination.
Upon maturity, each berry generally
contained a mean number of 10 seeds (Table
5), but as many as 35 seeds have been reported
(Wilson, 1990) that may be due to the
differences in cultivars. It was evident that the
number of seeds present in each fruit head did
not necessarily depend on the vigour of the
fruit head, but was dependant on the
effectiveness of fertilization. The presence of
higher number of sterile flowers than the
Optimization of flowering in taro - Rosalene Sharma, Mary Taylor & Anjeela Jokhan
Journal of South Pacific Agriculture, Volume 15: Nos. 1 & 2, 2011

50
female flowers did not affect the number of
seeds produced per berry. The number of seeds
per berry depended strongly on the number of
placenta per ovary, number of ovules per
ovary, efficiency of pollination, type of
pollination, self compatibility, fertilization and
several other factors (Ivancic, 1992). As the
fruit heads were developing in its early stages
of seed set, the sterile flowers had disappeared.
It has been reported to be experiencing watery
dissolution since the outer faces of the sterile
flowers lose their ivory opaqueness and
become translucent and grey (Shaw, 1975).
The gaps that were created if by the watery
dissolution of the sterile flowers seemed to be
filled with the fertile berries growing.
Protocol to optimize seed production in taro
1. Where the male flowers produce very little
or no pollen, this should be discarded and
the stigma could be used for cross-
pollination.
2. Use the same inflorescences as both a male
and a female parent if there are not enough
inflorescences.
3. A male parent inflorescence that is covered
with a large quantity of pollen can be used
to pollinate two or more female
inflorescences.
4. Pollinate the inflorescence at the
appropriate time that is at its ‗crack stage‘
when the spathe around the female flowers
becomes loose and the inflorescence
produce a distinctive aroma. Otherwise,
the female flowers loose their receptivity
afterwards and fertilization will not occur
and hence there will be no seed set.
5. It is important to cover each female flower
with enough pollen since fruit heads will
not develop unless a number of berries
have been fertilized. In case of inadequate
quantity of pollen use several pollens from
male parents to pollinate one inflorescence
on the female parent.
6. Maintain high humidity for two to three
days around the female flowers in order to
increase the chance of successful
fertilization. The female flowers can be
covered with a plastic bag to maintain
humidity for three days after pollinating
the flowers. However, the flowers should
not be covered with plastic or pollinating
bags for a longer period of time as this will
cause the environment around the flowers
to become hot and humid and will cause
the developing fruit to become soggy and
eventually fall off.
7. Shade the plants from rain to facilitate
favourable conditions for pollinating the
plants since there is a risk of loosing pollen
by rain that will wash off pollen.
8. Use healthy taro suckers for planting since
the well being of the plant determines the
health of the flower, the berries and finally
the seeds. Healthy flowers have more
berries in the fruits and more berries
produce more seeds depending on the
success of fertilization.
9. Skill, care, pollinating bag and sharp
scalpel are required to pollinate flowers.
The flowers should be emasculated at the
right point (constricted point that joints the
sterile flowers to the male flowers) and
care should be taken not to damage the
peduncle while removing the spathe
around the female flowers.
10. Keep areas around the plants well-aerated
as too much moisture causes the petiole
bearing the seeds to damp off and die.
CONCLUSION
Protocols to optimize flowering and
seed production were developed successfully.
Taro exhibited a requirement for long day
length, total light radiation, warm temperature,
and nutrition and water availability to flower
efficiently. The success of pollination was
dependent on the weather, skills used, the
receptivity of the female flowers, quantity of
pollen applied on the female flowers and the
well-being of the plants. Flowering, fruiting
and seed setting play an important role in
agriculture. Optimization of taro seed
production will offer a method for long-term
conservation of taro genes. This research will
also benefit the Pacific Island countries to
maximize and improve taro production (of
their suitability) for subsistence livelihood and
for export commodity.
Optimization of flowering in taro - Rosalene Sharma, Mary Taylor & Anjeela Jokhan
Journal of South Pacific Agriculture, Volume 15: Nos. 1 & 2, 2011
Acknowledgements
This research was supported by Secretariat of the South Pacific Community, and funded by Office

51
of Research and Graduate Affairs and Faculty of Science, Technology and Environment at the
University of the South Pacific. We thank all the Biology technicians and Masi (Biology
department, FSTE, Laucala Campus, USP) for their field assistance, and Mr. Radesh Lal and Mr.
Viti Buadromo (Physics department, FSTE, Laucala Campus, USP) for their technical assistance.
Many thanks to Koronivia Research Station for supplying us with taro suckers and carrying out the
soil fertility tests. Thanks also to Mr. Tolo Iosefa (Alafua Campus, Apia, Samoa) for his support
and practical information during this research.
References
BERNIER, G., HAVELANGE, A., HOUSSA, C., PETITJEAN, A. & LEJEUNE, P. 1993.
Physiological signals that induce flowering. Plant Cell, 5:1147-1155.
FENNER, M. & THOMPSON, K. 2005. The Ecology of Seeds. Cambridge University Press,
United Kingdom.
HANSON, J. & IMAMUDDIN, H. 1983. Germination and Seed Storage Behaviour of Seeds of
Colocasia gigantean Hook. f.. In: Proceedings of the 6th Symposium of the International
Society for Tropical Root Crops, Peru. 109-187 pp.
HERPEN, M. M. A. van & LINSKENS, H. F. 1981. Effect of season, plant page, and temperature
during plant growth on compatible and incompatible pollen tube growth in Petunia
hybrida. Acta Botanica Neerlandica, 30:209-218.
IVANCIC, A. 1992. Breeding and Genetics of Taro (Colocasia esculenta (L.) (Schott). UNDP,
Food and Agriculture Organizations of the United Nations, Ministry of Agriculture and
Lands, Solomon Islands, 1-97 pp.
JACKSON, G. V. H. & PELEMO, P. M. 1980. Breeding for resistance to disease taro, Colocasia
esculenta, in Solomon Islands. International Symposium, Taro and Cocoyam, Baybay,
Phillipines. International Foundation Science (Stockholm) Provincial Report (5), 287-298
pp.
JOS, J. S. & VIJAYA BAI, K. 1977. Stigma receptivity in Colocasia esculenta. Journal of Root
Crops, 3:25-28.
KURUVILLA, K. M. & SINGH, A. 1981. Karyotypic and electrphoretic studies on taro and its
origin. Euphytica, 30(2):405-413.
LAU, T. C. & STEPHENSON, A. G. 1994. Effects of soil phosphorus on pollen production,
pollen size, pollen phosphorus content, and the ability to sire seeds in Cucurbita pepo
(Cucurbitaceae). Sexual Plant Reproduction, 7:215-220.
ONWUEME, I. 1999. Taro Cultivation in Asia and the Pacific. Food and Agriculture
Organization of the United Nations Regional Office for Asia and the Pacific, Bangkok,
Thailand.
OPIK, H. & ROLFE, S. 2005. The Physiology of Flowering Plants. 4th edition. Cambridge
University Press, Cambridge.
PARDALES, J. R. Jr. 1980. Factors limiting fruit and seed set in taro. Annals of Tropical
Research, 2:165-171.
PRAKASH, P. S. & NAYAR, N. M. 2000. Flowering and pollination in taro. Journal of Root
Crops, 26(1):15-19.
SHAW, D. E. 1975. Illustrated Notes on Flowering, Flowers, Seed, and Germination in Taro
(Colocasia esculenta). Research Bulletin, 13:39-59.
STRAUSS, M. S. 1983. Anatomy and Morphology of Taro, Colocasia esculenta (L.) Schott. In:
Taro, a review of Colocasia esculenta and its potentials. J. K. Wang (Ed.). University of
Hawaii Press, Honululu.
STRAUSS, M. S., STEPHENS, G. C., GONZALES, C.J. & ARDITTI, J. 1980. Genetic variability
Optimization of flowering in taro - Rosalene Sharma, Mary Taylor & Anjeela Jokhan
Journal of South Pacific Agriculture, Volume 15: Nos. 1 & 2, 2011

52
in taro, Colocasia esculenta (L.) Schott (Araceae). Annals of Botany, 45:429-437.
STRAUSS, M. S., MICHAUD, D. & ARDITTI, J. 1979. Seed storage and germination and
seedling proliferation in taro, Colocasia esculenta (L.) Schott. Annals of Botany, 43:603-
612.
TAIZ, L. & ZEIGER, E. 1988. Plant Physiology. 2nd edition. Sinauer Associates, Sunderland,
Mass.
TYAGI, A. P., TAYLOR, M. & DEO, P. C. 2004. Seed germination and seedling development in
taro (Colocasia esculenta). South Pacific Journal of Natural Sciences, 22:63-66.
WILSON, J. E. 1980. Promotion of flowering and production of seed in cocoyam (Xanthosoma
and Colocasia). IIFS Prov. Rept., no. 5:269-277.
WILSON, J. E. 1984. Cocoyam. In: The Physiology of Tropical Field Crops PR Goldsworthy and
NM Fisher (Eds.). John Wiley and Sons Limited, Australia.
WILSON, J. E. 1990. Agro Facts, Taro Breeding. Institute for Research, Extension and Training
in Agriculture (IRETA) Publication No 3/89, University of the South Pacific, Apia,
Western Samoa.
Optimization of flowering in taro - Rosalene Sharma, Mary Taylor & Anjeela Jokhan
Journal of South Pacific Agriculture, Volume 15: Nos. 1 & 2, 2011

53
Observations on off-take and nutrient composition of milk from Papua New
Guinea goats
Atmaleo Aguyanto1 and Workneh Ayalew1
ABSTRACT
In response to the emerging perceived demand for smallholder milk production to meet household
level nutritional requirements, this on-station study was carried out to generate information on the
potential off-take and nutrient composition of milk of the common type goat in Papua New Guinea
(PNG) . Nineteen goats were observed over a period of 19 months, and data was collected from 23
complete lactations. The average daily milk off-take (DMO) of the flock on partial suckling of
once a day was 230.35 ± 15.9 g/day with average total milk off-take (TMO) of 22.98 ± 3.18 kg for
an average lactation length of 99± 8.8 days. Milk fat, total solids and solids non fat contents of the
milk were 7.8, 17.8 and 10 per cent, respectively. Type of udder (extended or small) and parity of
doe had significant (P < 0.05) effects on milk off-take as well as lactation length, but the effect of
litter size was not significant. .. It was concluded that PNG goats can produce adequate nutritious
milk for household use as well as sales by smallholder farmers. This can be promoted to
smallholder farmers since they have been keeping goats primarily for meat and socio economic
services while overlooking the potential of goats as milk producers mainly due to lack of
knowledge and technical skills.
Key words: PNG goats, milk off-take, lactation length, milk nutrient profile.
INTRODUCTION
Since their first introduction to Papua
New Guinea in 1883 by early explorers,
domesticated goats (Capra aegagrus hircus)
have been mainly used for meat production
and income, although particularly the German
Missionaries promoted them for both meat and
milk production (Quartermain 1982; Vincent
& Low, 2000). Milk does not appear in the
staple diets of rural people in Papua New
Guinea (PNG), unlike sub-Saharan Africa and
south Asia. The breed types of goats introduced to
PNG include a variety of European dairy
types (Saanen, Alpine, Anglo-Nubian and
Toggenburg) and some feral type goats from
Australia and New Zealand. It is not known
whether any breeding program was followed
in the separate breeding flocks or how goats
were disseminated to individual farmers;
however, descendants of these flocks spread
and interbred in rural villages over the past
century to result in the present-day admixture
populations collectively known as PNG goats
(Ministry of Agriculture and Livestock,
2004). It is believed that many of the
established breeding flocks were destroyed
during World War II and only isolated
populations remained in the hands of rural
people and therefore no systematic breeding
was practiced. It appears that uncontrolled
breeding over many years and the degree of
adaptation to various environments has had
significant reduction in animal body size and
milk yield. And Knights and Gracia,1997
highlighted that goats that have adapted in the
tropical climates owed it to their heat
tolerance, adaptation in feeding and their
resistance to Haemonchus contortus and
Trypanosomiasis.
The PNG goat population was
estimated at around 5 000 in 1985 and
gradually increased considerably to about 17
000 in 1992 (Vincent & Low, 2000). The
current official figure of this population of 3
000 at FAOSTAT (2011) is considered here as
an underestimate. To date, the goat population
1Livestock Research Station, National Agricultural Research Institute, P O Box 1639 Lae, 411 Morobe Province, Papua New Guinea. Corresponding address: [email protected]
Journal of South Pacific Agriculture, Volume 15: Nos. 1 & 2, 2011
Observations on milk from PNG goats - Atmaleo Aguyanto & Workneh Ayalew

54
of PNG is largely concentrated in the
highlands region of the country particularly the
Eastern Highlands, Simbu and Western
Highlands provinces and this was largely
facilitated by church missions and government
agencies over the last 30 years. Some districts
in Morobe province also maintain some flocks.
Since their introduction goats have adapted
well to a wide range of environments and
pasture conditions. Small body size, high
reproductive rate and broad feeding habits
relative to the cow may explain its spread in
subsistence smallholder farming communities
(Aregeore, 2000). Despite early efforts by Missionaries to
promote goats for milk, this production
function has not gained popularity, mainly due
to lack of knowledge and skills in using goats
for milk production until very recently and the
general lack of taste and demand for milk.
However, in light of chronic nutritional
problems of children and mothers rural areas
(Gibson, 2001), there is an emerging perceived
need for smallholder milk production at
household level. The goat can have an
important role to play by producing milk in
suitably small amounts to meet nutritional
requirements of especially children and
vulnerable members of subsistence families.
Goat milk is rich in protein (3.0 - 4.0
%) and its fat (4.5 %) and milk sugar (lactose)
(4.0 %) contents are similar to that of human
milk (Peacock, 1996; p. 3). Unlike cow‘s milk,
goat milk has small size fat globules and
casein that are easier to digest. Additionally, it
aids in the digestion and metabolic utilization
of minerals such as iron, calcium, phosphorus
and magnesium, and can help prevent diseases
like anaemia and bone demineralization
(Science Daily, 2007).
The National Agricultural Research
Institute (NARI) has been promoting goats for
milk since 2008. As part of this effort, this
study was undertaken at its Livestock
Research Station, Labu to assess potential off-
take as well as nutritional profile of milk from
PNG goats.
MATERIALS AND METHODS
Location
The study was conducted at the
Livestock Research Station of NARI, at Labu,
outside Lae, Morobe Province, PNG. It is
situated at about 6º 40‘ 23‖ South of the
Equator and 146º 54‘31‖ East of the
Greenwich Meridian Line with an annual
rainfall of 2300 mm and average daily
temperature range of 27 to 31 ºC with about 80
per cent humidity.
Experimental animals
The goats maintained at the research
station originated from the pool of goats
collected from village farmers to establish
foundation breeding flocks at the PNG
University of Technology (Unitech) in 1975
and subsequently at the Department of
Agriculture and Livestock (DAL) goat
breeding station at Erap (Quartermain, 2002).
Since the station flock was established in
1993, mainly breeding bucks but also some
does have been occasionally exchanged with
flocks at Erap, Tambul and village farmer
flocks, while also continually disseminating
breeding stock to interested village farmers.
Flock size remained between 50 and 100 and a
couple of breeding bucks were maintained
throughout for random mating. Replacement
breeding stocks have been selected based on
early growth and body conformation.
The nineteen does used for this
experiment were selected from the flock as
they gave birth to kids between October 2009
and February 2010. Each of the does was
identified by age, parity, litter size and udder
type. Their age at the start of the observation
ranged from one and half to three years;
parities ranged from one to four; their udder
types were either small or extended. A total of
23 full lactation observations were recorded
from these animals over a period of eighteen
months.
General husbandry
The goats were housed in a permanent
concrete floor house of about 85.8 m² divided
into three pens, a milking parlor and a tools
store and managed under a semi-intensive
system. Lactating does were housed overnight
separately from kids, non-lactating does and a
breeding buck. Experimental does were
drenched liquid Panacure that has
fenbendazole as its active ingredient at the
start of the observation and every two months
afterwards for deworming at a ratio of 0.5 ml
Observations on milk from PNG goats - Atmaleo Aguyanto & Workneh Ayalew
Journal of South Pacific Agriculture, Volume 15: Nos. 1 & 2, 2011

55
per kg live weight of the animal. Hooves were
routinely trimmed on a monthly basis. A buck
was allowed to freely mate with goats but was
separated from the lactating goats during the
night.
Feeding
The goats were put on copra meal
supplements for two weeks prior to start of the
experiment. Apart from daily partial gazing,
all the animals were fed fresh as well as wilted
grass of mixed species comprising of elephant
grass (Pennistum purpureum), signal grass
(Brachiaria decumbens) and other tropical
grasses which was provided on hay racks on
daily basis. Tree legumes such as glyricidia
(Sepium gliricidia), leucaena (Leucaena sp.),
and mulberry (Morus sp.) were also cut and
fed to the animals as supplements once or
twice a week. Other legumes and forages fed
on availability include centro (centrosema
pubescens ) , gr eenlea f des mo d iu m
(Desmodium intortum), vines as well as tubers
of sweet potato (Ipomea batatas), banana
(Musa sp.) leaves and stems. All experimental
animals were grazed together and in isolation
from other goats and sheep at the station.
Wheat mill-run and copra meal mixed at a
ratio of 2:1 were given at average rate of at
least 150 g per day to lactating and pregnant
goats and 100 g per day to non lactating goats.
In addition lactating does were given extra 50
g per 100 ml of the mix during milking. Clean
water and nutritional mineral lick were freely
available throughout the observation period.
Data collection
Data collection started in November
2008 and continued to May 2010. Recording
of milk off-take started two weeks after
kidding for does that gave birth during the
observation period and the does were trained
for milking one week after kidding. Records
were taken once in the morning daily from all
lactating goats. The udders were thoroughly
washed with warm water and soap and dried
with clean towels before milking by hand. All
milk was stripped off gently from the lactating
does by hand and milk let down was
encouraged by feeding copra meal
concentrates to the doe. The presence of the
kids often disturbed the does while being
milked on the milking platform. Kids were
therefore kept away during milking times.
Milking was done by the same person
throughout the observation period. Kids were
separated overnight from their lactating dams
until the next morning after milking. They
were allowed to suckle their dams throughout
the day.
Weights of kids and does were
recorded weekly and total milk off-take from
all lactating does for the day was recorded
daily. The recording of milk off-take from a
doe ceased when the doe produced less than
100 g of milk for three consecutive days. Body
weights of the does were taken weekly to
monitor weights and advanced pregnancies. To
determine cost of supplementary feed, daily
concentrate intake was recorded against the
unit cost of concentrate. All milk collected on
the monthly recording date was pooled and
mixed before two samples of 100 g milk were
taken in labeled and sanitized bottles. The
bottles were stored in ice cube boxes and taken
to the laboratory the same day for analysis of
milk fat (MF), total solids (TS) and solids-non-
fat (SNF) of the milk. The milk equivalent of
early kid growth to 6 weeks of age was
estimated based on growth ratio of 1.2 and
total milk solids content of 17.81% (Peacock,
1996 pp. 57-58), i.e.:
Data analysis
Data were analysed using the GenStat
(3rd edition of Discovery version (Lowes
Agricultural Trust, 2005). Descriptive statistics
was use to analyse daily milk off-take,
lactation length and milk off-take equivalent of
early growth rate by parity, litter size and sex
of kid. Paired t-tests were applied to compare
means between categories of parity, litter size
and sex of kid.
RESULTS
Milk off-take
The overall average daily milk off-take
of 23 full lactation records (DMO) based on
partial suckling and one morning milking per
day was 230.3 g, with total milk off-take of
Observations on milk from PNG goats - Atmaleo Aguyanto & Workneh Ayalew
Journal of South Pacific Agriculture, Volume 15: Nos. 1 & 2, 2011
Milk equivalent of kid weight = [(body
weight of kid at 6 weeks of age – birth
weight of kid) x 1.2)] / (0.1781).

56
23.0 kg over an average lactation length of 95
days (Table 1). DMO ranged from a minimum
of 100 to a maximum of 675 g, with a median
of 208 g. Likewise, total milk off-take (TMO)
for the lactation period ranged from 4.6 to 68.7
kg. Does with extended udders had on average
significantly (P < 0.05) greater DMO and
TMO. Milk off-take tended to increase with
parity, but statistically significant differences
were detected only between parities 1 and 4.
Similarly does with twin kids tend to yield
more milk than those with single kids,
although the differences were not statistically
significant.
Lactation Length
Observed lactations extended from a
minimum of 29 days to a maximum of 225
days, with a median of 100 (Table 1). Litter
size did not influence the length of lactation,
but udder type did. Does with extended udders
had a significantly (P < 0.05) longer lactation
length than those with small udder by on
average 37 days. Lactation length appeared to
have increased with parity, but the differences
between parities were not statistically
significant.
Milk off-take equivalence of early kid
growth
The overall body weight gain of all the
20 kids born to experimental does during the
observation period from 1 to 6 weeks of age
was estimated to be equivalent to 23.2 kg of
milk off-take (Table 2). This value did not vary
between sexes of kid, udder type or even litter
size, perhaps because of the small sample size
(Table 2). Nevertheless, it appears that
individual kids in twin litters gain less weight
within this period than do single born kids,
Observations on milk from PNG goats - Atmaleo Aguyanto & Workneh Ayalew
Journal of South Pacific Agriculture, Volume 15: Nos. 1 & 2, 2011
Table 1. Average (mean ± SE) daily milk off-take (DMO), total lactation milk off-take (TMO) and lactation length (LL) of PNG goats by litter size, udder type and parity.
Means within a column with different superscripts are significantly different at P < 0.05 on unpaired two-sided T-test.
Parameter
Number of
observations DMO (g) TMO (kg) LL (days)
Overall mean 23 230.35 ± 15.9 22.98 ± 3.18 95.00 ± 8.8
Overall minimum 23 100 4.61 29
Overall maximum 23 675 68.7 225
Overall median 23 208 18.49 100
Litter size
1 16 215.4 ±19.31 20.49 ± 3.32 89.94 ± 8.63
2 7 264.6 ± 24.83 28.50 ± 7.19 106.6 ± 21.58
Standard error for difference of means 33.59 6.86 19.13
t-value -1.46 -1.77 -0.87
P 0.158 0.256 0.394
Udder Type
Small 10 178.0 ± 9.77a 13.14 ± 1.65a 74.20 ± 9.39a
Extended 13 270.6 ± 21.2b 30.46 ± 4.15b 111.0 ± 12.19b
Standard error for difference of means 23.34 4.812 16.19
t-value -3.97 -3.60 -2.27
P 0.001 0.003 0.034
Parity
1 4 172.8 ± 12.9a 14.64 ± 1.92 84.25 ± 7.93
2 6 215.8 ± 33.1ab 16.96 ± 6.63 92.50 ± 18.67
3 9 250 ± 28.73abc 24.60 ± 4.16 98.22 ± 9.79
4 4 265.6 ± 28.8bcd 31.90 ± 12.40 117.2 ± 37.84

57
although when the twin kid weights are
combined, the aggregate weight, and hence the
milk off-take equivalent, becomes markedly
bigger than those of single born kids. The sum
of this milk off-take equivalence of early kid
growth and the recorded overall milk off-take
of 23.0 kg gives an estimated total milk
production from these does of 46.2 kg over the
average lactation period of 95 days.
Milk composition
Monthly pooled milk samples of the 23
observations had an average milk fat of 7.8 per
cent, ranging from a minimum of 3.6 to a
maximum of 13.0 per cent. The non-fat milk
solids also had an average value of 10.0 per
cent with minimum of 9.0 and maximum of
11.0 per cent. These give an average total milk
solid content of 17.8 per cent (Table 3). These
values are very high compared to values
reported in the literature from commonly
milked goats. Some plausible explanations for
these high values are the facts that 1) the
sample goats have not been milked before, 2)
their milk off-takes were relatively low, and 3)
minimum levels of supplementary
concentrates provided.
Observations on milk from PNG goats - Atmaleo Aguyanto & Workneh Ayalew
Journal of South Pacific Agriculture, Volume 15: Nos. 1 & 2, 2011
Table 2. Average (mean ± SE) milk off-take equivalence of early kid growth to 6 weeks of age by sex of kid, udder type of dam and litter size.
Means within a column of the same variable were not significantly different from each other P < 0.05 on two sample unpaired two-sided T-test.
Table 3. Monthly average milk fat (MF), total milk solids (TS) and solid-non-fat (SNF) values of pooled
milk samples of PNG goats (n=13).
MF (%) TS (%) SNF (%)
Mean 7.8 17.8 10.0
Minimum 3.6 12.6 9.0
Maximum 13.0 23.4 11.00
Parameter N Milk yield (kg)
Overall 20 23.2 ± 1.8 Kid sex
Female 11 20.8 ± 2.5
Male 9 25.2 ± 2.5
Standard error for difference of means 3.57
t-value -1.66
P 0.226
Udder Type
Small 7 19.3 ± 4.0
Extended 13 25.3 ± 1.6
Standard error for difference of means 3.62
t-value -1.66
P 0.114
Litter size
1 12 26.0 ± 2.42
2 8 19.0 ± 2.0
Standard error for difference of means. 3.40
t-value 2.50
P 0.055

58
Lactation curve
The average (flock level) lactation
curve appeared to have peaked during the first
weeks of lactation and steadily dropped
thereafter to the end of the lactation period
(Figure 1). The first week of the lactation
refers to the week that recording of milk off-
take from the does started thus excluding the
two weeks of nurturing and adaptation of the
kids. However, the individual lactation curves
show considerable variation (Figure 2). By
week three or four of the lactation period,
almost all of the individual goats have reached
peak daily milk off-takes. Invariably recording
of milk off-take started two weeks post
parturition. A good number of individual
lactation curves appeared to have had their
highest milk off-take already by week one,
suggesting even an earlier tendency to peak.
There was one intriguing lactation
curve of a doe that showed signs of drying off
around week 17 of the lactation period but
continued to increase for eleven more weeks to
the second peak and dropped off sharply after
week 30 to the end of the observation period.
The doe did not show signs of abortion or any
other ill health before daily milk off-take
started rising to the second peak.
DISCUSSION
The average DMO and TMO values
found in this study were in agreement with
other such reports from the warm tropics, such
as with local goat breeds in India, Bangladesh,
Malaysia, Brazil and South Africa (Serradilla,
2001). In general milk production in the
tropics is affected by factors such as body size
and weight, age and parity, breed, udder
volume, litter size, nutrition, management and
environmental factors (Devenda & Burns,
1980; Gall, 1981). Similar significant effects
of litter size on DMO and TMO, and in
particular the significantly higher milk off-take
from does with twin kids than those with
single kids, were reported on Maltese goats
(Carnicella et al., 2008) and Bengal goats
(Hossain et al., 2004). This was explained by
Hayden et al. (1972), who found out that
plasma lactogenic activity was regulated by
the number of kids born thus allowing more
milk with increasing litter size. The
significantly greater milk off-take from does
with extended udders than those with small
udders concurs with the assertion that udder
volume is highly correlated to milk yield
(Devendra & Burns, 1983). The tendency for
milk off-take to increase with parity was also
reported on the Red Sokoto, Sahel and the
West African Dwarf local goats of Nigeria for
three parities (Zahraddeen et al., 2009).
The overall average lactation length
observed in this study was longer than those of
some indigenous goats of the tropics such as
the Bengal goats of Bangladesh (Hossian et
al., 2004) with 64.99 ± 1.08 days and the
Sahel , the Red Sokoto and West African
Dwarf goats of Nigeria with 80, 70 and 98
days respectively (Egwu et al., 1995). The fact
that twin litter does had eight more days of
lactation than those with single kids was also
reported on the Jamunapari goat of Bangladesh
under similar semi-intensive management
system (Hassan et al., 2010), although
lactation length is known to vary with the level
of management as well as age of the doe
(Hossain et al., 2004).
The average fat content of milk found
in this study was higher than those of
temperate breeds (Jenness, 1980). This may be
explained by performance orientation of the
breed being more of a meat than a milk type
(Gall, 1981), but may not necessarily hold for
PNG goats which are considered descendants
of the original introduced stock of milk type
goats. Locality is also known to affect milk fat
content. Besides, following the argument by
Greyling et al. (2004), lower levels of milk off
-take are associated with higher milk fat
content. The minimum levels of supplemen-
tary concentrates provided to does could also
be another explanation.
The total milk solids content was
higher than the value reported for the Indian
local goats that had total milk solids of 12.33,
12.60, 13.20 and 13.67 per cent, respectively,
for the first to fourth lactations (Bhosale et al.,
2009). Similar trends were found in the
Nigerian African Dwarf in two studies that
had 17.87 and 18.68 per cent and a higher
trend in the Pygmy goats of United States of
America (USA) summarized by Jenness
(1980). Devendra & Burns (1983) noted that
the high fat percentages relate to higher total
milk solid contents.
Observations on milk from PNG goats - Atmaleo Aguyanto & Workneh Ayalew
Journal of South Pacific Agriculture, Volume 15: Nos. 1 & 2, 2011

59
Observations on milk from PNG goats - Atmaleo Aguyanto & Workneh Ayalew
Journal of South Pacific Agriculture, Volume 15: Nos. 1 & 2, 2011
0
100
200
300
400
500
600
700
1 2 3 4 5 6 7 8 9 10 11 12 13 14 15 16 17 18 19 20 21 22 23 24 25 26 27 28 29 30 31 32
Daily Average milk offtake (g)
Week
G001 G001 G003 G003 G007 G007 G013 G013 G025 G029 G029 G031 G031 G033 G036 G036 G037 G039 G040 G044 G044 G047 G048
Figure 2. Lactation curves of individual lactation records.
Figure 1. Weekly overall average daily milk off-take of PNG goats from
week 1 to week 17 (n=23).
CONCLUSION
The result from this study shows that
PNG goats are able to produce milk at satisfac-
tory levels to meet household needs like other
tropical goat breeds, and hence they can be
promoted for milk as well. Milk off-take
peaked in the first few weeks of milking, with
milking starting two weeks after birth. Does
with extended udder have capacity to produce
more milk, so selection of milk type does can
use this criterion. Milk yield tended to increase
with litter size and parity.

60
Observations on milk from PNG goats - Atmaleo Aguyanto & Workneh Ayalew
Journal of South Pacific Agriculture, Volume 15: Nos. 1 & 2, 2011
References
AREGHEORE, E. M. 2000. Production and management systems used for goats in some Island
countries in the South Pacific Region. Harvest, 21(1 & 2):28-33.
BHOSALE, S. S., KAHATE, P. A., KAMBLE, K., THAKARE, U. M., & GUBBAWAR, S. G.
2009. Effect of lactation on Physio-Chemical properties of Local Goat Milk: Veterinary
world, 2(1):7-19.
CARNICELLA, D., MARIA, M. D., AYRES, C. C., LAUDADIO, V. & DARIO, C. 2008. The
effect of diet, parity, year and number of kids on milk yield and milk composition. Small
Ruminant Research, 77:71-74.
DEVENDRA, C. & BURNS, M. 1983. Milk Production. In: Goat production in the tropics.
Commonwealth Agricultural Bureau, Farnham House, Farnham Royal, Slough, UK. pp 64-
73.
EGWU, G. O., ONYEYILI, P. A., CHIBUZO, G. A., & AMEH, J. A. 1995. Improved
Productivity of goat‘s utilization of goat milk in Nigeria. Small Ruminant Research 16: 195
-201.
FAOSTAT. 2011. Available at http://faostat.fao.org/site/573/DesktopDefault.aspx? PageID=
573#ancor [Accessed 26 August 2011]
GALL, C. 1981. Milk Production. In: Goat Production. Academic Press, New Uros. USA. pp 308-
321.
GIBSON, J. 2001. The nutritional status of PNG‘s population. In: Bourke, R. M., Allen, M. G. &
Salisbury, J. G. (ed.) 2001. Food Security in Papua New Guinea. Proceedings of the Papua
New Guinea Food and Nutrition Conference. PNG University of Technology, Lae, 26-30
June, 2000. ACIAR Proceedings No. 99. Pp 407-413.
GREYLING, J. P. C., MMBENGWA, V. M., SCHWALBACH, L. M. J. & MULLER, T. 2004.
Comparative milk production potential of Indigenous and Boar goats under two feeding
systems of South Africa. Small Ruminant Research, 55: 97-105.
HASSAN, M. R., TALUKDER, M. I. A. & SULTANA, S. 2010. Evaluation of the production
characteristics of the Jamunapari goat and its adaptability to farms in Bangladesh. The
Bangladesh Veterinarian, 27(1):26-35.
HAYDEN, J. J., THOMAS, C. R. & FOSYTH, I. A. 1972. Effect of number of young born and
litter size on milk yield of goats: Role of placental lactogen. Journal of Dairy Science,
62:53-57.
HOSSAIN, S. M. J., ALLAN, M. K., SULTAN, N. & RASHID, M. M. 2004. Milk production
from Black Bengal Goats in Bangladesh. Journal of Biological Science, 4 (3):262-265.
JENNESS, R. 1980. The composition and characteristics of goat's milk: A review 1968-1979.
Journal of Dairy Science, 63(10):1605-1629.
KNIGHTS, M. & GARCIA, G. W. 1997. The status and characteristics of goats (Capra hircus)
and its potential role as a significant milk producer in the tropics: A Review. Small
Ruminants, 26:203-21.
LAWES AGRICULTURAL TRUST. 2005. GenStat®, Release 4.2, Discovery Edition. VSN
International Ltd. Hempstead, United Kingdom.
MINISTRY OF AGRICULTURE AND LIVESTOCK. 2004. State of the animals genetic
resources - Papau New Guinea Country Report. Port Moresby. Papua New Guinea.
Acknowledgements
We would like to thank all the staff at the Labu Livestock Research Station of NARI who have in
their own ways contributed to this study. Special thanks are due to Mrs. Joan Kananur, who helped
in the collection of data. Mr. Martin Lobao provided valuable guidance during data management
and analysis. Dr. Pikah Kohun of NARI provided useful editorial comments on the manuscript.

61
Observations on milk from PNG goats - Atmaleo Aguyanto & Workneh Ayalew
Journal of South Pacific Agriculture, Volume 15: Nos. 1 & 2, 2011
Available at ftp://ftp.fao.org/docrep/fao/010/a1250e/annexes/CountryReports/
PapuaNewGuinea.pdf
PEACOCK, C. 1996. Improving Goat Production in the Tropics. A Manual for Development
Workers. Oxfam Print Unit. U.K. pp385 + xx.
QUATERMAIN, A. R. 1982. The productive capacity of female goats in Papua New guinea. In:
Jainudeen, M. R. & Omar, A. R. (eds) Animal Production and Health in the Tropics.
Penerbit Universiti Pertanian Malaysia, Serdang: 417-420.
QUARTERMAIN, A. R. 2002. Conservation of Domestic Animal Genetic resources in Papua
New Guinea. NARI Technical Bulletin No. 4. July 2002. National Agricultural Research
Institute (NARI), Lae, Papua New Guinea.
SERRADILLA, J. M. 2001. Use of High Yielding goat Breeds for Milk Production. Livestock
Production Science, 71:59-73.
SCIENCE DAILY. 2007. "Goats' Milk Is More Beneficial To Health Than Cows' Milk, Study
Suggests." University of Granada. Available at http://www.sciencedaily.com/releases/
2007/07/070730100229.htm [Accessed 20 June 2010]
VINCENT, D. & LOW, S. 2000. A review of Papua New Guinea Red meat Industry. Centre for
International Economics. 2000. ACIAR Monograph Number 66. Canberra, Australia.
ZAHRADDEEN, D., BUTSWAT, I. S. R. & MBAP, S. T. 2009. A note on factors influencing
milk yield of local goats under semi-intensive system in Sudan Savannah ecological zone
of Nigeria. Livestock Research for Rural Development. Volume 21, Article #34. Available
at, http://www.lrrd.org/lrrd21/3/zahr21034.htm [Accessed May 11 2010]

62
Effect of blending sweet potato silage with commercial pellet feed or farm-made
concentrate (fish meal and copra meal) on the performance of local crossbred
pigs in Papua New Guinea (PNG)
Michael Dom1, Workneh Ayalew and James Tarabu
ABSTRACT
To make a balanced diet for growing pigs sweet potato silage must be blended with a protein
concentrate in the form of a commercially available pig grower pellet feed or a mix of local feeds
such as copra meal and fish meal. An on-station growth performance of twelve paired crossbred
weaner pigs at three months of age and weighing 20 ±3.28 kg was monitored for eight weeks on
three mixed diets balanced for crude protein (CP) and gross energy (GE) content on DM basis.
The trial was a continuation of research on sweet potato silage as an efficient preserved
carbohydrate energy source, particularly for smallholder farmers with orientation to tapping into
emerging pork meat markets. The experimental shed had concrete floor pens, corrugated iron roof
and partial open wall. The three diets were: 1) sole diet of a standard commercial pig grower; 2) a
mixed ration of commercial pig grower blended 50:50 as fed with sweet potato silage, and 3)
mixed ration of sweet potato silage blended with a combination of fish meal and copra meal at
77:4:19 ratio on as fed basis. Dry matter contents of the mixed diets were much lower than that of
the control but there were no significant (P > 0.05) differences in the dry matter intake. Despite the
reasonably good balance of protein and energy in the three diets and similar dry matter intake the
mixed diets gave lower performances in average daily gains, feed conversion ratios and mean final
body weights than the standard pig grower feed. Results partially supported the hypothesis that
growth performance of crossbred pigs fed on sweet potato silage mixed with either standard
commercial grower feed or copra and fish meal will not be significantly different. It was
recommended that more trials be conducted to test nutritionally balanced, least-cost pig rations
based on locally available feed resources, including wheat millrun, poultry offal meal, palm kernel
meal, rice millings, cassava, mulberry leaves, taro and other forages, in dried or ensiled form.
Key words: Copra meal, daily gain, dry matter intake, fish meal, growing pigs, sweet potato
silage.
INTRODUCTION
The Papua New Guinea (PNG)
National Agriculture Research Institute
(NARI) has successfully adapted ensiling
sweet potato (SP) as a feed preservation/
storage technique for smallholder livestock
farming (NARI Nius, 2010) from research
conducted in Vietnam (Peters et al., 2001;
Peters et al., 2002). Conclusive results were
obtained on the advantages of feeding mixed
sweet potato tuber and vine silage to growing
pigs under on-station as well as on-farm
feeding emulating small-scale pig farming in
two agro-ecological zones (Dom & Ayalew,
2009a, 2009b, 2010; Dom et al., 2010).
An important outcome of this on-going
research was the confirmation that SP silage
can replace the traditional practice of feeding
cooked tuber and fresh vine without adverse
effect on nutritive value and digestibility of the
balanced ration. Furthermore, the technology
saves daily family labour in feed preparation
and fuel for cooking SP tuber. It was
demonstrated in on-farm trials that adequate
balanced diet based on ensiled SP forage can
be made readily available through weekly
ensiling of excess, undesirable or un-saleable
sweet potato tuber and vine forage sourced
from local food gardens, apart from SP tuber
bought from a local food market (Dom et al.,
Journal of South Pacific Agriculture, Volume 15: Nos. 1 & 2, 2011
1National Agricultural Research Institute, Livestock Research Station, Labu PO Box 1639, LAE 411, Morobe Province, Papua New Guinea, Tel: (675) 475 1066. Fax: (675) 475 1248, Email: [email protected] or [email protected]
Corresponding address: [email protected]
Effect of sweet potato, commercial and farm-made feeds on pigs - Michael Dom, Workneh Ayalew & James Tarabu

63
2010). The forage processing was done using
simple tools such as kitchen graters and knives
in addition to using a mechanical chopping
device.
A considerable hindrance to improved
productivity for pigs kept in rural villages is
the poor storability of common root crops and
green forages used as food or feed, which
thereby demands continuous cropping on
limited available arable land. In addition,
livestock are often at the mercy of irregular
crop cycles.
Ensiling affords an efficient means of
processing perishable fresh forages for longer
term preservation over several months. The
common staple crops in PNG such as sweet
potato, cassava, taro and banana, including
those varieties not cultivated for food, are also
very suitable for ensiling owing to their high
starch content. Ensiled feed is also very
palatable to other livestock, such as goats, that
are able to digest the plant fibre as well as
proteins much more effectively.
Conservation of the valuable feed
nutrients well after the lush harvest season
enables livestock farmers to provide a
consistent plane of nutrition to their animals.
This is vital when smallholder farmers venture
into more intensive pig farming in response to
growing domestic market for fresh meat, as is
the case in PNG.
In PNG up to half of the sweet potato
produced as food may actually go to feeding
pigs in rural villages (Hanson et al., 2001).
Despite its predominant use by smallholder pig
farmers, there is very little understanding of
the importance of sweet potato vines as a feed
resource, especially as sources of digestible
fibre and protein. Given that sweet potato is
also a major fresh produce in local markets
(Chang & Spriggs, 2007), with crops grown on
a large scale, there remains a need to explore
options for promoting its improved use as
home grown forage feed resource for livestock
farmers. In fact, NARI‘s poultry research has
revealed nutritional and economical benefits of
using locally grown tuber crops (SP and
cassava) as major energy sources in broiler
finisher rations (Pandi et al., In press).
Combined sweet potato tuber and vine
silage raises the level of digestible protein in
mixed diets fed to pigs (Tomita et al., 1985; in
Pérez, 1997; Dom & Ayalew, 2009a), and
fermentation of the starch reduces the effects
of trypsin inhibitors (Peters et al., 2002). But
what is also needed for improving growing pig
performance is a fitting protein component that
complements sweet potato silage to provide
adequate and economical ration.
Commercially available grower pig
pellets have been used as nutritionally
balanced standard diets and as the protein
component of mixed rations. The commercial
feed was substituted at 50% of the complete
offer as fed, mixed with SP silage, and was
proven to be effective for adequate daily feed
intake, body weight gain and feed conversion
ratio (Dominguez, 1992; Pérez, 1997; Giang et
al., 2004; Dom & Ayalew, 2009b).
A related on-farm feeding trial with
crossbred growing pigs raised in high altitude
highlands of PNG (Dom et al., 2010)
compared growth performance of pigs on two
SP silage based diets and found similar effects
(P > 0.05): 1) equal portions of copra meal
and fish meal mixed with SP silage, and 2) the
commercial pig grower diet mixed with SP
silage. Since the copra and fish meals were
cheaper and easier to transport and store in
bulk than the commercial pig grower ration
they were considered a more economical feed
ingredient to use by pig farmers in the
highlands of PNG than the sole commercial
pig grower diet. However, the farmers do not
have the knowledge or means to check protein
and energy contents of these ingredients to be
able to balance the formulated concentrate
diets for these nutrients. Both are expected to
be good protein sources but their energy
content is doubtful and need to be looked into.
In the current study we tested the effects of a
mixed ration made of copra and fish meal
(protein concentrate) and SP silage, where the
proportion of cheaper copra meal in the mix
was increased from 50% to over 80%. In
addition, gross energy of treatment diets was
balanced on an ‗as fed‘ basis. The study was
designed to test the hypothesis that there was
no significant difference in growth
performance of crossbred pigs fed on sweet
potato silage mixed with either standard
commercial grower feed or 80:20 copra and
fish concentrate meal. This is a follow-up
study to one that established that SP silage, fed
Journal of South Pacific Agriculture, Volume 15: Nos. 1 & 2, 2011
Effect of sweet potato, commercial and farm-made feeds on pigs - Michael Dom, Workneh Ayalew & James Tarabu

64
ad libitum, can substitute 50% of a commercial
feed (16% crude protein) while maintaining
good daily weight gain, efficient feed
conversion and acceptable back-fat thickness
but lower dry matter intake (Dom & Ayalew,
2009b).
METHODS AND MATERIALS
Trial location
The trial was conducted at the NARI
Labu Livestock Research Station, Lae, Morobe
Province. The site is located about 12 km from
the Lae town on the Wau-Bulolo Road (Lat. 6o
40‘ 27‖ South Lon. 146o 54‘ 33‖ East). The
altitude is less than 100 masl. The climate at this
station is typically warm and wet with an
average temperature of 32 °C and humidity of
85 % to 90 %.
Trial design and protocol
The experimental lay-out was a 2 x 2 x
3 and the design was a randomized complete
block where twelve weaned piglets at about
nine weeks age were randomly selected by
assigning pig to six pens and balancing by
different progeny, sex and total body weight of
paired (male-female) pigs in a single pen (3 x
4 sq. m). The crossbred grower pigs came
from two contemporary litters of a 25%
crossbred sow mated with a 50% crossbred
boar, both originating from loose admixtures
of Large White, Landrace and Duroc breeds
and PNG native pig (Sus scrofa papuensis)
which is a genotype believed to be common in
market oriented village piggeries. The
crossbred pigs came from two contemporary
litters of a 25% crossbred sow mated with a
50% crossbred boar, believed to be common in
market oriented village piggeries. Two rows of
feeding pens in an experimental shed with
concrete floor, corrugated iron roof and
partially open wall aligned north to south and
facing opposite sides of morning and afternoon
sun rays were taken as blocks. There were two
replications of each diet on both blocks. Three
treatment diets were fed and the testing period
lasted 56 days from 2 June to 27 August 2010.
The experimental pigs were introduced to the
diets soon after weaning at three months age
and 20 ± 3.28 kg body weight. The pigs were
given an entire day‘s offer of initially 3000 g
dry matter feed per head per day at around 9
am every morning after cleaning and washing
down pens and pigs. Piped water was readily
available at all times using nipple drinkers.
Horizontal concrete feeders covered with pig
wire to prevent pigs trampling the feed were
used. Feed refusal was collected at 8 am every
morning and weighed on a digital balance (1.0
g ± 0.5 g). Feed offer was increased as
required by observing the trend in refusal
levels. Body weights were determined by
placing pigs in a bag and hanging on a Bilda
spring-balance (100 kg ± 0.50 kg), with
weighing done regularly at 9 am once a week.
Experimental diets
Sweet potato silage was made
fortnightly according to an adapted procedure
(Dom, 2007). Grated sweet potato tubers and
chopped vines were mixed at 50:50 ratio after
a few hours of open sun drying to reduce
moisture. Salt was added at 0.5% and the mix
firmly packed in air-tight plastic garbage bags
placed in sturdy 70 kg plastic bins and sealed
for fermentation for at least two weeks before
feeding the resultant silage. SP tuber was
purchased from local urban (Lae) market,
while SP vine was sourced fresh from several
peri-urban farming families. Copra meal and
fish meal were purchased in bulk and stored in
a cool, dry location before start of the feeding
experiment.
Dry matter, crude protein and energy
values for the test diet components and the
combined compositions are given in Table 1.
The sole standard commercial pig grower
ration (PDSTD) manufactured by Goodman
Fielders (PNG) Ltd, Lae, was used as a control
diet. One batch of 25 bags or one ton was used
for the duration of the trial. The second test
diet (PGSPS) was composed of standard
commercial ration and SP silage thoroughly
mixed by hand just before offer at 50:50 on as
fed basis (or 75:25 on dray matter (DM) basis.
Test diet three (FCSPS) was farm concentrate
made of fish meal and copra meal and mixed
with SP silage at a ratio of 4:19:77 on as fed
basis (or 8:37:55 on DM basis). Dry matter
was estimated from past data using similar
feed materials, while values for crude protein
(CP %) on dry matter basis and gross energy
(GE MJ/kg) on ‗as fed‘ basis were derived
from the literature. Other proximate nutrients
Journal of South Pacific Agriculture, Volume 15: Nos. 1 & 2, 2011
Effect of sweet potato, commercial and farm-made feeds on pigs - Michael Dom, Workneh Ayalew & James Tarabu

65
Table 1. Components and composition of dry matter (DM), crude protein (CP) and gross energy (GE) values for components as well as whole rations of test diets on as fed basis.
*Determined on-station by drying in hot air-draft oven.
**Reported on product labelling on as fed basis.
†Values from Tacon (1997) cited in Miao, Z. & Glatz, P.C. 2005. Feed ingredient fact sheet for PNG and Solomon Islands. Pig and
Poultry Production Institute. Roseworthy Campus. Roseworthy. South Australia. § On DM basis.
‡Test diets: PGSTD = sole diet of standard commercial pig grower ration, control diet; PGSPS= a mixed ration of commercial pig grower blended with sweet potato silage 50:50 as fed; FCSPS=a mixed ration of sweet potato silage blended with a combination
of fish meal and copra meal at 77:4:19 ratio on as fed basis.
Journal of South Pacific Agriculture, Volume 15: Nos. 1 & 2, 2011
Effect of sweet potato, commercial and farm-made feeds on pigs - Michael Dom, Workneh Ayalew & James Tarabu
Test diet‡ Component Compositi
on (%) on
DM basis
DM
(%)*
CP (%) GE (MJ/
kg)†
DM
(%)
CP§
(%)
GE§
(MJ/
kg)
PGSTD Pig grower 100.0 91.8 16.0** 14.0 91.8 17.4 15.3
PGSPS Pig grower 75.0 91.8 16.0** 14.0 63.7
14.6
15.2
Sweet potato
silage
25.0 33.2 4.0† 5.0
FCSPS Fish meal 8.0 94.8 52.0** 17.5 46.9 16.2 16.7
Copra meal 37.5 92.2 21.0** 17.3
Sweet potato
silage
54.5 33.2 4.0† 5.0
were not determined.
Feeding regime and body weight
The daily ration offered on a dry matter
basis was based on the overall mean body
weight of all twelve pigs for three periods:
week 1 to week 3 (inclusive), week 4 to 7
(inclusive) and week 8 and beyond. At the
beginning of Week 1 the overall mean body
weight was 20.0 kg and feed offered during
first period was 3000 g DM/pen/day; at the
beginning of period two (Week 4) the overall
mean body weight was 30.4 kg and feed
offered during this period was 4000 g DM/
pen/day; for period 3 beginning with Week 8
the mean body weight was 48.2 kg and feed
offered was 5000 g DM/pen/day.
Data analysis
Analysis of variance for means of daily
intakes, weekly body weights and body weight
gains was done using GenStat® (Lawes
Agricultural Trust, 2005). The block effect, or
side of the experimental shed, did not
contribute significantly to the variation in feed
intake and weight gain. It was therefore
removed as a classification variable, and
similar pens of the same treatment on either
side of the shed were subsequently treated as
replications.
RESULTS
Feed intake, body weight gain and feed
efficiency
Mean weekly feed intake and body
weight gain on each of three treatment diets
are shown in Table 2. Estimates of the average
daily intake, weight gain and feed conversion
ratio are shown in Table 3. Overall results
show a distinct lowering of mean body
weights on FCSPS away from PGSPS and
PGSTD after the fourth week of feeding,
whereas high and low means were due to
individual variations (Figure 1). FCSPS
attained a mean final body weight at end of
week 8 of 10 and 17 kilograms lower than
PGSPS and PGSTD, respectively (Table 3).
The differences in feed intake among
treatment diets on a fresh weight (or ‗as fed‘)
basis was highly significant (P < 0.002)
perhaps because of bulkiness of the SP based
diets (Table 1). However, the weekly dry
matter intake was not at all different (P >
0.05), which may have been also affected by
the predetermined weekly offer within the
individual periods. In particular, except during
the first ten days of the trial all feed offered in
the control diet (PGSTD) was completely
consumed leaving no residue, suggesting that

66
Table 2. Average fresh weight (FW) and dry matter (DM) intake per animal of growing pigs offered three treatment diets over eight weeks.
Means within a row with the same superscript are similar at the 5% level.
Intake mean values are average per pig of pen paired male and female pigs.
‡Treatment diets: PGSTD = sole diet of standard commercial pig grower ration, control diet; PGSPS= a mixed ration of commercial pig grower blended with sweet potato silage 50:50 as fed; FCSPS=a mixed ration of sweet potato silage blended with a combination of fish meal and copra meal at 77:4:19 ratio on as fed basis.
Journal of South Pacific Agriculture, Volume 15: Nos. 1 & 2, 2011
Effect of sweet potato, commercial and farm-made feeds on pigs - Michael Dom, Workneh Ayalew & James Tarabu
Parameter Grand mean Treatment diets‡ sed l.s.d F Pr.
FCSPS PGSPS PGSTD
FW intake (g) 2941 3733.5a 2932.0b 2157.0c 352.95 757.05 0.002
DM intake (g) 1881 1751.0 1911.5 1980.5 230.15 493.6 0.603
Table 3. Average daily feed intake per animal (ADI), daily weight gain per animal (ADG) and feed conversion ratio (FCR) of pigs fed SP silage based diet.
*Differences between means of test diets not significant (P > 0.05).
‡Treatment diets: PGSTD = sole diet of standard commercial pig grower ration, control diet; PGSPS= a mixed ration of commercial
pig grower blended with sweet potato silage 50:50 as fed; FCSPS=a mixed ration of sweet potato silage blended with a
combination of fish meal and copra meal at 77:4:19 ratio on as fed basis.
Parameter Treatment diet‡
FCSPS PGSPS PGSTD ADI (g/day) 1681 1800 1866
ADG (g/day) 442.1 634.1 743.4
FCR 3.80 2.84 2.51
Mean initial BW* (kg) 22.9 23.8 25.2
Mean final BW* (kg) 45.4 55 61.8
Figure 1. Changes in average body weights of growing pigs fed three test diets‡ (FCSPS, PGSPS, PGSTD)
over eight weeks.
‡Diets: PGSTD = sole diet of standard commercial pig grower ration, control diet; PGSPS= a mixed ration of commercial pig grower blended with sweet potato silage 50:50 as fed; FCSPS=a mixed ration of sweet potato silage blended with a combination of fish meal and copra meal at 77:4:19 ratio on as fed basis.

67
Journal of South Pacific Agriculture, Volume 15: Nos. 1 & 2, 2011
Effect of sweet potato, commercial and farm-made feeds on pigs - Michael Dom, Workneh Ayalew & James Tarabu
pigs needed extra feed offered. But as the quantity offered of PGSTD was related by design of the experiment to the amount of this standard grower ration to be mixed with silage to make diet 2 (PFSPS), the offer of PGSTD was not increased.
Body weight gains were significantly (P < 0.05) different during the third, fourth and eighth weeks of the feeding trial., especially differences between FCSPS and PGSTD. At week three there was a very marked drop in body weight gain on all three diets (P < 0.006) for unknown reason but apparently the effect was equally observed on all trial pigs regardless of diet type or quantity offered. So the cause of this decline must have been environmental and not lack of feed. On that week the commercial standard was superior to both mixed diets PGSPS and FCSPS (P < 0.05). The very significant gain in body weight (P < 0.009) at week four can be explained by the increased intake when the feed offered was raised from 3000 to 4000 g DM/day/pen. In addition, as the average body weight gain subsequently declined over the next three weeks while this offer level was maintained, animals may have exhibited compensatory growth during week 4. It appeared that the same response was repeated after the increased offer at week eight (5000 g DM/day/pen). It is probable that the greater weight gains were due to the availability of more feed initially satisfying the pig‘s appetite but not for
growing needs per se.
Feed cost comparison The unit costs of feed components are
shown in Table 4. The mean daily cost of intake as fed per animal was higher for FCSPS than both PGSPS and PGSTD (Table 5). Based on feed costs alone FCSPS was the most costly diet to raise four growing pigs while the commercial pig grower PGSTD was the least costly; however, the current prices of these components were particularly high at the time due to high prices of these export commodities on the world market. During the same year local market price of fish meal fluctuated from K1.65 to K2.20; similarly copra meal market prices were 25% lower later
in the same year.
DISCUSSION
Despite the rather large differences in
Table 4. Unit costs of the feed components used for blending the three diets.
*Based on suppliers prices in July 2010 (+VAT): Goodman
Fielder1 (PNG) Ltd, IFC Ltd2 and Farmset Ltd3. **Based on the cost of market sourced SP tuber at Kina 0.75
per kg bag and fresh vine at Kina 0.50 per kg.
Table 5. Total feed intake of four pigs as fresh
weight (or ‗as fed‘ basis) and cost of each diet.
‡Diets: PGSTD = sole diet of standard commercial pig grower
ration, control diet; PGSPS= a mixed ration of commercial pig grower blended with sweet potato silage 50:50 as fed; FCSPS=a mixed ration of sweet potato silage blended with a combination of fish meal and copra meal at 77:4:19 ratio on
as fed basis.
dry matter content of the treatment diets
(Table 1) the mean dry matter intake by pen of
the two blended SP silage diets were not at all
significant (P > 0.1). The much higher fresh
weight (FW) intake of the farm made
concentrate diet (FCSPS) had compensated for
the lower DM content of SP silage in the other
two diets (Table 2). The comparable level of
feed DM intake signifies the high palatability
of protein concentrate rations blended with SP
silage. This is an important finding, since the
FCSPS diet was composed entirely of locally
available copra meal., fish meal and SP silage,
with the latter contributing 54 % of the DM, in
contrast to the commercial pig grower ration
made primarily from imported energy (wheat,
sorghum) and protein (soybean) sources.
The average daily weight gains (ADG)
were improved for all three diets by
comparison to previous feeding trials using
similar feed components as mixed offer to
growing pigs (Dom and Ayalew, 2009b). As
expected, the PGSPS containing 75 %
commercial grower pellets provided a better
ADG of 634 g/day than in a previous trial at
Diet‡ Total feed
intake
(kg)
Total
cost
(Kina)
Average daily
cost (Kina)
± St. dev.
FCSPS 803.1 1,082.68 9.67 ± 1.66
PGSPS 617.4 852.12 7.61 ± 1.48
PGSTD 455.3 682.93 6.10 ± 1.13
Components Unit cost (Kina)
Pig grower1 1.50*
Fish meal2 1.80*
Copra meal3 1.65*
Sweet potato silage 1.25**

68
Journal of South Pacific Agriculture, Volume 15: Nos. 1 & 2, 2011
Effect of sweet potato, commercial and farm-made feeds on pigs - Michael Dom, Workneh Ayalew & James Tarabu
the same location where it constituted only 50
% of the ration and gave ADG of 540 g/day.
In this trial the FCSPS diet made up of
8 % fish meal and 37.5 % copra meal was less
efficient (FCR = 3.80) but the ADG was 442
g/day compared to 371 g/day (FCR = 2.99) on
a farmer‘s own ration (FFO) which consisted
of copra meal and fish meal in equal
proportion offered at 500g per animal along
with SP silage at ad libitum offer (Dom et al.,
2010). On the other hand, the sole fed
commercial pellet diet (PGSTD) had improved
FCR and ADG in this on-station trial than in
the previous on-farm trial where it was also
offered to similar growing pigs. Therefore,
considering the cooler high altitude climatic
conditions (altitude of 2250 m and mean daily
temperatures of 20 °C) of the highlands
expected to be conducive to growth, the
improved performances on the present warm
and humid lowland environment may be
attributed to a better nutritional balance of the
diet.
On the premise that feed intake in
growing pigs goes primarily to satisfy energy
needs for growth (ARC, 1981) , and that the
dry matter intakes were similar, it is asserted
that the SP silage based blended diets can
provide adequate gross energy like the
commercial pig grower ration, as was also
indicated by the calculated nutrient
compositions.
In addition, the calculated crude
protein level of the FCSPS (16.2 %), mainly
from copra meal., was slightly higher than that
of PGSPS (14.6 %); so it is argued that there
were other factors responsible for the lower
growth performance on the FCSPS diet, in
particular for the drop in the average weight
gain of 192 to 301 g/day (Table 3). The
PGSPS diet with the 25 % SP silage blended
with 75 % commercial pellet diet had an ADG
of 634 g/day, which was on par with predicted
daily weight gain of 640 g/day for growing
pigs in the tropics (Durrance, 1971; As cited in
Payne, 1990).
It is noteworthy that the growth
performance on these simple farm-made diets
was similar to those of more comprehensively
formulated rations of sweet potato silage tested
by Giang et al. (2004). It is therefore
hypothesised that further improvements to the
FCSPS diet ingredients may raise the
performance of growing pigs. Conversely, at
the time of this trial the fish and copra
concentrate meals were in short supply at the
local stock feed distributors and thus
accounting for the higher unit costs of fish
meal and copra meal at the time (Table 4) and
consequently the FCSPS diet proved to be the
most expensive to feed on a daily basis (Table
5).
CONCLUSIONS AND
RECOMMENDATIONS
The daily feed intake on the SP silage
mixed with either commercial pig grower (at
75 %) or a combination of fish meal and copra
meal (at 45 %) or the sole fed commercial feed
(100 %) were not significantly different (at
least at P > 0.05). But weekly body weight
gain showed highly significant differences (at
least P < 0.05) that were more indicative of
disparity between the commercial pellet feed
and the fish meal and copra meal concentrates
mixed with SP silage.
Commercial grower pellets are
nutritionally balanced using imported soybean,
sorghum, corn meal and other grains. and
hence their high retail prices. It is likely that a
lower cost diet composed of locally available
feed resources, namely sweet potato, copra
meal and fish meal, may be further enhanced
by improved feed formulations which also
include other local ingredients that contain a
better balance of nutrients, particularly protein.
Likely ingredient inclusions are millrun,
poultry offal meal, palm kernel meal, rice
millings, cassava, mulberry leaves, taro forage,
as well as using varieties of the locally grown
forage feeds, by processing into dried or
ensiled form to increase their palatability.
Since these feed resources are more
readily available than the grain based
commercial feeds and are required in less bulk
order, which also entails shipment or cartage
costs, there may be economic incentive to
maximizing their use as animal feeds. Further
research into effective, least cost rations is
recommended to improve the feeding options
for smallholder pig farmers, particularly those
with interests in entering the competitive
commercial fresh meat markets.

69
Journal of South Pacific Agriculture, Volume 15: Nos. 1 & 2, 2011
Effect of sweet potato, commercial and farm-made feeds on pigs - Michael Dom, Workneh Ayalew & James Tarabu
Acknowledgements
Special thanks go to Mr. Tony Pewa and the stockmen at the NARI Livestock Research Station at
Labu who assisted in the preparation of sweet potato silage and other feeds, weighing and feeding
of trial pigs. The trial was fully funded by NARI Livestock Projects.
References
AGRICULTURAL RESEARCH COUNCIL (ARC) 1981. The Nutrient Requirements of Pigs;
Technical Review Rev. Ed. Slough, England, Commonwealth Agricultural Bureaux xxii.
pp.307.
BINDELLE, J., LATERME, P. & BULDGEN, A. (2008) Nutritional and environmental
consequences of dietary fibre in pig nutrition: a review. Biotechnology, Agronomy, Society
and Environment 12(1):69-80.
CHANG, C. & SPRIGGS, J. 2007. Sweet potato marketing in PNG highlands (No. 2007-3),
Working Paper Series in Agriculture and Resource Economics, University of New
England. Available at http://www.une.edu.au/febl/EconStud/wps.htm. [Accessed on 2 Dec.
2008]
DOM, M. 2007. Guidelines for storing sweet potato as silage for feeding pigs, NARI Livestock
Research Programme. National Agricultural Research Institute (NARI), Lae, Papua New
Guinea (Unpublished working document).
DOM, M. & AYALEW, W. 2009a. Adaptation and testing of ensiling sweet potato tuber and vine
for feeding pigs: Digestibility and nitrogen retention on mixed silage diets. Journal of the
Institute of Chemists PNG, 2:77-88.
DOM, M. & AYALEW, W. 2009b. Effect of replacing 50% of a commercial grower feed with
sweet potato silage on the performance of crossbred pigs in Papua New Guinea (PNG).
Journal of South Pacific Agriculture, 14:28-37.
DOM, M., AYALEW, W. & AMBEN, S. 2010. Development of Improved Pig Feeding Systems
Using Ensiled Material: On-farm testing of feeding Sweet Potato silage to growing pigs at
Tambul in Western Highlands Province. Science in New Guinea, 30:94-104.
DOMINGUEZ, P. L. 1992. Feeding of sweet potato in monogastrics. In: Machin, D. & Nyvold, S.
(Eds.), Roots, tubers, plantains and bananas in animal feeding. Animal Production and
Health paper No. 95, FAO: Rome, 1992. pp.217-233. http://www.fao.org/ag/aga/agap/frg/
AHPP95/95-217.pdf
GIANG, H. H., LY, L. V. & OGLE, B. 2004. Digestibility of dried and ensiled sweet potato tubers
and vines and their effect on the performance and economic efficiency of F1 crossbred
fattening pigs, Livestock for Rural Development 16(7), [On-line]. Available at http://
www.cipav.org.co/lrrd/lrrd16/7/gian16050.htm [Accessed December 2, 2008].
HANSON, L. W. ALLEN, B. J. BOURKE, R. M. & MCCARTHY, T. J. 2001. Papua New
Guinea Rural Development Handbook, The Australian National University, Brown Prior
Anderson, Melbourne, Australia. pp.11.
LAWES AGRICULTURAL TRUST 2005. GenStat® Release 4.2, Discovery Edition. VSN
International Limited, Hempstead, United Kingdom.
MIAO, Z. & GLATZ, P. C. 2005. Unpublished document. Feed ingredient fact sheet for PNG and
Solomon Islands. Pig and Poultry Production Institute. Roseworthy Campus. Roseworthy.
South Australia.
NARI Nius 2010. Newsletter of the Papua New Guinea National Agriculture Research Institute,
April-June 2010, 13(2). pp.7.
PANDI, J., DEKLIN, J., AYALEW, W. & GLATZ, P. 2011. On station broiler grow out trials of
best bet finisher diets based on sweet potato and cassava as major energy sources.
Australian Journal of Animal Science (Unpublished).

70
Journal of South Pacific Agriculture, Volume 15: Nos. 1 & 2, 2011
Effect of sweet potato, commercial and farm-made feeds on pigs - Michael Dom, Workneh Ayalew & James Tarabu
PAYNE, W. J. A. 1990. An Introduction to Animal Husbandry in the Tropics, Fourth Edition,
ELBS, Longman Singapore. pp.627-683.
PÉREZ, R. 1997. Feeding pigs in the tropics, FAO Animal Production and Health Paper 132.
Rome, Italy. Food and Agriculture Organization.
PETERS, D., TINH, N. T., MINH, T. T., TON, P. H., YEN, N. T. & HOANH, M. T. 2001. Pig
Feed Improvement through Enhanced Use of Sweet Potato Roots and Vines in Northern
and Central Vietnam. International Potato Centre (CIP), Hanoi, Vietnam.
PETERS, D. TINH, N. N. THUY, T. T. & THACH, P. N. 2002. Sweet Potato Root Silage for
more efficient and labour saving pig raising in Vietnam. AGGRIPPA. Food and
Agriculture Organisation. Rome, Italy.
TOMITA, Y., HAYASHI, K. & HASHIZUME, T. 1985. Palatability of pigs to sweet potato-silage
and digestion trial by them. Bulletin of the Faculty of Agriculture, Kagoshima University
No. 35:75–80. (As cited in Pérez, 1997).

71
Evidence of environmental effects on cocoa flavour attributes
Noel Y. Kuman1
ABSTRACT
Local Papua New Guinea cocoa clones were compared over two successive years for flavour
attributes. There is strong evidence of marked environmental factors such as climatic and edaphic
influences of the growing environment on cocoa flavour. Restriction Maximum Likelihood
variance estimation for crop year effects indicate a significant difference in floral (P ≤ 0.001),
chocolate (P ≤ 0.01) and acid (P ≤ 0.05) flavour. Analyses of variance for sets of cocoa clones
show significant (P > 0.05) differences in flavour attributes between crop years.
Key words: Environmental effects, cocoa flavour attributes.
INTRODUCTION
Environmental effects (mainly soil and
climate) and methods of post harvest
processing have been proposed as being
responsible for the Arriba flavour of
Ecuadorian beans (Enriquez, 1993; Wood &
Lass, 1985). Other work (Clapperton, 1994)
has indicated that the same genetic material
planted in different environments exhibits
similar flavour characteristics when processed
in a similar manner. Recent studies have
shown that flavours developed from different
plantings are clearly distinguishable and differ
in cocoa flavour intensity, acid taste,
bitterness, astringency and fruity/floral notes
(Clapperton et al., 1991, 1994). The majority
of the flavour characteristics are heritable
(Clapperton, 1993). The quality characteristics
of cocoa have been shown to be significantly
influenced by genotype; however, they can
also be influenced by environmental factors.
Bean quality has been shown to be influenced
by rainfall (Wood & Lass, 1985) and other
environmental factors such as nutrients and
water availability. However, beans of the same
genotype harvested from two different
locations, but subjected to the same post-
harvesting processing techniques before their
flavours were assessed, indicated that the
environment appeared to have no effect on
flavour (Figueira et al., 1997) but Wood
(1975) reported that the same genotype planted
in different locations produced different bean
quality. The genotypic variation in cocoa bean
quality has been reported from several studies
(Chong & Sidhm, 1991; Lambert et al., 1996;
Tucci et al., 1996; Clapperton, 1996; Pires et
al., 1998). It has been recognized that flavours
differ between origins and some are associated
with distinct varieties and environments of
origin. Mouth feel or viscosity of cocoa liquor
is under genetic control (Clapperton et al.,
1994c). The influence of local breeding and
selection programmes and local growing
conditions, together with other exogenous
factors, are manifested in specific cocoa
flavour. The bean quality of cocoa is
influenced by genotype and genotype x
environment interactions. Papua New Guinea
is known to produce a unique blend of flavour
classified as being fresh ripe, acid or winery
flavour that transits to produce pleasant
moderate and basal flavour (Kuman, 2005).
Genotype x environment interaction is
a widespread interaction indicating the
reaction of genotypes to the environment in
which they are grown (Weber et al., 1996).
The bean quality of a genotype can be
influenced by confounding effects such as
genotype x location x year (Bramel-Cox,
1996). Most of the literature discusses the
genotype and post harvest processes and their
influence on cocoa quality. This paper is
concerned with the effect of environmental
factors on cocoa flavour as indicated by year
to year variation.
1Former senior research scientist, working with the Papua New Guinea Cocoa & Coconut Research Institute. Corresponding address: [email protected]
Journal of South Pacific Agriculture, Volume 15: Nos. 1 & 2, 2011
Effect of environment on cocoa flavor - Noel Y. Kuman

72
Journal of South Pacific Agriculture, Volume 15: Nos. 1 & 2, 2011
Effect of environment on cocoa flavor - Noel Y. Kuman
MATERIALS AND METHODS
Four local fine flavour KA clones
(KA1-106, KA 16-2/3, KA 37-13/1 & KA 73-
14/1) and local bulk clones (NAB 11) were
evaluated for their flavour attributes in the
2003 and 2004 crop years at the Papua New
Guinea Cocoa and Coconut Research Institute.
The flavour attributes of each clone were
compared against each other and against the
Ghana reference sample. Ghana is the
industrial standard for ―bulk‖ cocoa and is
included and used as a reference for
organoleptic assessment. The KA hybrids
represent available local fine flavour clones
which were developed by crossing original
local Trinitario and Amazonian clones, while
NAB 11 represents local bulk cocoa.
Sample collection and preparation
Post harvest processing is critical for
all cocoas and is essential for the development
of cocoa flavour. In this trial, all the samples
were subjected to the same post-harvesting
processing techniques to minimize any
processing defects that may affect optimum
flavour development. Wet beans were only
collected from fully matured, undamaged and
healthy pods. For each micro-fermentation,
samples of about 3 kg of the fresh beans were
collected and placed inside a labelled 24 x 80
cm nylon bag of 10 mm mesh and 0.7 mm
thread diameter. The micro-fermented samples
were buried 30 cm from the top of a sweatbox
of dimension 60 cm x 60 cm x 60 cm (width,
length and depth respectively) filled with 200-
250 kg wet beans of mixed hybrids. The top of
the sweat box was covered with banana leaves
and jute sacks to keep the beans moist
throughout the duration of fermentation.
Turning of the buried test samples was
achieved by uncovering, holding the ends of
the nylon bags and shaking the bag to mix the
beans inside, and after turning the bags were
reburied at approximate the same depth.
Fermentations were done for 168 hrs. After
fermentation, the beans were removed from
the nylon bags, labelled, spread out on the
drying floor of the solar dryer and dried
between 120 to 144 hrs depending on weather
conditions.
Secondary processing
The drying of the beans was completed
in an oven (Contherm, New Zealand) at 115 o
C for 15 min to reduce moisture content to less
than 7 percent before the beans were emptied
into a quartering devise, and in this process
any debris that came with the beans was
removed. The bean shells were manually
removed and the nibs were collected and
stored in sealed food-grade plastic containers.
The nibs were ground for 90 min into cocoa
liquor using a rotating mortar and pestle.
During blending in the mill, the motor part of
the unit (bottom half) was changed
periodically to prevent overheating. After
milling and blending, the cocoa liquor was
transferred from the mill to 120 mL capacity
sterile specimen containers and stored at - 8 to
– 20 0 C prior to organoleptic evaluation.
Organoleptic evaluation
The organoleptic evaluation was
conducted following the procedures described
by Sukha (2001) and the American Society for
Testing of Materials (ASTM), 1992.
Data analysis
Individual flavour attribute scores from
the profiling forms were entered into a data
template in Microsoft Excel. Variance
components were investigated using
Restriction Maximum Likelihood (REML)
variance estimation with Genset 4.24 DE.
Analysis of variance (ANOVA) was calculated
using MINITAB Release 14 to determine the
significance of treatment effects and
interactions using pooled data for all flavour
attributes.
RESULTS AND DISCUSSION
The flavour profiles in Figures 1 and 2
reveal that local clone KA 73-14/1 showed a
marked floral note in the 2003 crop year which
was not observed in 2004. Data from these two
local clones (KA2-106 & KA 73-14/1) were
also analyzed by REML variance estimation of
crop and year effects which showed a
significant difference in floral (P ≤ 0.001),
cocoa (P ≤ 0.01) and acid (P ≤ 0.05) flavour
between years. ANOVA of flavour attributes
indicates significant differences between
clones within the two samples (data sets with
or without Ghana) for each respective crop
year.
The ANOVA of flavour assessment

73
Journal of South Pacific Agriculture, Volume 15: Nos. 1 & 2, 2011
Effect of environment on cocoa flavor - Noel Y. Kuman
Figure 1. Average flavour profiles for KA local clones 2003 crop year compared to Ghana reference
sample.
Figure 2. Average flavour profiles for KA and NAB local clones in 2004 crop year compared to Ghana
reference sample.
shown in Table 1 indicates that there were no
significant differences between the flavours of
local clones harvested in 2003. However, the
same clones harvested in the 2004 crop year
show significant differences between them in
acid, bitter and floral flavour. The 2003 clones
also show significant differences in all
flavours except astringency and nutty flavour
when compared to the Ghana reference
sample. For the 2004 crop year, the local
clones were dominated by strong fruity and
acid flavour notes, quite different from the
strong cocoa flavour in the Ghana reference.
CONCLUSION
The results from this study indicate that
there were no significant differences in
flavours between local clones harvested in one
crop year (2003) but there were significant
difference in the following year (2004). The
same applies to the flavour of local clones
when compared to the Ghana reference. These
results provide strong evidence of marked
environmental effects on flavour in addition to
genotypic effects, given that all samples were
subjected to the same post-harvesting
processing techniques. Aspects of the
environment that could affect flavour include
climatic and edaphic influences of the growing
environment. Similar results were obtained by
Wood and Lass (1985) and Enriquez (1993).
However, Figueira et al. (1997) showed that

74
Journal of South Pacific Agriculture, Volume 15: Nos. 1 & 2, 2011
Effect of environment on cocoa flavor - Noel Y. Kuman
Table 1. ANOVA of local clones with and without comparison to the Ghana reference.
*P≤ 0.05 **P≤ 0.01 *** P≤ 0.001 Not Significant (NS) ≥ 0.05 - Anova not possible due to 0 scores
Flavour attributes Local KA clones (2003 crop year) Local KA clones (2004 crop year)
Without Ghana With Ghana Without Ghana With Ghana
Cocoa NS *** NS ***
Acidity NS *** * ***
Astringency NS NS NS NS
Bitterness NS NS * **
Fruity NS *** NS ***
Floral NS * * NS
Nutty NS NS NS NS
Raw/beany/green NS NS NS *
Other NS NS - -
beans harvested from the same genotype at
two different locations produced similar
flavour. This could be the result of genotypes
showing similar responses under the different
environmental condition or the two locations
may have similar climatic and edaphic
conditions influencing the flavour. Flavour
assessment conducted in different countries
provides strong evidence that each country
produces unique fine flavour cocoa due to the
combination of genotype and local
environment conditions. There is a need to
develop well-buffered genotypes that can
adapt to transient environmental fluctuations
and at the same time produce consistent
flavour attributes.
References
AMERICAN SOCIETY FOR TESTING OF MATERIALS (ASTM). 1992. The Flavour Profile
and Quantitative Descriptive Analysis. In: Robert H. (Eds.) ASTM Manuel on Descriptive
Analysis and Testing for Sensory Evaluation. ASTM: Philadelphia, USA, pp. 1-21.
BRAMEL-COX, P. J. 1996. Breeding for Reliability of Performance across Unpredictable
Environments. In: Manjit, Kang, Huge G., Gauch, Jr (Eds.), ‗Genotype-by-environment
CHONG, C. G., SIDHU, M. 1991. Performance of PBC genotype in Peninsular Malaysia and
Sabah. In: Proceedings of the International Cocoa Conference Challenge in the 1990s, 25-
28 Sept, 1991. Kuala Lumpur, Malaysia.
CLAPPERTON, J. F., YOW, S. T. K., CHAN, J., LIM, D. H. K., LOCKWOOD, G.,
ROMANCZYK, L. & HAMMERSTON, J. F. 1991. The effect of cocoa genotype on
flavour. In: Proceeding of the International Cocoa Conference, Challenge in the 1990s, 25-
28 Sept. 1991. Kuala Lumpur, Malaysia.
CLAPPERTON, J. F. 1993. Assessment of cocoa flavour and fat content. In: Proceedings of
International Workshop on Conservation, Characteristic and Utilisation of cocoa genetics
Resource in the 21st Century. Sept 1992. Cocoa Research Unit, University of the West
Indies.
CLAPPERTON, J. F. 1994. A review of research to identify the origin of cocoa flavour
characteristics. Cocoa Growers Bulletins, 48: 7-16.
CLAPPERTON, J. F., LOCKWOOD, G., YOW, S. T. K. & LIM, D. H. K. 1994. Effects of
planting materials on flavour. Cocoa Growers’ Bulletin, 48: 47- 59.
CLAPPERTON, J. F. 1996. Prospects in the genetics of cocoa flavour. In: 12th Proceedings of the
International Cocoa Research Conference, Nov.1996. Bahia, Brasil.

75
Journal of South Pacific Agriculture, Volume 15: Nos. 1 & 2, 2011
Effect of environment on cocoa flavor - Noel Y. Kuman
ENRIQUEZ, G. A. 1993. Characteristic of cacoa ―Nacional‖ of Ecuador. In: Proceedings of
International Workshop on Conservation, Characterisation and Utilisation of cocoa Genetic
Resource in the 21st Century, Sept. 1992. Cocoa Research Unit, University of the West
Indies.
FIGUEIRA, A., LAMBERT, S., CARPENTER, D., PIRES, J. L., CASCARDO, J. C. M. &
ROMANCZYK, L. 1997. The similarity of cocoa flavour of fermented seeds from
fingerprinted genotypes of Theobroma Cacao L. from Brazil and Malaysia. Tropical
Agriculture, [Online] 20 Aug., 74, (2), 132-139. Available at: http://
gateway1.ovid.com:80/0vidweb.cgi[Accessed 20th, Aug. 2000]
KUMAN, Y. N. 2005. Assessment of cocoa genotype to improve bean quality attributes. Journal
of South Pacific Agriculture Science, 12 (1& 2): 11-15.
LAMBERT, S. V., DIAS, J. C., FIGUEIRA, A., NETO, E. F., NASCIMENTO, C. S., &
CARDOSO, R. D. 1996. In: 12th Proceedings of the International Cocoa Research
Conference, Nov.1996. Bahia, Brasil.
PIRES, J. L., CASCARDO, J. C. M., LAMBERT, S. V. & FIGUEIRA, A. 1998. Increasing cocoa
butter yield through genetic improvement of the Theobroma cacao L.-seed fat content
variability, inheritance and association with seed yield. Euphytica, 103 (1): 115-121.
SUKHA, D. A. 2001. Strategy for the organoleptic assessment of cocoa sample. In: Proceeding
initial workshop on project to establish the physical, chemical and organoleptic parameters
to establish the difference between fine and bulk cocoa. 31st Jan.-2 Feb. 2001. Macoya,
Trinidad.
TUCCI, M. L. S., SAES, L. A., FIGUEIRA, A. & PEREIRA, N. A. M. 1996. In: 12th Proceeding
of the International Cocoa Research Conference, Nov. 1996. Bahia, Brasil.
WEBER, W. E., WRICKLE, G. & WESTERMANN, T. 1996. Selection of Genotype and
Prediction of Performance by Analyzing Genotype by Environment Interaction. In: Manjit,
S. Kang & Huge G. G. Jr (Eds.), Genotype by Environment Interaction. CRC Press, N.Y.
WOOD, G. A. R. 1975. Cocoa. 3 rd edition. Tropical Agriculture Series, Longman Group Limited,
London.
WOOD, G. A. R. & LASS, R. A. 1985. Cocoa. 4th edition. Tropical Agriculture Series, Longman
Group Limited, London.

76
Comparative study of mutant and normal segregant seedlings of cocoa
(Theobroma cacao L.)
Eremas Tade1, Doug A. George2, Richard R. Williams2 and Peter Bapiwai1
ABSTRACT
A mutant cocoa genotype, MJ 12-226, with abnormal growth characteristics was identified at the
Cocoa and Coconut Institute of PNG. The comparative study of mutant and normal cocoa
seedlings revealed distinct vegetative differences between the two genotypes at the nursery stage.
The largest effects of the mutant genotype are on stem elongation, short internodes, multiple
stems, root growth and leaf growth. It was initially hypothesized that the dwarf cocoa mutant
genotype was probably deficient with gibberellic and auxin, however, chemical analysis clearly
showed that endogenous GA1 and IAA were not limiting.
Key words: Cocoa, mutant, genotype, SCA 12, NA 149, IAA, GA1.
INTRODUCTION
The dwarf mutant, MJ 12-226, with
abnormal growth characteristics was identified
at the Cocoa Coconut Institute of PNG. The
mutant, found among progenies of the cross
SCA 12 x NA 149, was characterized by short
stature, small and narrow leaves, a small root
system and multiple stems with strong
branching habit (Efron et al., 2002, 2003a,
2003b). The parents SCA 12 originated from
Peru and NA 149 from Ecuador (Pound,
1948). After germination, all the seedlings
looked the same, but the phenotypes of mutant
and the normal phenotypes were clearly
noticeable after two months. Most of the
mutant seedlings produced multiple stems that
developed into multi-stemmed short and
compact trees. Orthotropic buds from the
mutant genotype were bud grafted onto normal
rootstock to develop the clone MJ12-226. All
the grafted seedlings showed similar short
compact dense growth with high branching
habit and small narrow leaves. The pods and
seeds were also of normal size and number of
seeds per pod was the same as normal cocoa
with an average of 37 seeds per pod.
This study evaluates the morphological
characteristics of the cocoa dwarf mutant in
comparison with normal segregant seedlings.
The objectives are; (1) to verify that the
growth characteristics of the mutant dwarf are
different from normal segregant seedlings; (2)
to measure endogenous levels of gibberellin
and auxin in mutant and normal cocoa
seedlings.
MATERIALS AND METHODS
Glasshouse: The experiments were
conducted in a glasshouse of the School of
Land, Crop and Food Sciences at the
University of Queensland, Gatton Campus.
The experiments were carried out between
October 2005 and March 2006. Temperatures
in the glasshouse ranged from 20 °C at night to
a maximum 40 °C during the day in summer
and 14 °C to 26 °C in winter.
Plant Materials: Seeds were obtained
from open pollinated MJ 12-226 mutant cocoa
clones grown at CCI. Seeds were harvested
and soaked in a solution of 10 g of metalaxyl
fungicide (Ridomil Plus 72) in 1 litre of water.
After importation to Australia, the seeds were
pre-germinated for 5 days by wrapping them
in paper towels soaked in water, and sprinkled
with water at 2 days intervals to keep them
moist. The germinated seeds were planted in
pots with potting mix and placed in the
glasshouse. The potting media consisted of
40% pine bark, 40% hardwood saw dust and
20% sand with Osmocote slow release fertili- 1Cocoa Coconut Institute of PNG, P.O. Box 1846, Rabaul, Papua New Guinea. 2The University of Queensland, School of Land, Crop and Food Sciences, Gatton Campus, Gatton, QLD 4343, Australia.
Corresponding address: [email protected]
Comparison of mutant and normal cocoa seedlings - E. Tade, D. George, R. Williams & P. Bapiwai
Journal of South Pacific Agriculture, Volume 15: Nos. 1 & 2, 2011

77
Journal of South Pacific Agriculture, Volume 15: Nos. 1 & 2, 2011
Comparison of mutant and normal cocoa seedlings - E. Tade, D. George, R. Williams & P. Bapiwai
zer (4kg/cm3) added to the potting mix giving
a pH of 5.5-6.0. The pots (180 mm) were filled
with 1.5 kg of potting media. The seeds
emerged from the pots seven days after
sowing. The seedlings segregated into mutant
and normal phenotypes six to eight weeks after
sowing.
Treatments: At eight weeks after
germination, seedlings were sorted into mutant
and normal phenotypes and selected for this
study with ten replications (10 plants each) in
a completely randomized design. Individual
plants were replications.
Vegetative growth, seedling height,
leaf width and length, leaf petiole and stem
were measured with a plastic ruler (30 cm) and
stem diameter was measured with digimatic
caliper (Model No. CD-6C, Mitutoyo
Corporation, Japan) starting at one month after
sowing. Leaf number (number of nodes)
counts commenced from the first node.
Extraction of IAA and GA: Gibberellin
and auxin levels were measured in mutant and
normal cocoa seedlings. Gas chromatography-
mass spectrometry-selected ion monitoring GC
-MC-SIM) with deuterated internal standards
was used to quantify GA1 and IAA level in
apical portions. Shoot tips (5-10 mm) excised
immediately above the uppermost fully
expanded leaf from four month old mutant and
normal cocoa seedlings were weighed and
wrapped in aluminum foil and then
immediately placed in liquid nitrogen for ten
minutes. The samples were then freeze dried
for 48 hours and then packed in padded bag
(Australia Post) and sent to Dr John Ross at
the University of Tasmania for analysis.
Extraction and quantification of GA1 and free
IAA was performed as described previously
(Reid et al., 1992; Ross, 1998, 2002, 2006;
Ross et al., 1995; O‘Neill & Ross, 2002).
Statistical analysis: Data were analysed
with GENSTAT Release 7.2 – Discovery
Edition 3 statistical analysis software (Lawes
Agricultural Trust, Rothamsted Experimental
Station, UK). Data from this experiment was
analysed by analysis of variance (ANOVA)
using a completely randomized design.
RESULTS
Seedlings emerged seven days after
sowing and percentage germination was 98%
two weeks after sowing. Two months after
sowing the seedlings segregated to 111
seedlings mutants and 90 seedlings normal out
of the 201 seedlings that were sown in the
glasshouse giving a 1:1 ratio (Chi-square =
0.52; P = 0.25 - 0.50).
The mutant phenotype was visibly
distinct (about 50% shorter) from the normal
seedlings. At first, after germination, all the
seedlings looked similar in appearance (Figure
1). The phenotypes of the mutant and normal
phenotypes could only be seen after two
months; mutant plants were shorter with
smaller leaves (Figure 2). Most of the mutant
seedlings produced multiple lateral shoots on
the cotyledon node (Figure 3A) about six to
seven weeks after sowing. The most obvious
features of the mutant phenotype included
greatly reduced plant height, thin stems, tiny
leaves, a smaller root system, development of
multiple stems from the basal nodes, resulting
in a shorter compact growth habit (Figures 4
and 5). These seedlings would later develop
into multi-stemmed short and compact trees
with highly branching habit and smaller root
systems (Figure 5).
The mutant genotype affected a wide
range of vegetative traits. Changes in some
vegetative traits were very large indeed. The
height (P < 0.01) of the mutant is about half
that of the normal seedling (Figure 6A). Stem
diameter (Figure 6B) was significantly (P <
0.05) reduced in the mutant compared to the
normal genotype seedling (Figure 6B).
However, the number of leaves was not
significantly altered (Figure 6C). Measurement
of seedling height, stem diameter, leaf length
and leaf width of mutant and normal seedlings
from one month to five months after planting
showed some marked differences between the
two phenotypes (Figures 6A and 6B, Figures
7A, 7B and 7C). The leaf length and leaf width
was also greatly reduced (P < 0.01) (Figures
7A and 7B). Root morphology (Figure 7C)
obtained from 3 month old plants of the
mutant and normal genotypes indicated that
the mutant had significantly reduced mean tap
root length (less than 70% of the normal
genotype, P < 0.01).
Chemical analysis of endogenous GA1
and IAA revealed that the levels were almost
similar for mutant and normal genotypes in 4

78
Journal of South Pacific Agriculture, Volume 15: Nos. 1 & 2, 2011
Comparison of mutant and normal cocoa seedlings - E. Tade, D. George, R. Williams & P. Bapiwai
months old seedlings (Table 1), which show
that the natural auxin IAA and gibberellic acid
(GA1) are not limiting in the mutant genotype.
This suggests an abnormal transport of
gibberellin through the mutant plants that may
have resulted in the dwarfing characteristics.
Figure 4. Growth habit differences between mutant (left) and normal (right) cocoa seedlings
at four months.
Mutant Normal Figure 3. Lateral shoots developing on first node (cotyledon node) of mutant stem (A) and buds remained
completely dormant on normal (B) cocoa seedlings 7
weeks after sowing. (Note the cotyledons have dried and
fallen off from the first nodes of both genotypes.)
A B
Mutant Mutant
Normal Normal
Figure 5. Root systems (left) and leaf characteristics (right) of 4 months old mutant and normal cocoa seedlings. (The root system and leaf size of the
mutant genotype are much reduced compared with the normal genotype.)
Figure 1. Mutant and normal seedlings look the same at one month after sowing.
Figure 2. Two months after sowing the segregated seedlings are distinguishable in the glasshouse
nursery. (The main features noticeable in
mutants are smaller leaves and development of
multiple shoots on the first node.)
Mutant
Normal

79
Journal of South Pacific Agriculture, Volume 15: Nos. 1 & 2, 2011
Comparison of mutant and normal cocoa seedlings - E. Tade, D. George, R. Williams & P. Bapiwai
Figure 6. Seedling height, number of leaves and leaf length of mutant compared with the normal cocoa seedling (n = 10). The error bars are standard error of mean.
Mean number of leaves
0
4
8
12
16
20
24
28
32
1 2 3 4 5
Seedling age after planting (months)
Nu
mb
er
of
leaves/p
lan
t
Mutant
Normal
C
Mean stem diameter
0
2
4
6
8
10
12
1 2 3 4 5
Seedling age after planting (months)
Ste
m d
iam
eter
(m
m)
Mutant
Normal
B
Mean seedling height
0
10
20
30
40
50
60
1 2 3 4 5
Seedling age after planting (months)
Seed
lin
g h
eig
ht
(cm
)
Mutant
Normal
A

80
Journal of South Pacific Agriculture, Volume 15: Nos. 1 & 2, 2011
Comparison of mutant and normal cocoa seedlings - E. Tade, D. George, R. Williams & P. Bapiwai
Figure 7. Seedling leaf width, stem diameter and root length of mutant compared with the normal cocoa seedling (n = 10). The error bars are standard error of mean.
Mean leaf w idth
0
2
4
6
8
10
12
1 2 3 4 5
Seedling age after planting (months)
Leaf
wid
th (
cm
)
Mutant
Normal
A
Mean leaf length
0
4
8
12
16
20
24
28
32
1 2 3 4 5
Seedling age after planting (months)
Leaf
len
gth
(cm
)
Mutant
Normal
B
Mean root length
0
5
10
15
20
25
30
35
40
Mutant Normal
Genotypes
Ro
ot
len
gth
(cm
)
C

81
Journal of South Pacific Agriculture, Volume 15: Nos. 1 & 2, 2011
Comparison of mutant and normal cocoa seedlings - E. Tade, D. George, R. Williams & P. Bapiwai
DISCUSSION
It has been reported that the most
important and consistent morphological trait
contributing to expression of dwarfism in four
woody plants studied was the reduction of
final internode length along the entire shoot
axis (Brown et al., 1994). They discovered that
the reduction in final internode was attributed
to inhibition of mitotic activity in developing
internodes which resulted in decreased final
cell number, and not cell length. In contrast,
reduction in internode and stem length of bsh
pea mutant was due primarily to reduced cell
length (Symons et al., 1999).
The mutant cocoa has several notable
features. The mutant genotype has pleiotropic
effects on a wide range of vegetative
characteristics including shoot elongation, leaf
growth, stem diameter, root morphology, and
branching. Similarly, the dominant pea mutant
bsh (bushy) branches profusely from the basal
nodes unlike the rms mutants; it has a strongly
pleiotropic phenotype with short thin stems,
tiny leaves, and reduced lateral root
development (Symons et al., 1999). In contrast
to pea mutant rms1, rms2, rms3, rms4, rms5,
the bsh mutant is deficient in auxin and has
elevated levels of cytokinin (Symons, 2000).
Branching at the vegetative node of
rms mutants of pea occurs during several
stages of plant ontogeny and in the presence of
a vigorous shoot tip (Beveridge et al., 2003).
In pea, the branching phenotype is also
influenced by gibberellin status. Mutant plants
deficient in gibberellin, such as the widely
used le dwarf cultivars, have a greater
tendency to produce lateral shoots from the
basal nodes than tall wild type counterparts
(Floyd & Murfet, 1986; Murfet & Reid, 1993;
Murfet & Symons, 2000). Mutants in other
species have been essential in identifying
mechanisms of shoot branching in intact
plants. Arabidopsis (max), petunia (Petunia
hybrida; dad), and rice (Oryza sativa; e.g.
Dwarf3) have been identified as showing
increased shoot branching in intact plants (e.g.
Foo et al., 2005; Snowden et al., 2005;
Bennett et al., 2006). Considering the growth
habit of the mutant cocoa, it is assumed that
the mutation affects the quantity and/or the
balance of plant growth hormones, or both.
The mutant cocoa has similarities with
three pea mutants (le, bsh and rms6) with
genetic alterations that modify apical
dominance. The pea mutants and the cocoa
mutant have several features in common:
multiple branching from the basal nodes,
reduction in internode length, and reduced
apical dominance. It can be noted also that,
initially, after germination, all the seedlings
looked the same and mutant segregants were
not visible until about two months after
seedling emergence. These observations
indicate that mutant cocoa seeds have the key
growth substances necessary to support normal
germination and the effect of the mutation is
only expressed in the shoot as supplies of key
substances from the cotyledons decrease. In
this experiment it was observed that the
cotyledons start to dry out and fall off from the
seedlings between weeks 7 and 8 after
emergence at which point the segregation to
mutant and normal genotypes were also clearly
distinguishable. In pea, the effect of bushy
mutation is visually apparent about 6-8 days
after seedling emergence which was also
suggested to be related to diminished supply of
growth hormones as cotyledons die (Symons
et al., 1999). Similarly, early dwarf in apples
became apparent four weeks after germination
and sturdy dwarf was distinguishable at eight
weeks after emergence (Alston, 1976). In addition, flower size, pod size, seed
size and number of seeds per pod (average of
Table 1. Endogenous levels of GA1 and IAA in four months old seedlings measured from the shoot tips of mutant and normal cocoa seedlings. Apical portions consisted of all tissue above the second uppermost
fully expanded leaf.
GA1 IAA Genotype ng/gram fresh weight ng/gram fresh weight
Mutant 1.4 15.5
Normal 1.2 14.2

82
Journal of South Pacific Agriculture, Volume 15: Nos. 1 & 2, 2011
Comparison of mutant and normal cocoa seedlings - E. Tade, D. George, R. Williams & P. Bapiwai
37 seeds) of mutant cocoa was similar to
normal cocoa (Efron et al., 2002). This
suggests that the mutation had little or no
direct effect on reproductive traits. Similarly,
in pea, the bsh mutant produced fertile
flowers, pods and seeds of normal size
comparable to the wild type phenotype
(Symons et al., 1999). It is possible that the
essential plant growth substances affecting the
mutant phenotypes are not involved in pod and
seed development but it is possible that there
are some genetic interruptions of hormone
biosynthesis. The physical appearance of the mutant
cocoa suggests disturbance in plant hormones,
such as auxin and gibberellin. The effects can
be seen as reduced apical dominance that leads
to production of multiple basal lateral shoots
(auxin effect) and reduction in stature (GA
effect). The mutant phenotype probably
combines traits associated with auxin,
cytokinin overexpression, and GA limitation.
Undoubtedly, it is necessary that further
experimentation on the dwarf mutant will
involve an analysis of plant hormone
concentrations.
It was initially hypothesized that the
proliferation of lateral branches on the basal
node in the mutant genotype was due to weak
apical dominance which is related to auxin
deficiency, and it was postulated that the dwarf
stature was probably due to GA deficiency.
However, the results of this study (Table 1)
from chemical analysis of shoot tips of four
month old mutant and normal seedlings
revealed that the content of endogenous levels
of GA1 and IAA were almost similar in both
genotypes. This could be explained in several
possible ways. Firstly, the analysis only
showed results for endogenous GA1, however,
other GAs were not tested and should also be
considered for examination in the future to
confirm these findings. Secondly, the
methodology used to assess GA1 and IAA
levels was developed for peas (a herbaceous
plant) and may not be applicable to woody
species such as cocoa; this therefore may cast
some doubt on the results. If GA and IAA are
not limiting in the mutant genotype, then what
causes the mutant to develop shoots on the
basal node? It is postulated that the promotion
of shoots on the basal node of the mutant
genotype was probably related to cytokinin/
auxin ratio.
CONCLUSIONS
The comparative study of mutant and
normal segregant cocoa seedlings revealed
distinct vegetative differences between the two
genotypes at the nursery stage. The results
show that the largest effects of the mutant
genotype are on stem elongation, short
internodes, multiple stems, root growth and
leaf growth. These characteristics of the
mutant indicate the possible involvement of
auxin and/or gibberellin. The loss of apical
dominance suggests the possible involvement
of auxin or cytokinin, and the dwarf stature of
the mutant implies that gibberellin is involved.
Further studies will include investigation of
the feasibility of using a dwarf mutant as
rootstock for hybrid cocoa clones.
The dwarf cocoa mutant genotype was
probably limited in other forms of GAs
although the analysis showed sufficient levels
of GA1 (bioactive form of GA) in the stem.
The proliferation of basal shoots on the mutant
genotype could be due to higher levels of
endogenous cytokinin. It is proposed that
future research should include analysis of
endogenous cytokinin and other forms of GA
in both mutant and normal cocoa seedlings to
verify these findings.
Acknowledgements
This work is part of a PhD thesis submitted by the first author to The University of Queensland,
Australia. We thank the Australian Government, through AusAid for funding this work. I am also
grateful to Dr. John Ross and Professor Bruce Reid, University of Tasmania for analysis of
endogenous plant hormones in mutant and normal cocoa seedlings. This paper is published with
the permission of the Chief Executive Officer, Cocoa Coconut Institute of PNG.
References
ALSTON, F. H. 1976. Dwarfing and lethality in apple. Euphytica, 25:505-514.

83
Journal of South Pacific Agriculture, Volume 15: Nos. 1 & 2, 2011
Comparison of mutant and normal cocoa seedlings - E. Tade, D. George, R. Williams & P. Bapiwai
BENNETT, T., SIEBERER, T., WILLET, B., BOOKER, J., LUSCHNIG, C. & LEYSER, O.
2006. The Arabidopsis MAX pathway controls shoot branching by regulating auxin
transport. Current Opinion in Plant Biology, 9:35-40.
BEVERIDGE, C. A., WELLER, J. L., SINGER, S. R. & HOFER, J. M. I. 2003. Axillary meristem
development. Budding relationships between networks controlling flowering, branching,
and photoperiod responsiveness. Plant Physiology, 131:927-934.
BROWN, C. L., SOMMER, H. E. & WETZSTEIN, H. 1994. Morphological and histological
differences in the development of dwarf mutants of sexual and somatic origin in diverse
woody taxa. Trees, 9:61-66.
EFRON, Y., NIDESON, D., EPAINA, P. & FAURE, M. 2002. A cacao growth mutant with
dwarfing effect as rootstock. INGENIC Newsletter, 7:16-19.
EFRON, Y., TADE, E. & EPAINA, P. 2003a. Accelerated rate of bud sprouting on the cacao
growth mutant rootstock. INGENIC Newsletter, 8:8-12.
EFRON, Y., NIDESON, D., EPAINA, P. & TADE, E. 2003b. Inheritance of a cacao growth
mutant, MJ12-226: A possible interaction between nuclear and cytoplasmic genes.
INGENIC Newsletter, 8:12-15.
FLOYD, R. S. & MURFET, I. C. 1986. Branching in Pisum: Effect of the flowering and length
genes. Pisum Newsletter, 18:12-15.
FOO, E., BUILLIER, E., GOUSSOT, M., FOUCHER, F., RAMEAU, C. & BEVERIDGE, C. A.
2005. The branching gene RAMOSUS1 mediates interactions among two novel signals and
auxin in pea. Plant Cell, 17:464-474.
MURFET, I. C. & REID, J. B. 1993. Developmental mutants. In: Casey, R. & Davies, D. R. (eds.),
Peas – Genetics, Molecular Biology and Biotechnology. CAB International, Wallingford,
UK. pp.165-216.
MURFET, I. C. & SYMONS, G. M. 2000. Double mutant rms2 rms5 expresses a transgressive,
profuse branching phenotype. Pisum Genetics, 32:33-38.
O'NEILL, D. P. & ROSS, J. J. 2002. Auxin Regulation of the Gibberellin Pathway in Pea. Plant
Physiology, 130:1974-1982.
POUND, F. J. 1948. Studies on the fruitfulness in cacao. II. First Annual Report on Cacao
Research (Trinidad):26-28.
REID, J. B., ROSS, J. J. & SWAIN, S. M. 1992. Internode length in Pisum. A new slender mutant
with elevated levels of C19 gibberellins. Planta, 188:462-467.
ROSS, J. J. 1998. Effects of auxin transport inhibitors on gibberellins in pea. Journal of Plant
Growth Regulation, 17:141-146.
ROSS, J. J. 2002. Gibberellin biosynthesis in pea: From Mendel to molecular physiology. Plant
Physiology Online: Chapter 20; Essay 20.1. Available at: http://4e.plantphys.net. Accessed
12 December 2007.
ROSS, J. J. 2006. Gibberellin biosynthesis in pea: From Mendel to molecular physiology. Plant
Physiology. Available at: http://4e.plantphys.net. Accessed 16 January 2008.
ROSS, J. J., REID, J. B., SWAIN, S. M., HASAN, O., POOLE, A. T., HEDDEN, P. & WILLIS,
C. L. 1995. Genetic regulation of gibberellin deactivation in Pisum. Plant Journal, 7:513-
523.
SNOWDEN, K. C., SIMKIN, A. J., JANSSEN, B. J., TEMPLETON, K. R., LOUCAS, H. L.,
SIMONS, J. L., KARUNAIRETNAM, S., GLEAVE, A. P., CLARKE, D. G. & KLEE, H.
J. 2005. The decreased apical dominance1/Petunia hybrida CAROTENOID CLEAVAGE
DIOXYGENASE8 gene affects branch production and plays a role in leaf scenescence,
root growth, and flower development. Plant Cell, 17:746-759.
SYMONS, G. M. 2000. Mutational analysis of auxin physiology in Pisum sativum. PhD Thesis.

84
Journal of South Pacific Agriculture, Volume 15: Nos. 1 & 2, 2011
Comparison of mutant and normal cocoa seedlings - E. Tade, D. George, R. Williams & P. Bapiwai
University of Tasmania, Hobart.
SYMONS, G. M., MURFET, I. C., ROSS, J. J., SHERRIFF, L. J. & WARKENTIN, T. D. 1999.
bushy, a dominant pea mutant characterised by short, thin stems, tiny leaves and a major
reduction in apical dominance. Physiologia Plantarum, 107:346-352.
SYMONS, G. M., ROSS, J. J & MURFET, I. C. 2002. The bushy mutant is IAA-deficient. Plant
Physiology, 116:389-397.

85
Climate change and food security – some conceptual considerations
Eberhard H. Weber1
ABSTRACT
Research on climate change and the impact on food security needs to incorporate changes in
perspectives and priorities that came up in the past 30 years with emerging new paradigms in the
field of food security research The challenges ahead, when looking at climate change and its
impact on food security for the societies of Pacific Islands, is to embrace more holistic community
-based approaches that take into account cultural, social, environmental and economic realities of
small island societies that continue to depend on a mix of subsistence and commercial economy. It
is particularly necessary for disciplines that have played a major role in food security discourses in
the past (and need and will do this also in future) to embrace the paradigm changes of the past 30
years. Sadly, many science disciplines are not fully aware of how issues of food security are
discussed outside science, and what social scientists consider crucial when assessing food security.
Under such conditions interdisciplinary research efforts remain often unsatisfactory, providing few
or no solutions.
Key words: Climate Change, Food Security, Livelihood Security, Pacific Islands.
INTRODUCTION
Today there is little doubt that the
earth‘s climate is changing. The IPCC in its
latest reports is rather clear that climate change
is not something that will become reality for
future generations, but we are in the middle of
it (IPCC, 2007). Many parts of the world have
to prepare for a more risky future where
climate and other environmental factors are
distinctively different from today. The process
of transition, when people adjust/adapt to these
new situations is most challenging. Among
many other aspects climate and environmental
change need to also urgently look at issues of
food security.
Until not long ago matters relating to
climate change have been mainly seen from a
perspective of mitigation: what can be done to
prevent climate change? Today these questions
remain, but new ones have come up; they are
starting to dominate discussions, research and
policies. A distinct paradigmatic shift
happened once the scientific community
realized that climate change is real and
mitigation, even if successful today, would not
be able to prevent serious changes for at least
another generation, possibly even much
longer, or never. The major questions today
are therefore: how can societies adjust, adapt
or at least cope with the impacts arising from
climate change?
With adaptation taking greater
importance close cooperation between pure
sciences and social sciences becomes more
crucial than ever before. When assessment of
the extent and nature of climate change and
mitigation stood centre stage in scientific
research, discussions were largely dominated
by science disciplines. This has changed with
more holistic, interdisciplinary, and increasing
-ly community or grass-roots-based approa-
ches becoming the order of the day. The goal
is to integrate pure and applied science with
social sciences to help making societies more
resilient.
Providing a conceptual frame for
research on climate change and food security
should be the obvious first step to bridge this
gap. This paper constitutes an effort to initiate
discussion on such conceptual framework for
scientists, both pure and social, to better
understand how a more holistic approach can
help Pacific island nations and communities;
communities, arguably among the most vulne-
Journal of South Pacific Agriculture, Volume 15: Nos. 1 & 2, 2011
Climate change and food security – Eberhard Weber
1The University of the South Pacific, School of Geography, Earth Science and Environment, Laucala Campus, Suva. Phone: ++679
-32-32222. Corresponding address: [email protected]

86
Journal of South Pacific Agriculture, Volume 15: Nos. 1 & 2, 2011
Climate change and food security – Eberhard Weber
rable in the world to the impacts of climate
change.
Food security as access to food
Food production is affected by climate
change; no doubt about this and we need to
continue looking at how this affects Pacific
Island countries. People cannot eat food that
has not been produced. However equally
important is that food security is also much
about access to food: people cannot eat the
food that is there, when they don‘t have money
to buy it. People cannot produce own food
(and therefore don‘t need to buy it) when they
don‘t have access to resources that are
indispensable for food production: land,
forests, fishing grounds. This truism is central
for food security in Pacific Islands, where
access to resources often is managed through
traditional systems that come under severe
pressure through processes of modernization.
Food security is also about food prices and the
income of people, about the factors that
enable/disable people to buy whatever they
need for a healthy life. In many instances food
insecurity is not a result of too little food being
produced. We know even of situations, where
people starve right next to supermarkets with
all sorts of food available to buy. In the Pacific
Islands there are many countries that import
huge parts of their food requirements. They be
come more and more highly dependent on
what is happening elsewhere, how commodity
prices are developing. Hunger in such scenario
often is the result of poverty (of countries as
well as individuals) rather than insufficient
food production (Dreze & Sen, 1991; Sen,
1981).
In his book Poverty and Famines
Amartya K. Sen challenged the paradigm that
famine is mainly caused by insufficient food
production (Sen, 1981). His analysis of the
Bengal Famine of 1943 and famines in Africa
and Bangladesh in the 1970s concluded that it
often was not a failure of food production, but of
other factors that caused famine. Sen highlights
that many people did not have the means to buy
the food which actually was there. Sen calls this
a decline in entitlements over food, a Food
Entitlement Decline (FED), a decline of people‘s
capabilities to buy food or to produce it (for
recent discussions of the approach see: Elahi
2009, 2006; Rubin, 2009; Sohlberg, 2006; Yaro,
2004).
Entitlements over food can mean a
number of different things, such as access to
land and the ability to grow own food; or to
have sufficient financial resources to buy food,
or to get free or subsidized food through
Government programmes. Among many other
aspects in a Pacific Island context this relates
to changes in land tenure systems, privati-
zation of erstwhile common or group
resources, increasing dependencies to
imported food, and changes in dietary
preferences that devaluate traditional foods.
Also decent employment, earning enough that
people are able to satisfy their basic needs
constitutes entitlements. The same is for social
security systems, which come for support
when people, for whatever reasons, are unable
to satisfy their food and other basic needs.
From Sen‘s detailed analysis it also
became evident that hunger and starvation do
not hit all groups in a society in the same way
and to the same extent. When rice prices sky
rocketed in Bengal farmers and grain
merchants did very well. However artisans,
fishermen, landless laborers and other people
suffered who did not grow food, but had to
buy it. Their income did not increase enough
to compensate the high increase of food prices.
From this example it becomes clear that food
insecurity is often very group specific. To draft
proper policies it is necessary to identify those
groups that are in particular vulnerable to
hunger and famine. Learning from this for
Pacific Islands countries means to developed
instruments to identify the most vulnerable
sections in society and policies and measures
of how to support them.
It was Sen‘s achievement to show that
hunger has many faces, and that insufficient
food production is only one of them. Sen
directed attention to the whole food system: to
production, distribution and consumption of
food. He highlighted that hunger often has a
lot to do with prices and incomes, with
distribution of and access to food and
productive resources and people‘s position in
economic processes and the power structures
of societies.
The vulnerability of marginal people
The British social scientist Robert
Chambers (1988) came up with a concept of

87
Journal of South Pacific Agriculture, Volume 15: Nos. 1 & 2, 2011
Climate change and food security – Eberhard Weber
social vulnerability which also is suitable to
apply to food security research. According to
Chambers, vulnerability has two sides: an
external side of risk, stress and pressure
individuals and groups are exposed to; and an
internal side, which are the capabilities, the
abilities of people and groups to cope with
such external pressures (ibid, 1). Vulnerability
is much more than the economic status of
poverty. It relates to the potentiality of being
negatively affected by external events. It
covers a wide range of economic, social,
cultural and political aspects. Analysing these
help us to better understand which people are
most vulnerable and why, and ideally also
where they live.
Watts & Bohle (1993a, 1993b) took
Chamber‘s definition of vulnerability and
developed a concept to better understand
structural dimensions of vulnerability. They
highlight the adverse consequences when
people are not able to recover from events of
deprivation quickly and sufficiently. According
to them social vulnerability to food crisis has a
distinct structural dimension, which is created
over a long time and is rather stable.
Inappropriate coping mechanisms can protect
people in the short run against external stress
(see Figure 1).
In the long run however they often
increase what Watts & Bohle (1993a) call
people‘s baseline vulnerability. In many cases a
food crisis is the result of the accumulation of
negative events. A single event, a drought or a
cyclone, usually is not enough to trigger such
crisis, but when many adverse events come
together or quickly after one another then
people‘s vulnerabilities become bigger. It then
needs just a trigger, an event which in itself
might be even of relatively minor nature, to
reach a situation when the coping capacities of
people are no longer suitable to withstand
external stress. This then is when a catastrophe
strikes; this is when a natural hazard such as
cyclones becomes a disaster.
This is also when an economic crisis
with a high degree of unemployment, or
political instability and the collapse of public
and private support mechanisms affect people
to an extent that they can no more cope with
what is happening to them from outside. So,
people's baseline vulnerability or susceptibility
turns into a food crisis or famine, when
additional critical events happen that are
beyond people‘s coping capabilities to
withstand such external stress or pressures.
Such trigger events can be droughts,
earthquakes, floods, but also war, civil war and
economic crisis.
Social scientists like Sen, Chambers,
Bohle and Watts analyze the connection between
the way societies organize themselves and
Figure 1. The structural dimension of hunger. (Adopted from Watts & Bohle, 1993)

88
Journal of South Pacific Agriculture, Volume 15: Nos. 1 & 2, 2011
Climate change and food security – Eberhard Weber
vulnerability to hunger. Solutions to end hunger
by producing more food, but which do not
articulate inequality, unequal distribution of
means of production, resources, incomes, wealth
and other assets do not address all causes of
hunger.
Looking at climate change, at
insufficient food production, at natural hazards is
not enough. It is essential to analyze who are the
most vulnerable sections of society and what con
stitutes their vulnerability. It is also crucial to
have better knowledge about possible events that
can trigger a crisis. And: after the crisis often is
before the crisis. We have to realize that people
weaken through coping. They lose assets,
become impoverished, they become sickly,
social networks are destroyed through migration
and death of family members. When the acute
crisis is over people and communities are weaker
than before. This is enormously important to
realize. Their baseline vulnerability has
increased and in future it requires less to trigger
the next crisis. Here state intervention is urgently
required to rehabilitate people after a disaster
stroke in a way that they are prepared to
withstand future pressures. This also refers to
intervention that makes vulnerable people and
communities resilient and better prepared to face
the challenges of climate and environmental
change.
After Sen and Chambers, various
Sustainable Livelihood Approaches took up
similar perspectives integrating them into much
broader concepts (Bohle, 2009). Many authors
highlight the importance of different capitals
that help people to secure sustainable
livelihoods. Figure 2 presents the Sustainable
Livelihoods Framework as it had been
developed by Oxfam. Here the following
capitals are seen as crucial: natural capital
which means access to land, marine and other
natural resources and the quality change of
these resources; physical capital, mainly seen as
an asset arising from access to infrastructure,
communication and information; human capital
meaning skills, formal qualifications, health;
financial capital seen as incomes of all sorts,
savings and assets that can be converted into
money whenever need arises. Another of the
capitals that various sustainable livelihood
concepts see as crucial is social capital, the
belonging to formal and informal social
networks that provide support and security to
overcome difficult situations (Carney et al.,
1999).
In addition to these five livelihood
capitals, which most Sustainable Livelihood
approaches recommend to consider, there are
strong reasons to include legal as well as
cultural capital as own categories. Legal
capital refers to supportive structures and
processes that have legal foundations (e.g.
Human Rights, social security legislation
entitlements versus voluntary social welfare
measures) and that enable people to enforce a
claim. Cultural Capital refers to a society‘s
normative structures that strengthen solidarity
and mutual support, such as ethical principles
Figure 2. Oxfam Sustainable Livelihood Framework.

89
Journal of South Pacific Agriculture, Volume 15: Nos. 1 & 2, 2011
Climate change and food security – Eberhard Weber
that are contained in all religions. With the
event of such sustainable livelihood frame-
works the concept of food security often was
replaced by a wider, more comprehensive
perspective of livelihood security. Realizing
that food security is an important aspect of
people‘s well-being, but not the only one,
sustainable livelihood perspectives consider
food security an important outcome to achieve,
but directed attention also to other outcomes,
especially such that fit nicely into concerns
arising from climate change and disaster risk
management discourses (see Figure 2).
Such new perspectives of food and
livelihood security are complex and often very
difficult to implement, to draft research
activities or to work out recommendations and
implementation strategies. Generally,
however, such a new approach looks at
strengths, potentials and weaknesses people
and communities have and try to help com-
munities to become more resilient. Details
need to be worked out by case to case.
Resilience then provides protection against all
sorts of stress ranging from natural hazards to
human-made disturbances of lives and
livelihoods.
Earlier, when food insecurity was seen
as the result of insufficient food production or
natural hazards that destroyed crops in the
fields, it was easier to draft ―solutions‖: to
increase food production, to achieve a Green
Revolution (Baker & Jewitt, 2007; Brown
1970; Chakravarti, 1973; Frankel, 1971;
Ladejinsky, 1970; Shiva, 1992; Vasavi, 2009).
Even today modernization of agri-
culture is what people think of first when
impacts of climate change on food security are
discussed. A changing climate foremost has
impacts on agricultural production systems. At
the same time it would be many steps
backwards, if one ignores what has been
achieved in the past three decades in food and
livelihood security research: to analyze the
entire food system from production through
distribution to consumption. This has to be
done when analyzing climate change impacts
on food security.
Today we know that economic, social
and cultural access to food is equally important
than the (physical) availability of food. We
realized that not everybody in the same way and
to the same extent is vulnerable to hunger and
food insecurity and that a food crisis is the
cumulation of a number of events that increase
vulnerability step by step, sometimes over a long
time. Like mentioned above a small trigger event
can be sufficient to cause a food crisis, and even
when societies and individuals have recovered
from an acute crisis their baseline vulnerability is
usually much higher than before the crisis, i.e. it
does not need much to trigger another crisis in
future.
When looking at food security issues
related to climate change we need to reflect of
how climate change impedes on people‘s
access to food, who are the most vulnerable
groups exposed to these threats, where do
these people live, and what are the
mechanisms and processes that constitute
vulnerability. To develop long-term
perspectives it is also important to know, how
exposure to the impacts of climate change
increases people‘s baseline vulnerabilities, and
what might be potential triggers that can
cumulate in a food crisis. All this knowledge
needs to translate in efficient policies and
instruments to make people, make communities
stronger.
Only if we have such information at
hand it will become possible to make reliable
statements on the impact of climate change on
people‘s food security. A farmer in Fiji might be
able to adapt to climate change by using
improved seeds that are more suitable to
changing climate conditions. However people
living in low-lying, flood-prone squatter
settlements that are resettled to the outskirts of
cit ies gain little from agricultural
modernization. The same is true for many
societies in the Pacific Islands that depend to a
large extend on food imports. Here not own
agricultural production is what constitutes
food security, but secure supply of food and
low import prices.
Important questions are also how
societies in the Pacific can cope with extreme
weather events, with tropical storms, floods
and droughts and other hazards. In isolated and
remote places it can become a question of life
and death of how easily people can cope with
the destruction of their crops. Important
questions are also what response mechanism
communities traditionally have to cope with

90
Journal of South Pacific Agriculture, Volume 15: Nos. 1 & 2, 2011
Climate change and food security – Eberhard Weber
such hazards, and how such response systems
are altered/weakened in changing societies.
How resilient are the communities that have to
deal with climate change and what is it exactly
that constitutes resilience or that weakens
communities? To answer these and many
more questions easily take us away from the
climate change discourse to the analysis of
society, to the questions of power, distribution
of resources, participation in decision making
and many other relevant issues.
Who goes hungry today and why? As highlighted above food security is
not only about food production. Especially
when looking at the level of households other
aspects become crucial. Here access to food is
in the center of interest, people‘s capabilities
to produce own food, to buy it or to get it
through other means, e.g. through state
transfers in form of subsidized food for the
needy or other social welfare measures. These
later aspects become crucial when natural
hazards strike and successful emergency relief
is an expression of a state‘s administrative,
logistical and resource capacities. On the
people‘s side their income and access to
productive resources, such as agricultural land,
pastures, fishing grounds and forests, is of
major importance for food and livelihood
security.
In 2003 the United Nations published a
typology of hunger as it exists in today‘s world
(Scherr, 2003; see also Bals et al., 2008).
According to this report more than two billion
people globally suffer from malnutrition.
Strangely enough food insecurity is mainly a
rural phenomenon. About 70 to 80 per cent of
people suffering from hunger and malnutrition
live in the regions, where food actually is
produced.
As Table 1 reveals, more than half of
the world‘s undernourished people live in pea
sant households, with insufficient access to
land. They produce less than they need for
their own needs, thus they need to buy parts of
what they eat. According to the report these
are people living in drylands and mountain
areas. One easily could add small island
locations. One also could highlight that these
people often live in parts of the world where
colonialism had resulted in wide-spread
changes in ownership of resources (mainly
agricultural land) and where as a result
meaningful sections of society lost the ability
to grown enough own food for their daily
needs. These people in many cases are
marginalized, like farmers with tiny land
holdings in South Asia. Marginalization can
also mean that land tenure is insecure, that
land titles are not clear and that peasant
farmers don‘t have access to credit which
would allow them to increase their
productivity. Living in the periphery can also
constitute marginalization. Far away from
markets, agricultural extension services, often
at the mercy of middlemen, who rake in the
bigger share of production. Such challenges
exist in particular also in island states, where
transportation is costly, unreliable and where it
takes a long time to bring (often perishable)
goods to the market.
For most of these marginalized peasant
families‘ vulnerability is a combination of
several factors. Often they belong to the poorest
sections of their societies; they have in
sufficient access to land, and often no access to
credit to improve their situation. Their edu
cational status is often low, and they have few
alternatives to earn a livelihood other than small
-scale agriculture and unskilled labor jobs. The
impacts of climate change add to their hardship
already and will further increase their
vulnerability and insecurity.
Next to marginal agricultural producers
there are another 22 percent of people suffer
ing from hunger and malnutrition who live in
households, which have no access to land at
all. Many of them work as agricultural workers
with inadequate income to buy the food they
need. No social security looks after their needs
when they are sick, pregnant, or become too
old to work. Modernization in agriculture over
the past few decades has destroyed many jobs,
and finding work all year round is one of the
major challenges these people are facing.
Eight percent of the world‘s hungry are
pastoralists, fishers or depend on forest
produce.
From Table 1 it becomes clear that
access to land and other natural resources is a
crucial precondition to achieve food security.
To enable people to produce at least a bigger
share of their food requirements is one of the
challenges to abolish hunger and malnutrition.

91
Journal of South Pacific Agriculture, Volume 15: Nos. 1 & 2, 2011
Climate change and food security – Eberhard Weber
Main causes of
hunger/
undernutrition
% / #
of under-
nourished
Distribution in
developing countries
Geographic ‘Hotspots’
CLASS OF FOOD-INSECURE
Low-income farm
households
Increased production
pressure on low-
productivity, high-risk
or degraded lands;
remoteness from markets; poor market
institutions
50% of
total
(400
million)
Of 633 million rural poor in
higher-risk environments;
355 million rural poor in
favoured lands (includes
farm and non-farm households)
Drylands: Sahel, Southern
Africa, South Asia, N.E.
Brazil; Mountains: Meso-
america, Andes, E.Africa,
Himalayas, SE Asia
Rural landless and
low-income non-
farm households
Inadequate income;
weak social networks;
lack access to produc
tive resources; lack of
employment
22% of
total
(176
million)
Of 437 million rural non-
agric. people, probably 150-
200 million are poor; # poor
landless farm workers hard
to calculate
Asia, Central America
Low-income urban
households
Inadequate income to
purchase food; weak
social networks, low
productivity, wages
20% of
total
(160 mln)
25% of poor are urban; urban
undernutrition seems to be
lower than rural in large
countries
China, India, Zambia
Poor herders,
fishers, forest-
people dependent
on community or
public resources
Pressure on natural re
sources; pollution; dis
ruption of resource
flows; loss of local
rights
8% of
total
(64
million)
25 million pastoralists;60
million fishers; 250 million
forest- dependent
Drylands: Africa, lowland
Asia; forests: Amazonia,
Himalayas, SE Asia
CROSS-CUTTING ABOVE GROUPS
Pregnant and
lactating women
Added dietary needs
for pregnancy and
breastfeeding,
inadequate food and
micronutrient intake
Several
hundred
million
60% of women in South
Asia; 40% in Southeast Asia
are undernourished
South Central Asia,
Southeast Asia
Newborn infants Inadequate fetal
nutrition due to
maternal malnutrition
30 million Infants born undernouri
shed; 11% of developing
country births; 21% SE Asia
South Central Asia,
Southeast Asia
Children under 5 Inadequate child care,
poor feeding
practices, infectious
disease, poor water,
low status of women
170
million
33% of under-5 children
are malnourished;
malnutrition a factor in 5
million child deaths p.a.
East Africa, South Central
Asia, West Africa,
Southeast Asia
Victims of extreme
events (natural
disasters, war &
civil conflict,
economic crises)
Disruption of food
systems, loss of
assets; aid not deliver
ed, low farm
investment
60 million 60 + million in 2002 (range
52 to 67 million, 1999-
2002); 12 million refugees,
25 million displaced people
Recent victims in Sahel,
Horn of Africa, southern
Africa
HIV/AIDS and
other adult
disabilities
Inability to produce or
access food; increased
dependency ratio;
depleted social
networks
36 million
infected
25 mln in Sub-Saharan
Africa; 150 million people
affected by sick family
member
Sub-Saharan Africa, but
moving to Asia
Micronutrient-
deficient individuals
(includes at least 1.2
billion not
otherwise undernourished)
Teenage girls and wo
men (iron); nutrient-de
ficient diets/ soils;
lack of sunlight; lack
of protein, fruit, vegetables
2 billion
people
Vitamin A: 100-140 million
children Iodine: 1.6 billion
Iron: 42% of women, 25%
men, 48% of children under
2 years
Widely distributed (Adopted from: Scherr 2003.)
Table 1. Typology of Hunger.

92
the particular challenges of SIDSs are not
considered adequately in considerations and
policy formulation by global institutions. It is
therefore crucial that these small countries put
in much emphasis to be heard and seen and not
forgotten.
Adaptive capacities in Pacific Island
countries
A crucial question for small island
societies in the Pacific is about their adaptive
capacities. While governments and scientific
institutions in developed countries have
already started to assess the impacts of climate
change and prepare for it not much has been
done in the majority of developing countries,
neither in the Pacific nor elsewhere. Although
tropical and subtropical countries are
particularly at risk to the impacts of climate
change the public and government offices take
only very slowly notice of it. Islands of tropical
regions are exposed to the impacts of climate
change in several ways. Often these islands are
very restricted in land size and even more
restricted in good agricultural lands. Sea-level
rise, coastal inundation and erosion as well as
destruction of freshwater lenses have serious
impact on food production and freshwater
supply. Already today there are very high
population densities in central locations as a
result of migration of people from outer islands
to the capitals. This is particularly true for a
number of places that are anyway not able to
sustain internal food supply and have become
increasingly dependent on food imports such as
the capital atolls of Kiribati, Tuvalu and the
Marshall Islands.
Damages happening to SIDSs from
natural hazards are often involving major areas
of these islands and require huge proportions of
government revenue and GDP in the recovery
and rehabilitation process. These SIDSs were
vulnerable to economic and environmental
shocks even before risks from a changing
climate became evident. Due to their small
economic base they are usually not in the
position to negotiate favorable economic
conditions and must accept whatever outside
powers are willing to offer to them.
In developing countries at times official
rhetoric takes reference to climate change, but
little has been done so far to really start taking
up the challenge and make people and commu-
Journal of South Pacific Agriculture, Volume 15: Nos. 1 & 2, 2011
Climate change and food security – Eberhard Weber
The poorest groups of many societies spend 70
– 90 percent of household expenses on food
alone. When people are able to produce a major
share of food for their subsistence the need for
cash income is going down drastically. Equally
important is the generation of rural employment
outside agriculture that allows people to earn
enough to buy whatever food they need for a
healthy living. Such ―ways out of agriculture‖
benefit also those farmers who remain in
production as they are able to enlarge their
holdings when others give up farming.
Traditional land tenure systems make
access to land reality for large sections of
societies in the Pacific Islands. Such systems
have come under severe pressures, partly
because of population pressures, partly through
the idea that private land is more productive
and efficient. Changes in occupational
preferences also reflect on the image the
professions of farmers and fishers have in
society. Their status is often devaluated, and in
many cases these professions also receive only
marginal incomes compared to non-farm
employment. The wish to give up agriculture is
real for many and this wish often leads to rural
– urban migration and the expansion of urban
informal sectors.
Looking at the typology of hunger in
Table 1 it is also important to note that Small
Island Developing States are not identified as
Geographic ―hotspots‖, neither in the
Caribbean nor in the Pacific Ocean. Like in
many other publications on development
issues these locations are also forgotten, when
it comes to aspects of hunger and malnutrition
although their exposure to a whole range of
challenges is rather high and therefore it is
dangerous to leave these states out, creating
the impression that supply and access to food
is secure in these islands. The impacts of
climate change will have severe consequences
on food and livelihood security in Small Island
Developing States (SIDSs) as highlighted in
Table 2.
SIDSs often are left out as they have
what people might call ―negligible‖ population
sizes: the 22 Pacific Islands states and
territories have just reached 10 million people
in 2011 and Papua New Guinea alone is
accounting for about half. Quite a number of
the bigger megacities in the world have bigger

93
Impacts Sectoral vulnerabilities Adaptive Capacity
Temperature
–All Caribbean, Indian
Ocean and North and
South Pacific small
island States will ex-
perience warming.
–Warming will be
lower than the global
average.
Precipitation
–Decrease in summer
rainfall in the
Caribbean in the
vicinity of the Greater
Antilles.
–Increase in annual
rainfall in the
equatorial Pacific and
in the northern Indian
Ocean, in the
Seychelles and the
Maldives.
–Decrease in rainfall in
the vicinity of
Mauritius, in the
Indian Ocean, and east
of French Polynesia,
in the Pacific.
Extreme Events
-Increasing intensity of
tropical cyclones,
storm surge, coral
bleaching and land
inundation.
Agriculture and food security
–Agricultural land and thus food security affected by
sea-level rise, inundation, soil salinezation, seawater
intrusion into freshwater lenses, and decline in
freshwater supply.
–All Agricultural production affected by extreme events.
–Fisheries affected by increasing sea surface tempera-
ture, rising sea level and damage from tropical
cyclones.
Water
–Water sources seriously compromised due to rising sea
level, changes in rainfall and increased evapotrans-
piration, e.g. in the Pacific, a 10% reduction in average
rainfall (by 2050) would lead to a twenty percent
reduction in the size of the freshwater lens on the
Tarawa Atoll, Kiribati.
Health
–Increases in the intensity of tropical cyclones increase
risks to life.
–Heat stress and changing patterns in the occurence of
disease vectors and climate sensitive diseases affect
health.
Terrestrial Ecosystems
–Replacement of local species and colonization by
non-indigenous species.
–Forests affected by extreme events are slow to re-
generate. Forest cover may increase on some high
latitude islands.
Coastal Zones
–Most infrastructure, settlements and facilities located on
or near the shore and will be affected by sea-level rise,
coastal erosion and other coastal hazards, compromising
the socio-economic well-being of island communities
and states.
–Accelerated beach erosion, degradation of coral reefs
and bleaching will all have impacts on incomes from
fishing and tourism.
–Habitability and thus sovereignty of some states
threatened due to reduction in island size or complete
inundation.
Small islands, whether located in the
tropics or higher latitudes are especially
vulnerable to the effects of climate change,
sea level rise and extreme events.
Characteristics such as limited size, proneness
to natural hazards and external shocks
enhance the vulnerability of islands to climate
change.
In most cases they have low adaptive
capacity, and adaptation costs are high
relative to GDP.
(Source: UNFCCC 2007)
Journal of South Pacific Agriculture, Volume 15: Nos. 1 & 2, 2011
Climate change and food security – Eberhard Weber
Table 2. Impacts and Vulnerabilities to Climate Change in Small Island Developing States.
nities more resilient. Activities on macro and
regional levels dominate and are often in the
field of policy and regional networking that
rarely leads to activities on the ground, in the
villages and communities. Negligence of rural
areas dominated the past few decades in many
developing countries and also today often
shapes governments‘ action. National elites
have not been interested in what was
happening in rural areas for decades. Such
attitude seems to continue also into the future.
Many countries have weak governments,
which are chronically short of funds. Revenue
is insecure and state institutions are often
breeding grounds of corruption. Many
developing countries also lack good research
institutions and scientists that could become
focal points for so urgently needed beginnings.
Finally, the poorest of the developing
countries not always lack financial resources
to start adaptation measures. Although huge
amounts of funds are available for climate
change related activities few of these activities
seem to take up the actual challenges in an
applied way, preparing people for change.
Many developing countries are struggling with
their immediate needs and have little time,
resources and motivation to think even ten
years ahead. They have enormous challenges
to apply for climate change related funds and

94
Journal of South Pacific Agriculture, Volume 15: Nos. 1 & 2, 2011
Climate change and food security – Eberhard Weber
even if they receive bigger amounts of such
funds they often are not in the position to
utilize them constructively. The windows of
opportunity are tiny and it requires not only
resources, but also visionary leaders, who are
able to take up the challenge and make a
difference for their countries. How to study the impacts of climate change
on food security in Pacific Islands?
It is important to reflect about the future
of whole regions, to see how climate change
puts people‘s livelihoods at risk, including their
food security. This knowledge provides the
precondition to strengthen economic
development, educat ion and health
infrastructure, productive capacities and
resilience. In many places new approaches to
regional development are needed to address the
impacts of climate change appropriately. Many
regions will suffer under these changes, when
crops that had been their economic backbone
no longer flourish, when fertile land is eroded
away, when natural hazards put threats on
people‘s lives and livelihoods. Many regions
will face difficulties to adjust to these changing
conditions. However people are creative, people
have strengths which are often best displayed
when the challenges are big and almost
overwhelming. Although people can achieve a
lot we should not underestimate the dimension
of the challenge ahead: there is no doubt that
they need support, and best support is such,
where they are respected and trusted, where
they can be part of the decision process
deciding on their future, where they are seen as
equally important stakeholders as government
officials and scientists. Since long Pacific
Islands have come under severe stress what the
quality of these resources is concerned. Land
e.g. is a rather scarce resource in many of
these tiny island states and equitable access as
well as the quality of the land and its potential
to cater for growing societies is already
compromised today and is getting under extra
pressure through the impacts of climate
change. In many Pacific Island states there had
been strong structures that attached the majority
of people to land. The incidence of landlessness
was low, but things are changing. Already
during colonial times in many Pacific Island
societies‘ new sections of population were
added that were excluded from traditional land
tenure systems.
Important is not only how much food a
family has, but also what kind of food. Food
security is more than just having enough
energy in forms of calories, other micro
nutrients are equally important. People cannot
just live on rice or wheat, or taro and cassava.
Here changes in nutritional preferences
experienced in Pacific Island societies play a
serious role that weaken individuals (life style
diseases) as well as countries (increasing
dependency on imported foods). Often these
nutritional challenges are left out when talking
about food security and malnutrition.
Systematic approaches must consider the
entire food systems of Pacific Island countries.
Baseline information is required urgently for
each and every individual country to be able to
estimate how climate change and its impacts
expose governments, people and particular
locations to risk and stress that require support
from outside.
People therefore need to realize that
one of the biggest nutritional problems in the
Pacific Islands today is obesity rather than
hunger. Although prevalence of poverty and
hunger should not be left entirely out of
consideration fairly little in the food security
debate is about over-nutrition, about life-style
diseases and threats to human‘s well-being
because people consume too much of the
wrong food. It is not that these aspects are
unknown in Pacific Island countries. There is
much talk about it from health officials, but
the literature on food security does not really
take such matters up, especially not when the
discourse is about climate change.
To provide rural people in the Pacific
Islands opportunities to have secure incomes,
both agricultural as well as non-farm incomes,
will help to slow down migration to the cities.
This is extremely relevant for many Pacific
Island societies, where outer islands already
today already lost a big share of their
populations in the age groups of economically
active population.
A more holistic approach has to
consider the entire width of the food systems
in PICs. Here the details depend fairly much
on the individual countries. Places such as
Kiribati, Tuvalu, and Nauru, where food
production anyway is very restricted due to

95
Journal of South Pacific Agriculture, Volume 15: Nos. 1 & 2, 2011
Climate change and food security – Eberhard Weber
varying reasons need to be treated differently
in the analysis compared to countries where
food production is diverse and able to produce
much bigger parts of the national
consumption. To start with it would be crucial
to analyze the food systems of all the Pacific
Island countries separately and to analyze the
major threats to the countries and to most
vulnerable groups arising from climate change.
Such a start is essential to get a better
understanding about the food and livelihood
systems of each individual PIC in order to be
able to predict of how climate change will
show impacts, and what strategies individual
PICs best would take up to become more
resilient to these impacts. Figure 3 summarizes
the major aspects of a comprehensive food
system and gives hints regarding potential
threats arising from climate change. Exposure
happens to countries as a whole as well as to
particular regions and households. It might be
necessary to study sub-systems of the food
system, e.g. to look which locations are in
particular at risk or which are the most
vulnerable people, and start with policies and
support for them rather than to take up
everything everywhere: this won‘t be possible.
The biggest challenge therefore will be to set
priorities. When doing this it needs to be
safeguarded that inclusive processes enable all
to become part of decisions that will be
affected by them. Only then it will be possible
that people take ownership in many crucial
questions concerning their own future and the
future of their children. In some instances this
future will happen elsewhere to where people
live today. Many will lose their homes, entire
countries will disappear and the need for
international cooperation, solidarity and
innovations will be great. Only if this happens
another great challenge of humankind can and
will be mastered.
Figure 3. Food System and Climate Change—A theoretical frame.
References
BAKER, K. & JEWITT, S. L. 2007. Evaluating 35 years of Green Revolution Technology in
villages of Bulandshahr district, western UP, North India. Journal of Development Studies,
43:312-339.
BALS, C., HARMELING, S. & WINDFUHR, M. 2008. Climate Change, Food Security and the

96
Journal of South Pacific Agriculture, Volume 15: Nos. 1 & 2, 2011
Climate change and food security – Eberhard Weber
Right to Adequate Food. Bonn, Germany, 212 pp.
BOHLE, H. G. 2009. Sustainable Livelihood Security. Evolution and Application. In: Brauch, H.
G., Grin, J., Mesjasz, C., Krummenacher, H., Chadha Behera, N., Chourou, B., Oswald
Spring, U. & Kameri-Mbote, P. Eds.: Facing Global Environmental Change:
Environmental, Human, Energy, Food, Health and Water Security Concepts. Hexagon
Series on Human and Environmental Security and Peace. Vol. 4. Berlin-Heidelberg-New
York-Hong Kong-London-Milan-Paris-Tokyo, Springer-Verlag, pp. 521-528.
BROWN, L. R. 1970. Seeds of Change: The Green Revolution and Development in the 1970's.
New York: Praeger.
CARNEY, D., DRINKWATER, M., RUSINOW, T., NEEFJES, K., WANMALI, S. & SINGH, N.
1999. Livelihoods Approaches Compared. London: Department for International
Development.
CHAKRAVARTI, A. K. 1973. Green Revolution in India. Annals of the Association of American
Geographers, 63:319-330.
CHAMBERS, R. 1989. Vulnerability, Coping and Policy. ids bulletin, 202:1-7.
DREZE, J. & SEN, A. 1991. Hunger and Public Action. New Delhi, India: Oxford University
Press.
ELAHI, K. Q. 2009: The Entitlement Approach – A Case for Framework Development Rather
than Demolition: A Reply to Rubin. Journal of Development Studies, 45:641-645.
ELAHI, K. Q. 2006. Entitlement failure and deprivation: a critique of Sen‘s famine philosophy.
Journal of Development Studies, 42:541–558.
FRANKEL, F. R. 1971. India's green revolution; economic gains and political costs. Princeton,
N.J., Princeton University Press.
IPCC, 2007: Climate Change 2007: Impacts, Adaptation and Vulnerability. Contribution of
Working Group II to the Fourth Assessment Report of the Intergovernmental Panel on
Climate Change, M.L. Parry, O.F. Canziani, J.P. Palutikof, P.J. van der Linden and C.E.
Hanson, Eds., Cambridge University Press, Cambridge, UK, 976pp.
LADEJINSKY, W. 1970. Ironies of India's Green Revolution. Foreign Affairs, 48:758-768.
RUBIN, O. 2009. The Entitlement Approach: A Case for Framework Development Rather than
Demolition: A Comment on ‗Entitlement Failure and Deprivation: A Critique of Sen's
Famine Philosophy'. Journal of Development Studies, 45:621-640.
SCHERR, S. 2003. Halving Global Hunger. Background Paper of the Millennium Project Task
Force on Hunger. Washington D.C.
SEN, A. 1981. Poverty and Famines: An Essay on Entitlement and Deprivation. Oxford, U.K.:
Oxford University Press.
SHIVA, V. 1992. The Violence of Green Revolution: Third World Agriculture, Ecology and
Politics. London: Zed Books.
SOHLBERG, P. 2006. Amartya Sen‘s entitlement approach: empirical statement or conceptual
framework ?. International Journal of Social Welfare, 15:357–362.
UNITED NATIONS FRAMEWORK CONVENTION ON CLIMATE CHANGE (UNFCCC).
2007. Climate Change: Impacts, Vulnerabilities, and Adaptation in Developing Countries‘,
Bonn, Germany. 57pp.
VASAVI, A. R. 2009. Suicides and the Making of India's Agrarian Distress. South African Review
of Sociology, 40:94-108.
WATTS, M. J. & BOHLE, H. G. 1993a. Hunger, Famine and the Space of Vulnerability.
GeoJournal, 30:117-125.
WATTS, M. J. & BOHLE, H. G. 1993b. The Space of Vulnerability: the Causal Structure of
Hunger and Famine. Progress in Human Geography, 17:43-67.

97
Journal of South Pacific Agriculture, Volume 15: Nos. 1 & 2, 2011
Climate change and food security – Eberhard Weber
YARO, J. A. 2004. Theorising Food Insecurity: Building a Livelihood Vulnerability Framework
for Researching Food Insecurity. Norwegian Journal of Geography, 58:23-37.

98
What Ails Rural Economy of Fiji? A Diagnosis and Prescription
Sunil Kumar1 and Jagdish Prasad Bhati1
ABSTRACT
In Fiji majority of population live and earns their income from agricultural sector. Therefore,
development of agriculture can serve as the engine of economic growth for the whole economy.
But many constraints hinder sustainable development of agriculture. Hence, understanding of the
root causes of poor performance of agricultural sector will help formulate problem-solving
development strategy for enhancing productivity of rural sector of Fiji. This paper analyses malady
of the primary sector and outlines a demand-driven policy framework which will help create
conducive macroeconomic environment in the country to encourage innovation and
agripreneurship to boost farm production. The paper argues that strengthening of rural
infrastructure and linkages of farmers with agribusinesses and consumers would provide both the
basis and means of rural economy contributing to the overall sustainable development of the
country.
Key words: Agricultural problems, Agricultural and rural development policies; Agri-input
supplies.
INTRODUCTION
There is probably no greater challenge
facing development planners in small island
countries such as Fiji than the problem of
agricultural development. Fiji is an island
country located at the centre of the Pacific
Ocean. The bulk of population in Fiji earns its
living from employment in agriculture. A
productive rural sector in Fiji would not only
help alleviate rural poverty. It would also
broaden the domestic market to absorb the
output of a growing manufacturing sector in
the country. In other words, strengthening of
agricultural development programmes in Fiji
islands would provide both the basis and
means for a broader and more rapid growth of
the island economy. But, the progress of
agricultural sector will not take place in a
vacuum. It is constrained by various factors
and very much depends on the policies that the
government uses to change the social and
economic context within which agricultural
production and marketing takes place.
Diagnosing the constraints and
challenges faced by agricultural sector in small
island countries, like Fiji is important for
several reasons. Firstly, primary production is
the main activity in these countries as the level
of industrialization is very limited. Secondly, it
is now well known that growth of rural
economy is important for poverty reduction,
with important implications for progress
towards the Millennium Development Goals
(MDGs). Thirdly, there are significant gaps in
our understanding of the main causes of low
agricultural productivity and the efficacy of
agricultural policies to stimulate growth in the
rural sector. In essence, there is an
understanding of the basic ingredients that
make up a successful growth strategy, but
there is a need to deepen our understanding,
including of how to apply strategies to the
economic and political context of the
particular country. Fourthly, it will help ensure
that the development policies are research-
evidence based and aligned with the felt needs
of the rural people minimizing waste of
resources on non-demand driven government
programmes.
The objectives of the paper are:
(i) to highlight the major problems and
challenges faced by farmers and agri-
entrepreneurs in Fiji; and
(ii) to identify the need-based problem solving
Journal of South Pacific Agriculture, Volume 15: Nos. 1 & 2, 2011
What Ails Rural Economy of Fiji? – Sunil Kumar & Jagdish Bhati
1School of Economics, Faculty of Business & Economics, University of the South Pacific, Suva, Fiji Islands.
Email: [email protected] ; [email protected]]. Fax :(679) 3232522.

99
agricultural development policies that are
required to provide a framework that
allows farmers to shift from traditional
farming systems to more productive,
science-based production methods and
allows adoption of commercial farming
systems on a sustainable basis.
The paper would be of interest to
agricultural policy makers, extension officers,
and others who have interest in accelerating
the deve lopment process in t he
underdeveloped rural areas especially in the
small island countries like Fiji.
The paper is organized in six sections.
The next section provides an overview of the
general features of rural economy of Fiji. The
third section highlights the symptoms of poor
health of rural economy in Fiji. In the fourth
section factors hindering domestic production
of agricultural commodities are described. In
the sixth section, a strategy for agricultural
development and diversification is outlined
which could provide a socio-economic
framework to motivate farmers to shift from
the traditional farming system towards a more
productive commercial mode of production.
And finally in the sixth section, summary and
conclusions are presented.
General Features of Fiji’s Rural Economy
To understand progress of agricultural
sector and formulate development strategies
for enhancing incomes and employment of
people, it is essential first to know the rural
scenario and understand agricultural situation
there. Data about the basic features of Fiji‘s
rural economy are presented in Table 1. As
already pointed out, Fiji is an island nation
located at the centre of the Pacific Ocean. The
archipelago has about 330 small islands with a
total land area of 18,333 km2. Its two largest
islands Viti Levu and Vanua Levu make up
88% of the total land area. Fiji is a multiethnic
country with a total population of 837, 271 as
of 2007. Almost half the population lives in
rural areas and earns its livelihood from
agriculture. Fiji is a multiracial country. In the
total population, indigenous Fijians account
for 56.8 percent, Indo-Fijians for 37.5 percent
and others (mainly of Chinese and European
origin) account for 5.7 percent population.
The density of population is about 46 persons
per square kilometre. But most areas of the
country are hilly and mountainous and thus
only 30 percent land area is suitable for
agriculture.
Although average size of farms is 6.2
hectares, but the majority of them (56.2% of
the total land holdings) are small each having
less than 2 hectare area. Contributions of
different sectors of the economy to the gross
domestic product of Fiji are also shown in
Table 1. It is clear from the table that
manufacturing and services sector are
dominant but agricultural sector is also a major
contributor to the economy. Agriculture
(inclusive of fisheries and forestry) contributes
around 13 percent to the gross domestic
product of Fiji.
About 87 percent of total land in Fiji is
owned by indigenous Fijians under the
collective ownership of the traditional Fijian
clans by law and through very complicated
traditional arrangements. The government
owns six percent land and the remaining
portion (7% land) is freehold that can be
bought and sold by individuals of any
ethnicity. The land ownership pattern is frozen
by law and native land sales are prohibited.
The Indo-Fijians, who make up around 38
percent of the population and are descendants
of the indentured labourers brought over by
the British to work in sugar and coconut
plantations during the last quarter of
nineteenth century, are largely landless. About
90 percent of the sugarcane crop (the main
export crop) is produced by Indo-Fijians
farmers on leased-in land. The land owned by
native Fijians under the communal tenure is
under the jurisdiction of the Native Land Trust
Board (NLTB), a statutory authority created in
1940 under the Native Lands Trust Ordinance,
now known as the Native Land Trust Act
(NLTA). NLTB controls and administers lease
dealings in native land. Tenancy conditions are
regulated by the provisions of the Agricultural
Landlord and Tenant Act (ALTA) (1976).
ALTA is a successor of the Agricultural
Landlord and Tenant Ordinance of 1966.
Symptoms of Poor Health of Agricultural
Economy
Primar y product ion inc ludes
agriculture (crops and livestock) and forestry
and fishery sub-sectors. Further breakup of the
primary sector to its components is shown in
Journal of South Pacific Agriculture, Volume 15: Nos. 1 & 2, 2011
What Ails Rural Economy of Fiji? – Sunil Kumar & Jagdish Bhati

100
Table 1. Basic features of Fiji‘s rural economy.
Journal of South Pacific Agriculture, Volume 15: Nos. 1 & 2, 2011
Particulars Extent
Total population (2007 census)
- Native Fijians (%)
- Indo-Fijians (%)
- Others (%)
837,271
56.8
37.5
5.7
Rural population (%) 49.3
Total land area (km2 ) 18,271
Agricultural land area (km2 ) 5,480
Arable permanent crops area (km2) 2,850
Average farm holding size (ha) 6.2
Percent of total holdings below 2 hectares (%) 56.2
Proportion of land area by tenure system:
- Land under communal tenure (%)
- State or public land (%)
- Freehold land (%)
87
6
7
Gross National Income per person (2007) (USD) 3,750
Structure of the economy:
- Share of agricultural sector in the Gross Domestic Product (%)
- Share of industrial sector in the Gross Domestic Product (%)
- Share of services in the Gross Domestic Product (%)
13.1
21.1
65.8
Source: Fiji Key Statistics, Fiji Islands Bureau of Statistics (FIBS), Suva, 2009.
Table 2. Crops and livestock subsector account
for 77 percent of primary sector while fishing
activity and forestry account for 14.26 percent
and 8.74 percent respectively. Within
agricultural production the main activity is
crop production while contribution of
livestock production is a minor component. In
this section status of agricultural economy of
Fiji is analyzed, especially with respect to its
growth rate and the export performance.
Slow Growth of Agricultural Sector
Data in Table 2 shows changes in the
contribution of different sub-sectors to overall
agricultural production and their annual
growth rates in recent years (2003 - 07). The
overall annual growth rate of Gross Domestic
Product of Fiji was 1.45 percent during 2003 -
07, but the growth of agricultural sector was
very slowly (0.58% per annum). Within
agricultural production the proportionate share
of crops has declined and that of livestock is
increasing. Growth of sugarcane production
which alone accounts for bulk (23.6%) of
agricultural production, was negative (-3.45%
per annum). However, the growth of
production of other crops (roots and tuber
crops) has a positive trend (6.77%). Similarly,
livestock sector which currently has a low base
was growing steadily (6.8% per annum). Since
there is plenty of fodder resources (sugarcane
top and pasture lands) in Fiji, livestock
production has vast potential for further
growth. Although Fiji has plenty of ocean
resources, the annual growth in fishing sector
was 1.76 percent only.
The main cause of dismal performance
of agricultural sector as a whole in Fiji was the
negative growth rate of sugarcane production.
Interestingly, in Fiji sugarcane is mainly
produced by Indo-Fijians who work on leased
-in land. The other crops (cassava, taro, sweet
potato, coconut, etc.) are mainly produced by
What Ails Rural Economy of Fiji? – Sunil Kumar & Jagdish Bhati

101
Journal of South Pacific Agriculture, Volume 15: Nos. 1 & 2, 2011
What Ails Rural Economy of Fiji? – Sunil Kumar & Jagdish Bhati
Table 2. Changes in contributions of different sub-sectors of agriculture to the total agricultural sector in Fiji (2003-07) (GDP at Factor Cost: 1995 prices).
Source: FIBOS (2010) Key Statistics (p. 25).
Sub-sectors of agriculture 2003 2007 % Annual growth
rate (2003
- 2007)
(FJD 000) % share in total
agriculture
(FJD 000) % share in
total
agriculture
Agriculture 334,620 77.00 342,372 77.44 0.58
- Total crops 187,257 43.90 188,460 42.63 0.16
Sugarcane 121,070 27.86 104,340 23.60 (-)3.45
Other Crops 66,187 15.23 84,121 19.03 6.77
- Livestock 19,019 4.38 24,213 5.48 6.83
- Subsistence 120,528 27.73 122,756 27.76 0.46
- Public Sector 7,815 1.80 6,943 1.57 (-)2.79
Fishing 61,959 14.26 66,310 15.00 1.76
- Fishing 33,465 7.70 37,270 8.43 2.84
- Subsistence 27,552 6.34 28,061 6.35 0.46
- Public Sector 942 0.22 979 0.22 0.98
Forestry 37,997 8.74 33,429 7.56 (-)3.00
- Forestry 20,736 4.77 15,945 3.61 (-)5.78
- Subsistence 16,626 3.83 16,934 3.83 0.46
- Public Sector 635 0.15 550 0.12 (-)3.35
Total primary sector 434,576 100.00 442,110 100.00 0.43
Gross Domestic Product 2,784,385 2,946,284 1.45
the native Fijians. Main reason for this
negative trend in sugarcane production is the
expiry of some land leases and uncertainty
about the renewal of others. Thus the sugar
industry in Fiji is declining at a rapid rate due
to a number of reasons: chiefly the land tenure
problems since mid-1990s, declining milling
efficiency and declining price of sugar in
recent years due to the withdrawal of
preferential treatment by the European Union.
Thus, the challenge facing development
planners in Fiji to strengthen and diversify the
rural economy is enormous. It entails the task
of establishing sound agricultural economy
that involves people at various levels and
where many creative policies are applied and
the markets are surveyed periodically (see EU
2009).
Rising Food Import Bill
Data on Fiji‘s exports and imports of
agricultural products are presented in Table 3.
In Fiji main agricultural export is sugar. Other
exports are root crops (taro, cassava), spices
(chillies) and processed wheat and cereals. The
major imported crop products are wheat, rice,
vegetables, fruit and nuts. The livestock
products imported include meat and milk
products. Data reveal that Fiji‘s import bill of
agricultural products has a rising trend. It is
because domestic production of food products
is not keeping pace with the rising domestic
demand and thus the gap is filled by imported
quantities of food items. The food import trend
is expected to worsen as the rural to urban
influx of population in Fiji continues mainly
due to expiry of land leases of tenant farmers.
Data in Table 3 also shows that country
is highly deficient in production of vegetables,
rice, and milk and meat products. However,
this should not have been the case for Fiji as it
has sufficient agricultural resources like land,
labour, climate as well as human resources to
produce these products domestically (Prasad
2010).
Prolonged shortages and the inability
of farmers to respond to shortages in supply to
meet the food demand are normally construed
as food security issue. Such issues are not well
understood in Fiji. This domestic supply-
demand mismatch of food products in Fiji is
mainly because government intervention
policies are not effective.
In view of the weak health of
agricultural economy in the country, the
dependence on traditional farming methods

102
needs change towards more productive
methods with application of appropriate
scientific technology and knowledge about
crops, soil, and the environment. However,
before formulating any strategy for this
purpose the economic context within which
farm production and agribusiness occurs needs
to be properly understood.
Diagnosing Causes for Dismal Agricultural
Progress Assessment of problems, needs and
priorities of farmers provides development
planners with a broad framework for
understanding the range of issues involved in
bringing about substantial changes to the
agricultural sector that could improve the
farmers‘ supply responsiveness to the demand
for farm products. A thorough understanding
of the root causes of low supply of farm
products help in formulation of effective
action plans for boosting agricultural
production and would reduce the problem of
demand and supply mismatch.
The challenges and constraints of
farmers in production and marketing of
various types of agricultural products have
been identified by farmers. The data is
summarized in Table- 4. Though many farm
problems are common to all types of farmers,
but some problems are specific for production
and marketing different types of farm
products. The discussion in this section is
organized under two broad categories of farm
products, i.e. for crop products and livestock
products.
Causes of Low Supply of Crop Products
Major causes for the declining trend in
sugarcane production in Fiji are: (i) lack of
land tenure security of sugarcane farmers, (ii)
lack of credit availability to farmers, and (iii)
lack of extension services (Lal, 2008 & 2009;
Prasad, 2008). Furthermore, cost of sugarcane
production has increased due to increased
price of fertilizer, cost of cartage, cost of
harvesting and labor cost, while the price of
sugar has declined due to erosion of
preferential markets. The overall decline of
infrastructure, falling mill efficiency and the
declining prices have also resulted in the
decline in sugarcane production (Island
Business, 2010).
Various factors constrain production
and marketing of root and tuber crops and
vegetables in Fiji (Nacoke, 2007: Remudu,
2006). Lack of roads and transportation
faculties for most of farmers result in (a)
limited access to the market; (b) delays in
delivery causing spoilage and lowering the
Sources: International Trade Statistics, ITC, UNCTAD/WTO, 2002-2005.
Table 3. Fiji‘s average imports and exports of agricultural products, 2002–2005 (USD ‗000).
Product (1)
Exports (2)
Imports (3)
Balance (2 – 3)
Wheat & cereals 12,755 24,904 (-) 12,145
Rice 304 11,074 (-) 10,770
Roots, other products 13,543 -- (+) 13,543
Vegetables -- 19,680 (-) 19,680
Fruits and nuts 724 4,119 (-) 3,395
Sugar 120,745 3,075 (+) 117,670
Spices 3,966 1,279 (+) 2,687
Total crop products 152,037 64,131 (+) 87,906
Live animals 54 569 (-) 515
Meat of bovine 9 3,256 (-) 3,247
Other meat 4,329 20,230 (-) 15,901
Eggs and birds 72 1,383 (-) 1,311
Milk and milk products 866 18,800 (-) 17,934
Total livestock products 5,330 44,238 (-) 38,908
Journal of South Pacific Agriculture, Volume 15: Nos. 1 & 2, 2011
What Ails Rural Economy of Fiji? – Sunil Kumar & Jagdish Bhati

103
quality of the products; and (c) long cartage
distance on poor roads increases damage and
the marketing costs. Marketing agents
collecting farm products from farmers do not
have organized plans for uplifting the produce
from villages which adversely affects farmers
in two main ways: (a) waste of perishable
products harvested for supply on a particular
day which were not lifted by the agent, and (b)
loss of weight and quality of fresh produce
during waiting time. Lack of storage facilities
at the collection centers results in theft,
damage or waste of farm products. Lack of
marketing information to farmers about the
market situation and prevailing prices in major
markets affects the whole agricultural supply
chain. Insufficient knowledge of farmers about
the post-harvest handling of agricultural
products also affects marketing process and
the quality of the product. Interior and
riverside farmers need varied transport
systems like boats and small utility vans.
Insecure land tenure contributes to lack of
improvements or investments in land for
drainage, etc. Lack of institutional credit
facilities to tenant farmers is also a problem.
Farmers lack skills of scientific methods of
vegetable production. Farmers also reported
that prices of fertilizer and other agro-inputs
required for crop production are quite high
(see Table 4).
Problems of Livestock Farmers
. In Fiji there are very few large
commercial scale farms and most animal
husbandry is done at subsistence level. These
farmers convert low value forages and crop
residues into animal feed. In most cases,
farmers use family labour to sustain these
small-scale livestock rearing, which
supplement their family income. Even though
in some areas a lot of fodder resources and
grassland exists in Fiji, animal husbandry is
not so common, particularly on commercial
basis for which reason Fiji is not self-sufficient
in meat and milk production.
Some recent studies about livestock
farming in Fiji (viz., Aregheore et al., 2008;
Bolasui, 2008; Vorelevu & Bhati, 2006;
Aregheore et al., 2001) revealed that various
constrains are faced by farmers in the
production and marketing of livestock
products (see Table 4). The major problem,
that in general there is a lack of veterinary
extension services in most of the areas.
Farmers say they do not have adequate
training and education about the modern
methods of livestock rearing and pasture
management to boost production. Short-term
and customary land-tenure system under
which many cattle farmers operate hinders
What Ails Rural Economy of Fiji? – Sunil Kumar & Jagdish Bhati
Journal of South Pacific Agriculture, Volume 15: Nos. 1 & 2, 2011
Table 4. Problems in production and marketing of farm products in Fiji.
Sources: Aregheore et al. (2001); Aregheore et al. (2008); Bolasui (2008); Nacoke (2007); Prasad (2008); Remudu (2006); and Vorelevu & Bhati (2006).
Problems Problems of farmers producing:
Sugarcane Taro & Cassava
Vege- tables
Livestock
1. Insecure land tenure √ √ √ √
2. Lack of irrigation facilities √ √
3. Lack of credit facilities √ √ √ √
4. High cost of inputs—fertilizer, feed, etc. √ √ √
5. Lack of skills in modern farming techniques √ √ √
6. Lack of road networks in rural areas √ √ √ √
7. Lack of transportation facilities √ √ √
8. Lack of marketing yards/centers √ √
9. Lack of agro-food processing facilities √ √ √
10. Unscrupulous behavior of marketing agents √ √
11. Lack of storage facilities √ √
12. Lack of marketing information √ √

104
them from making long-term capital
investment required in cattle farming. Also,
lack of property right on lands affects
availability of institutional credit for
investment in cattle farming or pasture
improvement. Due to poor road conditions and
lack of transportation facilities marketing of
livestock products is a costly affair especially
for small-scale cattle farmers. Farmers also
reported that supply of livestock inputs
(concentrated feeds and medicines) was
inadequate and irregular in their areas. (see
Table 4).
As also pointed out previously, Fiji is
not self-sufficient in milk and meat production
and thus a considerable amount of foreign
exchange is spent on importing these products.
Therefore, there is a need to fully understand
the importance of livestock production not
only as a medium for rural development and
import substitution but also from the human
nutrition point of view. Problems faced by
cattle farmers in Fiji need urgent attention so
that livestock sector could achieve its full
potential.
Farmers’ Poor Linkages with Agribusinesses
and Consumers
Due to increasing urbanization of the
population there is a need to move more food
from rural to urban areas to meet the
increasing demand of primary agricultural
products in urban areas. Farmers reported that
they face difficulties in marketing their surplus
food products (see Table 4). McGregor (1999)
also pointed out that there are unreliable and
inadequate agricultural marketing services in
Fiji. Under such a situation domestic
production and supply of fresh perishable
agricultural products, such as meat, milk,
vegetables and fruits, are badly affected. Then
it is not surprising why the island country is so
highly dependent on imported food products
from other developed countries. Data in Table
5 shows that money spent on importing food
products has been rising in recent years.
If the marketing channels are not
adequately linked to the farmers the price
signals do not reach them and thus their
supplies generally do not respond to the
increased urban demand... Since supplies of
farmers in Fiji are not adequately and
efficiently linked with the urban demands, the
gap between domestic demand and supply is
being filled up by the imported food products.
In the absence of robust domestic agri-supply
chains, the wholesalers and retailers of food
products distribution in Fiji find it much easier
and reliable to import from other countries
rather than meeting their orders of farm
products from the domestic producers. Supply
chains from foreign suppliers are well
management and properly linked with local
wholesalers and retailers while those
connecting local farmers are poor, inadequate
and unreliable to meet the demanded quantity
and quality on timely and sustainable basis.
Farmers often face the prospect of glut
in the market when the season sets in since
supply side information is often not available
and even if it is there, it is often too late to
make any adjustments. Such commodity gluts
in the market cause prices of agricultural
commodities to spiral down causing
significantly revenue loss to farmers. Some
reasons are forwarded here about why the
domestic farm production in Fiji fails to
respond to demand of food commodities. The
key problem in Fiji is the lack of information
about the demand side of the market, to which
farmers could match their supply and storage
and preservation activities. The government
however, has recently launched a web based
market watch publication which is meant to
provide market information to the farmers
(MPI 2010b & 2010c). But most of the
farmers in Fiji are not computer literate and
lack access to internet facilities.
What Ails Rural Economy of Fiji? – Sunil Kumar & Jagdish Bhati
Journal of South Pacific Agriculture, Volume 15: Nos. 1 & 2, 2011
Table 5. Absorption of imported food products in Fiji (‗000s of FJD).
Broad Category of Food 2004 2005 2006 2007 2008 2009
Primary Food Product 57,387 55,711 63,219 69,493 85,350 73,287
Processed Food 205,558 206,709 202,775 199,578 260,095 300,394
Total Absorption 262,945 262,420 265,994 269,071 345,445 373,681
Source: Fiji Key Statistics, Fiji Islands Bureau of Statistics, Suva, 2010.

105
It is a big challenge before the policy
planners and development agencies to harness
this opportunity of increased urban demand in
Fiji by expanding and strengthening the local
agro-food supply chains linking farmers and
urban consumers in the country.
Inadequate Agricultural Finance
Farmers of all types whether sugarcane
farmers of producers of root crops or of
vegetables or of livestock products all have
mentioned shortage of credit facilities as a
significant constraint for their production and
marketing activities (see Table 4). In Fiji
agricultural credit facilities have been low
since early 1990s and declining due to a
number of reasons. First, the uncertainty about
the land tenure since early 1990s was the main
cause of this decline in loans to farmers. As a
result of looming expiry of land leases since
1997 the investment confidence of the farmers
declined and banks have refused to issue loans
to tenant farmers. Secondly, the government
development policies since early 1990s up
until recently become inherently passive
towards agriculture and more active towards
tourism and manufacturing. The data in Figure
1 shows very low levels of credits for
agriculture. However, recently as shown in the
Figure 1 there seems to be a significant
increase in the agricultural loans which is a
sign of change in the government policy
towards this sector of economy. Apart from
the Fiji Development Bank, which is
government owned entity; a lot of commercial
banks‘ activities have been encouraged by the
government in this area recently. This is very
encouraging for the smallholder farmers who
were unable to borrow and expand their farm
activities due to lack of credit.
Strategies for Strengthening Rural
Economy in Fiji
The process of transforming rural
economy depends largely on the government
policies that change the social and economic
context of production and marketing of farm
products. The analysis of problems faced by
farmers provides the basis for more concerted
policies and support schemes for agricultural
and rural development. The concerns and
problems pointed out by the farmers (see
Table 4) in fact stem out from their unfulfilled
needs and priorities for a long time. Policy
failure is the basic reason for the current rural
scenario in Fiji where agricultural production
is hardly sufficient to meet its domestic
demand. Strengthening rural sector and
establishing new agribusinesses enterprises
would provide a sound basis for the growth of
the rural economy in Fiji. However, this
process of economic transformation and
expansion is likely to be severely hampered by
various inherent constraints such as land
0
20,000
40,000
60,000
80,000
100,000
120,000
140,000
160,000
1994 1996 1998 2000 2002 2004 2006 2008 2010
Lo
an
s V
alu
es (
in '000 F
JD
)
YearsLoans to Ethnic Fijians Commercial and Industrial Agricultural
Figure 1. Fiji Development Bank Loans. Source: FIBOS (2010) Key Statistics, Fiji Islands Bureau of Statistics.
What Ails Rural Economy of Fiji? – Sunil Kumar & Jagdish Bhati
Journal of South Pacific Agriculture, Volume 15: Nos. 1 & 2, 2011

106
tenure, lack of investments and many other
challenges faced by the agricultural sector
(Prasad & Kumar, 2000; Barbour &
McGregor, 1998; Ward & Proctor, 1980). The
agricultural transformation process would
depend significantly on the creation of new
mechanisms for agricultural production and
value addition such as processing, packaging,
transportation and marketing. This would
include the whole spectrum of activities from
crop production and animal husbandry to
agribusiness and export initiatives to expand
and diversify the rural economy. Such an
approach will broaden not only the supply side
of food products but also the demand side and
domestic market as a whole (see ADB, 2010;
Naude, 2010; Oxfam, 2010; Prasad, 2010;
Qamar, 2005). Some good policies are
currently being facilitated by government in
Fiji but the actual outcomes are not visible yet
(see for instance MPI, 2010a, b & c). To boost
the production to meet local demand and for
exports, well-planned and structured govern-
ment policies are needed. Such well-planned
policies would help fulfil the much needed
aspirations of the farmers and also resolve a
number of their business constraints. Some of
the issues that need attention of the policy
makers are discussed below.
Marketing Mechanisms and Networks for
Farm Producers
Since most farms are small and widely
dispersed throughout the countryside, a
correspondingly widespread transportation
network is required to channel supplies to the
market centres in the urban areas. Easily
available and efficient transport mechanisms
to move farm products such as milk, cattle,
vegetables, fruits and root crops to the market
area are essential for the system to work. Since
farm products are bulky and highly perishable,
they often require special care during
transportation, which is non-existent in Fiji.
On the whole, an efficient and
dependable market chain system needs to the
developed to link farmers with consumers in
the domestic as well as the external markets.
Majority being of smallholder family farms the
economies of scale are not there to facilitate an
independent market supply system.
Government facilities and regulation of
agricultural market are nonexistent. Transport
linkages to the rural areas are not sufficient.
The essential transportation and storage
facilities should be provided and supported by
the government. It may be provided through
private initiatives but with some government
support and supervision.
The development of more effective
transportation and storage system through
government initiative could be a key strategy.
It is a well-known fact that the existence of
agricultural market structures is the most
important condition for enhancement of output
and efficiency (FAO, 2008). The absence of
storage and transport infrastructure in Fiji is an
insurmountable constraint for smallholder
farmers, who can only ill-afford such facilities
to preserve their produce. If efficient
marketing systems are established solving the
production problems would become much
easier.
Providing Training to Farmers
Farmers generally lack knowledge and
are almost totally unaware of new ideas and
technologies useful for farm production.
Fixing these problems crucially depends on
multiple dimensional approaches Farmers need
immediate up-gradation of their skills for mass
production of agricultural commodities on
commercial basis. The younger generation also
needs attention of the policymakers and needs
to be motivated towards agriculture by
portraying it to them as a scientific, modern
and high income venture.
Instituting farmers training programs
would lead to substantial gain in enhancing the
supply of farm products and fulfil the demand-
supply gaps that exist at the moment. The
training and extension process is already
underway at the Ministry of Primary Industries
(MPI) to some extent but sufficient
information is still not flowing to the farmers.
There is dire shortage of extension officers in
Fiji. Therefore, training the trainers is of
utmost importance. This would help the MPI
personnel to reach out to the farmers who are
the real actors in the business of agriculture
(see MPI, 2010d). Government‘s extension
services have been in ruins since early 1990s
due to institutional neglect.
What Ails Rural Economy of Fiji? – Sunil Kumar & Jagdish Bhati
Journal of South Pacific Agriculture, Volume 15: Nos. 1 & 2, 2011

107
Local Supplies of Farm Inputs and Equipment
Enhancing agricultural production
would need special farm equipments, material
inputs and seeds etc. Such inputs need to be
made available locally at reasonable prices.
The MPI in Fiji is making a reasonable effort
towards these goals but facilitation of private
sector involvement would supplement in this
respect. There are many sectional political
objectives at play in efforts to develop the
agricultural sector which hinder the
commercialization process quite significantly.
For instance, pilot projects should be selected
on the merit of farmers rather than on ethnic or
provincial basis.
Credit Facilities for Farm Investment
Credit facilities for the agricultural
sector are low in Fiji. The supply of credit
needs to be matched with increasing demand
for credit due to agricultural modernization
process. Apart from access issues for the
farmers, success also depends on reasonable
cost of credit. Therefore, the rate of interest
needs to be maintained at reasonable levels
and also to provide enough time for the
farmers to meet repayment. This measure is
important if farmers are to succeed in
competitive markets domestically as well as
globally.
Encouraging Farmers’ Cooperatives
Because agricultural products are bulky
and highly perishable, their transport system
needs to be fast and cost effective, which
could make small scale production profitable.
This is where local cooperative systems would
become useful for farmers. Furthermore, the
small scale producers are often in a weaker
and vulnerable position in the market place.
Hence, farmers should be encouraged to
forming cooperative marketing societies to
take joint action in an organized manner to
address market related problems including
joining hands to create economies of scale.
This kind of voluntary group action by farmers
in the form of cooperative is important for
enhancing agricultural development within
local communities, which would have wider
national effect.
Farmers‘ cooperatives can be formed
to take responsibility of transporting,
processing and marketing farm products. The
supply of farm inputs can also be organised in
this way much more cheaply. However, the
establishment of such cooperative systems
would need considerable government involve-
ment and support.
Expanding Agriculture Area with Long-term
Land Tenure
The much needed confidence among
farmers is grossly lacking due to numerous
problems but mainly due to land tenure
conflicts that have existed for long.. Only one-
third proportion of land in Fiji is under
cultivation and there is a scope for bringing
substantial new land under plough (see Table
1). But the problem of insecure land tenure has
daunted farmers for long. On the one hand the
demand for food products is increasing in Fiji
while on the other hand outward movement of
human resources from rural areas to urban
areas is taking place at an alarming rate due to
expiry of land leases As a result of this
substantially fertile areas of land are lying
unused. Also, marginal and waste lands which
are also currently unused require development
strategies to spin-off some form of production
such as livestock production and planting fruit
and other tree crops from these lands.
Agricultural production and land tenure are
intricately linked with the agricultural
productivity in the South Pacific island
countries (Acqaye & Crocombe, 1984). Long
term land lease be provided to tenant farmers.
The shorter and insecure land tenure system
hinders long term investment growth strategies
of farmers (such as in land levelling, terracing,
drainage and irrigation system development),
and thus agricultural productivity on tenancy
farms.
SUMMARY AND CONCLUSIONS
The paper highlights the need for
increasing agricultural production to improve
food security and reduce dependence on
imported food items in Fiji. To formulate an
effective action plan for boosting agricultural
production, it is essential to understand the
problems faced by the farmers. A need-based
agricultural development strategy has been
outlined in the paper to transform the rural
economy of Fiji. Prospects for higher earnings
of farmers and other rural dwellers due to
What Ails Rural Economy of Fiji? – Sunil Kumar & Jagdish Bhati
Journal of South Pacific Agriculture, Volume 15: Nos. 1 & 2, 2011

108
better market networks, agro-processing
activities and more efficient transportation
system and rural infrastructure development
have been highlighted. It is suggested that a
simultaneous change both in the skills of
farmers and the availability of new
technologies and allied inputs would
effectively change the farm production
systems and marketing pattern of agricultural
products for the betterment.
Having a more productive and price
responsive agriculture and interlinked agri-
businesses in the rural areas of Fiji would not
only generate higher income and help diversify
rural economy but would also weaken the
stream of rural-to-urban migration of people,
especially the young people. It will reduce
dependence on imported food products.
Improvements in incomes and employment
facilities in rural areas would in turn lead to
higher rates of absorption of domestic products
in rural areas. It is argued that the task of
sustainable development of rural sector would
require sound economic policies with the aim
of creating more agriculture-based
entrepreneurship. Agricultural policy planners
in Fiji have been reacting to situations instead
of strategizing. The long term agricultural
strategy would entail more productive
agricultural sector with multilayered
stakeholder interests.
What Ails Rural Economy of Fiji? – Sunil Kumar & Jagdish Bhati
Acknowledgement
Authors are thankful to the anonymous referee of this Journal for providing critical comments and
suggestions for improvement of the paper. However, the usual disclaimers apply.
References
ACQAYE, B. & RON, C. (eds) 1984. Land Tenure and Rural Productivity in the South Pacific
Islands. Suva: Institute of Pacific Studies, University of the South Pacific..
ADB. 2010. Operational Plan for Sustainable Food Security in Asia and the Pacific. Manila,
Philippines: Asian Development Bank.
AREGHEORE, E. M., HUNTER, D. & BHATI, J. P. 2008. Proceeding of a Regional Workshop
on Improving the Efficiency of Small Scale Dairy Farming in the Pacific (Eds.), School of
Agriculture & Food Technology, University of the South Pacific, Alafua Campus, Samoa.
AREGHEORE, E. M., UMAR, M. & ADAMS, E. (eds.) (2001). Sustainable Ruminant Livestock
Production in the South Pacific Region. Proceedings of the Regional Workshop. Institute
for Research, Extension and Training in Agriculture, University of the South Pacific,
Alafua Campus, Samoa.
BARBOUR, P. & MCGREGOR, A. (1998) ―The Fiji Agricultural Sector‖, Pacific Economic
Bulletin, 13(1):64-81.
BOLASUI, M. 2008. Milk Production and Marketing in Fiji, (a student research project report-
mimeograph), School of Agriculture & Food Technology, University of the South Pacific,
Alafua Campus, Samoa.
EU. 2009. ―Outcome of the High-Level Group on the Competition of the Agro-Food Industry
proposals to increase the Efficiency and Competition of the EU food supply Chain‖,
accompanying document to the communication of the European Commission to the
European Parliament, Commission Staff working Document, Brussels (Com 2009-591).
FAO. 2008. Global Review of Good Agricultural Extension and Advisory Service Practices, by
Burton E. Swanson, Research and Extension Division, Natural Resources Management and
Environment Department and Policy Assistance and Resources Mobilization Division,
Technical Cooperation Department, Food and Agricultural Organization of the United
Nations.
FIBOS. 2008. ‗Census 2007 Results: Population Size, Growth, Structure, and Distribution‘,
Statistical News, No. 45 (October).
FIJI ISLANDS BUSINESS. 2010. ―What‘s Next in Sugar? The inside story on a Sticky Business‖
Journal of South Pacific Agriculture, Volume 15: Nos. 1 & 2, 2011

109
Island Business, October Issue, 2010. (http://www.islandsbusiness.com /archives/
fiji_business/index_dynamic/containerNameToReplace=MiddleMiddle/
focusModuleID=19417/overideSkinName=issueArticle-full.tpl).
FTIB. 2010. ―Fiji's Agricultural Sector Investment Opportunities in Fresh Produce & Agro
Processing‖http://www.businessasia.net/UploadedFiles/Opportunity/agriculture_sector_
profile.pdf.
McGREGOR, A. 1999. Linking Market Development to Farming Systems in the Pacific Islands.
FAO, SAPA Publication, Apia, Samoa.
MINISTRY OF AGRICULTURE. 2010. Agriculture Statistics - Agriculture Imports http://
www.agriculture.org.fj/_resources/main/files/Agriculture%20Import%202008.pdf
MPI. 2010a. Demand Driven Approach (DDA) http://www.agriculture.org.fj/index.cfm?si=
main.resources&cmd=forumview&cbegin=0&uid=dda&cid=857.
MPI. 2010b. Farm Management Manual, Ministry of Primary Industries, Government Building,
Suva, Fiji Islands (http://www.agriculture.org.fj/index.cfm?si=main.resources
&cmd=forumview &uid=manual).
MPI. 2010c. Market Watch, - a dedicated website for market information: (http://www.
agriculture.org.fj/index.cfm?
si=main.resources&cmd=forumview&cbegin=0&uid=moaotherpublications&cid=1224)
MPI. 2010d. Business plan 2010 http://www.agriculture.org.fj/_resources/main/ files/
Agriculture%20Import%202008.pdf.
NACOKE, A. 2007. A Study of Marketing Taro and Kava in Bua Province of Fiji, Research
Project Report, School of Agriculture & Food Technology, University of the South Pacific,
Alafua Campus, Samoa.
NAUDE, W. 2010. ―Entrepreneurship, Developing Countries, and Development Economics: New
Approaches and Insights‖, Small Business Economics, 34(1):1-12.
OXFAM. 2010. ―Learning from Experience Sustainable Economic Development in the Pacific‖,
Oxfam Discussion Paper, July 2010.
PRASAD, A. A. 2008. Economics of Sugarcane Production in Penang Mill Area of Fiji, Research
Project Report, School of Agriculture & Food Technology, University of the South Pacific,
Alafua Campus, Samoa.
PRASAD, B. 2010. ―Global Crisis, Domestic Crises and Crisis of Confidence: Which way
forward for Fiji?‖ Pacific Economic Bulletin, 25(2):1-24.
PRASAD, B. & KUMAR, S. 2000. ―Institutional Rigidities and Economic Performance in Fiji‖, in
Akram-Lodhi, ed. Confronting Fiji Futures, Asia Pacific Press.
QAMAR, M. K 2005. Modernizing National Agricultural Extension Systems: A Practical Guide
for Policy-makers of Developing Countries, Research, Extension and Training Division,
Sustainable Development Department, Food and Agricultural Organization of the United
Nations.
REMUDU, S. 2006. Economic Analysis of Vegetable Production in Fiji: A Study in Sigatoka
Valley. Research Project Report, School of Agriculture & Food Technology, University of
the South Pacific, Alafua Campus, Samoa.
VORELEVU, I. & BHATI, J. P. 2006. ―Gross margins and problems of cattle farmers in Fiji‖,
Journal of South Pacific Agriculture, 13(1/2):55-59.
WARD, R.G. & PROCTOR, A. 1980. South Pacific Agriculture: Choices and Constraints, South
Pacific Agricultural Survey 1979 (eds.), Asian Development Bank, Manila in association
with Australian National University Press, Canberra.
Journal of South Pacific Agriculture, Volume 15: Nos. 1 & 2, 2011
What Ails Rural Economy of Fiji? – Sunil Kumar & Jagdish Bhati

110
Food production and climate change in Pacific Islands Countries and
Territories
Morgan Wairiu1, Viliamu Iese and Murari Lal
ABSTRACT
This paper is a review of climate change trends and projections for the Pacific region and discusses
the implications of climate change for food production. Observed climatic data and climate trends
and projections for the Pacific region are presented and their current impact on food production
and implications for the future are discussed. The climate of the Pacific region is changing and
people are now experiencing increase in intensity or severity of extreme events like cyclones,
storm surges, floods and droughts. These extreme events are causing substantial damage to
agriculture and fisheries and associated infrastructure with negative impact on food production.
Although effects of increasing temperature, changing rainfall patterns, sea level rise, salt water
intrusion, and acidification are less immediate, food production is also under stress from these
climatic factors but it remains difficult to predict the likely outcomes with certainty because of
limited empirical data for the Pacific region.
Key words: Climate change, Food production, Pacific Island Countries and Territories.
INTRODUCTION
There is increasing concern over the
consequences of climate change on food
production amongst the Pacific Island
Countries and Territories (PICTs). Already,
the changing weather patterns is having some
effects soil fertility, pests and diseases,
increased heat stress on plants, changes in
rainfall and soil moisture, salt water incursion
from rising sea-levels and increased damage
on agriculture and crops from extreme weather
events. The fish stocks are also being affected
and migration pathways of some fish have
changed; for example, tuna are being displaced
eastwards in the region and increase in sea
surface temperature and acidification is
causing coral bleaching. The Intergovern-
mental Panel on Climate Change (IPCC) 4th
Assessment Report in 2007 reported with high
confidence that it is very likely that
subsistence and commercial food production
on small islands, including those in the Pacific
region, will be adversely affected by climate
change. Further, the Asian Development Bank
(ADB) 2009 report identified that the PICTs
are amongst some developing countries that
are likely to face the highest reductions in
agricultural potential in the world due to
climate change and Food and Agriculture
Organisation (FAO) (2008) stressed that the
islands and their inhabitants are continuously
exposed to a range of natural hazards,
including cyclones, storm surges, floods,
drought, earthquakes and tsunamis which
threatens livelihood of approximately 9
million people in the region. The impact of
climate change is however complex. As Allen
& Bourke (2009) pointed out, it is difficult to
predict the likely outcomes with certainty
because there is not enough information about
changes in temperature, patterns of rainfall and
rainfall extremes, and furthermore agricultural
and fisheries responses to climate change will
be complex since these sectors represent a
nexus between biological/ecological systems
and social/economic systems which are
difficult to monitor (Secretariat of Pacific
Community - SPC, 2010). It is therefore
important to continue to collate and synthesize
available data and relevant information
because information on food production, in
both agriculture and fisheries sectors
potentially adds to our knowledge on climate
induced changes and provide a basis for future
planning and adaptation strategies for food
production in the Pacific region. This paper
Journal of South Pacific Agriculture, Volume 15: Nos. 1 & 2, 2011
Food production and climate change in PICTs – Morgan Wairiu, Viliamu Iese & Murari Lal
1Pacific Centre for Environment and Sustainable Development, University of the South Pacific, Laucala Campus, Suva, Fiji. Telephone (679) 323 2666, Fax (679) 323 2891, Email: [email protected]

111
present some observed climate trends and their
implications for food production in the PICTs.
Food Production Profile of Pacific Islands
Countries and Territories (PICTS)
The PICTs food production, both
subsistence and commercial is derived directly
from the regions natural environment. On land,
food production practices in terms of size and
agriculture production systems are just as
diverse according the geographical diversity of
the islands. For example, some diverse
agricultural systems include the lowland sago
management in Papua New Guinea (PNG),
systems of intensive dry cultivation of yams in
Tonga, sunken fields dug to tap subsurface
water for giant swamp taro cultivation on
atolls in Kiribati and Tuvalu, and the
remarkable landscapes of irrigated and bunded
pond-fields for growing taro in New Caledonia
and Fiji (Bellwood, 1989). The countries in the
Pacific region are diverse based on their
diverse natural resource base and size. For
example, the larger island countries include
PNG (almost 90 percent of land area),
Solomon Islands, Vanuatu, Fiji, and New
Caledonia. These are mainly volcanic and
generally rich in biological and physical
resources. Some island countries are small
which include Federated States of Micronesia,
Kiribati, Nauru, Niue, and the Republic of the
Marshall Islands, Tuvalu, and Palau). They are
small and have limited natural resources and
poor soils. The remaining countries, for
example, Cook Islands, Tonga, Samoa, and
American Samoa fall in between the two
categories above (McGregor, 2006). The
observed impacts of climate change on food
production in some of the countries and
territories in these three categories are shown
in Table 1. For most small island countries,
fisheries and aquaculture are important
amongst the people in terms of food, culture
and traditions, and further provide economic
income, investments, employment oppor-
tunities and government revenues (FAO, 2010;
Gillett & Cartwright, 2010). Gillett &
Cartwright (2010) also reported that the total
fisheries production from the region in 2007
was worth US$ 2 billion with investments and
employment opportunities that accounted for
19,000 jobs in the processing industries. Any
impact on this sector will be detrimental to
island countries as is evident in most climate
change vulnerable countries like Tuvalu (FAO,
2010).
Almost all subsistence food,
domestically marketed food, and export cash
crops and marine products are produced and
harvested by rural villagers on land and sea
that they access through customary land and
marine tenure arrangements or lease from
traditional land owners. The mix of
subsistence food production and small scale
income generating activities can be broadly
divided into:
domestically marketed food (root
crops, vegetables and inshore fin fish
and invertebrates)
export commodity (tree and root crops
and fish)
minor cash crops (nuts and spices)
livestock
Subsistence food production represents a
major strength of the PICTs economy because
of the ability of people to feed themselves and
support each other during periods of disasters,
loss of cash income, and times of
displacement. Subsistence food production
involve cultivating, harvesting and managing
foods from different environments including
fallow forests, primary forest, swamps and
mangroves and reef systems. Subsistence
crop production can sometimes fail because of
factors such as pressures associated with an
increasing population, diseases, pest and
invasive species outbreaks, and extreme
weather which interrupt with planting cycles
and cause crop damage. Climate change is
now resulting in high frequency and severity
of extreme weather events such as cyclones,
drought, and excessive rainfall which impact
on food production (Jansen et al., 2006).
Observed Changes in Climate, Trends and
Future Projections
Historical climate data for the PICTs is
limited, but there is some evidence of a trend
towards warmer and drier conditions over the
past half century (FAO, 2008). Observed
changes in temperature, rainfall, sea level rise,
ocean acidification, and extreme events are
discussed.
Temperature and Rainfall
The annual and seasonal ocean surface
Food production and climate change in PICTs – Morgan Wairiu, Viliamu Iese & Murari Lal
Journal of South Pacific Agriculture, Volume 15: Nos. 1 & 2, 2011

112
Observed Climate Change Impact on Agricultural and food production:
Group 1
Relatively
larger countries of
Melanesia
Papua New
Guinea
Tuber formation in sweet potato was significantly reduced at temperatures above 34 °
C (Allan & Bourke, 2009, NARI, 2010).
Solomon
Islands
Taro production has been reduced (less tubers and lower yields) in coastal areas over
the years because of wave overtopping and warmer temperatures. Cyclone Namu
wiped out rice industry in 1986 and now import 60,000 tons of rice annually
(Government of Solomon Islands, 2008).
Fiji Islands
Drought and cyclones in 1997 led to a decline of production to 2.2 million tons of
cane and 275 000 tons of sugar from a peak of 4.1 million tons of cane and 501 800
tons of sugar in 1986 (Gawander, 2007). The cane growers‘ direct and indirect costs
from the 2009 flood are estimated to be US$13.4 million. The costs include losses in
cane output, non-cane and other farm losses, and direct and indirect household (Lal et al., 2009).
Vanuatu
Increased temperatures and variability of rainfall resulted in increased pest activities
with yams being the crop most affected and in livestock there was increased incidence
of intestinal problems in cattle often associated with pasture. Some plants flowering
earlier than usual while others are fruiting much later than normal during the past 3–4
years (FAO, 2008).
New
Caledonia
The estimated cost of damage to agriculture by Cyclone Erica in March 2003 was
US$13 million (Terry et al., 2008).
Group 2
Middle –
sized
countries of
Polynesia
Samoa
The increasing threats from new diseases and pests for both livestock and crops are
linked to cyclones, flooding and drought and other variations in climate. The
increasing incidence of forest fires has led to the destruction of crops as evident in the
past forest fires in rural communities (Government of Samoa, 2005).
Tonga Squash crop which had been producing 50% of the country‘s exports by value was
more than halved.
Group 3
Resource
poor micro,
predomina-
ntly atoll, states
Federated
States of
Micronesia
Taro pits on some islands and atolls have been contaminated by salt water associated
with a depletion of fresh-water lenses, extended droughts and saltwater inundation/
intrusion (FAO, 2008).
Kiribati
The pandanus fruit is used by people as long term preserved food but most trees are
lost through coastal erosion due to sea level rise and breadfruit and banana crops
suffer from drought stress resulting in lower yields (GoK, 2007).
Marshall
Islands
During the El Niño season of 1997–1998, there was significant reductions in most
crop yields (FAO, 2008).
Palau
Taro pits on some islands and atolls have been contaminated by salt water associated
with a depletion of fresh-water lenses, extended droughts and saltwater
inundation/intrusion (Burns, 2003).
Tuvalu Groundwater salinisation as a result of sea-level rise is destroying the traditionally
important swamp taro pit gardens (Webb, 2007).
Table 1. Observed climate change impact on agriculture and crop production.
Food production and climate change in PICTs – Morgan Wairiu, Viliamu Iese & Murari Lal
Journal of South Pacific Agriculture, Volume 15: Nos. 1 & 2, 2011
and island air temperatures increased from 0.6
to 1.0 oC since 1910 throughout a large part of
the South Pacific and decadal increases of 0.3
to 0.5 oC in annual temperatures to the
southwest of the South Pacific Convergence
Zone (SPCZ) since 1970 (Folland et al., 2003).
Hay et al. (2003) also reported that sea surface
temperatures in the region have increased by
about 0.4 ˚C. In Fiji, the annual mean surface
air temperature has increased by 1.2 oC since
the reliable records began, representing a rate
of 0.25 oC per decade (Mataki et al., 2006).

113
Manton et al. (2001) and Griffiths et al. (2003)
found trends in extreme daily rainfall and
temperature across the South Pacific for the
period 1961 to 2003. Their analysis show
significant increases in the annual number of
hot days and warm nights, with significant
decreases in the annual number of cool days
and cold nights, particularly in years after the
onset of El Nino and these changes can have
negative impact on plant growth. The extreme
rainfall trends were generally less spatially
coherent than extreme temperatures. Mataki et
al. (2006) also examined the changes in the
frequency of extreme temperature events,
finding that significant increases have taken
place in the annual number of hot days and
warm nights for both Suva and Nadi in Fiji,
with decreases in the annual number of cool
days and cold nights at both locations. The
number of hot days (max. temperature ≥32 oC)
shows a significant increasing trend while the
number of colder nights (min. temperature <
18 oC ) showed a decreasing trend at Suva. It is
predicted that average temperatures are
expected to rise by between 1.0 and 3.1˚C. Air
temperature could increase to 0.90˚C - 1.30 ˚C
by 2050 and 1.6˚C - 3.4 ˚C by 2100 (World
Bank, 2006).
The southern Pacific is now
experiencing a significantly drier and warmer
climate (by 15 percent and 0.8 ˚C,
respectively). The Central Equatorial Pacific,
by contrast, is experiencing more intense rain
(representing a change of about 30 percent)
and a similarly hotter climate (0.6 ˚C). There
has been a small increase over ocean and small
decrease in rainfall over land and since 1970‘s.
An analysis of monthly rainfall patterns at
Goroka in Eastern Highlands Province of PNG
from 1946 to 2002 found that there had been a
shift to longer, but less pronounced, rainy
seasons. Throughout the lowlands and
highlands, villagers report similar changes in
rainfall patterns. These changes are also linked
in part to an increased frequency of El Nino
events (Allen & Bourke, 2009). Observed
rainfall at Nadi from 1941 to 2005 shows a
large inter annual variability with no
significant long term trend but there has been
an increase in the frequency of extreme rainfall
events over recent decades, a trend which is
likely to continue into the future (Government
of Fiji (GoF), 2011). The projected increase in
surface air temperature and rainfall and
predicted rainfall pattern for the Pacific region
are shown in Table 2.
Sea level rise and ocean acidification
Many PICTs are already experiencing
sea level rise. Fifty-years or longer time-series
data for sea-level rise from four stations in the
Pacific reveal that the average rate of sea-level
rise in this sub-region is 1.6 cm a year. Twenty
-two stations with more than 25 years worth of
data indicate an average rate of relative sea-
level rise of 0.07 cm a year (Bindoff et al.,
2007). In Fiji over the period from October
1992 to December 2009, sea level increased by
0.5 cm per year. This is far greater than the
estimated range of global sea-level rise over
the past century, namely 0.1 to 0.2 cm per
year. Projections for sea level rise from the
IPCC 4th Assessment Report, including an
allowance for a dynamic ice-sheet response,
are about 18 to 80 cm by 2100 (Government of
Australia - GoA, 2010).
Sea level rise is also likely to affect
groundwater resources by altering recharge
capacities in some areas, increasing demand
Table 2. Projected increases in surface air temperature and changes in rainfall in Northern and Southern Pacific (Source: IPCC 4AR, 2007).
Journal of South Pacific Agriculture, Volume 15: Nos. 1 & 2, 2011
Food production and climate change in PICTs – Morgan Wairiu, Viliamu Iese & Murari Lal

114
for groundwater as a result of less surface
water availability, and causing water
contamination due to rising sea levels. It is
projected that there will be up to 14 percent
loss of coastal land due to sea level rise and
flooding by 2050 (Feresi et al., 2000), and
these are the prime coastal areas for economic
activities including food production.
The risk of acidification to the many
reef systems throughout the region is also a
major concern. Absorption by the sea surface
of atmospheric CO2, reduced pH and lower
calcium carbonate (CaCO3) saturation in
surface waters are well verified from models,
surveys, and time series data (Feely et al.,
2004; Orr et al., 2005; Doney et al. 2009).
Acidification decreases the capacity of reef
building corals, calcareous algae and many
other key species in tropical ecosystems to
grow calcium carbonate skeletons and shells
(GoA, 2010) and this directly affect food
sources for many people in the region. Ocean
acidification is considered essentially
irreversible over the next century (Poloczanska
et al., 2007). The observed changes in climate,
trends and future projections are summarized
in Table 3.
Extreme events or natural hazards
Historical records on occurrences of
extreme events like cyclones, storm surges,
flooding and drought show that they are
increasing in intensity or severity. Cyclones
are expected to increase in intensity by about 5
–20 percent. Storm frequency is likely to
increase in the equatorial and northern Pacific.
In general, the future climate is expected to
become more El-Nino like, resulting in more
droughts in the southern Pacific and more rain
Journal of South Pacific Agriculture, Volume 15: Nos. 1 & 2, 2011
Factor/Variable Observation Projections/Scenarios
Temperature 0.6 to 1.0 increase since 1910 0.3 to 0.5 decadal increase since
1970
Air temperature could increase 0.9˚ - 1.3˚C by
2050 and 1.6 -3.4˚C by 2100 (Jones et al., 1999).
Rainfall Small decrease over land since
1970‘s Small increase over ocean since
1970‘s
Rainfall could either rise or fall. Most models pre-
dict an increase by 8-10 percent in 2050 and by
about 20 percent in 2100, leading to more intense
floods or droughts
Sea Level Rise Relative sea level rise of 0.6 to 2.0
mm yr-1 since 1950
Sea level could rise 0.2 meters (in the best-guess
scenario) to 0.4 meters (in the worst-case scenario)
by 2050. By 2100, the sea could rise by 0.5-1.0
meters relative to present levels. The impact would
be critical for low-lying atolls in the Pacific, which rarely rise 5 meters above sea level. It could also
have widespread implications for the estimated 90
percent of Pacific Islanders who live on or near the
coast (Kaluwin and Smith, 1997).
El Nino The balance of evidence indicates that El Niño
conditions may occur more frequently, leading to
higher average rainfall in the central Pacific and
northern Polynesia. The impact of El Niño South-
ern Oscillation (ENSO) on rainfall in Melanesia, Micronesia, and South Polynesia is less well un-
derstood (Jones et al., 1999).
Cyclones Noticeable increase in frequency of
category 4 and 5 cyclones since
1970
Cyclones may become more intense in the future
(with wind speeds rising by as much as 20 per-
cent); it is unknown, however, whether they will
become more frequent. A rise in sea surface tem-
perature and a shift to El Niño conditions could expand the cyclone path poleward, and expand
cyclone occurrence east of the dateline. The combi-
nation of more intense cyclones and a higher sea
level may also lead to higher storm surges ((Jones
et al., 1999).
Table 3. Observed and projected temperature, rainfall and Sea level rise for the Pacific region.
Food production and climate change in PICTs – Morgan Wairiu, Viliamu Iese & Murari Lal

115
and consequent floods in the equatorial
Pacific. Hurricane-strength cyclones; those
with winds stronger than 63 knots or 117 km
hr-1 have increased systematically in the
southwest Pacific, a trend that has also been
observed at the global level over the past 30
years (Emanuel, 2005; Webster et al., 2005).
The region now experiences on average four
hurricane-strength cyclones a year.
Impacts of climate change and climate
variability on food production
Climate change has both direct and
indirect effects on food production. The
indirect effects changes in temperature, rainfall
and sea level rise will be complex and remains
difficult to predict the likely outcomes with
certainty but the direct effects from extreme
events like cyclones, drought, floods and storm
surges are obvious.
Agriculture and crops
The direct or immediate impacts of
climate change on agriculture and crop
production occur during or immediately after a
natural hazard or extreme event, such as
damage to crops, farmlands and agriculture
infrastructure from cyclones and flooding. The
World Bank (2006) reported that during the
period 1950 to 2004, about 207 extreme events
were recorded in the Pacific region.. There has
been a substantial increase in the hurricane-
strength cyclones since the 1950s with an
average of four events in a year. The average
cyclone damage during this period was
US$75.7 million in real 2004 value (World
Bank, 2006). In New Caledonia, the estimated
cost of damage to agriculture by Cyclone Erica
in March 2003 was US$13 million (Terry et
al., 2008) while Cyclone Ami that hit Vanua
Levu in Fiji in 2003, caused US$33 million
loss (McKenzie et al., 2005), mainly due to
flood damage of agricultural crops and
infrastructure. In 2004 cyclone Ivy affected
over 80 per cent of food crops in Vanuatu and
cyclone Val in 1991, hit Samoa with
maximum wind speeds of 260 km hr -1 causing
massive damage; equivalent to 230 per cent of
the country‘s real 2004 GDP (World Bank,
2006).
Drought is an extreme form of rainfall
variability can affect the highest number of
people per event. El Niño event in the past has
resulted in water shortages and drought in
some parts of the Pacific (e.g. Papua New
Guinea, Marshall Islands, Samoa, Fiji, Tonga
and Kiribati), and increased precipitation, and
flooding in others (e.g. Solomon Islands, and
some areas in Fiji) (World Bank, 2000). In
Fiji, the 1997/98 drought events resulted in 50
percent loss in Sugarcane production and total
losses in the industry were around US$50
million while other agriculture losses
including livestock death amounted to around
US$7 million (McKenzie et al., 2005). An
extension of the dry season by 45 days has
been estimated to decrease maize yields by 30
to 50%, and sugar cane and taro by 10 to 35%
and 35 to 75%, respectively (Hay et al., 2003).
In Kiribati, breadfruit and banana crops suffer
from drought stress resulting in lower yields
(Government of Kiribati - GoK, 2007). A
drought associated with a severe ENSO (El
Nino-Southern Oscillation) event in 1997
caused significant disruptions to village food
and water supplies in PNG. There were severe
shortages of food and water, with garden
produce declining by 80 percent. Up to 40 per
cent of the rural population (1.2 million
people) were without locally available food by
the end of 1997 (Allen & Bourke, 2001).Crop
production in many PICTs is effected by
extreme drought events.
Increases in minimum and maximum
temperature are already having a small
influence on agricultural production and will
have a greater influence in the future. For
example in PNG, it was observed that tuber
formation in sweet potato was significantly
reduced at temperatures above 34 °C.
Maximum temperatures in the lowlands of
PNG are now around 32 °C, so an increase of
2.0–4.5 °C within a hundred years could
reduce sweet potato production in lowland
areas (National Agriculture Research Institute
- NARI, 2010). In Solomon Islands, taro
production has been reduced (less tubers and
lower yields) in coastal areas over the years
because of wave overtopping and warmer
temperatures (Government of Solomon Islands
- GoSI, 2008). It was also observed that
increase in temperature in PNG highlands has
a severe impact on coffee production from
coffee rust attack. Coffee rust is present in the
main highland valleys at 1600–1800 m and a
Journal of South Pacific Agriculture, Volume 15: Nos. 1 & 2, 2011
Food production and climate change in PICTs – Morgan Wairiu, Viliamu Iese & Murari Lal

116
rise in temperature is likely to increase the
altitude at which coffee rust has a severe
impact on coffee production. Taro blight, a
disease caused by the fungus Phytophthora
colocasiae, also reduced taro yield at higher
altitudes. The fungus is sensitive to
temperature and a small rise in temperature
could increase incidence of taro blight disease
than occurs now. Some tree crops are bearing
at higher altitude in the highlands but the
lower altitudinal limit of some crops, such as
Irish potato, Arabica coffee and karuka
(Pandanus julianettii and P. brosimos), will
increase because of increasing temperatures
(Allen & Bourke, 2009). In Fiji, the major
concern of sugar production is the sporadic
sucrose content in the yield which could be
affected with increase in temperature,
groundwater salinization and fluctuating soil
moisture content. This is a concern because
sugar is a major foreign exchange earner,
accounting for about 40 per cent of the
country‘s merchandise exports and 12 per cent
of Fiji‘s Gross Domestic Product (Gawander,
2007). The scenario for sugar cane production
in Fiji over the next 50 years will be in the
following manner:
47% of the years will have the expected
production of 4 million tonnes,
33% of the years will have half of the
expected production,
20% of the years will have three-quarters
of the expected production.
This was determined when using the period
from 1992 to 1999, when Fiji was subjected to
two El Niño events and an unusually high
number of tropical cyclones as an analogue for
future conditions under climate change. The
outcome under this scenario would be an
overall shortfall in excess of one quarter of
expected production (GoF, 2005).
Hay et al. (2003) pointed out that for
the Pacific region the smaller temperature
increase relative to higher latitude locations is
unlikely to place a severe limitation on crop
production but the physiology of crops may be
influenced in ways not yet identified. Using a
computer software simulation model called
PlantGro, the following patterns were
projected for Taro (Colocassia esculenta) and
yams (Dioscorea sp.) in Fiji (GoF, 2005):
Projected changes in mean conditions
would have little effect on taro
production, with the exception of the
extreme low-rainfall scenario. It is likely
that yam production will also remain
unaffected, although if rainfall increases
significantly, yam yields may fall
slightly.
When El Niño conditions are factored in,
reductions in, production of 30-40%
might be recorded in one out of three
years, with a further one in five years
affected by the residual effects of the
ENSO events.
Agricultural productivity in PICs is heavily
dependent on the seasonal rainfall. About 70%
of the gross cropped area in the Pacific Islands
is geographically located so as to benefit from
rains in the summer season (November –
April). While the rainfall requirements and
tolerance of extremes vary from crop to crop, a
working figure for the south west Pacific is
that a mean annual rainfall of 1800-2500 mm
is optimal for agricultural production and a
mean annual rainfall of over 4000 mm is
excessive (Bourke et al., 2006). A significant
(>50%) increases in rainfall on the windward
side of high islands during the wet season may
increase taro yields by 5 to 15%, but would
reduce rice and maize yields by around 10 to
20% and 30 to 100%, respectively (Hay et al.,
2003). In PNG, most of the rural population
live and cultivate crops in areas where annual
rainfall is in the range 1800–3500 mm. In
mountainous locations where clouds form
early in the day and reduce sunlight, human
settlement and agriculture is generally absent.
Localities where the annual rainfall is more
than 4000 mm tend to be too wet and have too
much cloud cover for good agricultural
production. Yields of sweet potato and other
crops tend to be lower on the southern sides of
the main mountain ranges, for example, in
Southern Highlands Province and mountainous
parts of Gulf Province in PNG. This is because
of both excessively high rainfall and high
levels of cloudiness (Allen & Bourke, 2009).
In Solomon Islands, there has been an
increased incidence of intestinal problems in
cattle often associated with pasture and similar
problems (worm and infections) have been
encountered by the piggery farmers (Solomon
Islands National Adaptation Plan of Action -
Food production and climate change in PICTs – Morgan Wairiu, Viliamu Iese & Murari Lal
Journal of South Pacific Agriculture, Volume 15: Nos. 1 & 2, 2011

117
SI NAPA, 2008).
Climate change predictions for the
region suggest prolonged variations from the
normal rainfall which can be devastating to
agriculture. Shift of rainfall patterns affect
planting time, growing stages, harvest periods,
post harvesting storage and drastically reduce
total yield. Agriculture and crop production is
under stress from these climatic factors but it
remains difficult to predict the likely outcomes
with certainty because of limited empirical
data for the Pacific region. Disruptions to food
production and the economy may intensify in
future, given the projections for more intense
tropical cyclones and precipitation variations
of up to 14 percent on both sides of normal
rainfall (IPCC, 2007) by the end of the
century. More so, in between climate
extremes, altered precipitation and increased
evapotranspiration (including its intensity as
well as temporal and spatial shifts) will also be
of concern as these changes take root. The
increase in atmospheric carbon dioxide may
benefit agriculture but these positive effects
are likely to be negated by thermal and water
stress associated with climate change (Lal,
2004) and changes in pests‘ voracity and
weeds‘ growth; loss of soil fertility and
erosion resulting from climatic variability
being another problem. Increasing coastal
inundation, salinization and erosion as a
consequence of sea level rise and human
activities may contaminate and reduce the size
of productive agricultural lands and, thereby,
threaten food security at the household and
local levels.
The most destructive impact of
excessive rainfall on agriculture infrastructure
and crops are flooding and waterlogging. For
example, flooding during 2004/2005 and
2006/2007 caused around US$76 million and
US$11 million in damages, respectively in
Fiji . The cane growers‘ direct and indirect
costs from the 2009 flood are estimated to be
US$13.4 million. The costs include losses in
cane output, non-cane and other farm losses,
and direct and indirect household income (Lal
et al., 2009)
Sea-level rise is affecting agriculture in
three different ways: Coastal erosion resulting
in loss of land and some areas are permanently
inundated, making it unsuitable for agriculture
production. Some areas are also subjected to
periodic inundation from extreme events,
including high tides and storm waves,
contaminating the fresh water lens, with
devastating effects especially on atolls; and
seepage of saline water through rivers during
dry seasons, resulting in increasing the salt
level in soils. Storm surges and increased salt
water intrusion limits the range of crops that
can be grown. The small atolls in particular
face serious problems for example, pit and
swamp cultivation of taro is particularly
susceptible to changes in water quality. In
Tuvalu, groundwater salinization as a result of
sea-level rise is destroying the traditionally
important swamp taro pit gardens (Webb,
2007) and raises concern on the safety of
drinking water (Tekiene & Paelate, 2000). In
Kiribati, coastal erosion reduces crop
productivity such as of pandanus varieties and
coconut. The pandanus fruit is used by people
as long term preserved food but most trees are
lost through coastal erosion (Government of
Kiribati - GoK, 2007).
Fisheries
Climate variability and the impacts of
extreme weather events means that inshore
fisheries are likely to decline as coral
bleaching increase due to increase in sea
temperature and acidification, and the location
of oceanic species like tuna may become
increasingly unpredictable as there is
reasonable confidence that changed migration
patterns are linked to ENSO events (McLean
& Tsyban, 2001).
In coastal fisheries, the physical
stressors like sea level rise, sea surface
temperature, acidification, ultra violet
radiation and increased rainfall often lead to
impacts on corals and calcareous algae,
seagrass, mangroves, fish and other reef
invertebrates that provide food for the people
(SPC, 2010). For corals, if the bleaching event
is severe and the stressful temperatures persist
for weeks, mortality may reach 100%
(Poloczanska et al., 2007). Coral reefs in
Micronesia and western Polynesia are
considered particularly vulnerable to coral
bleaching (Doney et al., 2005) and declines in
coral cover as a result of disease and bleaching
can have drastic effects on the entire coral reef
ecosystem (Graham et al., 2006). Ellison
Food production and climate change in PICTs – Morgan Wairiu, Viliamu Iese & Murari Lal
Journal of South Pacific Agriculture, Volume 15: Nos. 1 & 2, 2011

118
(2009) observed that three species of seagrass
(Halophila ovalis, Syringodium isoetifolium
and Zostera capricorni) were identified as
being intolerant to ecologically relevant
exposure to thermal stress. The former two
species are widespread in Pacific Islands,
whereas the last species has only been
recorded from Vanuatu. Sea level rise affects
mangroves by retreating landward to maintain
their preferred position in the intertidal zone
and increase surface temperature may change
species composition; changing phenological
patterns (e.g., timing of flowering and fruiting
of the mangroves); increasing mangrove
productivity where temperature does not
exceed an upper threshold (SPC, 2010). In
parts of PNG at least, subsistence fisheries
such as those in the Gulf of Papua and the
Sepik region are dependent on estuarine
species like barramundi (Lates calcarifer),
threadfins and ―croakers‖ (Scienidae) whose
life cycles and year class strengths are related
directly to the timing and volume of
freshwater input to the marine environment
(Staunton-Smith et al., 2004).
By 2050, catch potential in the tropical
Pacific is projected to decrease by up to 42%
from the 2005 level (Cheung et al.,
2009).There is significant data gap on inshore
or coastal fisheries in terms of catch
composition, harvest levels and length-
frequency of the fisheries catch (particular non
-commercial fisheries) in a number of PICTs.
While information in some countries is
adequate, there is scope for improvement and
also scope for introducing effective (but
feasible) monitoring programs in PICTS where
programs are ineffective or lacking appropriate
resolution and/or coverage
The impact on tuna, the most valued
oceanic species in the region is predicted to
include the following (FAO, 2008):
Decline in primary productivity. Primary
productivity in the central and eastern
Pacific could decline due to the increased
stratification between warmer surface
waters and colder, deeper water (and
resulting reduction in upwelling).
Primary production in the western Pacific
could conversely increase.
Decline in tuna abundance. The decline
in upwelling could lead to a decline in the
big eye and adult yellow fin population
(the species targeted by the long line
fleet).
Spatial redistribution of tuna resources.
The warming of surface waters and the
decline in primary productivity in the
central and eastern Pacific could result in
spatial redistribution of tuna resources to
higher latitudes (such as Japan) and
towards the eastern equatorial Pacific.
It was observed during the El Niño years in
2002 and 2003 that the principal tuna stock
moved out of Republic of Marshall Islands
(RMI) waters and congregated more in the
western Pacific around PNG and its
neighboring countries. This led to decreased
catch in RMI. This situation is expected to
reoccur under similar conditions in future
(FAO, 2008). With increase in sea surface
temperature, there also now observed
migration and shift of tuna concentration from
the west and central Pacific to the eastern
Pacific region (Mohanty et al., 2010). The
spatial redistribution of tuna resources will
continue with changing climate.
CONCLUSIONS
Climate change will affect land, forest
recourses and oceans that are important
sources of food for the Pacific Island
population. Changes in temperature, rainfall
regimes, sea level rise and increases
salinization, ocean acidification, more intense
weather-related disasters and changes in
disease and pest can also impact agricultural
and fisheries production. The region is also
experiencing annual and decadal variability in
temperatures and rainfall due to the ENSO (El
Nino/La Nina-Southern Oscillation) cycle.
Observed data so far have shown that extreme
events like cyclones have caused substantial
damage to agriculture and fisheries and
associated infrastructure. Impacts on food
production from increased salinization, coastal
erosion, high rainfall and drought, increased
temperature and ocean acidification have also
been reported for several Pacific Island
countries. There is however great uncertainty
over the quantitative impacts of climate
change on food production due to uncertainties
on climate change projections in the future,
crop responses to the likely changes, and
Food production and climate change in PICTs – Morgan Wairiu, Viliamu Iese & Murari Lal
Journal of South Pacific Agriculture, Volume 15: Nos. 1 & 2, 2011

119
localized climatic conditions in each country.
There is still a great need for more research,
impact assessments and analysis at local level
to be able to ascertain the direct impact on
food production. Because of this situation and
coupled with their exposure and limited
adaptive capacity, PICTs need assistance to
properly adapt to climate change. Adapting to
climate change, variability and sea-level rise is
a serious and urgent need for the PICTs.
Food production and climate change in PICTs – Morgan Wairiu, Viliamu Iese & Murari Lal
References
ASIAN DEVELOPMENT BANK (ADB). 2009. Building climate resilience in the agriculture
sector in Asia and the Pacific. Asian Development Bank, Mandaluyong City, Philippines.
ALLEN, B. J. & BOURKE, R. M. 2009. People, Land and Environment. In: Food and Agriculture
in Papua New Guinea. Bourke RM and Harwood T (ed), ANU E-press, Australia. p28-121.
ALLEN, B. J. & BOURKE, R. M. 2001. The 1997 Drought and Frost in Papua New Guinea:
Overview and Policy Implications. In: Food Security for Papua New Guinea. Proceedings
of the Papua New Guinea Food and Nutrition 2000 Conference, R. M., Bourke, M. G.,
Allen and J. G., Salisbury (eds.). ACIAR Proceedings No. 99. Lae, PNG.
BARNET, J. 2008. Food Security and climate change in the South Pacific. Pacific Ecologist,
14:32-36.
BELLWOOD, P. 1989. The Colonization of the Pacific. In: The Colonization of the Pacific: A
Genetic Trail, (ed.) A.V.S. Hill and S. Serjeantson. pp. 1–59. Available at : http://
www.jrank.org/history/pages/6398/Pacific -Islands-Origins-Food-Product ion-
In.html#ixzz1OYujxANG, accessed 12 May 2011.
BINDOFF, N. L., WILLEBRAND, J., ARTALE, V., CAZENAVE, A., GREGORY, J., GULEV,
S., HANAWA, K., LE QUERE, C., LEVITUS, S., NOJIRI, Y., SHUM, C. K., TALLEY,
L. D. & UNNIKIRSHNAN, A. 2007. Observations: Oceanic climate change and sea level.
In: S. Solomon, D. Qin, M. Manning, Z. Chen, M. Marquis, K. B. Averyt, M. Tignor, and
H. L. Miller, eds. Climate Change 2007: The Physical Science Basis. Contribution of
Working Group I to the Fourth Assessment Report of the Intergovernmental Panel on
Climate Change. Cambridge, UK: Cambridge University Press.
BOURKE, R. M., MCGREGOR, A., ALLEN, M. G., EVANS, B. R., MULLEN, B. F.,
POLLARD, A. A., WAIRIU, M., & ZOTALIS, S. 2006. Main Findings - Solomon Islands
Smallholder Agriculture Study, Volume 1. AusAID, Canberra, Australia.
BURNS, W. 2003. The Impact of Climate Change on Pacific Island Developing Countries in the
21st Century. In: Climate Change in the South Pacific: Impacts and Responses in Australia,
New Zealand, and Small Island States, A. Gillespie, & W. Burns (Eds.), pp 233-250,
Advances in Global Change Research Volume 2, Kluwer Academic Publishers,
Netherlands.
CHEUNG, W. W. L., LAM, V. W.Y., SARIMENTO, J. L., KEARNEY, K., WATSON, R.,
ZELLER, D. & PAULY, D. 2009. Projecting global marine biodiversity impacts under
climate change scenarios. Fish and Fisheries 10:235–251.
DONEY, S. C., FABRY, V. J., FEELY, R. A. & KLEYPAS, J. A. 2009. Ocean Acidification: The
Other CO2 problem. Annual Review of Marine Science, 1:169-192.
ELLISON, J. C. 2009. Wetlands of the Pacific Island region. Wetlands Ecology and Management
17:169-206.
EMANUEL, K. 2005. ‗Increasing destructiveness of tropical cyclones over the past 30 years‘.
Nature, 436:686-688.
FAO. 2010. Pacific Food Security Toolkit: Building Resilience to Climate Change Root Crop and
Fisheries Production, FAO, Rome.
FAO. 2008. Climate change and food security in Pacific Island Countries, FAO, Rome, Italy.
FERESI, J., KENNY, G., DEWET, N., LIMALEVU, L., BHUSAN, J., & RATUKALOU, L.
2000. Climate change and vulnerability and adaptation assessment for Fiji. Waikato
University, Hamilton New Zealand: Pacific Island Climate Change Assistance Programme,
Journal of South Pacific Agriculture, Volume 15: Nos. 1 & 2, 2011

120
Government of Fiji, Suva, Fiji, and International Global Change Institute, p. 135.
FOLLAND, C. K., RENWICK, J. A. SALINGER, M. J., JIANG, N. & RAYNER N. A. 2003:
Trends and variations in South Pacific Islands and ocean surface temperatures. Journal of
Climate., 16:2859-2874.
FEELY, R. A., SABINE, C. L., LEE, K., BERELSON, W., KLEYPAS, J., FABRY, V. J. &
MILLERO, F. J. 2004. Impact of anthropogenic CO2 on the CaCO3 system in the oceans.
Science, 305:362-366.
GAWANDER J. 2007. Impact of Climate Change on Sugar Cane Production in Fiji. WMO
Bulletin, 56(1):34-39.
GILLETT, R. & CARTWRIGHT, I. 2010. The future of Pacific Island fisheries, Secretariat of the
Pacific Community, Noumea, New Caledonia.
GOVERNMENT OF AUSTRALIA (GoA). 2010. Pacific Climate Change Science Program:
Annual Report 1 2009-2010. Canberra, Australia.
GOVERNMENT OF FIJI (GoF). 2011. Draft National Climate Change Adaptation Strategy for
Land-Based Resources (2012 – 2022), Suva, Fiji.
GOVERNMENT OF FIJI (GoF). 2005. First national Communication to UNFCCC, Suva, Fiji.
GOVERNMENT OF KIRIBATI (GoK). 2007. National Adaptation Programme of Action.
Tarawa, Kiribati.
GOVERNMENT OF SAMOA (GoS). 2005. National Adaptation Programme of Action. Apia,
Samoa.
GOVERNMENT OF SOLOMON ISLANDS (GoSI). 2008. National Adaptation Programme of
Action. Honiara, Solomon Islands.
GRIFFITHS, G. M., SALINGER, M. J. & LELEU, I. 2003: Trends in extreme daily rainfall across
the south pacific and relationship to the South Pacific convergence zone. Journal of
Climatology, 23:847-869.
GRAHAM, N. A. J., WILSON, S. K., JENNINGS, S., POLUNIN, N. V. C., BIJOUX, J. P. &
ROBINSON, J. 2006. Dynamic fragility of oceanic coral reef ecosystems. Proceedings of
the National Academy of Sciences USA. 103:8425-8429.
HAY, J. E., MIMURA, N., CAMPBELL, J., FIFITA, S. , KOSHY, K., MCLEAN, R. F.,
NAKALEVU, T., NUNN, P. & NEIL DE WET. 2003. Climate Variability and Change
and Sea-level Rise in the Pacific Islands: Region A Resource Book for Policy and Decision
Makers, Educators and other Stakeholders.Apia, Samoa.
INTERGOVERNMENTAL PANEL ON CLIMATE CHANGE (IPCC). 2007. Climate Impacts,
Adaptation and Vulnerability, Working Group II to the Fourth Assessment Report of the
IPCC. Climate Change 2007. Intergovernmental Panel on Climate Change. Geneva.
JANSEN, T., MULLEN, B. F., POLLARD A. A., MAEMOURI, R. K., WATOTO, C. & IRAMU,
E. 2006. Subsistence Production, Livestock and Social Analysis. Solomon Islands
Smallholder Agriculture Study, Volume 2. AusAID, Canberra, Australia.
JONES, R., HENNESSY, K., PAGE, C., WALSH, K. & WHETTON, P. 1999. An Analysis of the
Effects of the Kyoto Protocol on Pacific Island Countries: Regional Climate Change
Scenarios and Risk Assessment Methods (South Pacific Regional Environment Programme
and CSIRO, Apia).
LAL, M. 2004. Climate change and small island developing countries of the south Pacific. Special
issue on sustainable development. Journal of Contemporary Fiji, 2:15 -31.
LAL, P. N., RITA, R. & KHATRI, N. 2009. Economic Costs of the 2009 Floods in the Fiji Sugar
Belt and Policy Implications. Gland, Switzerland: IUCN. xi + 52..
KALUWIN, C. & SMITH, A. 1997. Coastal vulnerability and integrated coastal zone management
in the Pacific islands region. Coastal Research, 24:95-106.
McGREGOR, A. 2006. Pacific 2020 Background Paper: Agriculture. Australian Agency for
Food production and climate change in PICTs – Morgan Wairiu, Viliamu Iese & Murari Lal
Journal of South Pacific Agriculture, Volume 15: Nos. 1 & 2, 2011

121
International Development (AusAID), Canberra, Australia.
MANTON, M. J., DELLAA-MARTA, P. M., HAYLOCK, M. R, HENNESSY, K. J.,
NICHOLLS, N., CHAMBERS, L. E., COLLINS, D. A., DAW, G., FINET, A.,
GUNAWAN, D., INAPE, K., ISOBE, H., KESTIN, T. S, LEFALE, P., LEYU,C. H.,
LWIN, T., MAITREPIERRE, L., OPRASITWONG, N., PAGE, C. M., PAHALAD, J.,
PLUMMER, N., SALINGER, M. J., SUPPIAH, R., TRAN, V. L., TREWIN, B., TIBIG, I.,
& YEE, D. 2001: Trends in extreme daily rainfall and temperature in southeast Asia and
the south Pacific: 1961-1998. Journal of Climatology, 21:269-284.
MATAKI, M., LAL, M., & KOSHY, K. 2006. Baseline climatology of Viti Levu (Fiji) and current
climatic trends. Pacific Science, 60:49–68.
MCKENZIE, E. KALOUMAIRA, A. & CHAND, B. 2005. The Economic Impacts of Natural
Disasters in the Pacific. Technical Report, University of the South Pacific (USP) and the
South Pacific Applied Geoscience Commission (SOPAC), Suva.
MCLEAN, R. & TSYBAN, A. 2001. Coastal Zones and Marine Ecosystems. In: Climate Change
2001: Impacts, Adaptation & Vulnerability, McCarthy, J., Canziani, O., Leary, N.,
Dokken, D., and White, K. (eds.), Cambridge University Press, pp. 343–380.
MOHANTY, B. P., MOHANTY, S., SAHOO, J. K., & SHARMA, A. P. 2010, Chapter 7 Climate
Change: impacts of fisheries and aquaculture, (In) Climate Change and Variability (Eds.)
Simard SW & Austin ME, Available at: http://www.sciyo.com, Accessed on 11th June
2011.
NARI. 2010. National Agriculture Research Institute Newsletter, Port Moresby, PNG.
ORR, J. C., FABRY, V. J., AUMONT, O., BOPP, L., DONEY, S. C., & FEELY, R. A. 2005.
Anthropogenic ocean acidification over the twenty-first century and its impacts on
calcifying organisms. Nature, 437:681-687.
POLOCZANSKA, E. S., BABCOCK, R. C., BUTLER, A., HOBDAY, A. J., HOEGH-
GULDBERG, O., KUNZ, T. J., MATEAR, R., MILTON, D. A., OKEY, T. A. &
RICHARDSON, A. J. 2007. Climate change and Australian marine life. Oceanography
and Marine Biology: an Annual Review, 45:407-478.
SECRETARIAT OF PACIFIC COMMUNITY (SPC). 2010. Monitoring the Vulnerability and
Adaptation of Pacific Coastal Fisheries to Climate Change. Brisbane, Australia. Available
at:http://www.spc.int/coastfish/dmdocuments/MRAG_AP_SPC_CC_Final_Report.pdf,
Accessed on 15 June 2011.
STAUNTON-SMITH, J., ROBINS, J. B., MAYER, D. G., SELLIN, M. J. & HALLIDAY, I. A.
2004. Does the quantity and timing of fresh water flowing into a dry tropical estuary affect
year-class strength of barramundi (Lates calcarifer)? Marine and Freshwater Research, 55
(8):787–797.
TEKINENE, M. & PAELATE, A. 2000. Tuvalu‘s vulnerability and adaptation assessment.
Government of Tuvalu, Funafuti, Tuvalu.
TERRY, J. P., KOSTASCHUK, R. A. & WOLTING, G. 2008. Features of tropical cyclone-
induced flood peaks on Grande Terre, New Caledonia. Water and Environment Journal,
22:177-183.
WEBB, A. 2007. Assessment of salinity of groundwater in swamp taro (Cyrtosperma
chamissonis) ―pulaka‖ pits in Tuvalu. Pacific Islands Applied Geoscience Commission. EU
EDF8-SOPAC Project Report 75 Reducing Vulnerability of Pacific ACP States.
WEBSTER, P. J., HOLLAND, G. J., CURRY, J. A., & CHANGE, H. R. 2005. ‗Changes in
tropical cyclone number, duration and intensity in a warming environment‘. Science,
309:1844-1846.
WORLD BANK. 2006. Not if but when - Adapting to natural hazards in the Pacific Islands
Region A policy note. The World Bank, East Asia and Pacific Region.
WORLD BANK. 2000. Cities, seas and storms: Managing Pacific Island economies: Vol. IV,
Adapting to climate change. East Asia and Pacific region, Papua New Guinea and Pacific
Island Countries Management Unit: 2000,Washington, DC: World Bank, p. 48.
Food production and climate change in PICTs – Morgan Wairiu, Viliamu Iese & Murari Lal
Journal of South Pacific Agriculture, Volume 15: Nos. 1 & 2, 2011

122
Constraints and gender involvement in relation to canarium nut marketing in
Kakalano and Bitaama areas of Malaita Province, Solomon Islands
Ramona S. Sulifoa1 and Sonny Lameta1
ABSTRACT
Consultations using Participatory Rural Appraisal (PRA) techniques was carried out in the
Kakalano and Bitaama areas of Malaita Province to identify the main constraints encountered by
the communities, which have caused a limitation in the supply of canarium. It was also carried out
to identify the main gender groups involved in the marketing of canarium and the reasons for their
involvement. The results show that a support system was needed to be put in place if canarium
was to be considered a cash crop. Infrastructure and resources needed to be improved as well as
trainings on how to best process the canarium nuts. Reliable market outlets to sell canarium nuts
were to be established to encourage the local women to process the nuts and to encourage the men
to look at canarium as a cash crop and share the processing responsibility with the women.
Key words: Canarium nut, Gender issues, Marketing, Participatory rural appraisal.
INTRODUCTION
The canarium nut is known as ngali in
the Solomon Islands, and has many uses for
the local people; it is a source of food, for
building canoes, as timber, medicine and it is
significant in terms of determining an
individual‘s wealth and status. Furthermore, it
is still used in the bartering system and the
locals sell it in the local market to generate an
income during the fruiting season (Pelomo et
al., 1996; Nevenimo et al., 2008).
Despite estimations made by Wissink
(1996) that the Melanesian region is capable of
producing edible nuts of Canarium indicum
amounting to 2,200,000 tonnes with an annual
potential production of 11,000 tonnes of
kernels, research carried out in Papua New
Guinea (PNG) showed that the demand for the
local markets could not be met (Nevenimo et
al., 2008). Similar findings were found in the
Solomon Islands during the commercialisation
trials carried out. The trials indicated that the
nut is profitable, yet supply, management and
marketing constraints hindered the growth of
the industry (Pelomo et al., 1996; Nevenimo et
al., 2007). Other issues limiting nut supply
was that of the ownership of the nuts and nut
products (Anonymous, 2004; Bunt & Leakey,
2008).
In order to clearly identify the
marketing challenges faced by the different
gender groups, Participatory Rural Appraisal
(PRA) techniques were used to carry out
consultations in two areas of Malaita;
Kakalano and Bitaama. These areas were
selected as the villagers were receptive to
having consultations, they have large areas of
canarium trees and Bitaama area was also
involved in commercialising the canarium nut
before they ceased supply due to difficulties
encountered. The objectives of the
consultations were:
To identify the constraints faced by the
major shareholders in marketing the
canarium nuts.
To study the major shareholders
especially the role played by women in
the collection, processing and marketing
of canarium nuts.
MATERIALS AND METHODS
Location of study
Two areas were selected for the
Participatory Rural Appraisal (PRA) study.
Kakalano and Bitaama were selected because
they contain large areas of canarium trees.
The elders from these areas were also
Journal of South Pacific Agriculture, Volume 15: Nos. 1 & 2, 2011
Canarium nut marketing in Solomon Islands – Ramona Sulifoa & Sonny Lameta
1School of Agriculture and Food Technology, The University of the South Pacific, Alafua Campus, Samoa.
Email addresses: [email protected] [email protected]
Corresponding author: [email protected].

123
receptive to the idea of the PRA. Bitaama was
also one of the main areas where canarium was
commercialised.
Participatory Rural Appraisal (PRA)
Arrangement and Implementation
Participatory Rural Appraisal (PRA)
activities were carried out first in Kakalano
area. Eleven females and thirteen males
attended. PRA in Bitaama was carried out a
couple of days later, eight males and eighteen
females participated.
The participants were divided into two
groups, males and females. Males are usually
more dominant in the Malaitan society, hence
the need to separate the genders so that the
women's constraints could be heard.
Tools Used
Matrix Ranking and Scoring was used
to identify the three major constraints faced by
the gender groups in trying to market
canarium. The problems were prioritised by
individual participants, and ranking of each
problem was carried out using the following
rankings:
5 = most important problem
4 = important problem
3 = slightly important problem
2 = less important problem
1 = least important problem
Pairwise Ranking was used to identify and
compare the major roles played by the
different gender groups in each marketing
activity.
RESULTS
Table 1 lists the problems common
amongst the males and females in the
Kakalano and Bitaama areas of Malaita
Province. The women from Kakalano
identified the nuts were too heavy, cracking of
the nuts and the removal of the shell and testa
as the major problems they faced in terms of
canarium nut marketing. The males from
Kakalano identified their three major problems
as a lack of marketing outlets, harvesting of
the nuts by climbing and the seasonal fruiting
of the trees.
In Bitaama the females saw the three
major problems they encountered were the
lack of markets, secondly they identified that
during the canarium season everyone sold the
nuts hence there were no outside buyers and
finally, processing of the nuts becomes
expensive as many people are required to carry
out the various processing tasks.
The males from Bitaama identified
eight common problems and ranked the lack of
market outlets as being the major problem, the
low prices received for the canarium products
as well as the cracking of the nuts as the major
problems that they encountered with canarium
marketing.
The results in Table 2 show several
reasons why the Kakalano females thought
were the cause of the major problems and what
they identified were possible solutions to the
problems. In Table 2 the females identified
the difficulties they encountered were that the
nuts were too heavy to be carried, this was due
to the far distances that they had to travel with
the nuts, the roads were poor, hence
transportation of the nuts by truck was
impossible. Further to this they also identified
that cracking of the nuts was a slow process
and that the biggest problem was that of hitting
one finger in the process. Finally they
identified that the main reason why the
removal of the shell and testa was a problem
due to a lack of women available to do the job
and that the quantity harvested was great. The
women suggested that possible solutions
would be to ask people to help them carry the
nuts, or the need for machines which would
help them crack the nuts and remove the shell
and testa as well.
This is in contrast to the results put
forth by the males in Table 3 where their
problems were more focused on the climbing
of the trees and the danger involved as well as
the selling of and the seasonal fruiting of the
canarium trees.
The males from the area indicated in
Table 3 several causes of the lack of market
outlets as well as the harvesting of the nuts by
climbing. Several reasons were suggested as
possible solutions such as the need for higher
market prices and that Solomon Islands
Government (SIG) should be more involved in
market research, production and the
reproduction of the tree to try and solve some
of the problems.
The women saw that the main reasons
Canarium nut marketing in Solomon Islands – Ramona Sulifoa & Sonny Lameta
Journal of South Pacific Agriculture, Volume 15: Nos. 1 & 2, 2011

124
why these problems existed were that the SIG
and Non Government Organisations (NGOs)
have not helped them find markets for their
products. Further to that, the middleman has
not been honest with the dealings in relation to
the selling of the canarium nuts. Hence there
was a need for NGOs and the SIG to assist in
terms of finding markets as well as machines
to enable them to produce different canarium
products to target different markets. The
women also required training in processing
canarium into different products. Finally, they
saw that the main cause of canarium nut being
expensive to process was that the nuts
deteriorated rapidly hence they needed to
process many nuts in order to make a decent
Table 1. Ranking and scoring of females and males constraints in relation to canarium nut marketing in the Kakalano and Bitaama areas of Malaita Province.
Total scores of Kakalano
Total scores of Bitaama
Problems
Female Male Female Male
1. Climbing is dangerous. 7 21 - 13
2. Hard to gather the nuts. 15 - 16 -
3. Too much work involved in canarium processing. 5 - 45 -
4. No income from the canarium nuts as there is no place to sell them.
16 25 - 29
5. Nuts are too heavy to carry. 35 - - -
6. Cracking the canarium. 29 12 7 19
7. Stealing of the canarium nuts. 8 13 - -
8. Ownership of the trees (people fight over canarium trees).
7 - - -
9. Expensive to feed people processing the nuts. 14 - 36 -
10. Need many people to process the nuts. 5 - - -
11. Removal of the shell and testa from the kernel. 24 - - 5
12. Not enough trees. - 16 - -
13. Not a commercial commodity as in the case of cocoa and coconut.
- 13 - -
14. Many trees but the quality is low. - 13 - -
15. Low prices. - 16 - 26
16. Fruiting of trees some have high fruiting some have low fruiting.
- 8 - -
17. Canarium fruits seasonally. - 18 - -
18. Lack of people to climb the trees. - - 19 -
19. No one to buy the canarium nuts as most people sell the same product during the canarium season.
- - 37 -
20. Cracking the nuts at night to sell as there is no other time.
- - 15 -
21. Do not know how to roast the canarium kernels to make them last long.
- - 17 -
22. Not enough stones for drying the kernels to enable them to be first grade.
- - 33 -
23. People are hungry during the canarium season - - - 17
24. Smoking of the canarium. - - - 4
25. Collecting bush materials such as bamboo and firewood.
- - - 7
Canarium nut marketing in Solomon Islands – Ramona Sulifoa & Sonny Lameta
Journal of South Pacific Agriculture, Volume 15: Nos. 1 & 2, 2011

125
income. They identified that a possible
solution would be either the individual
processes the nuts herself or share bamboos
with those who assist in the task. These
problems and possible solutions are in Table 4.
Similarly the males from Bitaama also
identified a lack of market outlets as a major
concern, in contrast though to the females
problems, the males identified that cracking of
the nuts was a problem for them and that they
needed machines to be able to carry out this
task.
Results in Table 5 identified the causes
of the three major problems as well as possible
solutions to the problems put forth by the
males of Bitaama. They saw that the SIG and
NGOs were not supporting the communities to
identify markets. For their second problem
they identified that there were too many
canarium nuts being sold hence decreasing the
Canarium nut marketing in Solomon Islands – Ramona Sulifoa & Sonny Lameta
Journal of South Pacific Agriculture, Volume 15: Nos. 1 & 2, 2011
Table 2. Analysis of constraints faced by females in marketing canarium in Kakalano area.
Problem 1: Nuts are too heavy to carry.
Causes of the problem:
1. Trees are planted far away from village. 2. Canarium nuts are too heavy because of the
mesocarp.
3. Road to canarium areas is not good.
Possible solutions:
1. Ask people to help carry the nuts. 2. Make houses in the bush to process the nuts.
3. Only carry the kernels back to village.
Problem 2: Cracking the canarium nuts.
Causes of the problem:
1. Hit your finger when cracking. 2. Cracking is a very slow process.
3. If there are many nuts then it takes a long time
to process them (up to one month).
Possible solutions:
1. Need many people to help crack the nuts. 2. Need a machine to crack the nuts.
Problem 3: Removing the shell and testa.
Causes of the problem:
1. Few women are available to do this work.
2. Too many fruits at one harvest.
Possible solutions:
1. Machine to remove shell and testa from the canarium nuts.
2. Everyone work together.
3. Leave the mesocarp on the fruits to rot before
cracking.
Table 3. Analysis of constraints faced by males in relation to canarium marketing in Kakalano area.
Problem 1: Marketing selling outlets.
Causes of the Ppoblem:
1. Government has not provided any market outlets for canarium.
2. Low market values of the nuts.
3. Not enough research into canarium nut.
Possible solutions:
1. Solomon Islands Governments (SIG) to find commercial markets.
2. Increased local prices.
3. Ministry of Agriculture and Livestock (MAL) should do more research on canarium
production and marketing.
Problem 2: Harvesting/Climbing.
Causes of the problem:
1. Accidents due to climbing. 2. Damage to the tree caused by cutting of the
branches.
3. Delay of next harvest.
Possible solutions:
1. No climbing. 2. Wait for the nuts to fall before picking them off
the ground.
3. No pruning.
Possible solution:
More research into the reproduction of the canarium tree.
Problem 3: Seasonal fruiting.
Cause of the problem:
Natural occurrence of canarium trees.

126
price of the canarium products. Finally
cracking of the nuts was a problem because the
process was slow and one usually ended up
hitting their fingers. As possible solutions they
saw the SIG and NGOs as playing a major role
in identifying markets both locally and
internationally as well as assisting in terms of
new tools or technology which would help
them in the cracking process.
Results in Table 6 show the females‘
Canarium nut marketing in Solomon Islands – Ramona Sulifoa & Sonny Lameta
Journal of South Pacific Agriculture, Volume 15: Nos. 1 & 2, 2011
Table 4. Analysis of constraints by females in relation to canarium nut marketing in Bitaama area.
Problem 1: No market.
Causes of the problem:
1. SIG and NGOs has not helped them find markets for the canarium products.
2. Middleman is not honest to the women‘s
group so they quit supplying the nuts.
3. Leader of the women‘s group is self-seeking
and refused to release any information with
regards to the selling of the canarium.
Possible solutions:
1. NGOs and SIG must look at the marketing side of canarium to assist the women.
2. Provide processing machines to enable them
to produce different canarium products. For example, canarium oil.
Problem 2: Everyone produces the same
product during the canarium season.
Cause of the problem: Making bamboos or selling the canarium kernels
raw or roasted is the only way they know how to
process the canarium nut.
Possible solution: They need training on how to process other
products from canarium nut.
Problem 3: Feeding those people who come to
process the canarium nuts is expensive.
Cause of the problem: They need to process the canarium on time
otherwise the kernels will deteriorate quickly.
Possible solution: Each woman does it herself.
Problem 1: Lack of market outlets.
Causes of the problem:
1. No support from Solomon Islands Government.
2. No support from Non Government Organizations.
Possible solutions:
1. Solomon Islands Government should assist farmers in terms of providing market outlets for
canarium example coconut and cocoa.
2. Need support from Non Government Organisations.
Problem 2: Low Price.
Causes of the problem:
1. Everyone sells the same product; these are heaps of canarium kernels, parcel of canarium
kernels at $0.20-$2.00 each or bamboo at
$10.00-$20.00 each. 2. Plenty of canarium nut available during the
canarium season but there is no place to sell.
Possible solutions:
1. Provide proper local and international markets.
2. Provide more market outlets.
Problem 3: Cracking the canarium nuts.
Causes of the problem:
1. Not enough stone. 2. Accidents by hitting finger. 3. Slow process.
Possible solutions:
1. Need machine. 2. Any new technology to solve canarium nut
processing.
Table 5. Analysis of constraints by males in relation to canarium nut marketing in Bitaama area.

127
responses on their action plan to solve the
three major problems they identified. They
identified the areas where they could achieve
on their own as well as areas where NGOs, the
SIG as well as the Aid Donors could assist.
They mainly requested assistance in terms of
resources to enable them to clean and dry the
canarium nuts.
The action plan and analysis of the
females from Kakalano were similar to those
of the males response from the same area.
There was only so much that the community
could achieve on their own in terms of
processing and finding markets for the
products. Assistance was required from NGOs,
the SIG and Aid Donors in terms of research,
infrastructure and resources for marketing the
nut.
In their action plan and analysis, the
males identified (see Table 7) that they could
not achieve anything on their own in terms of
finding markets for the nut and that the SIG,
NGOs and Aid Donors would need to identify
markets for their canarium products. They also
identified the need for harvesting tools or
machines to limit the problems concerned with
climbing. Furthermore, research was needed to
be carried out by the Ministry of Agriculture
(MAL) in the Solomon Islands as well NGOs
in the area of the reproduction cycle of the
canarium tree.
In Table 8, the females from Bitaama
identified that on their own they would be able
to achieve tasks such as drying the kernels
well so that they can sell it out of season in
order to target the problem of the lack of
markets. In all the situations, they required help
from NGOs and the SIG in terms of resources
Canarium nut marketing in Solomon Islands – Ramona Sulifoa & Sonny Lameta
Journal of South Pacific Agriculture, Volume 15: Nos. 1 & 2, 2011
Table 6. Action plan and analysis for females‘ three major constraints identified in relation to canarium nut marketing in Kakalano area.
Activities What can the women in the
community achieve on their
own?
What help they would need?
Problem 1: Nuts are too heavy to carry.
Ask people to come and help carry the canarium
Ask Member of Parliament to make good roads to the canarium areas.
Problem 2: Cracking the canarium nuts.
1. Pay men to come and do the work.
2. Pay women‘s union to
crack the nuts.
3. Make their own women‘s group to crack the nuts.
Ask Member of Parliament or NGOs for support of a machine which can
clean the nuts.
Problem 3: Removing the shell and testa.
1. Form women‘s group to do the work together.
2. Pay other women‘s group
to come and help.
1. Good to have a machine to clean the nuts.
2. Also need an oven for drying
kernels.
Table 7. Action plan and analysis of the males‘ three major constraints identified in relation to canarium nut marketing in Kakalano area.
Activities What can the community
achieve on their own?
What help they would need?
Problem 1: Marketing and selling outlets.
Nothing. Solomon Islands Government and NGOs to assist in finding local and
commercial markets for canarium.
Problem 2: Harvesting and climbing of the trees.
Encourage only picking. 1. Harvesting tools 2. Machines
Problem 3: Seasonal fruiting of the trees.
Men can do nothing. More research needed into the production and marketing side of
the nut from MAL and NGOs.

128
such as good ovens to dry their kernels and
good packaging material for packaging the
nuts. They also need support on trainings on
how to process the canarium into other
products and they required assistance in terms
of a nut cracker to enable them to crack the
nuts.
Similarly the males from Bitaama also
identified that their community needed
assistance from the SIG and NGOs in terms of
identifying markets for their products as well
as resources to assist them in the different
processing stages of the nut especially
cracking of the nut.
In their action plan and analysis (see
Table 9), the males requested that the SIG and
NGOs needed to assist the local communities
to identify markets for their products, and that
research should be carried out in the area of
the seasonal fruiting of the nuts. Further to this
they also requested for machines which would
assist them in cracking the canarium nuts.
The ranked response by the Kakalano
females in Table 10 identifies the married men
as being the major groups involved in
climbing the canarium trees, cracking the nuts
as well as packing the kernels. Married women
were identified as the main group involved in
gathering and carrying of the nut. They were
also the main gender group involved in the
removal of the shell and testa as well as the
storing and selling of the nut.
The women from Kakalano saw the
men as the main climbers of the tree because
in the Malaitan culture, women were not
allowed to climb any trees. In terms of
Journal of South Pacific Agriculture, Volume 15: Nos. 1 & 2, 2011
Canarium nut marketing in Solomon Islands – Ramona Sulifoa & Sonny Lameta
Table 8. Action plan and analysis of females‘ constraints in relation to canarium nut marketing in Bitaama area.
Activities What can the community
achieve on their own?
What help they would need
Problem 1: No market. Women must work together to dry the kernels well to make
them last long so they can try
to sell out of season.
They need assistance in terms of materials from NGOs and the SIG; i.e.
a. storage containers for the kernels.
b. good oven to dry the kernels to
achieve quality kernels. c. packing bags for the kernels to retain
their quality.
Problem 2: Same product. Nothing Training on ways to make new canarium products.
Problem 3: Expensive to feed people that come to
help process the canarium
nuts.
Each woman will try to crack the nuts herself.
Assistance is needed from NGOs and the SIG in terms of materials, to help them
process the nuts example a machine to
crack the nuts.
Table 9. Action plan and analysis of male constraints in Bitaama area in relation to canarium nut marketing.
Marketing activities What can the community
achieve on their own?
What help they would need
Problem 1: Marketing outlet.
Nothing 1. SIG/NGOs should assist by providing market outlets.
2. MAL should do more work
(research) on seasonal
marketing.
Problem 2: Low price. Just collect to eat. Provide more market outlets.
Problem 3: Cracking
By getting more labour to crack the nuts.
1. Need machine. 2. Any new technology which
can be used to process
canarium nut.

129
cracking the nuts the men were seen as being
free to carry out this task as the women would
be busy with shelling and removal of the testa.
Packing the kernels, the men were seen as
strong and had the ability to do this. With all
the other tasks, they were seen as either easy
tasks or in their culture it was just the
women‘s task such as carrying the nuts.
In Table 11, the males from Kakalano
saw that harvesting by climbing was mainly
the young men‘s job, whereas the married men
were the main ones who did the cracking,
packing and storing of the nuts. The married
women were the main ones involved in
harvesting the nuts by gathering, removal of
the shell and testa as well as selling of the
nuts. In this situation the males identified all
gender groups as being the main carriers of the
nuts.
When asked to identify the reasons for
their selection of the specific gender groups,
the males responded that the young men were
skilled, strong and had the ability to do the job
identified as their own. This was also the same
case why they identified the tasks which
requires less work as that of a women‘s task.
In regards to selling the nuts, the males saw
the women as having the right personality, and
that they are honest and would bring the
money back for the family.
The females from Bitaama identified in
Table 12 that the married women was the main
gender group involved in all tasks related to
canarium marketing except harvesting by
climbing, cracking and packing of the nuts
which fell to males.
Tasks such as climbing the canarium
trees required someone with skill and strength.
The tasks identified as the females required
patience, and efficiency to ensure that the task
was completed thoroughly. Women also saw
themselves as the main gender that had the
Journal of South Pacific Agriculture, Volume 15: Nos. 1 & 2, 2011
Canarium nut marketing in Solomon Islands – Ramona Sulifoa & Sonny Lameta
Table 10. Ranked response from the Kakalano female community comparing gender involvement for the canarium marketing activities.
Gender
group
Harvesting
(Climbing)
Harvesting
(Gathering)
Carrying Cracking Shell & testa
removal
Packing Storing Selling
Married Women 3 1 1 3 1 2 1 1
Young Women 3 2 2 4 2 3 2 3
Married Men 1 3 2 1 3 1 3 2
Young Men 2 4 1 2 4 2 4 4
Children 3 5 3 5 5 4 5 5
Table 11. Ranked response from the Kakalano male community comparing gender involvement in the different canarium nut marketing activities.
Gender
group
Harvesting
(Climbing)
Harvesting
(Gathering)
Carrying Cracking Shell & testa
removal
Packing Storing Selling
Married Women 3 1 N
o c
om
pariso
n m
ad
e. E
very
one ca
rries the n
uts
3 1 2 2 1
Young Women 3 2 4 2 4 3 1
Married Men 2 3 1 5 1 1 2
Young Men 1 4 2 3 3 4 3
Children 3 5 5 4 5 5 4

130
right personality to sell the product and they
were trusted to bring the money back for the
families needs.
Table 13 shows the response of males
in terms of gender involvement in the
canarium marketing activities. The males in
the community said that harvesting by
climbing and packing of the nuts was the job
of the males, whereas the females were
identified as the main gender groups behind all
the other tasks. The males in the community
saw carrying of the nuts as a job which is done
by everyone.
Men are the main ones who climb trees
in the Malaitan culture because they are not
only strong and skilled at the job but their
culture does not allow women to climb trees.
Packing required someone skilled hence the
males identified themselves as the main ones
to carry out this task. All other tasks were seen
as simple and specific to women.
DISCUSSION
The women‘s results in Kakalano
(refer to Table 1) showed that their constraints
focused on areas seen as women‘s duty such as
the removal of the shell and testa and carrying
of the nuts. On the other hand, women in
Bitaama were more commercial oriented in
their answers (refer to Tables 1 and 8.)
This contrast indicates the situation on
both sides. From observations, women from
Kakalano area were not dependent on
canarium for an income. These women have
gardens closer to their houses in comparison to
Journal of South Pacific Agriculture, Volume 15: Nos. 1 & 2, 2011
Canarium nut marketing in Solomon Islands – Ramona Sulifoa & Sonny Lameta
Table 12. Ranked response from the Bitaama female community comparing gender involvement in canarium marketing activities.
Gender
group Harvesting
(Climbing)
Harvesting
(Gathering) Carrying Cracking
Shell &
testa
removal
Packing Storing Selling
Married
Women 3 1 1 2 1 2 1 1
Young
Women 3 2 2 3 2 3 3 2
Married
Men 2 4 3 1 4 1 2 3
Young
Men 1 3 4 3 3 3 4 4
Children 3 4 5 4 5 3 5 5
Table 13. Ranked response from the Bitaama male community comparing gender involvement in canarium marketing activities.
Gender
group Harvesting (Climbing)
Harvesting (Gathering)
Carrying Cracking Shell &
testa
removal
Packing Storing Selling
Married
Women 3 1
No c
om
pariso
n m
ade.
Ev
eryo
ne ca
rries the n
uts
3 1 3 1 1
Young
Women 3 2 4 2 4 3 2
Married
Men 2 3 1 3 1 2 3
Young
Men 1 4 2 4 2 4 4
Children 3 5 5 5 5 5 5

131
women from Bitaama who have to walk
several hours before reaching their gardens on
the hilltops. Kakalano‘s land areas are also
flatter in comparison to Bitaama areas.
Women from Kakalano are able to make
money from what they grow in their gardens
such as slippery cabbage and sweet potato,
whereas women from Bitaama are heavily
dependent on a cash economy to support them.
Most of the fertile soils close to their homes
have been covered with cash crops thus,
leaving those areas on the hill tops to be
planted with their gardens for their day to day
living (Sechrest, 2008).
Men‘s results from both Kakalano
(refer to Table 3) and Bitaama (refer to Table
5) were commercial oriented. To the men from
both areas, canarium was no longer considered
a cash crop due to the lack of markets
available as well as the low prices received
(refer to Tables 7 and 9). The males‘ attention
was more focused on cash crops such as cocoa
and copra which are currently the main
revenue earners for the rural areas in Malaita
Province (Jones et al., 1988; Sechrest, 2008).
In fact, the male community from Kakalano
mentioned that canarium needs to become a
commercial commodity such as cocoa and
copra before they will take an interest in it
(refer to Table 1).
Although the males from both areas
mentioned that carrying the nuts was the
responsibility of all genders (refer to Tables 11
and 13) the females from Kakalano identified
this task as the major constraint they faced due
to the heavy weight (refer to Table 1). This is
because the trees are planted far away from the
village. The nuts are heavy because the
mesocarp is intact and the roads are not good.
When women decide to harvest the canarium
trees, they would need to get up early in the
morning and start their two-three hour walk to
the bush. They would harvest the canarium by
gathering (Nevenimo et al., 2008) if there was
no one to climb. They would then carry back
around a 40kg weight of canarium nuts with
the mesocarp intact through the bush and back
to the village for further processing. In
Kakalano area, they would need to cross the
river several times before reaching the place of
harvest and take the same route back to the
village. This would mean that if there was
much rain, the rivers would be flooded and
they would not be able to harvest the trees as
the canarium season usually coincides with the
wet season. This is why the women from
Kakalano suggested to ask others for help to
carry the canarium, or they could make houses
in the bush to enable the canarium to be
processed. This was done in the past (Pelomo,
1996) to enable them to only carry the kernels
back to the village.
From observations, building houses in
the bush for processing was a sound idea in the
past due to the fact that everyone worked
together on this. Nowadays, women who have
become the leading processors in canarium
would also need to take into account their
other duties as mothers if this is to happen.
Moreover, the distance that they travel to
harvest the canarium nuts will reduce their
productive capabilities.
Cracking of the nuts was seen to be
another problem (Nevenimo et al., 2007) for
the women in Kakalano due to their
inexperience with this task (refer to Table 1).
This task was seen in the past to be the male‘s
job (Pelomo et al., 1996) but, due to the
current situation with the lack of markets for
the canarium nuts, men have ceased to be
involved much with the canarium process
leaving the task for women to do. Hence,
women have taken up a task which was seen to
be the men‘s duty and they are inexperienced,
making it difficult for them. An experienced
and strong person would hit the nut once and it
would crack (Pelomo, 1996), an inexperienced
person would take several shots before the
mesocarp and shell would break, hence
increasing the chances of hitting ones finger
would be greater. Women from Kakalano
mentioned in their possible solutions that they
could use many people to crack the nuts or
they could use a machine to crack the nuts
(refer to Table 2). The same solutions were
identified by the males in the Bitaama
community.
In Kakalano, the women also saw the
removal of shell and testa as another problem.
This was due to the fact that there are few
women available to do the work and the
number of fruits harvested at one time is great
(refer to Table 1). This is why the women have
suggested that either everyone work together
Journal of South Pacific Agriculture, Volume 15: Nos. 1 & 2, 2011
Canarium nut marketing in Solomon Islands – Ramona Sulifoa & Sonny Lameta

132
or they could use machines to clean the nut
(refer to Table 2). Similar comments were
made by farmers in Papua New Guinea during
a survey carried out there by (Nevenimo et al.,
2008).
The community members from both
areas saw that the main reasons behind the
lack of markets for them was that the SIG and
NGOs have not helped them find markets.
They have also experienced problems with the
middlemen being dishonest with them and
refusing to release information on the sales of
the canarium nuts (refer to Table 4).
Developing a good relationship between the
supplier and the middleman is a vital point as
this causes an inconsistency in the supply of
the nuts if one party does not trust the other
(Long Wah, 1996). The women suggested that
NGOs and SIG need to look at the marketing
side of canarium to assist the women. The
women also suggested that being able to
process the canarium into other products such
as canarium cooking oil would help them
target other potential markets for their product.
This would also solve their second problem of
everyone producing the same product during
the canarium season. The women in Bitaama
have very limited knowledge on how to
process the canarium into any other product as
they are only aware of roasting them in
bamboos or roasting and selling the kernels as
they are. This is why they suggested that they
needed training to enable them to process the
canarium into other products (refer to Tables 4
and 8). Due to the problem of low prices, the
makes in the community saw it was better to
eat the nuts and not worry too much about
selling them (refer to Table 9).
The third major problem faced by the
women in Bitaama (refer to Table 8) was that
it was expensive to feed those who came to
help process the canarium nuts. This was also
listed by the Kakalano women as a constraint
they faced (refer to Table 1). The female
community in Bitaama said that the main
reason for this problem was that they had to
process the canarium on time otherwise the
kernels would deteriorate. They also needed to
process many nuts in order to be able to make
a reasonable income from it. As a solution to
this problem, they mentioned that they needed
to do this as individuals if they are to save on
the cost of feeding everyone. Furthermore,
they suggested that instead of feeding those
who came to do the work, they could share the
bamboos with them (refer to Table 4 and Table
8). Hence, this would mean a reduction in the
number of bamboos that they had to sell or use
for food for their family as it has become a
main protein source (Pelomo, 1994; Nevenimo
et al. 2007; Bunt & Leaky, 2008).
Both genders in both communities
mentioned that cracking the nuts was a
problem, with some stating it as the biggest
problem faced. They have all mentioned the
need for nut crackers or machines which can
help them process the nuts to make the work
faster, which will allow them to process more
nuts if they are to receive a reasonable income
for them and to reduce the problem of hitting
their fingers (refer to Tables 1, 6, 8 and 9).
Interestingly though, a processor in Vanuatu
found that cracking the nuts by hand was more
efficient compared to a mechanical nut cracker
(Long Wah, 1996). Furthermore, comercia-
lisation trials carried out by CEMA also
indicated that an experienced person can crack
the nuts faster compared to a mechanical nut
cracker (Pelomo, 1996).
There were two main ways of
harvesting canarium nuts in Malaita. By
climbing the trees or by gathering the nuts off
the ground. These were also the same methods
mentioned by Nevenimo et al. (2008) during
the research carried out in PNG. In both
Kakalano and Bitaama, all members in the
community ranked the young men as the main
gender group involved in climbing the
canarium trees. Reasons given are the young
men are not only strong and skilled at doing
this job, but it is not allowed ―taboo‖ in their
culture for a woman to climb a tree (Pelomo,
1996). For gathering the nuts, the communities
gave similar responses in that the married
women are the leading gender group in this
activity. Reasons given by men and the women
from Kakalano were similar in that it was not
only an easy job, but it was the woman‘s duty
to gather the nuts. Females from the Bitaama
area on the other hand said that women do this
job not only willingly but thoroughly. The
biggest problem seen in gathering the nuts was
the number of ants present on the fruits and
branches which fell from the tree. This can
Journal of South Pacific Agriculture, Volume 15: Nos. 1 & 2, 2011
Canarium nut marketing in Solomon Islands – Ramona Sulifoa & Sonny Lameta

133
make collection of the nut very unpleasant.
Carrying of the nuts was seen by the
males from both communities as the job of the
whole family whereas women from Bitaama
on the other hand saw the married women as
the main gender group involved in this task,
whereas women from Kakalano saw them-
selves and the married men‘s group as the
main genders in this role. The women from
Bitaama said that the women were strong to do
this task and they knew how to carry large
bags using a rope. They mentioned the fact
that the men would be too tired from climbing
the trees hence the task of carrying the nuts
would be up to them. Similarly, women from
Kakalano thought the same idea (Tables 1 and
6). They saw the men as the main person in
organising all the harvesting and carrying
activities and their job as the women was to
carry the nuts as they have the strength for
this.
A task such as the cracking of the nuts
was fell on the married men due to their
experience at this task and their strength.
Tasks such as shell and testa removal were
seen by the members from all the communities
to be the married women‘s task. However, the
reasons given by the males and females from
the communities differed with the males
looking at the ease and simplicity of the task
whereas the women saw it as a task that
needed willingness to do and thoroughness to
ensure that the kernel is cleaned properly.
Married men were seen by all members
of the communities to be the main gender
group involved in the storage of the canarium.
This involves packing the kernels into
bamboos which requires a skill as the bamboo
needs to be filled properly to ensure that the
kernels are tightly packed.
Selling was seen by all members of
both communities as the married women‘s job
closely assisted by either the married men or
the young girls. The main reason why women
took the lead in selling the product was
because they are patient and have acquired the
skill to sell the product. What was interesting
to note was the fact that the males in the
community saw the women as being honest in
selling the product. Women would bring back
the money to be used on the family‘s needs.
The young men and young women
were seen to closely assist either the married
men or the married women in all the tasks
specified except for selling the canarium
where some of the communities saw these
gender groups as irresponsible when it came to
selling the product. Children on the other hand
were discouraged from helping out in most of
the activities mainly because they have a habit
of eating the canarium kernels (refer to Tables
10, 11, 12 and 13).
The main constraint faced during the
PRA was the lack of communication from the
women from Kakalano area. It took much
encouragement for them to voice their
concerns and problems with regards to the
canarium nut. Furthermore, it was difficult to
arrange a time for the women to be free to
carry the PRA out as the women were usually
busy either with their family‘s day to day
running or with their gardens. This was the
reason why the communities needed to be
compensated with money and food for the
time that they lost with their daily money
making activities.
CONCLUSION AND
RECOMMENDATIONS
In the past the processing and all
marketing activities of canarium was family
oriented due to the importance of canarium nut
in the traditional economy. However, with the
introduction of the cash economy, men in the
area have moved towards cash crops with
canarium eventually being left out due to the
lack of markets, the low prices received for the
products and the hard work required to process
the nuts. Therefore, processing of the nuts was
now seen to be left for women to earn an
income for the family, or for home
consumption.
This has given rise to married women
facing many challenges in relation to
processing the canarium. This includes
gathering the nuts, the distance travelled to
carry the nuts, hence reducing their production
capabilities. Cracking the nuts as well as
cleaning the kernels were also constraints
faced. Furthermore, the women have
mentioned the lack of skills they had in
processing the canarium into other products
apart from the ones that they are used to. If
they could process the nuts into other products,
Journal of South Pacific Agriculture, Volume 15: Nos. 1 & 2, 2011
Canarium nut marketing in Solomon Islands – Ramona Sulifoa & Sonny Lameta

134
it would help them earn a better income.
Women have taken on the leading role in areas
which have been clearly defined in the past as
the men‘s duty. This has led them to find
problems with these tasks due to their
inexperience.
Both the males and females in the
communities also mentioned the need for
processing machines to crack and clean the
nut. This would enable them to process more
canarium nuts and save on the expense of
feeding those who come to help with the
processing.
From these results, it can be
recommended that SIG, NGOs and Aid
Donors need to provide support to the local
communities in Malaita in terms of research,
training, resources but more importantly
market outlets for the canarium products
currently being produced by the local
communities.
This will encourage women to process
more nuts as individuals or as groups.
Furthermore, this would encourage the males
in the community to take an interest in
canarium as a commercial crop which would
mean men would be able to share in the
processing of the nut reducing the work load
for the local women. If both the males and the
females in the community could work together
they would be able to process more nuts to
increase its supply.
Journal of South Pacific Agriculture, Volume 15: Nos. 1 & 2, 2011
Acknowledgements
Without the strength and guidance from the Almighty Father, I would not have been able to carry
out this work. Without the funding support from the Australian Centre for International
Agriculture Research (ACIAR) and the Faculty of Business and Economics (FBE) at the
University of the South Pacific (USP), this research would not have been possible. A big
appreciation to Dr. Sonny Lameta, Dr. Mark Johnson and Mr. Aaron Kama for their comments
before the PRA implementation as well as on the results. To the chiefs, but most of all the villagers
of Bitaama and Kakalano, thank you very much for your cooperation on the consultations. To my
family in the Solomon Islands, especially my husband and parents in-law, thank you for all your
help in organising the consultations with the villagers. Thank you to my father for proof-reading
this article. To all those who have not been acknowledged but have contributed to this research, all
your help is much appreciated.
References
ANONYMOUS. 2004. Treatment of arthritis and other similar conditions - US Patent 6395313.
www.patentstorm.us/patents/6395313/claims.
BUNT, C. & LEAKEY, R. 2008. Domestication potential and marketing of Canarium indicum
nuts in the Pacific: commercialisation and market development. Forest Trees and
Livelihoods. 18:271-289.
JONES, S., FLEMING, E. & HARDAKER, J. 1998. Smallholder Agriculture in Tonga: Report of
the South Pacific Smallholder Project in Solomon Islands: 1985-86. South Pacific
Smallholder Project. Armidale, Australia: University of New England.
NEVENIMO, T., JOHNSTON, M., BINIFA, J., GWABU, C., ANGEN, J., MOXON, J. &
LEAKEY, R. 2008. Domestication potential and marketing of Canarium indicum nuts in
the Pacific: Producer and Consumer Surveys in PNG (East New Britain). Forest Trees and
Livelihoods, 8:253-269.
NEVENIMO, T., MOXON, J., WEMIN, J., JOHNSTON, M. & LEAKEY, R. 2007.
Domestication potential and marketing of Canarium indicum nuts in the Pacific: 1. A
literature review. Agroforestry Systems, 69(2):117-134.
PELOMO, M. 1994. Benefits and risks of commercialising NWFPs: The case of Canarium nuts in
the Solomon Islands, Social, Economic and Cultural Dimensions of Non-wood Forests
Products, Food and Agriculture Organisation (FAO).
PELOMO. P. M., BARASI. R. N., LILOQULA. R. & ROPOSI, N. 1996. Canarium nut and oil
Canarium nut marketing in Solomon Islands – Ramona Sulifoa & Sonny Lameta

135
marketing in Solomon Islands. In: Stevens, M. L., Bourke, R. M. & Evans, B. R. (eds.),
South Pacific Indigenous Nuts, 118-121, ACIAR Proceedings No. 69. ACIAR, Canberra,
Australia.
SECHREST, E. K. 2008. Agroforesty practice adoption among Solomon Island women on the
island of Malaita. Thesis for the Master of Science in Sociology, Utah State University,
http://digitalcommons.usu.edu/etd/187.
WAH, C. L. 1996. Marketing indigenous nuts in Vanuatu - A private enterprise perspective. In:
Stevens, M. L., Bourke, R. M. & Evans, B. R. (eds) 79, South Pacific Indigenous Nuts,
ACIAR Proceedings, No. 69. ACIAR, Canberra, Australia.
WISSINK, D. 1996. Galip (Canarium indicum) as cash crop in West New Britain, Papua New
Guinea: Experience of the Kandrian Gloucester Integrated Development Project. In:
Stevens, M. L., Bourke, R. M. & Evans, B. R. (eds.), South Pacific Indigenous Nuts, 84-91,
ACIAR Proceedings No. 69. ACIAR, Canberra, Australia.
Canarium nut marketing in Solomon Islands – Ramona Sulifoa & Sonny Lameta
Journal of South Pacific Agriculture, Volume 15: Nos. 1 & 2, 2011

136
Journal of South Pacific Agriculture, Volume 15: Nos. 1 & 2, 2011
Guide for authors
GUIDE FOR AUTHORS
The Journal of South Pacific Agriculture (JOSPA) welcomes papers that can contribute to the development of agriculture and allied industries in the Pacific Islands.
TYPES OF CONTRIBUTIONS The following types of contributions will be considered, on priority basis, for publication in JOSPA: i. Original high-quality research papers of relevance to agriculture in the South Pacific region. ii. Review papers on topics of relevance to agriculture in the South Pacific region.
iii. General papers based on agricultural research carried out in the South Pacific region and aimed at extension workers and agricul-tural teachers/trainers in the region.
iv. Short communications of relevance to agriculture in the South Pacific region. v. Research papers on the processing of agricultural produce, floriculture, and other agro-allied topics that can contribute to sustain-
able livelihoods for people in the Pacific Islands.
Reviews This section is mainly for reviews of new books relevant to the areas covered by JOSPA. Reviews can also cover other areas, such as
relevant CD-ROMS, computer packages and, where appropriate, conference/workshops. The format for reviews should follow those in past issues of JOSPA.
REPEAT OF EXPERIMENTS AND ANALYSIS Papers that report original research should only be submitted if the experiments have been repeated at least twice, with a minimum of three replications per experiment. Appropriate statistical analysis is required. Exceptions may be made to these requirements if they
are justifiable. The final decision rests with JOSPA.
PREPARATION OF MANUSCRIPT
Electronic format: Manuscripts should be prepared electronically in MS Word.
Language:
Manuscripts must be written in English (U.K.). Authors who are not very proficient in English are strongly advised to have their manuscript proof-read by someone who is proficient in English prior to submission.
Use of local names of things should be avoided. But if any must be used, it should be typed in italics and enclosed in inverted
commas. A brief explanation of what the term stands for should be given in parentheses at first mention. Paper size, margin, length of manuscript: Manuscripts should be double-spaced on one side of A4 paper with a 2.5 cm margin on all sides. The length of the manuscript should not exceed 5000 words, excluding references, figures and tables.
Organisation of manuscript: The arrangement of the various components of the manuscript should follow this order:
Title (should be clear, informative, not too long, capitalize first word and proper names only, no full stop, Times New Roman size
14, bold type)
Name(s) of author(s) (first name, initials, surname, Times New Roman size 12, not bold)
Full address(es) of author(s), including organisational affiliation(s), telephone, email and fax number (if available) of the corre-sponding author (provide all as footnotes)
Abstract (should be clear, descriptive, no formulae, no common names of biota, no trade names of pesticides, no acronyms, not exceeding 250 words, single paragraph)
Key words (3 – 6 items)
Introduction
Materials and Methods
Results
Discussion
Conclusion
Acknowledgements
References
Appendices (if necessary)
Note: Illustrations (photographs, line drawings, etc.) should be included only if they clarify the text.
Length of paper, font, line spacing, margins, paragraph style:
Full length research papers should not exceed 5000 words (excluding abstract, list of references, figures and tables), Times New Roman size 12 only, double line spacing within paragraph (except in tables), single column, justify.
Bold and capitalize main titles (i.e. Abstract, Key Words, Introduction, Materials and Methods, Results, Discussion, Conclusion, Acknowledgments, References), do not number them.
Space before and after a main title in the body of the manuscript should be 12 points.
Indent first line to indicate a new paragraph (do not use space to separate paragraphs).
Author(s) may use subtitles for sub-components under a main title within the main body of the manuscript (use sentence case, bold
type, no underlining).
Author(s) may use second-level subtitles under first-level subtitles (use sentence case, italics, do not bold or underline).
Author(s) may use third-level or fourth-level subtitles (sentence case, may use letters or numerals to number subtitles, use italics, do not bold or underline).
No space after subtitles (indent the first line of each paragraph).
Do not indent main titles or subtitles.
Avoid using long sentences and paragraphs. Avoid beginning a paragraph with words like: And, But.

137
Journal of South Pacific Agriculture, Volume 15: Nos. 1 & 2, 2011
Guide for authors
Short communications:
This applies to research that can be covered in short research note format.
Should not exceed 2000 words (excluding abstract, list of references, figures and tables).
A short abstract summarising the main findings is required (not exceeding 100 words, single paragraph).
Key words (3-6) are required.
The body of the text may be in continuous form, or organised under a selection of main titles (see ‗organisation of manuscript‘).
A list of references is required. Should adhere to other general formatting as outlined in this guide. International System of Units (SI):
Use SI units (i.e. modern metric system).
Use standard abbreviations for units that follow numerical values (e.g. 25 cm, instead of 25 centimetres), unless otherwise consid-ered more appropriate.
With the exception of angles and hyphenated use, always leave a space between a numerical value and the unit symbol following it. Examples of correct use:
(100 g, not 100g); (37 °C, not 37°C); (‗a 10-m tall tree‘, not ‗a 10m tall tree or a 10 m tall tree‘); (an angle of 12°, not an angle of 12 °)
Tables:
Should be numbered according to sequence of appearance in the paper, have a clear descriptive caption directly above the table, do not embed in text, place one table per page.
Indicate approximate positions in the text.
Use brief but informative column headings. Standard abbreviations of units of measurements should be included in parentheses.
Do not use bold type for titles or other contents.
Line spacing: single.
Avoid large tables (split them into few smaller tables, if possible).
Use horizontal borders to demarcate heading rows and to underline the last row of data entry.
Use tabs to align contents into columns, leave sufficient space between columns. Do not draw tables with grid lines (whether
vertical or horizontal, visible or suppressed).
If needed, short explanatory notes may be included directly below a table.
Graphs:
Should have a clear descriptive caption placed directly below the graph.
Do not embed in the text, save on separate page (see instruction for figures under ‗organisation of manuscript).
When prepared in applications such as Excel, they should be exported and saved as MS Word document.
No grid lines (but will be allowed in exceptional cases). Photographs, maps, scanned items:
The print version of JOSPA is published in black and white only. Authors are strongly advised to use either high resolution b lack and white illustrations, or very high resolution colour illustrations which will retain clarity when converted to black and white. Poor quality illustrations will be rejected.
Save pictures in JPEG format (do not embed in main body of manuscript).
Photographs, scanned pictures, maps, and similar items should be submitted as a separate file (but do indicate their approximate locations in the manuscript).
Lettering in/on illustrations Lettering on diagrams, photographs, graphs, etc. should be sufficiently large and bold to permit legible reproduction when the illustra-tion is reduced to a size suitable for inclusion in the journal. (Test the legibility of your illustration by reducing the size by 50%.) Captions:
Should be clear, descriptive, and not too long.
Capitalise first word and proper names only, write scientific names in full.
Should be formatted as follows: Table 1. Relative abundance of flowers in two varieties of tomato following treatment with hormones.
Figure 1. Size of banana fruits at eight weeks after de-suckering.
All illustrations (diagrams, graphs, photographs, line drawings, etc.) should be referred to as figures. They should be numbered consecutively (according to order of appearance in the paper).
Capitalise the first letter when referring to a table or figure within the text, regardless of its position in the sentence. Examples: Table 1 shows that ......; This trend is clearly shown in Figure 10. ** All figures and tables must be referred to in the text.
Names of organisms: With the exception of common domestic animals and crops, the preferred scientific name of organisms (according to the International
Codes of Nomenclature) should be given in full at the first mention of the English common name. Thereafter, the common name may be used, provided there is no ambiguity. Common names should be avoided in titles and abstracts (but English common names of crops may be used, provided there is no ambiguity).
Names of pesticides
The internationally recognised common names (names of active ingredients) of pesticides and other chemicals should be used. Commercial (trade, brand) names may be used in inverted commas (but the internationally accepted common name should still
be provided at first mention). Example: Glyphosate is the common name (or active ingredient) in Roundup, and Roundup is the commercial (or trade) name of a herbi-
cide.

138
Journal of South Pacific Agriculture, Volume 15: Nos. 1 & 2, 2011
Guide for authors
Common names should be presented in lower case letters, except at the beginning of a sentence. The trade name, if used, should always start with a capital letter, and should be enclosed in inverted commas. Examples: The use of glyphosate is widespread in .....; Glyphosate is widely used .....
‗Roundup‘ was applied.... ; The application of ‗Roundup‘ resulted in ...... **Chemical names may also be used where appropriate.
Formulae:
Wherever possible each formula should be typewritten (not scanned), with adequate space around the formula. (Consider placing
the formula inside a textbox to avoid shifting of items during subsequent formatting of the paper.)
If several equations are used in the manuscript, number them consecutively on the right-hand side in parentheses.
Superscripts/subscripts should be very clear; ensure that numerals and letters are distinguishable (e.g. between zero and letter O).
At first use, provide the meaning of all symbols in the equation immediately after the equation.
In general, use internationally accepted symbols and avoid ambiguity.
Reference to numbers in text:
In general, do not write the numbers zero to nine in numerals within sentences, except in special cases (e.g. when followed by units of
measurement, in ranges). Numbers from ten onwards may be written in numerals within sentences, but numerals should not be used to begin a sentence.
Referencing within text:
Use only surnames of authors (in initials) when citing references.
References should be cited as follows: ...the data (Greenland & Craswell, 1989 ) showed... ; or ….Greenland & Craswell (1989) showed…..
If a reference quoted in the text has more than two authors, it should be quoted as follows:
….. the data (Greenland et al., 1980) …… ; or ….. Greenland et al. (1989) showed…..
Referencing from a book should be as follows: McKeen (2002, pp. 18-20) stated that….. ; McKeen (2002, p. 20) stated that…..
Where it is certain that the author cannot be identified, use ‗Anonymous‘ or ‗Anon.‘ in place of author name. Example: Anon. (2003) reported that …; or Anonymous (2003) reported that …… **Choose and use one format only.
References cited together in the text should be arranged chronologically. Example:
...requires two inches of rainfall annually (May, 1989; Glen, 2000; Duke, 2001).
Where an author has more than one publication in the same year, letters of the alphabet (a, b, etc.) should be assigned to each pub-
lication in the order of first appearance within the text. Examples: Lindsay (1972a) found that...., but it tends to decrease with age (Lindsay, 1972b). Lindsay (1972a, b) found that.... **These publications must carry these assigned letters in the list of references.
When the date of publication is not indicated, cite as follows: Jones (n.d.) found that ……..
If the author of a publication is a recognised corporate body (e.g. an international organisation, company, government department), the name of the body should be written in full at first mention, with the standard abbreviation in parentheses. Thereafter, the abbre-viation may be used in the rest of the text. Example:
The Food and Agriculture Organisation (FAO) (2000) has declared .... (at first citing). The FAO (2000) noted that ...... (subsequent citing).
** It is preferable that the full corporate name is used in the list of references.
List of references:
Only publications cited in the paper should be listed.
All publications cited in the body of the text should be included in the list of references.
Surnames and initials of authors should be provided (do not use et al.)
It is the responsibility of the author(s) to ensure that author name(s) and year of publication are correct, both within the body of the text and in the list of references.
All references should be listed at the end of the paper in ascending alphabetical order (A-Z), according to the last name of the au-
thor.
Publications for the same author(s) should be arranged chronologically. ** You can use the ‗sort‘ function of your word processor to arrange the references.
Use italics for titles of books, journals, newspapers, newsletters, and theses (dissertations).
References from periodicals should include the last name(s) of the author(s) followed by the initials (all uppercase letters), year of publication, title of paper, full name of the periodical (in italics), volume number (in bold type) and page numbers. Example: LINDSAY, W. L. 1972. Zinc in soils and plant nutrition. Advances in Soil Management, 24:147-186.
When present, the issue/part number should be written in parenthesis after the journal volume. Example:
LINDSAY, W. L. 1972. Zinc in soils and plant nutrition. Advances in Soil Management, 24 (2):147-186.
References to books should include the last name(s) of author(s) followed by initials (all uppercase letters), year of publication,
title of book, edition, publisher and location, number of pages. Example: MAJOR, R. & GREEN, V. S. 1980. Growing Rice in the Savannas. 2nd edition. Marquee Publishers, Brenton, 250 pp.
Where a reference involves only a chapter in a book whose various chapters are authored by different persons, the reference should be listed as follows:
LAL, R., KANG, B., MOORMAN, F. R., ANTHONY JOU, S. R. & MOONMAW, J. C. 1975. Soil Management Problems
and Possible Solutions in W. Nigeria. In: Bornemisza, E. & Alvarado, A. (Eds.), Soil Management in Tropical America. North
Carolina State Univer-sity, USA, pp. 372-408.

139
References to online publications (articles, ejournals, ebooks): BROWN, K. C. 2008. Growing button mushroom. Urban Agriculture Newsletter, [Online]. 42 (6). Available at: http://www.veg.ug/articles [Accessed 20 Jan. 2010].
MVUNGI, J. B. & MATHI, C. J. 2000. A new incubation technique for small-scale poultry farms. Poultry Digest, [Online] 2 Feb., 13 (2):1 -6. Available at: http://get.fraf.cw.twn/ejournals/ [Accessed 12 Feb. 2009]. PASCAL, W. 2002. The third degree. [e-book] Herman: Zorrow Press. Available at: Municipal Library/Digital Library/e-books http://get.fraf.cw.twn /E-books [Accessed 6 March 2009].
**Note: Underline URLs. Do not use URLs in the body of the text (unless for a special reason).
Newspaper articles should be listed as follows: TUNAKI, M. M. 2003. Pollution scandal: top officers implicated. The Sentry, 2 Aug., p.1.
List a conference paper as follows: Name(s) of author(s) and year. Title of paper. In: (name of the editor or organisation). Full title
of conference (italics). Location, date. Publisher, place of publication. Example: SUZUKI, S. H. 2008. The impact of deforestation on rural water supply in Naiger. In: 10 th International Conference on Cli-
mate Change. Hankok, Neverland, 1-5 Nov. 2008. Global Concern, New Ville.
Annual reports: Provide name of corporate author, year of publication. Title of annual report (italics), place of publication: Pub-lisher. Example: EXTENSION DIVISION 2008. Strategic developments - annual report 2007-2008. Sebania Ministry of Agriculture & Fisheries, 63 pp.
Work that has already been accepted for publication in a periodical should be listed as ‗in press‘ (provide the name of the periodi-
cal and volume number).
Unpublished work (including research data, internal reports) and personal communications should not be listed under references, but may be mentioned in the text; give as much details as appropriate.
Master‘s and doctoral theses that have been approved by the relevant educational institution may be included in the list of refer-ences. Example:
SULIFOA, J. B. 2007. Evaluation of Some Management Strategies against Lepidopterous Pests of Head Cabbage in Samoa . M.Sc. Alafua: University of the South Pacific.
Spelling & grammar checker: Authors are strongly advised to use their word processor‘s spelling and grammar checking function (set to U.K. English) to check their manuscript prior to submission.
General:
Be consistent in style (for example, use either organisation or organization throughout your paper).
The responsibility of proof-reading a paper rests with the author(s).
SUBMISSION OF MANUSCRIPTS JOSPA accepts a contribution with the understanding that the submission is based on the author(s) original, unpublished work.
i. Manuscript must be submitted electronically, either by e-mail, or on a CD mailed to the address provided below. Please do not submit hard copies.
ii. Submission of a manuscript implies that it has the approval of the author‘s organisation under whose authority the work was con-ducted, it has not been published elsewhere, and it is not being considered for publication elsewhere.
iii. Manuscript should be accompanied by a cover page with the following information:
Title of paper
Name(s) of author(s)
A short paragraph summarizing how the paper will contribute to the development of agriculture, agro-allied industries and sustain-
able livelihoods in the South Pacific region.
A declaration stating that the paper has not been submitted in full or in part for publication elsewhere, and will not be submitted in full or in part for publication in any language elsewhere if accepted for publication in JOSPA. (Exceptions to this requirement are submission in the form of an abstract only, or as part of a public lecture, or an academic thesis.)
In the case of multiple authors, a statement declaring that all authors consent to the submission.
Name and contact details of two persons who may be contacted as reviewers for the paper. iv. Send your manuscript to:
JOSPA Managing Editor, USP-SAFT, Alafua Campus, Private Mail Bag, Apia, Samoa. Email: [email protected] .
**You may also send other correspondences regarding your submission to these addresses.
REVIEW AND REVISION
All papers will be subjected to review by referees, and editorial revision, to ensure that contributions are relevant and of satisfac-tory quality.
Where necessary, the manuscript will be returned to the author(s) for revision before the paper is finally accepted for publication.
Paper sent to author(s) for revision must be returned to the JOSPA Managing Editor within the time frame advised to avoid delays in the publication of your paper.
The final submission may be subject to minor editorial revision to suit JOSPA style.
**Manuscript may be submitted without strict adherence to JOSPA’s house style, except for the general arrangement of componen ts (organisation of manuscript). If the paper is acceptable for publication, the final version must be formatted according to the style out-lined in this guide.
Journal of South Pacific Agriculture, Volume 15: Nos. 1 & 2, 2011
Guide for authors


![Rotary Public Relations District 9640 June 2009[1]](https://img.dokumen.tips/doc/110x75/55858d17d8b42ae41d8b5377/rotary-public-relations-district-9640-june-20091.jpg)


