Embed Size (px)
Citation preview

Mindy Marks and Kate Spilde Contreras1
Lands of Opportunity: Social and Economic Effects of Tribal Gaming on Localities
Executive Summary
This report describes the social and economic effects of tribal government gaming operations on tribal and local governments in California, comparing changes in key
indicators of well-being between 1990 and 2000 across tribal governments in California. It also contrasts these changes in California’s tribal governments to those outside the state. These findings suggest that, on the whole, gaming operations have had beneficial effects on the tribes, on communities near gaming facilities, and on California more generally. In
particular, the establishment of gaming has had beneficial effects on income levels, poverty rates, employment, and educational attainment. Further, these are progressive effects, meaning that poorer areas received larger benefits than more prosperous areas.
The consequences of tribal government gaming in California are directly related to two identifiable features of the enterprises themselves: 1) the fact that they are owned by tribal
governments, and 2) the fact that they must be located on existing tribal trust lands. Tribal government ownership places a natural limit on the growth of casino gaming in California and directs gaming revenues towards socioeconomic recovery in tribal communities and regions. Limiting tribal government gaming to existing trust lands also maximizes gaming’s
social and economic benefits due to the fact that that most Indian reservations in California, even the more prosperous ones, are located in the poorest counties and tracts in the state. However, this also suggests that the benefits of gaming will take some time to elevate the
conditions of tribal governments and surrounding areas to those enjoyed by other Americans.
Mindy Marks is assistant professor of economics at the University of California, Riverside.
She received her Ph.D. from the Washington University, St. Louis and also researches health economics and applied microeconomics..
Kate Spilde Contreras is managing director of the Center for California Native Nations at
the University of California, Riverside. She received her Ph.D. from the University of Califor-nia, Santa Cruz and researches Indian gaming, federal recognition, and tribal governance.
For interviews and more information, contact Mindy Marks at (951) 827-4164 or [email protected] and Kate Spilde-Conreras at (760) 533-9387 or [email protected].
VOLUME 1, ISSUE 4 SUMMER 2007
EDITORSMartin JohnsonMindy MarksKarthick Ramakrishnan
EDITORIAL BOARDJohn CioffiScott ColtraneDavid FairrisPaul GreenKevin EsterlingLinda FernandezEllen ReeseRoberto Sánchez-RodríguezSharon Walker
ADVISORY BOARDMark BaldassareChris BuydosAnil DeolalikarGary DymskiAndrés JiménezRon LoveridgeMark PisanoEllen Wartella
Funding provided by the College of Humanities, Arts, and Social Sciences (CHASS) and the Public Policy Initiative at UCR.
For more information and archives, visit policymatters.ucr.edu
Pol icy Matter sA Quarterly Publication of the University of California, Riverside
The Growth of Indian Gaming in California
The 107 federally-recognized tribal governments in California occupy a unique position within the state and federal political landscape. While they act as governments —by providing social services, housing, and other programs
to their citizens—they are limited in their ability to gener-ate governmental revenues to offer these services. For ex-ample, tribal governments cannot levy property taxes on
their lands (as counties do), collect income taxes (as states do), or leverage their land or other assets (as traditional business developers do).
Tribal governments generally pursue business activities to finance infrastructure, governmental programs, and pub-lic services. In spite of the dire need for tribal government revenues, economic development across Indian Country
has been uneven. Among tribal governments, economic development itself had been nearly non-existent until the 1990’s, when tribal government gaming emerged as a
promising way to develop tribal economies and meet tribal government and citizen needs (Wilkins 2002). A patchwork of federal government economic development policies dat-
ing back to the late 19th and early 20th century “failed to produce successful agricultural economies in tribal com-munities and, instead, are widely recognized as having had a disastrous impact on tribes” (National Gambling Impact
Study Commission 1999: 6-6). In 1988, the U.S. Congress passed the Indian Gaming
Regulatory Act (IGRA) to provide a structure for current
and future gaming on Indian lands. IGRA contained two stated goals for tribes:
• to strengthen tribal governments and • to encourage economic development on Indian lands.
IGRA also placed restrictions on tribal government gam-
ing. One such limit is the requirement that tribal govern-ments sign gaming compacts with state governments in order to offer casino-style gaming. After the passage of IGRA, the number of tribal governments operating gam-
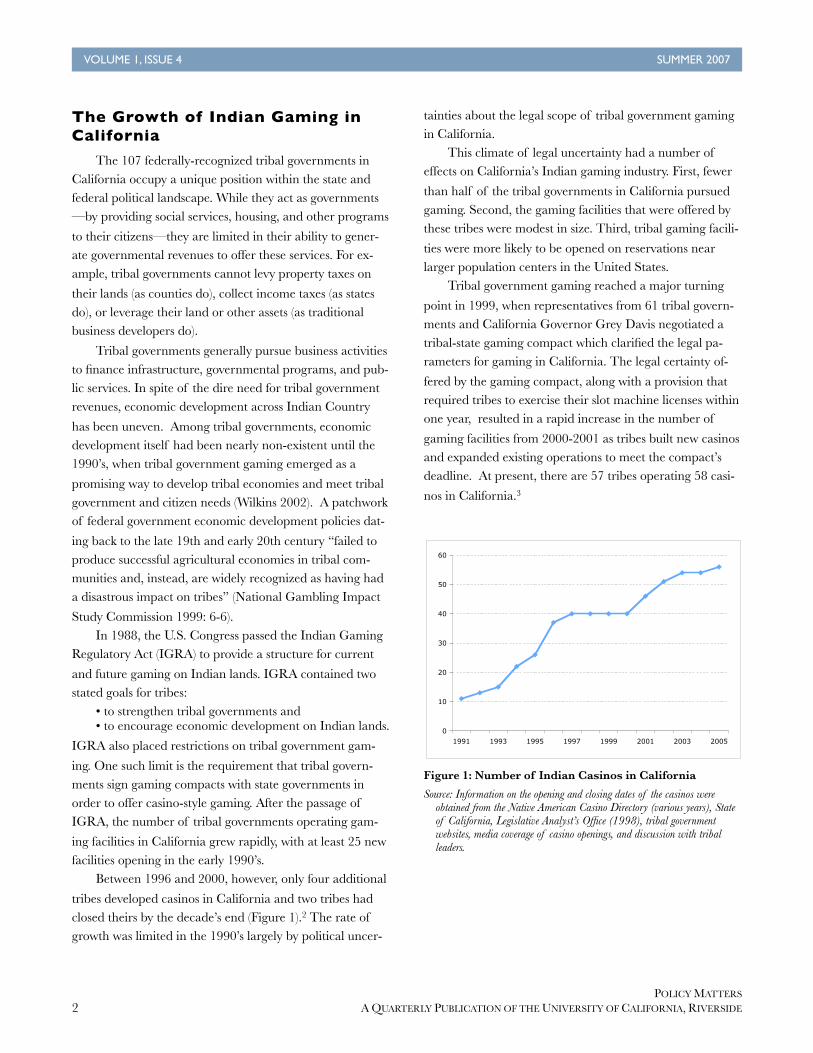
ing facilities in California grew rapidly, with at least 25 new facilities opening in the early 1990’s.
Between 1996 and 2000, however, only four additional
tribes developed casinos in California and two tribes had closed theirs by the decade’s end (Figure 1).2 The rate of growth was limited in the 1990’s largely by political uncer-
tainties about the legal scope of tribal government gaming in California.
This climate of legal uncertainty had a number of effects on California’s Indian gaming industry. First, fewer
than half of the tribal governments in California pursued gaming. Second, the gaming facilities that were offered by these tribes were modest in size. Third, tribal gaming facili-
ties were more likely to be opened on reservations near larger population centers in the United States.
Tribal government gaming reached a major turning
point in 1999, when representatives from 61 tribal govern-ments and California Governor Grey Davis negotiated a tribal-state gaming compact which clarified the legal pa-rameters for gaming in California. The legal certainty of-
fered by the gaming compact, along with a provision that required tribes to exercise their slot machine licenses within one year, resulted in a rapid increase in the number of
gaming facilities from 2000-2001 as tribes built new casinos and expanded existing operations to meet the compact’s deadline. At present, there are 57 tribes operating 58 casi-
nos in California.3
Figure 1: Number of Indian Casinos in California
Source: Information on the opening and closing dates of the casinos were obtained from the Native American Casino Directory (various years), State of California, Legislative Analyst’s Office (1998), tribal government websites, media coverage of casino openings, and discussion with tribal leaders.
VOLUME 1, ISSUE 4 SUMMER 2007
POLICY MATTERS
2 A QUARTERLY PUBLICATION OF THE UNIVERSITY OF CALIFORNIA, RIVERSIDE
0
10
20
30
40
50
60
1991 1993 1995 1997 1999 2001 2003 2005

Variation in Compact Status, Gaming Status, and Population Density
The map below shows the location of every tribal government in California, its compact status, and its current gaming status as of 2005. This figure also includes the population density for the state of California as a whole. Areas that are shaded in pale colors on the map correspond to parts of the state with relatively few residents.
The map suggests that tribal governments who do not have a gaming compact are located far from population centers. The growth of Indian Gaming in California in the early 1990’s provides an opportunity to identify how the economic and tribal gov-ernance opportunities that are associated with gaming have changed life in Indian country. The methodology of this project is to compare changes in key indicators of well being between 1990 and 2000 across tribes that opened a casino during the 1990s and those tribes that were non gaming in the year 2000.
The fact that characteristics of the surrounding communities, mainly population density, determine which tribal governments offer gaming implies that the introduction of gaming constitutes a “natural experiment.” In other words, if we find that the in-troduction of gaming is associated with improved economic or social economic variables we can attribute these changes to gam-ing and not to inherent characteristics of the tribes that adopt gaming. This framework shapes the remainder of our analysis.
VOLUME 1, ISSUE 4 SUMMER 2007
POLICY MATTERS
A QUARTERLY PUBLICATION OF THE UNIVERSITY OF CALIFORNIA, RIVERSIDE 3

Casino Location and Slot Machine Density
At the start of this decade, 20 out of 58 counties in California had tribal casinos. By the end of 2005, 25 coun-ties hosted casinos, and most of these counties were in less
densely-populated areas.4 Thus, in 2005, 33 counties, rep-resenting 74 percent of California’s population, had no gaming facility. Two counties (El Dorado and Sacramento)
currently do not have gaming, but are home to compacted tribes that could open casinos. Under the terms of the cur-rent compacts and given the location of reservations in
California, 31 counties in California will likely remain without tribal government gaming permanently.
Looking in more detail at the distribution of slot ma-chine gaming devices in California (Table 1), we see that
Riverside County had the most slot machines in 2000, fol-lowed by San Diego, San Bernardino and Yolo Counties. By 2005, San Diego County had the most slot machines
followed by Riverside, San Bernardino, Fresno, Yolo, and Placer Counties. These six counties are the only counties in California with more than 2,000 slot machines. However,
the population of Californian counties varies widely, so the raw number of slots machines presents a biased representa-tion of which counties are most affected by the presence of Indian gaming.
Columns 3 and 5 of Table 3 adjust the number of slot machines by the county’s population size. An entirely dif-ferent ranking of counties by per capita gaming devices
emerges. In 2000, Colusa County had the largest per capita gaming density with 28 slots machines per 1,000 people followed by Lake County with 15 slot machines per 1,000
persons and Amador with 12. These same counties top the list in 2005 with Colusa up to 41 slots per 1,000 people, Amador up to 40 machines per 1,000 people, and Glenn and Lake Counties at 27. In comparison, San Diego and
Riverside Counties, which have the most slot machines, have only 4.4 and 6 slots per 1,000 people respectively. In 2005, average slot machine density among California coun-
ties with gaming was 5.4 slots machines per 1,000 inhabi-tants. The slot machine density for California as a whole was .61 slot machines per 1,000 inhabitants in 2000 and
1.58 slot machines per 1,000 inhabitants in 2005.
Table 1: County-level Gaming Density in 2000 and 2005
County Number of
Slots
(Casinos),
2000
Slots per
1000
persons,
2000
Number of
Slots
(Casinos),
2005
Slots per
1000
persons,
2005
Amador 435 (1) 12.4 1,500 (1) 39.9
Butte 906 (2) 4.5 1,900 (2) 8.9
Colusa 523 (1) 27.8 846 (1) 40.5
Del Norte 399 (2) 14.5 542 (2) 18.8
Fresno 1,074 (2) 1.3 4,129 (3) 4.7
Glenn 0 - 773 (1) 27.4
Humboldt 281 (2) 2.2 1,467 (4) 11.2
Imperial 0 - 325 (1) 2
Inyo 273 (1) 15.2 332 (1) 17.9
Kings 472 (1) 3.6 1,700 (1) 11.7
Lake 900 (3) 15.4 1,686 (3) 26.7
Lassen 150 (1) 4.4 208 (1) 5.9
Mendocino 959 (4) 11.1 1,332 (4) 14.8
Modoc 54 (1) 5.7 150 (1) 15.5
Placer 0 - 2,700 (1) 8.8
Riverside 6,052 (6) 3.9 11,269 (6) 6
San Bernardino 1,814 (3) 1.1 4,320 (3) 2.2
San Diego 2,708 (3) 1 13,289 (9) 4.4
Santa Barbara 760 (1) 1.9 2,000 (1) 4.8
Shasta 530 (2) 3.2 1,081 (1) 6.1
Sonoma 0 - 1,600 (1) 3.3
Tulare 408 (1) 1.1 1,500 (1) 3.7
Tuolumne 224 (1) 4.1 1,190 (2) 20.3
Yolo 1,762 (1) 10.4 2,402 (1) 12.8
Total 20,684
(39)
0.61 58,721
(55)
1.58
Sources: California State Auditor (2004), Native American Casino (various years), State of California, Department of Finance (2006), and U.S. Census Bureau (2000).
VOLUME 1, ISSUE 4 SUMMER 2007
POLICY MATTERS
4 A QUARTERLY PUBLICATION OF THE UNIVERSITY OF CALIFORNIA, RIVERSIDE

Tribal Gaming in Context
Tribal government gaming in California developed in a different manner when compared to tribal casinos in other parts of the country. For instance, comparisons of U.S. Census data from 1990 and 2000 (Figure 2) reveal that
by 2000 there was a larger economic inequality between gaming and non-gaming reservations within California than for reservations outside California. The introduction
of limited Indian gaming on California reservations during the 1990s helps explain why some tribal governments in California developed more quickly than others. For exam-
ple, those tribal governments in areas with higher popula-tion density were more likely to pursue gaming before the passage of the tribal-state gaming compact in 1999.
Figure 2: Income Per Capita on Indian Reservations
$0
$5,000
$10,000
$15,000
$20,000
$25,000
Gaming Non-Gaming Gaming Non-Gaming All Residents
CALIFORNIA OUTSIDE CALIFORNIA U.S. AVERAGE
19902000
Source: 1990 and 2000 U.S. Census data.
The finding that Indian gaming in California devel-oped unevenly in the 1990’s and resulted in increased eco-
nomic inequalities between gaming and non-gaming tribes reveals the need for a particular aspect of the 2000 tribal-state gaming compact, the Revenue Sharing Trust Fund
(RSTF). The RSTF attempted to address potential ine-qualities, even before they were statistically substantiated by our analysis. A portion of gaming revenues generated by Indian casinos in California is distributed to non-gaming
tribes. Since its inception, tribal governments have put more than $148 million into the RSTF to be shared with non-gaming tribes. Since our Census analysis ends in 2000,
we are unable to document statistically how the RSFT helps reduce the inequality that existed among reservations
in California in 2000. However, survey research among non-gaming tribes in 2005 reveals that payments to the RSTF have been invested in ways that will help address these inequalities and that these funds have allowed non-
gaming tribes to add critical governmental services at the same rate as gaming tribes (Johnson, Filla, and McLaughlin 2006).
The introduction of tribal government gaming on California reservations during the early 1990s may explain the faster economic growth among California tribal gov-
ernments with gaming compared to those in other states. In Figure 2, we show the levels of real average income per capita for those reservations that have gaming facilities as of January 2000. In 1990, the average income per capita in
California gaming and non-gaming reservations was very similar: $8,080 for a gaming reservation and $8,183 in a non-gaming reservation. In the rest of the United States,
gaming reservations were poorer than their non-gaming counterparts: $6,148 on a gaming reservation and $7,220 on a non-gaming reservation. Also, in general, reservations
in California, regardless of their gaming status, had higher per-capita incomes than reservations in the rest of the United States.
By 2000, when limited gaming was taking place in
California, we observe that the fastest average income growth took place on gaming reservations versus non-gaming. On California gaming reservations, there was a
55% growth in average income between 1990 and 2000 as opposed to a 15% on non-gaming reservations. For reserva-tions outside California, the growth was 34% on gaming
reservations versus 21% in non-gaming. This level of growth is impressive, however the data also reveals that while California’s gaming reservations enjoy the largest average income per capita ($12,526 in 2000), this figure
represents only 53% of the national U.S. average.
Poverty: Although there are some differences between
tribal governments in California and the tribal governments in other states regarding their economic progress between 1990 and 2000, the common feature is that, judging by
national standards, all tribal governments—including those in California—continue to experience significant socioeco-nomic deficits compared to non-Indians in the United States.
VOLUME 1, ISSUE 4 SUMMER 2007
POLICY MATTERS
A QUARTERLY PUBLICATION OF THE UNIVERSITY OF CALIFORNIA, RIVERSIDE 5

These gaps are perhaps most evident in the case of poverty. We use data from the U.S. Census to compare the percentage of families living in poverty among members of non-gaming and gaming tribes in California, to poverty
rates for the rest of California and the U.S. This is shown in Figure 3. Comparing the percentage of families in pov-erty on Indian lands with those in the rest of California or
the U.S. reveals significant gaps in quality of life. At the national and state level, the percentage of families in pov-erty is between 9 and 10 percent, but for the California
tribes with gaming in 2000, it was 26 percent and for those non-gaming tribes, the poverty rate was 30 percent. Tribes with gaming in California experienced a reduction in the percentage of their families living in poverty from 36 per-
cent in 1990 to 26 percent in 2000. Despite this reduction, however, poverty rates were more than twice as high as the national and state averages.
Figure 3: Families in Poverty in 1990 and 2000 (in %)
Source: 1990 and 2000 U.S. Census data.Note: Dotted line represents 2000 U.S. average of 9.2 percent.
Off-reservation Effects
In addition to exploring the impact of tribal govern-ment gaming on tribal lands and populations, we also ex-amined if the establishment of gaming had economic and social effects beyond the reservations during the 1990’s. To
do this, we used tract-level data from the 1990 and 2000 Censuses to analyze changes that occurred in economic and social indicators, and to explore associations between
these changes and the establishment of reservation-based gaming in close proximity of a particular tract.5
The most obvious method by which to gauge the eco-nomic impact of gaming is to compare the growth of real incomes over the 1990-2000 period in tracts that were ex-posed to gaming versus those that were not. We character-
ize a Census tract as being exposed to the effects of gaming if it is 10 miles or less from the nearest gaming reservation. Since there were few gaming reservations in California in
1990, the comparison of areas with and without gaming in 2000 is essentially a comparison of areas that were exposed to gaming over the 1990-2000 period and those that con-
tinued to be unexposed to gaming over the same period. Table 2 indicates that tracts in close proximity to gam-
ing reservations were significantly poorer in 1990 (before the onset of any substantial reservation-based gaming) than
those farther than 10 miles from the nearest gaming reser-vation. For instance, median family income in the former was $32,515 (in constant 2000 prices), as against $46,255 in
the non-gaming tracts. However, over the following 10 years, median family income grew significantly more in the gaming than in the non-gaming tracts ($16,063 in tracts
with gaming versus $11,877 in those without gaming). Within this simple framework, the difference in the
1990-2000 growth of median real family income across gaming and non-gaming tracts represents the net ‘spillover’
effect of gaming. This figure suggest that the spillover is $4,186 ($16,063 – $11,877) or 22.2% ( 55.1% – 32.9%). To place this number in perspective, consider the fact that
there were 756 tracts in California where tribal government gaming was added between 1990 and 2000, and that an average of 1,086 families lived in each of these tracts in
1990. If the income gain of $4,186 is extrapolated to all of these 821,016 families, an aggregate figure of $3.4 billion is obtained as the additional income associated with the es-tablishment of gaming in California.6
These impacts result from the fact that most Indian reservations in California, even the more prosperous ones, are located in the poorest counties and tracts in the state.
Our analysis indicates that tribal government gaming has had strong economic and social benefits that reach beyond the reservations in California. As we have shown, tracts in
close proximity to gaming reservations experienced signifi-cantly greater income growth than tracts that were not in close proximity.
VOLUME 1, ISSUE 4 SUMMER 2007
POLICY MATTERS
6 A QUARTERLY PUBLICATION OF THE UNIVERSITY OF CALIFORNIA, RIVERSIDE
0
5
10
15
20
25
30
35
40
Non-Gaming (CA) Gaming (CA) CA Average
19902000

Table 2. Median Family Income By Proximity to Gaming Reservation (in real dollars, 2000)
Source: 1990 and 2000 U.S. Census data.
These results are powerful, since they indicate that gaming has had strongly progressive spillover effects, with the poorest (in 1990) communities capturing the largest increases in median family income over the following dec-
ade due, at least in part, to the establishment of tribal gov-ernment gaming. We develop this empirical result further, estimating a regression model of changes in the number of
poor persons in a Census tract between 1990 and 2000.7 The statistical model, not shown here, incorporated eco-nomic information such as median family income in the
tract, as well as the introduction of gaming within 10 miles of the tract during the decade.
Raw Census data suggest that there was a sharp in-crease in the number of persons below the poverty line in
both the gaming and the non-gaming tracts during this time period. However, the results of the regression analy-sis—with model predictions shown in Figure 4—suggest a
more complex story. These estimates indicate that the es-tablishment of gaming reduced significantly the number of poor persons between 1990 and 2000, but only in the poor-
est tracts in the state. For instance, in tracts having a me-dian family income of only $5,000 (in 2000 dollars) in 1990, gaming was associated with a 7 percent decline in the number of poor persons between 1990 and 2000.
Thus, not only was gaming associated with a large in-crease in median family income in the poorest tracts of the state, it was also associated with a significant decline in the
number of poor persons residing in these poorest tracts. The positive income effects associated with gaming are therefore progressive, meaning that poorer areas and
poorer residents have received larger economic benefits (in the form of increased family income) than more prosperous areas and residents.
Figure 4: Estimated Change in Number of Poor Persons in a Census Tract, Based on 1990 Tract-Level Income
-20 -15 -10 -5 0 5 10 15 20
$1,000
$5,000
$7,500
$10,000
$15,000
$25,000
$50,000
$75,000
$100,000
$125,000
$150,000
Tra
ct-l
evel
inco
me i
n 1
99
0
Percent change in poverty, 1990 to 2000
Source: California Center for Native Nations (2006).
Effects on Educational ExpansionWhile income and poverty are customary measures to
gauge development, they offer only a partial view of pro-gress. In order to complement these measures of prosperity, we examined the relationship between tribal government
gaming development and the expansion of educational attainment. Regression analysis allows us to compare in-creases in educational attainment among Californians liv-
ing near tribes with gaming facilities and residents of the state living more than 10 miles away from Indian casinos, or what we call “non-gaming tracts.” The population we are studying here is persons aged 25 years and older (1990-
2000) in four educational levels. We find that Indian gaming is associated with a pattern
of stronger growth in higher levels of education among
Californians (Figure 5, next page). The population of indi-viduals who have completed high school increased signifi-cantly faster in gaming than in non-gaming tracts (11 per-
cent change versus only 1 percent). Likewise, the popula-tion with post-secondary (typically college) schooling also increased significantly faster in gaming than in non-gaming tracts (24 versus 16 percent) during this time period. While
showing growth, the difference between gaming and non-gaming tracts with regard to the growth of the population with less-than-high-school education was much smaller (5
versus 3 percent). Thus, areas in close proximity to gaming reservations saw a much larger increase in the population of
VOLUME 1, ISSUE 4 SUMMER 2007
POLICY MATTERS
A QUARTERLY PUBLICATION OF THE UNIVERSITY OF CALIFORNIA, RIVERSIDE 7
Within 10 miles of
gaming reservation
Not within 10 miles of
gaming reservation
1990 $32,515 $46,255
2000 $ 48.578 $58,132
1990-2000 change ($) + $16,063 + $11,877
1990-2000 change (%) + 55% + 33%
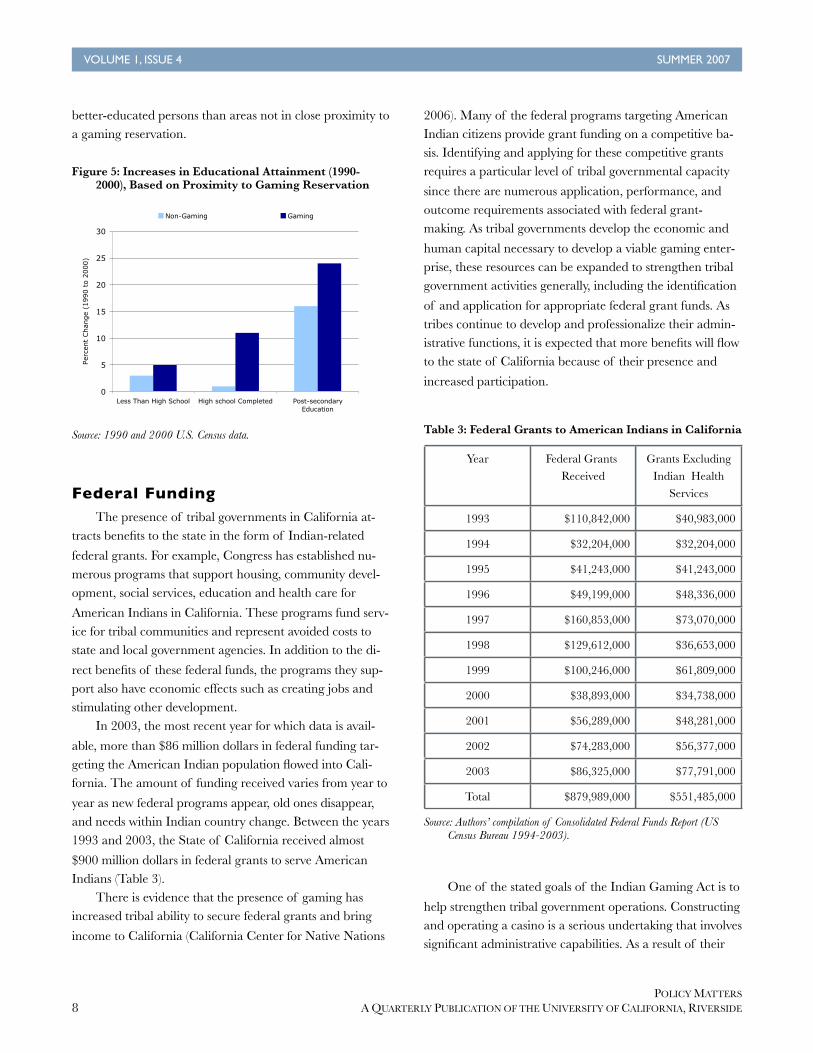
better-educated persons than areas not in close proximity to a gaming reservation.
Figure 5: Increases in Educational Attainment (1990-2000), Based on Proximity to Gaming Reservation
Source: 1990 and 2000 U.S. Census data.
Federal FundingThe presence of tribal governments in California at-
tracts benefits to the state in the form of Indian-related
federal grants. For example, Congress has established nu-merous programs that support housing, community devel-opment, social services, education and health care for
American Indians in California. These programs fund serv-ice for tribal communities and represent avoided costs to state and local government agencies. In addition to the di-
rect benefits of these federal funds, the programs they sup-port also have economic effects such as creating jobs and stimulating other development.
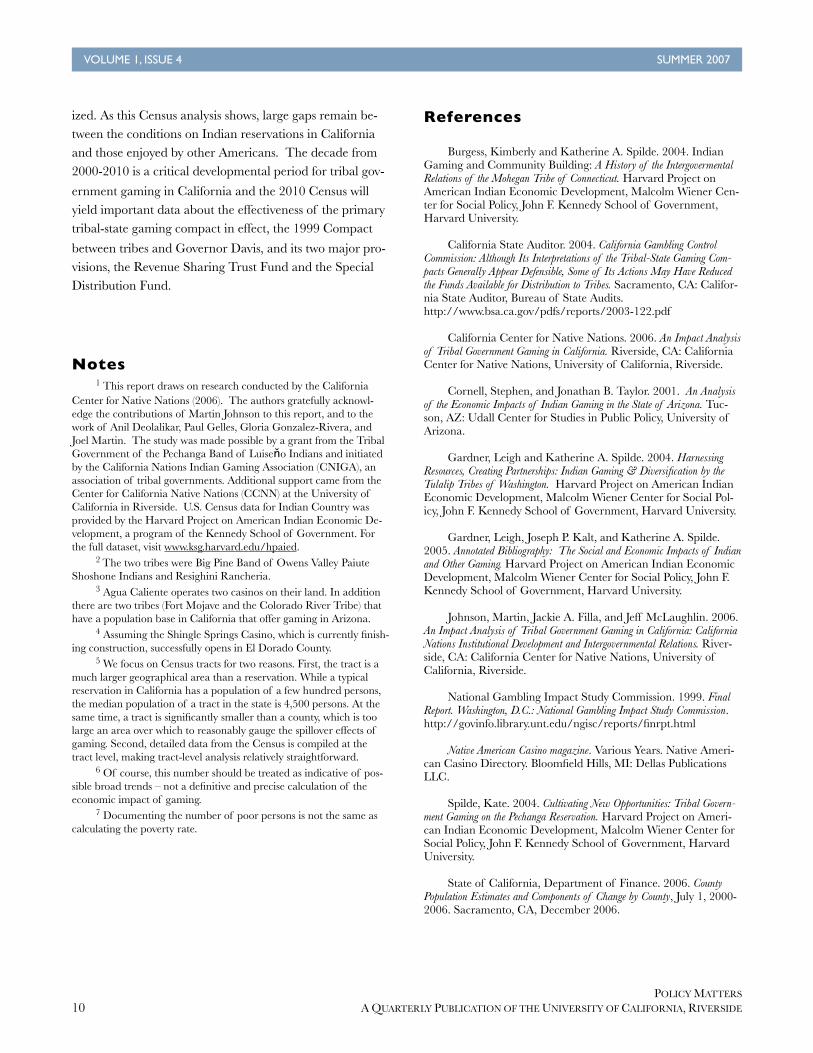
In 2003, the most recent year for which data is avail-
able, more than $86 million dollars in federal funding tar-geting the American Indian population flowed into Cali-fornia. The amount of funding received varies from year to
year as new federal programs appear, old ones disappear, and needs within Indian country change. Between the years 1993 and 2003, the State of California received almost
$900 million dollars in federal grants to serve American Indians (Table 3).
There is evidence that the presence of gaming has increased tribal ability to secure federal grants and bring
income to California (California Center for Native Nations
2006). Many of the federal programs targeting American Indian citizens provide grant funding on a competitive ba-sis. Identifying and applying for these competitive grants requires a particular level of tribal governmental capacity
since there are numerous application, performance, and outcome requirements associated with federal grant-making. As tribal governments develop the economic and
human capital necessary to develop a viable gaming enter-prise, these resources can be expanded to strengthen tribal government activities generally, including the identification
of and application for appropriate federal grant funds. As tribes continue to develop and professionalize their admin-istrative functions, it is expected that more benefits will flow to the state of California because of their presence and
increased participation.
Table 3: Federal Grants to American Indians in California
Year Federal Grants Received
Grants Excluding Indian Health
Services
1993 $110,842,000 $40,983,000
1994 $32,204,000 $32,204,000
1995 $41,243,000 $41,243,000
1996 $49,199,000 $48,336,000
1997 $160,853,000 $73,070,000
1998 $129,612,000 $36,653,000
1999 $100,246,000 $61,809,000
2000 $38,893,000 $34,738,000
2001 $56,289,000 $48,281,000
2002 $74,283,000 $56,377,000
2003 $86,325,000 $77,791,000
Total $879,989,000 $551,485,000
Source: Authors’ compilation of Consolidated Federal Funds Report (US Census Bureau 1994-2003).
One of the stated goals of the Indian Gaming Act is to
help strengthen tribal government operations. Constructing and operating a casino is a serious undertaking that involves significant administrative capabilities. As a result of their
VOLUME 1, ISSUE 4 SUMMER 2007
POLICY MATTERS
8 A QUARTERLY PUBLICATION OF THE UNIVERSITY OF CALIFORNIA, RIVERSIDE
0
5
10
15
20
25
30
Less Than High School High school Completed Post-secondaryEducation
Perc
ent
Chan
ge
(1990 t
o 2
000)
Non-Gaming Gaming

forays into gaming, some tribes now have a much more sophisticated administrative structure with includes the hiring of professionals such as lawyers and business manag-ers (Cornell and Taylor 2001, Gardner, Kalt, and Spilde
2004). It is reasonable to suspect that this increased admin-istrative capability positioned gaming tribes to apply for and be granted federal monies.
Evidence of these greater administrative capabilities can be found by analyzing the fiscal funds data (U.S. Cen-sus Bureau 1994-2003). The hypothesis is that tribes that
operate casinos have a government structure that better enables them to be aware of, apply for, and be granted, federal grants. Thus counties that have tribes that operate casinos should be in a better position to receive federal
funds than counties without an Indian casino. Figure 6 pro-vides some evidence of such a relationship. The solid bars represent the average amount of Indian grants received by
the eight counties with tribal governments that were non-gaming over the period under study.
Figure 6: Average Federal Grants By Gaming Status
Source: Authors’ compilation of Consolidated Federal Funds Report (US Census Bureau 1994-2003).
As with total Indian grants received, there is no dis-cernible temporal pattern in receipt of grants in non-gaming counties. The solid line represents the average
amount of Indian grants received by the 12 counties for which at least one casino was in operation in 1993. These counties have greater administrative capabilities and thus
be better positioned to receive federal grants. As is made clear by the figure, while the gaming and non-gaming counties had similar sized grants in 1993 over time the gaming counties have increased their receipt of federal
Indian funding.
Conclusions
This study has shown that tribal gaming in California has improved social and economic outcomes on tribal lands and in surrounding areas. Benefits include significant in-
creases in incomes and educational attainment, and reduc-tions in poverty, especially in the poorest regions of the state. In addition to the effects noted in this report, the es-tablishment of tribal gaming has also increased employ-
ment and reduced dependence on public assistance in tribal lands and nearby areas (California Center for Native Na-tions 2006).
The effects of tribal government gaming in California are directly related to two identifiable features of the enter-prises themselves: A) the fact that they are owned by tribal
governments; B) the fact that they must be located on exist-ing tribal trust lands. On the one hand, because this form of gaming is owned and managed by tribal governments operating under the strictures of IGRA, gaming revenues
in California support community and government activities within the region where the facility is located. On the other, because this form of gaming presupposes a location
on existing tribal trust lands and these lands for historical and political reasons were located in poorer regions of the state, the economic activity that results tends to concentrate
employment and other benefits in counties that need eco-nomic development the most. Both of these fea-tures—tribal government ownership and location on exist-ing tribal trust lands—also contribute to the fact that tribal
government gaming benefits in California generally accrue to local communities both on and near tribal trust lands. As a result, tribal governments with gaming are concentrating
employment opportunity in areas that are economically worse off than areas without gaming reservations.
While the benefits of tribal government gaming in
California have been substantial for tribal members and their neighbors, it will take more time for the economic and social benefits of tribal government gaming to be fully real-
VOLUME 1, ISSUE 4 SUMMER 2007
POLICY MATTERS
A QUARTERLY PUBLICATION OF THE UNIVERSITY OF CALIFORNIA, RIVERSIDE 9
$0
$500,000
$1,000,000
$1,500,000
$2,000,000
$2,500,000
$3,000,000
1993 1995 1997 1999 2001 2003
Non-gaming counties Gaming counties
ized. As this Census analysis shows, large gaps remain be-tween the conditions on Indian reservations in California and those enjoyed by other Americans. The decade from 2000-2010 is a critical developmental period for tribal gov-
ernment gaming in California and the 2010 Census will yield important data about the effectiveness of the primary tribal-state gaming compact in effect, the 1999 Compact
between tribes and Governor Davis, and its two major pro-visions, the Revenue Sharing Trust Fund and the Special Distribution Fund.
Notes1 This report draws on research conducted by the California
Center for Native Nations (2006). The authors gratefully acknowl-edge the contributions of Martin Johnson to this report, and to the work of Anil Deolalikar, Paul Gelles, Gloria Gonzalez-Rivera, and Joel Martin. The study was made possible by a grant from the Tribal Government of the Pechanga Band of Luiseňo Indians and initiated by the California Nations Indian Gaming Association (CNIGA), an association of tribal governments. Additional support came from the Center for California Native Nations (CCNN) at the University of California in Riverside. U.S. Census data for Indian Country was provided by the Harvard Project on American Indian Economic De-velopment, a program of the Kennedy School of Government. For the full dataset, visit www.ksg.harvard.edu/hpaied.
2 The two tribes were Big Pine Band of Owens Valley Paiute Shoshone Indians and Resighini Rancheria.
3 Agua Caliente operates two casinos on their land. In addition there are two tribes (Fort Mojave and the Colorado River Tribe) that have a population base in California that offer gaming in Arizona.
4 Assuming the Shingle Springs Casino, which is currently finish-ing construction, successfully opens in El Dorado County.
5 We focus on Census tracts for two reasons. First, the tract is a much larger geographical area than a reservation. While a typical reservation in California has a population of a few hundred persons, the median population of a tract in the state is 4,500 persons. At the same time, a tract is significantly smaller than a county, which is too large an area over which to reasonably gauge the spillover effects of gaming. Second, detailed data from the Census is compiled at the tract level, making tract-level analysis relatively straightforward.
6 Of course, this number should be treated as indicative of pos-sible broad trends – not a definitive and precise calculation of the economic impact of gaming.
7 Documenting the number of poor persons is not the same as calculating the poverty rate.
References
Burgess, Kimberly and Katherine A. Spilde. 2004. Indian Gaming and Community Building: A History of the Intergovermental Relations of the Mohegan Tribe of Connecticut. Harvard Project on American Indian Economic Development, Malcolm Wiener Cen-ter for Social Policy, John F. Kennedy School of Government, Harvard University.
California State Auditor. 2004. California Gambling Control Commission: Although Its Interpretations of the Tribal-State Gaming Com-pacts Generally Appear Defensible, Some of Its Actions May Have Reduced the Funds Available for Distribution to Tribes. Sacramento, CA: Califor-nia State Auditor, Bureau of State Audits. http://www.bsa.ca.gov/pdfs/reports/2003-122.pdf
California Center for Native Nations. 2006. An Impact Analysis
of Tribal Government Gaming in California. Riverside, CA: California Center for Native Nations, University of California, Riverside.
Cornell, Stephen, and Jonathan B. Taylor. 2001. An Analysis of the Economic Impacts of Indian Gaming in the State of Arizona. Tuc-son, AZ: Udall Center for Studies in Public Policy, University of Arizona.
Gardner, Leigh and Katherine A. Spilde. 2004. Harnessing Resources, Creating Partnerships: Indian Gaming & Diversification by the Tulalip Tribes of Washington. Harvard Project on American Indian Economic Development, Malcolm Wiener Center for Social Pol-icy, John F. Kennedy School of Government, Harvard University.
Gardner, Leigh, Joseph P. Kalt, and Katherine A. Spilde. 2005. Annotated Bibliography: The Social and Economic Impacts of Indian and Other Gaming. Harvard Project on American Indian Economic Development, Malcolm Wiener Center for Social Policy, John F. Kennedy School of Government, Harvard University.
Johnson, Martin, Jackie A. Filla, and Jeff McLaughlin. 2006. An Impact Analysis of Tribal Government Gaming in California: California Nations Institutional Development and Intergovernmental Relations. River-side, CA: California Center for Native Nations, University of California, Riverside.
National Gambling Impact Study Commission. 1999. Final Report. Washington, D.C.: National Gambling Impact Study Commission. http://govinfo.library.unt.edu/ngisc/reports/finrpt.html
Native American Casino magazine. Various Years. Native Ameri-can Casino Directory. Bloomfield Hills, MI: Dellas Publications LLC.
Spilde, Kate. 2004. Cultivating New Opportunities: Tribal Govern-ment Gaming on the Pechanga Reservation. Harvard Project on Ameri-can Indian Economic Development, Malcolm Wiener Center for Social Policy, John F. Kennedy School of Government, Harvard University.
State of California, Department of Finance. 2006. County Population Estimates and Components of Change by County, July 1, 2000-2006. Sacramento, CA, December 2006.
VOLUME 1, ISSUE 4 SUMMER 2007
POLICY MATTERS
10 A QUARTERLY PUBLICATION OF THE UNIVERSITY OF CALIFORNIA, RIVERSIDE

State of California, Legislative Analyst’s Office. 1998. Gam-bling in California: An Overview. Sacramento, CA: Legislative Ana-lyst’s Office.
State of California, Legislative Analyst’s Office. 2007. Ques-tions and Answers: California Tribal Casinos. Sacramento, CA: Legisla-tive Analyst’s Office.
Taylor, Jonathan B., and Joseph P. Kalt. 2005. American Indi-ans on Reservations: A Databook of Socioeconomic Change Between the 1990 and 2000 Censuses. Harvard Project on American Indian Economic Development, Malcolm Wiener Center for Social Pol-icy, John F. Kennedy School of Government, Harvard University.
Taylor, Jonathan B. and Joseph P. Kalt. 2005. Data Files for American Indians on Reservations: A Databook of Socioeconomic Change Between the 1990 and 2000 Censuses. Harvard Project on American Indian Economic Development, Malcolm Wiener Center for So-cial Policy, John F. Kennedy School of Government, Harvard University.
U.S. Census Bureau. 1994-2003. Consolidated Federal Funds Report, Federal, State, and Local Governments. Washington, D.C.: U.S. Census Bureau. http://www.census.gov/govs/www/cffr.html
U.S. Census Bureau. 2000. County and City Data Book. Wash-ington, D.C.: U.S. Census Bureau.
Wilkins, David E. 2002. American Indian Politics and the American Political System. Lanham, MD: Rowman & Littlefield.
SOURCES OF ADDITIONAL INFORMATION
California Center for Native Nations, College of Humanities, Arts, and Social Sciences, University of California, Riverside.http://ccnn.ucr.edu
Harvard Project on American Indian Economic Develop-ment, Malcolm Wiener Center for Social Policy, John F. Kennedy School of Government. http://www.ksg.harvard.edu/hpaied
Native Nations Institute for Leadership, Management, and Policy, Morris K. Udall Foundation, University of Arizona. http://nni.arizona.edu
California Gambling Control Commission (CGCC)http://www.cgcc.ca.gov
California Council on Problem Gambling http://www.calproblemgambling.org
Division of Gambling Control (DGC), State of California, Department of Justice http://www.caag.state.ca.us/gambling
National Center for Responsible Gaminghttp://www.ncrg.org
National Indian Gaming Commissionhttp://www.nigc.gov
Office of Problem Gambling, California Department of Alcohol and Drug Programs http://www.adp.ca.gov/OPG/OPGhome.shtml
Sycuan Institute on Tribal Gaminghttp://htm.sdsu.edu/sycuan/
UCLA Native Law and Policy Centerhttps://www.law.ucla.edu/home
VOLUME 1, ISSUE 4 SUMMER 2007
POLICY MATTERS
A QUARTERLY PUBLICATION OF THE UNIVERSITY OF CALIFORNIA, RIVERSIDE 11

Policy MattersVolume 1, Issue 4
Mindy Marks and Kate Spilde Contreras
Lands of Opportunity: Social and Economic Effects of Tribal Gaming on Localities
For interviews and more information, contact:Mindy Marks (951) 827-4164 [email protected]
Kate Spilde Contreras(760) 533-9387
To contact editors via email:Martin Johnson,* [email protected] Marks, [email protected]
Karthick Ramakrishnan, [email protected]
* Action editor for Volume 1, Issue 4
POLICY MATTERS IS A QUARTERLY PUBLICATION OF THE UNIVERSITY OF CALIFORNIA, RIVERSIDE
UPCOMING TOPICS
Civic ParticipationCollaborative Regional Planning
Others, based on our ongoingCALL FOR SUBMISSIONS
For more information, and to access our archives, visit:http://policymatters.ucr.edu
Policy Mattersc/o Department of Political Science900 University AvenueUniversity of CaliforniaRiverside, CA 92521