Embed Size (px)
Citation preview

Astronomical pacing of late Palaeocene to earlyEocene global warming eventsLucas J. Lourens1, Appy Sluijs2, Dick Kroon3, James C. Zachos4, Ellen Thomas5, Ursula Rohl6, Julie Bowles7
& Isabella Raffi8
At the boundary between the Palaeocene and Eocene epochs,about 55million years ago, the Earth experienced a strong globalwarming event, the Palaeocene–Eocene thermal maximum1–4. Theleading hypothesis to explain the extreme greenhouse conditionsprevalent during this period is the dissociation of 1,400 to2,800 gigatonnes of methane from ocean clathrates5,6, resultingin a large negative carbon isotope excursion and severe carbonatedissolution in marine sediments. Possible triggering mechanismsfor this event include crossing a threshold temperature as theEarth warmed gradually7, comet impact8, explosive volcanism9,10
or ocean current reorganization and erosion at continentalslopes11, whereas orbital forcing has been excluded12. Here wereport a distinct carbonate-poor red clay layer in deep-sea coresfrom Walvis ridge13, which we term the Elmo horizon. Usingorbital tuning, we estimate deposition of the Elmo horizon atabout 2 million years after the Palaeocene–Eocene thermal maxi-mum. The Elmo horizon has similar geochemical and bioticcharacteristics as the Palaeocene–Eocene thermal maximum,but of smaller magnitude. It is coincident with carbon isotopedepletion events in other ocean basins, suggesting that itrepresents a second global thermal maximum. We show thatboth events correspond to maxima in the ,405-kyr and,100-kyr eccentricity cycles that post-date prolonged minima inthe 2.25-Myr eccentricity cycle, implying that they are indeedastronomically paced.
Biotic phenomena similar to those characterizing the Palaeocene–Eocene thermal maximum (PETM) have been locally recorded in theupper Palaeocene to lower Eocene, indicating the possibility ofadditional hyperthermal events, though of smaller magnitude14–16.Several short, negative carbon isotope shifts of up to 1‰ at deep-seasites resemble the much larger-amplitude carbon isotope excursionat the PETM12. Orbital tuning suggested that these transients werecontrolled by maxima in the short-term eccentricity cycles, whereasthe PETM carbon isotope excursion allegedly occurred near aminimum in the ,405-kyr eccentricity cycle, excluding orbitalforcing as a triggering mechanism for the latter12.
One objective of Ocean Drilling Program (ODP) Leg 208 on theWalvis ridge (subtropical southeastern Atlantic Ocean) was to searchfor hyperthermal events within the lower Cenozoic greenhouseclimate record. We recovered continuous, undisturbed lower Palaeo-gene successions at five sites along a 2-km water depth transect inmultiple (mostly advanced piston core) holes. This resulted in thefirst complete early Palaeogene deep-sea record accumulated at
relatively high sedimentation rates13. The uppermost Palaeoceneand lower Eocene are composed of foraminifer-bearing nannofossilooze, with a few chert layers and two deep-red clay layers marking thePETM and a younger distinctive horizon, named Elmo. Magneto-biostratigraphic results on Site 1262 (see Supplementary Infor-mation) reveal that the Elmo horizon at 117.1–117.2 m compositedepth (m.c.d.) is slightly older than the chron C24r/C24n reversalboundary (115–116 m.c.d.) (Supplementary Fig. 1) and occurswithin the lower part of NP11.
The Elmo horizon is 10–15 cm thick, and characterized by elevatedmagnetic susceptibility (MS) values at all sites (Fig. 1). Analysis of theCaCO3 content (expressed in weight per cent: wt%) of the deepestSite 1262 (palaeodepth13, 3,600 m), intermediate Site 1266 (palaeo-depth, 2,600 m) and shallowest Site 1263 (palaeodepth, 1,500 m)reveal that the increase in MS is linearly related to a drop in CaCO3
wt% (Supplementary Fig. 2). The CaCO3 wt% declines from 90–95below, to ,40 within, the red clay. High-resolution bulk carbonisotope records (d13Cbulk) of Sites 1262, 1265, 1266 and 1267 reveal anegative excursion of 1.0–1.2‰ from below the first decline inCaCO3 wt% into the Elmo (Fig. 1). The d13Cbulk of Site 1263shows the largest depletion (1.4–1.6‰), suggesting that the redclay layer at this site with the highest sedimentation rate13 isstratigraphically the most complete and/or least affected by thedissolution of primary calcite and the presence of reworked orsecondary calcite. The post-Elmo interval mirrors the typicalPETM signature with an exponential recovery to pre-excursiond13Cbulk values. The bulk carbonate oxygen isotope record(d18Obulk) of Site 1263 shows a negative excursion of ,1.6‰ (Fig. 2).
From Site 1263, we analysed the stable isotopic composition ofindividual specimens (.300 mm size fraction) of the surface-dwelling planktonic foraminifer Acarinina soldadoensis and thebenthic foraminifers Cibicidoides spp. and Anomalinoides spp.(Fig. 2). The planktonic foraminiferal data show a much largerinter-specimen variability within each sample (especially within theElmo horizon) than the benthic data. The (smoothed) carbonisotope record of A. soldadoensis (d13CA.soldadoensis) resembles thepattern of the bulk record, but shows a significantly larger negativeexcursion (,2.5‰). The carbon isotope shift is much smaller in thebenthic foraminiferal record than in A. soldadoensis, but the (,1‰)trend through the carbonate-rich intervals equals that of the bulk andplanktonic isotope records. Benthic foraminifera species richness islow and assemblages are dominated by diminutive Nuttallidestruempyi and Abyssamina spp. species in the Elmo horizon. The
LETTERS
1Faculty of Geosciences, Department of Earth Sciences, and 2Laboratory of Palaeobotany and Palynology, Department of Palaeoecology, Utrecht University, Budapestlaan 4,3584 CD Utrecht, The Netherlands. 3Faculty of Earth and Life Sciences, Vrije Universiteit, De Boelelaan 1085, 1081 HV Amsterdam, The Netherlands. 4Earth Science Department,University of California, Santa Cruz, Earth and Marine Sciences Building, Santa Cruz, California 95064, USA. 5Department of Earth and Environmental Sciences, WesleyanUniversity, 265 Church Street, Middletown, Connecticut 06459-0139, USA, and Center for the Study of Global Change, Department of Geology and Geophysics, Yale University,PO Box 208109, New Haven, Connecticut 06520-8109, USA. 6DFG Research Center for Ocean Margins (RCOM), University of Bremen, Leobener Strasse, 28359 Bremen,Germany. 7Scripps Institution of Oceanography, University of California, San Diego, 9500 Gilman Drive, MC0208, La Jolla, California 92093, USA. 8Facolta di Scienze,Dipartimento Scienze della Terra., Universita “G. d’Annunzio” di Chieti, Campus Universitario Madonna delle Piane, Via dei Vestini 31, 66013 Chieti Scalo, Italy.
Vol 435|23 June 2005|doi:10.1038/nature03814
1083© 2005 Nature Publishing Group

Supplementary Information This file contains six supplementary figures, additional references, and extended description of methods used and discussion on (1) magnetobiostratigraphy, (2) magnetic susceptibility (MS) and CaCO3 weight% scales shown in Figure 1, (3) spectral results and astronomical phase relations and (4) global significance of the ETM2 event (and Elmo horizon).
Magnetobiostratigraphy Discrete samples were taken from the working half cores of Site 1262 in 8 cm3 cubes. Samples were alternating field (AF) demagnetised in steps up to 60 mT, using the “double-demagnetisation” technique1 for AF levels above 30 mT. A drilling overprint was generally removed by 15 mT, and the remanence direction was calculated by principle component analysis2 for steps from 20 to 40 mT (4 to 6 points). Directions with a maximum angular deviation2 >10° were rejected. The remaining inclinations were used—along with shipboard pass-through data—to determine polarity.
The new magnetostratigraphic interpretation reveals that the Elmo horizon at 117.1-117.2 meters composite depth (mcd) occurs below the C24r/C24n reversal boundary at 115-116mcd (Supplementary Fig. 1) and not above as it was initially interpreted based on the shipboard measurements3 alone. The shipboard data are noisy, presumably resulting from a combination of low magnetisation and some drilling and/or splitting related deformation. While the discrete data generally give results consistent with the shipboard results, a notable exception is Hole 1262C, on which the shipboard interpretation was largely based. In this case, the discrete samples—taken from the centre of the cores—are presumed to be less deformed than the whole core, therefore giving more reliable data. In addition, a closer examination of records indicated that the first section in Core 1262C-3H was disturbed (highlighted in Supplementary Figure 1), providing unreliable pass-through data. Taken together, discrete and pass-through data from Hole 1262B and the discrete data from Hole 1262C confine the reversal to the interval between 115-116 mcd. The Hole 1262A data show a more gradual transition, but over an interval consistent with that seen in the other holes.
The new magnetostratigraphic interpretation is confirmed by the 20cm-spaced high-resolution calcareous nannofossil biostratigraphy we established for Site 1262. The NP10/NP114 (CP9a/CP9b5) boundary was observed at 118.5 ± 0.1 mcd, where the crossover in abundance between Tribrachiatus contortus and T. orthostylus is present. Other events which are related to the base of NP11 and maintain the same relative stratigraphic positions are from old to young: top of Discoaster multiradiatus at 119.6 ± 0.1 mcd, and the first occurrences of Spenolithus radians and T. orthostylus at 118.5 ± 0.1 mcd. This shows that NP10/NP11 (CP9a/CP9b) is positioned below the C24r/C24n reversal (and Elmo horizon), in accordance with the magnetobiostratigraphic results obtained from previous DSDP holes drilled at Walvis Ridge6. Furthermore, the lowermost occurrence of T. orthostylus was found at 295.75 ± 0.45 mcd in Site 1263, 282.25 ± 0.75 mcd in Site 1265, 295.89 ± 0.45 mcd in Site 1266, 208.35 ± 0.75 mcd in Site 1267, all confirming that the Elmo horizon is younger than the NP10/NP11 boundary.
Lourens et al: MS-2004-11-26649A (Supplementary Information) Page 1 of 11

Magnetic susceptibility and CaCO3 weight% scales The high-resolution MS/g records of Holes 1262A, 1263C, and 1266C were compared to the split core point magnetic susceptibility (PMS) and whole core MS of the multiple sensor track (MS-MST) measurements obtained during Leg 2083. We choose to convert all MS data to the MS-MST scale by performing linear regression analyses between MS/g and PMS (Supplementary Fig. 2a) and the conversion of PMS to MS-MST using the equation MST = PMS x 2.0683 + 7.8257 (R2 = 0.99)3. Subsequently, a regression analysis between the CaCO3 weight% and the MS/g (converted to the MS-MST scale) of the same samples was applied (Supplementary Fig. 2b) to obtain the estimated CaCO3 weight% scale of the various sites (Fig. 1). Spectral results and astronomical tuning procedure Power spectra were obtained by using the CLEAN transformation7 and the Blackman-Tukey method8. For the determination of errors associated with the frequency spectra of the CLEAN algorithm, we applied a Monte Carlo based method9. Significance levels of 95, 97.5, 99 and 99.5% for the Monte Carlo spectra of the MS and L* depth series were determined by 1) 10% (i.e., Control parameter = 0.1) white noise addition, 2) Clean Gain factor of 0.1, 3) 500 CLEAN Iterations, 4) dt value of 0.02m, and 5) a total number of simulation iterations of 1000. The Blackman-Tukey power spectra were obtained by using the AnalySeries 1.1 software package10. In this case, data sets were equally spaced and prepared by removing the linear trends. Bandwidths of ~0.19 (Site 1262) and ~0.16 (Site 1267) have been applied as window to smooth the various spectra of the depth series.
The CLEAN7,9 modulus and Blackman-Tukey8,10 power spectra of L* and MS for Site 1262 revealed consistent and significant peaks at ~510, 123, 53, 38, 30 and 24.5cm (Supplementary Fig. 3). This frequency distribution of the spectral peaks is in good agreement with that of the astronomical cycles: the periodicities of these cycles equal 96 (short eccentricity), 41.5 (obliquity), 30 (obliquity), 23.5 (precession) and 19.5kyr (precession), respectively, if the ~510cm cycle is a reflection of the 405kyr11 (long) eccentricity period. This assumption is consistent with the shipboard age model, which resulted in an average sedimentation rate for the early Eocene time interval at Site 1262 of ~1.2cm/kyr3. The correlative depth interval at Site 1267 revealed significant peaks in the L* spectra at ~570, and 146cm, and to a lesser degree at 58, and 32cm. The long and short eccentricity cycles thus appear to dominate the spectral distribution of this record, whereas the reflection of the obliquity and precession-related cycles is weak and diffuse.
To illustrate how we established the astronomical phase relationship for the extracted short and long eccentricity related MS and L* of Sites 1262 and 1267 (Fig. 3), a detail of the lithological changes in the interval just above the PETM of Site 1262 is shown in Supplementary Fig. 4. This interval clearly reflects the regular occurrence of pink coloured layers (p), which are repeatedly grouped in distinctive bundles of 2-3 layers. The 25-30cm spacing of successive pink coloured layers within one bundle corresponds to the precession-related spectral peaks (Supplementary Fig. 3), indicating that these layers are precession-forced. Evidently, the bundles are related to the short eccentricity-related MS maxima and are more frequently present during the long eccentricity-related MS maxima. In analogy to the well-known astronomical phase relations for the late
Lourens et al: MS-2004-11-26649A (Supplementary Information) Page 2 of 11

Neogene Mediterranean sapropel (=organic-enriched layer) record 12-14, the bundling of pink coloured layers should correspond to a maximum in eccentricity. Due to the eccentricity modulation of the climatic precession cycle, this orbital configuration should have lead to amplified seasonal contrasts on both Hemispheres and hence climate change, thereby triggering the deposition of the pink coloured layers, although it is yet not clear whether these layers should correspond to precession minima or maxima. The near absence of these layers during the long eccentricity-related MS minima further implies that these periods should correspond to minima in the ~405kyr eccentricity cycle, that weakens the effect of the ~100kyr modulation on climatic precession, and hence reduces the precessional-driven seasonal contrasts on both Hemispheres.
To investigate whether the very long orbital variations of ~2.25Myr have had an effect on the amplitude changes of the short eccentricity cycles between the PETM and Elmo horizon we extracted the ~100kyr component from the L* and MS records of Site 1262 by using a Gaussian filter centred at a frequency of 0.8125 ± 0.1 per meter (Supplementary Fig. 5). This analysis clearly revealed that the amplitude changes of the ~100kyr cycles are on-average less amplified during the second (II) ~405kyr related cycle of the L* and MS records from Site 1262 (Fig. 3). This spectral characteristic was compared with the minimum amplitude changes in the ~100kyr eccentricity cycles derived from R715 and La200411 orbital solutions using a Gaussian filter centred at a frequency of 0.0095 ± 0.002 per kyr (Supplementary Fig. 5). Subsequently, the extracted short and long eccentricity related components of the L* and MS records from Site 1262 were tuned using the most likely combination of both the ~2.25Myr related amplitude changes in the ~100kyr cycle and ~405kyr cycle (Fig. 3).
Global significance of the ETM2 event (and Elmo horizon) To illustrate the global significance of the ETM2 event we compared our high-resolution δ13Cbulk records across the Elmo horizon (this study) and PETM16 of Site 1262 with those obtained from the subtropical Northwest Atlantic ODP Site 1051 and the high-latitude Southern Ocean ODP Site 69017 (Supplementary Fig 6). These sites revealed a relatively strong negative excursion (termed H1) just below C24n/C24r (Site 1051) and within NP11 (Sites 690 and 1051), which bears strong resemblance with a similar negative excursion in the North Atlantic DSDP Site 550, and equatorial Pacific DSDP Site 57717 (not shown). Given the good magnetobiostratigraphic constraints as well as the relative strength of this carbon isotope excursion with respect to that of the PETM, we conclude that the H1 is the equivalent of the ETM2 event. It should be noted that of all these sites only the magnetobiostratigraphy of Site 690 seems questionable, probably due to a series of unconformities immediately above the transient event H1 as indicated by the tight succession of the NP10/NP11, NP11/NP12, and NP12/NP14 zonal boundaries18-20.
To further illustrate that the CIE associated with the ETM2 is not only recorded in the marine realm, we also plotted the paleosol soil nodule carbonate isotope record from the Bighorn Basin21 in Supplementary Fig. 6. Although this record seems to reflect a noisy signal in some parts, the application of a 3 point moving average clearly demonstrate that the long-term Eocene δ13C low is superimposed by two excursions: one definitely
Lourens et al: MS-2004-11-26649A (Supplementary Information) Page 3 of 11

related to the PETM and the other less amplified excursion in the interval just below the C24n/r boundary to, most likely, the ETM2 event. References 1. Tauxe, L., Pick, T. & Kok, Y. S. Relative paleointensity in sediments: a pseudo-
Thellier approach. Geophysical Research Letters 22, 2885-2888 (1995). 2. Kirschvink, J. L. The least-squares line and plane and the analysis of
paleomagnetic data. Geophys. J. Roy. Astron. Soc. 62, 699-718 (1980). 3. Zachos, J. C., Kroon, D., Blum, P. & al., e. Early Cenozoic Extreme Climates:
The Walvis Ridge Transect (eds. Zachos, J. C., Kroon, D. & Blum, P.) (2004). 4. Martini, E. in Planktonic Conference (ed. Farinacci, A.) 739-785 (Tecnosci,
Roma, 1971). 5. Okada, H. & Bukry, D. Supplementary modification and introduction of code
numbers to the low-latitude coccolith biostratigraphic zonation (Bukry, 1973; 1975). Mar. Micropaleontol. 5, 321-325 (1980).
6. Backman, J. Late Paleocene to middle Eocene calcareous nannofossil biochronology from Shatsky Rise, Walvis Ridge and Italy. Palaeo Geography Climatology Ecology 57, 43-59 (1986).
7. Roberts, D. H., Lehar, J. & Dreher, J. W. Time series analysis with CLEAN. Part I. Derivation of a spectrum. Astron. J. 93, 968-989 (1987).
8. Blackman, R. B. & Tukey, J. W. The Measurement of Power Spectra From the Point of View of Communication Engineering. (Dover Publications, New York, 1958).
9. Heslop, D. & Dekkers, M. J. Spectral analysis of unevenly spaced climatic time series using CLEAN: signal recovery and derivation of significance levels using a Monte Carlo simulation. Physics of the Earth and Planetary Interiors 130, 103-116 (2002).
10. Paillard, D., Labeyrie, L. & Yiou, P. Macintosh Program Performs Time-Series Analysis. Eos Trans. AGU 77, 379 (1996).
11. Laskar, J. et al. A long term numerical solution for the insolation quantities of Earth. Astronomy and Astrophysics 428, 261-285 (2004).
12. Hilgen, F. J. Astronomical calibration of Gauss to Matuyama sapropels in the Mediterranean and implication for the geomagnetic polarity time scale. Earth Planet. Sci. Lett. 104, 226-244 (1991).
13. Lourens, L. J. et al. Evaluation of the Plio-Pleistocene astronomical timescale. Paleoceanography 11, 391-413 (1996).
14. Hilgen, F. J. et al. Extending the astronomical (polarity) time scale into the Miocene. Earth Planet. Sci. Lett. 136, 495-510 (1995).
15. Varadi, F., Bunnegar, B. & Ghil, M. Successive refinements in long-term integrations of planetary orbits. Astrophysical J. 592, 620-630 (2003).
16. Zachos, J. C. et al. Rapid Acidification of the Ocean during the Paleocene-Eocene Thermal Maximum. Science (in press).
17. Cramer, B. S., Wright, J. D., Kent, D. V. & Aubry, M.-P. Orbital climate forcing of d13C excursions in the late Paleocene–early Eocene (chrons C24n–C25n). Paleoceanography 18, 10.1029/2003PA000909 (2003).
Lourens et al: MS-2004-11-26649A (Supplementary Information) Page 4 of 11

18. Berggren, W. A. & Aubry, M.-P. in Correlation of the Early Paleogene in Northwset Europe, Special Publication (eds. Knox, R. W. O. B., Corfield, R. M. & Dunay, R. E.) (Geol. Soc., London, 1996).
19. Aubry, M.-P., Berggren, W. A., Stott, L. D. & Sinha, A. in Correlation of the Early Paleogene in Northwest Europe, Special Publication (eds. Knox, R. W. O. B., Corfield, R. M. & Dunay, R. E.) (Geol. Soc., London, 1996).
20. Ali, J., Kent, D. V. & Hailwood, E. Magnetostratigraphic reinvestigation of the Palaeocene/Eocene boundary interval in Hole 690B, Maud Rise. Geoph. J. Int. 141, 639-646 (2000).
21. Koch, P. L. et al. in Causes and Consequences of Globally Warm Climates in the Early Paleogene (eds. Wing, S. L., Gingerich, P. D., Schmitz, B. & Thomas, E.) 49-64 (Geological Society of America Special Paper, Boulder, Colorado, 2003).
Lourens et al: MS-2004-11-26649A (Supplementary Information) Page 5 of 11

Mete
rs C
om
posite D
epth
C25n
C26n
C24r
C24n.3n
C24n.1n?
Inclination InclinationInclination
Supplementary Figure 1 Late Palaeocene to early Eocene magnetostratigraphy for ODP Site 1262. Shipboard pass-
through inclination (demagnetized to 15 mT; grey lines) and discrete sample inclination (principle component calculated
from 20 to 40 mT; blue circles). Shaded interval on site 1262C represents a particularly disturbed core section, results
from which should not be considered reliable. Overall magnetostratigraphic interpretation to right. Black = normal
polarity; white = reverse; grey = indeterminate.
Disturbed
-90 -45 0 45 90 -90 -45 0 45 90-90 -45 0 45 90
80
100
120
140
160
180
Elmo
PETM
C23n.2n?
1262A 1262B 1262C
Lourens et al: MS-2004-11-26649A (Supplementary Information) Page 6 of 11

-5
0
5
10
15
20
25
30
35
40
0 10 20 30 40 50
1262 PMS = 0.8357 x MS/g - 4.2972 (R2 = 0.95)
1266 PMS = 0.909 x MS/g - 3.904 (R2 = 0.92)
1263 PMS = 0.7203 x MS/g - 2.5495 (R2 = 0.96)
MS (per gram; discrete samples)
Po
int
MS
a
Supplementary Figure 2 Regression analyses for the magnetic susceptibility to calcium carbonate weight percentage
conversion of Sites 1262, 1263 and 1267. a, Magnetic susceptibility per gram sediment (MS/g) versus shipboard point
magnetic susceptibility (PMS). The MS/g values were converted to the shipboard magnetic susceptibility scale of the
multi sensor track (MS-MST) using the displayed function for each site and the equation MS-MST = PMS x 2.0683 +
7.8257 (R2 = 0.99) (Ref. 3). b, MS/g (on the recalibrated MS-MST scale) versus CaCO3 weight%.
30
40
50
60
70
80
90
100
0 10 20 30 40 50 60 70 80 90 100
1262 CaCO3 = -0.6681 x MST + 100.3 (R2 = 0.99)
1266 CaCO3 = -0.6337 x MST + 101.86 (R2 = 0.84)
1263 CaCO3 = -0.79 x MST + 102.9 (R2 = 0.93)
Ca
CO
3 (
wt.
%)
MS (MST units)
b
Lourens et al: MS-2004-11-26649A (Supplementary Information) Page 7 of 11

Site 1267: L*
(204.9-231.1mcd)
570cm
146cm
32cm58cm
0.01
0.10
1.00
10.00
510cm
123cm
30cm
53cm 24.5cm
Site 1262: L*(117.25-139mcd)
38cm
0 1 2 3 4 5
Frequency (cycles/m)
0.00
0.50
1.00
0.01
0.10
1.00
10.00
0.50
1.00
0.00
Mo
du
lus
Po
wer
Site 1262: MS(117.25-139mcd)
510cm
123cm
30cm
53cm24.5cm
0.00
0.50
1.00
1.50
0.01
0.10
1.00
10.00
95%
99%
99.5%
97.5%
38cm
Mo
du
lus
Po
wer
Mo
du
lus
Po
wer
BW
BW
95% CL
95% CL
95% CL
BW
95%
99%
99.5%
97.5%
95%
99%
99.5%
97.5%
Supplementary Figure 3 Frequency spectra of the
magnetic susceptibility and color reflectance
records of Sites 1262 and 1267 for the Elmo-PETM
interval. Results of the CLEAN-algorithm and
Blackman-Tukey (BT) are expressed by their
modulus and power, respectively. Horizontal dotted
lines indicate the 95, 97.5, 99, and 99.5%
significance level of the CLEANED-spectra.
Bandwidth (BW) and 95% confidence limits (CF)
of the BT spectra are based on a Tukey window
with a number of lags that equal 30% the length
of the data series.
Lourens et al: MS-2004-11-26649A (Supplementary Information) Page 8 of 11

Site 1262
132 136
Depth (mcd)
Lo
gM
S (
Inst. u
nits)
IV V1.0
1.5
ppppp pp p p p p p p p pp
18
1716
1514
13
19
138134
Supplementary Figure 4 Comparison between precession-related lithological changes and eccentricity cycles in the
magnetic susceptibility record of Site 1262. The pink-coloured layers, related to precession, are particularly distinctive
during maxima in the short and long-term eccentricity related cycles of the MS record.
Lourens et al: MS-2004-11-26649A (Supplementary Information) Page 9 of 11
PETM
Age (Ma)
Ec
ce
ntr
icit
y
Elmo PETM
-0.02
0.00
0.02
-0.02
0.00
0.02
~2.25Myr
-0.004
0.000
0.004
-0.004
0.000
0.004
~2.25Myr
53.0 54.0 55.0 56.0
8
12
34
56
7
19
9 10
1112
1314
15
16
17
18
8
12
345 6
7
19
910
1112
13
14
15
16
17
18
La2004
R7
Elmo
Elmo
Site 1262
L* (
%)
Lo
gM
S (
Ins
t.
PETM
116 120 124 128 132 136 140
Depth (mcd)
-2.00
0.00
2.00-1.00
0.00
1.00
8
12 3 4 5 6
7
19
9 10
11
12
13 1415 16
17 18
C2
4n
C2
4r
Supplementary Figure 5 Amplitude modulation of the ~100kyr eccentricity components in Site 1262 and orbital
computations. Gaussian filters centred at a frequency of 0.0095 ± 0.002 per kyr and 0.8125 ± 0.1 per meter were
applied to extract the ~100kyr eccentricity components from the R7 (Ref. 15) and La2004 (Ref. 11) orbital solutions
and their correlative cycles from the L* (solid) and MS (dot) records of Site 1262, respectively.
Lourens et al: MS-2004-11-26649A (Supplementary Information) Page 10 of 11

130
140
150
160
170C
24n
3n
470
500
530
De
pth
(m
bsf)
53.5
54.0
54.5
120
130
140
De
pth
(m
cd
)
De
pth
(m
cd
)
Ag
e (
Ma
)
0 1 2 3
δ13C (‰)
Hole 690B Site 1051 Bighorn Basin Site 1262
1 2 3
δ13C (‰)
-14 -12 -10
δ13C (‰)
1 2 3
δ13C (‰)
0
NP
9N
P1
011
12
14
NP
9N
P1
0N
P11
C24n.3
nC
24
r
C24n.3n
-8
55.0
CP
9b
ETM2
PETM
CP
8a
CP
9a
CP
8b
a b c d
NP
11
NP
10
NP
9
NP
10
NP
9N
P11
H1 H1
A BB
Supplementary Figure 6 Global registration of the PETM and Elmo carbon isotope excursions in four well-dated (magneto- and/or nannofossil stratigraphy) sections.
a, ODP Hole 690B (Southern Ocean) (Ref. 17). b, ODP Holes 1051A (red) and 1051B (blue) (Blake Nose, Northwestern Atlantic) (Ref. 17). c, Paleosol carbonate isotope
record from the Bighorn Basin (Wyoming, USA) (Ref. 21). d, ODP Site 1262 (this study) and PETM (Ref. 16).
Lourens et al: MS-2004-11-26649A (Supplementary Information) Page 11 of 11

few measured benthic isotope values of the Elmo horizon, represent-ing Anomalinoides spp. specimens (Cibicidoides spp. .300 mm areabsent in the Elmo horizon), are similar to those from outside theclay layer, indicating that these are probably derived from biotur-bated specimens. This suggests that large-sized benthic foraminiferawere absent during deposition of the Elmo horizon, as commonlyobserved for the PETM17. The presence of light-coloured burrowswithin the red clay layer documents bioturbation, and could explainthe scatter in the planktonic isotope values, and the less strongd13Cbulk excursion relative to d13CA.soldadoensis. This possibility doesnot rule out that the magnitude of the excursion in the deep sea couldhave been damped owing to the larger carbon mass of this reservoir.The maximum oxygen isotope shift in A. soldadoensis(d18OA.soldadoensis) across the Elmo horizon is comparable to that ofthe d18Obulk record. There is only a ,0.6‰ shift in the benthic
oxygen isotope record, either because no in situ large benthicforaminifera are present in the Elmo horizon or changes in bottomwater temperatures were minor.
To unravel the orbital relationship between the Elmo horizon andPETM, we studied the cyclic sedimentary patterns of the interlyinginterval in continuous spliced cores derived from advanced pistoncore holes only. Spectral analysis was applied on the colour reflec-tance (L*) of Site 1267, and L* and MS of Site 1262 (see Supplemen-tary Information). The spectra of all records revealed the dominanceof the long (,405-kyr) and short (,100-kyr) eccentricity cycles(Supplementary Fig. 3). Both components were extracted and couldbe unambiguously correlated between the records of these sites(Fig. 3). Four long-term maxima in MS (minima in L*) occurbetween the Elmo horizon and PETM. The Elmo horizon corre-sponds to a fifth long-term MS maximum (L* minimum) and a
Figure 1 | Bulk carbonate d13C and magnetic susceptibility (MS) recordsacross the Elmo horizon at five ODP Leg 208 sites. The CaCO3 wt% axesare estimates based on linear correlation with MS measurements on thesame samples (Methods). Site numbers are given at the top left of each panel.
Site numbers and water depths (m) are as follows: 1263, 2,717m; 1265,3,060m; 1266, 3,798m; 1267, 4,355m; 1262, 4,755m. Digital images of thelithology are plotted at the left site of each panel.
Figure 2 | Stable isotope series of bulk sediment and single foraminiferspecimens across the Elmo horizon at Site 1263. a, The d13C values (bluedots) of the surface dwelling planktonic foraminifer A. soldadoensis(d13CA.soldadoensis). b, The d
13C values of the bottom dwelling benthicforaminifers (d13Cbenthos)Cibicidoides spp. (red squares) andAnomalinoides
spp. (green dots). c and d as in a and b but for d18O. Grey lines in a and b, andin c and d, indicate respectively the d13C and d18O values of the bulksediment (d13Cbulk, d
18Obulk). Blue lines represent three-point movingaverages on averaged values of duplicate analyses of a sample.
LETTERS NATURE|Vol 435|23 June 2005
1084© 2005 Nature Publishing Group

short-term MS maximum (L* minimum) cycle. The red clay layerassociated with the PETM ends in a long-term MS minimum(L* maximum). If there were 11 climate precession cycles in thePETM interval18, then its carbon isotope excursion corresponds to amaximum (minimum) in the long-term MS (L*) cycle, similar to theElmo.
A definite tuning of the early Eocene to astronomical compu-tations is complicated, because the precision of the orbital solutionmore than 45 Myr ago is limited19,20. Tuning is in principle possiblefor the 405-kyr eccentricity cycle, because of its longer duration ofstability19,20 (Fig. 3). At 50 Myr ago, the absolute uncertainty in timeis about 20 kyr (ref. 20), but this did not lead to an astronomically
tuned timescale owing to large uncertainties in radiometric ageconstraints for this time interval21. A second uncertainty derivesfrom the chaotic behaviour of the inner planets related to theresonant argument v¼ ðs4 2 s3Þ2 2ðg4 2 g3Þ; where g 3, g 4 arerelated to the precession of the perihelion and s3, s4 to the precessionof the node of Earth and Mars20. This causes a large uncertainty inthe determination of the time when the relatively stable ,2.4-Myrbeat in eccentricity evolved from the ,1.2-Myr period whenðs4 2 s3Þ2 ðg4 2 g3Þ ¼ 0 (that is,,2.25 Myr in the nominal La200420
and R719 solutions between 53–57 Myr ago). This problem limits anaccurate age determination of successive minima in this very longeccentricity cycle and the related intervals of reduced amplitude
Figure 3 | Astronomical tuning of the lower Eocene sediments at Walvisridge to two different orbital computations. a, The extracted short (redlines) and long (grey lines) eccentricity-related cycles from magneticsusceptibility (MS) and colour reflectance (L*) of sites 1262 and 1267(dashed lines) represent respectively the 97.5% and 99.5% significant peaksin the CLEAN spectra (Supplementary Fig. 4). b, Correlation of the long-
term (I–V) and short-term (0–19) eccentricity-related maxima to theircorrelative cycles in the R723 (grey) and La200424 (red) orbital solutions. The405-kyr and ,2.25-Myr cycles of eccentricity were extracted using agaussian filter with a frequency of 0.00247 ^ 0.0001 (kyr21) and of0.00043 ^ 0.0001 (kyr21), respectively.
NATURE|Vol 435|23 June 2005 LETTERS
1085© 2005 Nature Publishing Group
changes in the short eccentricity cycle, and explains the offsetbetween the ,2.25-Myr cycles of the nominal La2004 and R7solutions in the studied time interval (Fig. 3).
Because of these uncertainties, only a floating tuning could berealized (see also Supplementary Information). First, we emphasizethat MS maxima (L* minima) correlate to eccentricity maxima basedon the distinct amplification of the precession-related lithologicalchanges during the long- and short-term MS maxima (Supplemen-tary Fig. 4). This observation is crucial, because it implies that thecarbon isotope shifts associated with the PETM and Elmo horizonalso correspond to maxima in the long and short eccentricitycycles (Fig. 3). Second, we correlated the (on average less amplified),100-kyr cycles within the second (II; Fig. 3) ,405-kyr cycle to theminimum in the ,2.25-Myr cycle at 53.5 Myr ago (La2004) or54.0 Myr ago (R7) (Supplementary Fig. 5). Using this first ordercalibration, we tuned all long and short eccentricity cycles, implyingthat all cycles should be shifted one ,405-kyr cycle older in R7 thanin the nominal La2004 solution (Fig. 3). As a result, the Elmo horizoncorrelates with the short eccentricity maximum at ,53.235 Myr ago(La2004) or ,53.620 Myr ago (R7), and the onset of the PETMcarbon isotope excursion correlates with the long eccentricitymaximum centred at ,55.270 Myr ago (La2004) or ,55.675 Myrago (R7). This tuning implies that both events occurred brieflyafter a period of low-amplitude, short eccentricity changes associatedwith a minimum in the very long-term orbital perturbation of,2.25 Myr.
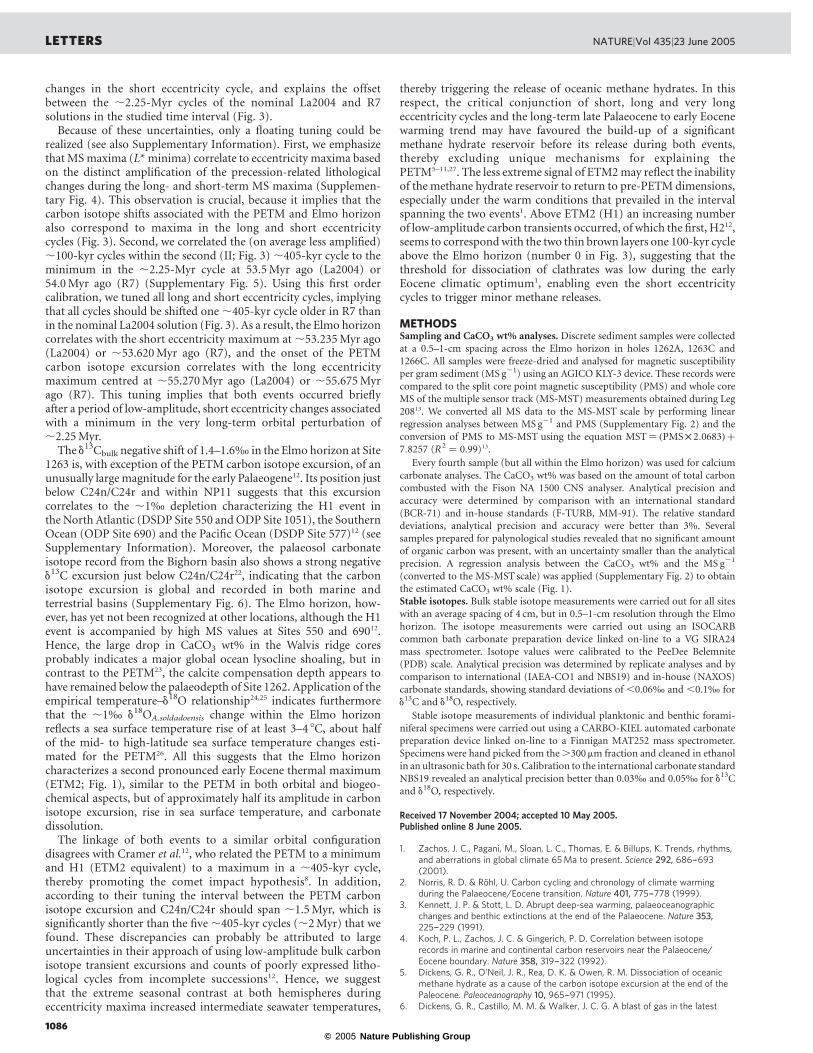
The d13Cbulk negative shift of 1.4–1.6‰ in the Elmo horizon at Site1263 is, with exception of the PETM carbon isotope excursion, of anunusually large magnitude for the early Palaeogene12. Its position justbelow C24n/C24r and within NP11 suggests that this excursioncorrelates to the ,1‰ depletion characterizing the H1 event inthe North Atlantic (DSDP Site 550 and ODP Site 1051), the SouthernOcean (ODP Site 690) and the Pacific Ocean (DSDP Site 577)12 (seeSupplementary Information). Moreover, the palaeosol carbonateisotope record from the Bighorn basin also shows a strong negatived13C excursion just below C24n/C24r22, indicating that the carbonisotope excursion is global and recorded in both marine andterrestrial basins (Supplementary Fig. 6). The Elmo horizon, how-ever, has yet not been recognized at other locations, although the H1event is accompanied by high MS values at Sites 550 and 69012.Hence, the large drop in CaCO3 wt% in the Walvis ridge coresprobably indicates a major global ocean lysocline shoaling, but incontrast to the PETM23, the calcite compensation depth appears tohave remained below the palaeodepth of Site 1262. Application of theempirical temperature–d18O relationship24,25 indicates furthermorethat the ,1‰ d18OA.soldadoensis change within the Elmo horizonreflects a sea surface temperature rise of at least 3–4 8C, about halfof the mid- to high-latitude sea surface temperature changes esti-mated for the PETM26. All this suggests that the Elmo horizoncharacterizes a second pronounced early Eocene thermal maximum(ETM2; Fig. 1), similar to the PETM in both orbital and biogeo-chemical aspects, but of approximately half its amplitude in carbonisotope excursion, rise in sea surface temperature, and carbonatedissolution.
The linkage of both events to a similar orbital configurationdisagrees with Cramer et al.12, who related the PETM to a minimumand H1 (ETM2 equivalent) to a maximum in a ,405-kyr cycle,thereby promoting the comet impact hypothesis8. In addition,according to their tuning the interval between the PETM carbonisotope excursion and C24n/C24r should span ,1.5 Myr, which issignificantly shorter than the five ,405-kyr cycles (,2 Myr) that wefound. These discrepancies can probably be attributed to largeuncertainties in their approach of using low-amplitude bulk carbonisotope transient excursions and counts of poorly expressed litho-logical cycles from incomplete successions12. Hence, we suggestthat the extreme seasonal contrast at both hemispheres duringeccentricity maxima increased intermediate seawater temperatures,
thereby triggering the release of oceanic methane hydrates. In thisrespect, the critical conjunction of short, long and very longeccentricity cycles and the long-term late Palaeocene to early Eocenewarming trend may have favoured the build-up of a significantmethane hydrate reservoir before its release during both events,thereby excluding unique mechanisms for explaining thePETM5–11,27. The less extreme signal of ETM2 may reflect the inabilityof the methane hydrate reservoir to return to pre-PETM dimensions,especially under the warm conditions that prevailed in the intervalspanning the two events1. Above ETM2 (H1) an increasing numberof low-amplitude carbon transients occurred, of which the first, H212,seems to correspond with the two thin brown layers one 100-kyr cycleabove the Elmo horizon (number 0 in Fig. 3), suggesting that thethreshold for dissociation of clathrates was low during the earlyEocene climatic optimum1, enabling even the short eccentricitycycles to trigger minor methane releases.
METHODSSampling and CaCO3 wt% analyses. Discrete sediment samples were collectedat a 0.5–1-cm spacing across the Elmo horizon in holes 1262A, 1263C and1266C. All samples were freeze-dried and analysed for magnetic susceptibilityper gram sediment (MS g21) using an AGICO KLY-3 device. These records werecompared to the split core point magnetic susceptibility (PMS) and whole coreMS of the multiple sensor track (MS-MST) measurements obtained during Leg20813. We converted all MS data to the MS-MST scale by performing linearregression analyses between MS g21 and PMS (Supplementary Fig. 2) and theconversion of PMS to MS-MST using the equation MST ¼ ðPMS£ 2:0683Þþ7:8257 (R2 ¼ 0.99)13.
Every fourth sample (but all within the Elmo horizon) was used for calciumcarbonate analyses. The CaCO3 wt% was based on the amount of total carboncombusted with the Fison NA 1500 CNS analyser. Analytical precision andaccuracy were determined by comparison with an international standard(BCR-71) and in-house standards (F-TURB, MM-91). The relative standarddeviations, analytical precision and accuracy were better than 3%. Severalsamples prepared for palynological studies revealed that no significant amountof organic carbon was present, with an uncertainty smaller than the analyticalprecision. A regression analysis between the CaCO3 wt% and the MS g21
(converted to the MS-MST scale) was applied (Supplementary Fig. 2) to obtainthe estimated CaCO3 wt% scale (Fig. 1).Stable isotopes. Bulk stable isotope measurements were carried out for all siteswith an average spacing of 4 cm, but in 0.5–1-cm resolution through the Elmohorizon. The isotope measurements were carried out using an ISOCARBcommon bath carbonate preparation device linked on-line to a VG SIRA24mass spectrometer. Isotope values were calibrated to the PeeDee Belemnite(PDB) scale. Analytical precision was determined by replicate analyses and bycomparison to international (IAEA-CO1 and NBS19) and in-house (NAXOS)carbonate standards, showing standard deviations of ,0.06‰ and ,0.1‰ ford13C and d18O, respectively.
Stable isotope measurements of individual planktonic and benthic forami-niferal specimens were carried out using a CARBO-KIEL automated carbonatepreparation device linked on-line to a Finnigan MAT252 mass spectrometer.Specimens were hand picked from the .300mm fraction and cleaned in ethanolin an ultrasonic bath for 30 s. Calibration to the international carbonate standardNBS19 revealed an analytical precision better than 0.03‰ and 0.05‰ for d13Cand d18O, respectively.
Received 17 November 2004; accepted 10 May 2005.Published online 8 June 2005.
1. Zachos, J. C., Pagani, M., Sloan, L. C., Thomas, E. & Billups, K. Trends, rhythms,and aberrations in global climate 65 Ma to present. Science 292, 686–-693(2001).
2. Norris, R. D. & Rohl, U. Carbon cycling and chronology of climate warmingduring the Palaeocene/Eocene transition. Nature 401, 775–-778 (1999).
3. Kennett, J. P. & Stott, L. D. Abrupt deep-sea warming, palaeoceanographicchanges and benthic extinctions at the end of the Palaeocene. Nature 353,225–-229 (1991).
4. Koch, P. L., Zachos, J. C. & Gingerich, P. D. Correlation between isotoperecords in marine and continental carbon reservoirs near the Palaeocene/Eocene boundary. Nature 358, 319–-322 (1992).
5. Dickens, G. R., O’Neil, J. R., Rea, D. K. & Owen, R. M. Dissociation of oceanicmethane hydrate as a cause of the carbon isotope excursion at the end of thePaleocene. Paleoceanography 10, 965–-971 (1995).
6. Dickens, G. R., Castillo, M. M. & Walker, J. C. G. A blast of gas in the latest
LETTERS NATURE|Vol 435|23 June 2005
1086© 2005 Nature Publishing Group

Paleocene: Simulating first-order effects of massive dissociation of oceanicmethane hydrate. Geology 25, 259–-262 (1997).
7. Thomas, E. & Shackleton, N. J. in Correlation of the Early Paleogene inNorthwestern Europe (eds Knox, R. W. O. B., Corfield, R. M. & Dunay, R. E.)401–-441 (Special Publication 101, Geological Society, London, 1996).
8. Kent, D. V. et al. A case for a comet impact trigger for the Paleocene/Eocenethermal maximum and carbon isotope excursion. Earth Planet. Sci. Lett. 211,13–-26 (2003).
9. Bralower, T. J. et al. High-resolution records of the late Paleocene thermalmaximum and circum-Caribbean volcanism: Is there a causal link? Geology 25,963–-966 (1997).
10. Schmitz, B. et al. Basaltic explosive volcanism, but no comet impact, at thePaleocene-Eocene boundary: high-resolution chemical and isotopic recordsfrom Egypt, Spain and Denmark. Earth Planet. Sci. Lett. 225, 1–-17 (2004).
11. Katz, M. E., Cramer, B. S., Mountain, G. S., Katz, S. & Miller, K. G. Uncorking thebottle: What triggered the Paleocene/Eocene thermal maximum methanerelease? Paleoceanography 16, 1–-14 (2001).
12. Cramer, B. S., Wright, J. D., Kent, D. V. & Aubry, M.-P. Orbital climate forcingof d13C excursions in the late Paleocene–-early Eocene (chrons C24n–-C25n).Paleoceanography 18, doi:10.1029/2003PA000909 (2003).
13. Zachos, J. C., et al. in Early Cenozoic Extreme Climates: The Walvis Ridge Transect(eds Zachos, J. C., Kroon, D. & Blum, P.) (Ocean Drilling Program, CollegeStation, Texas, 2004).
14. Thomas, E. & Zachos, J. C. Was the late Paleocene thermal maximum a uniqueevent? Geol. For. Stockh. Forh. [Trans. Geol. Soc. Stockholm] 122, 169–-170(2000).
15. Bujak, J. P. & Brinkhuis, H. in Late Paleocene - Early Eocene Biotic and ClimaticEvents in the Marine and Terrestrial Records (eds Aubry, M.-P., Lucas, S. G. &Berggren, W. A.) 277–-295 (Columbia Univ. Press, New York, 1998).
16. Rohl, U., Norris, R. D. & Ogg, J. G. in Causes and Consequences of Globally WarmClimates in the Early Paleogene (eds Wing, S. L., Gingerich, P. D., Schmitz, B. &Thomas, E.) 567–-589 (Special Paper 369, Geological Society of America,Boulder, Colorado, 2003).
17. Thomas, E., Zachos, J. C. & Bralower, T. J. in Warm Climates in Earth History(eds Huber, B. T., MacLeod, K. & Wing, S. L.) 132–-160 (Cambridge Univ. Press,Cambridge, 2000).
18. Rohl, U., Bralower, T. J., Norris, G. & Wefer, G. New chronology for the latePaleocene thermal maximum and its environmental implications. Geology 28,927–-930 (2000).
19. Varadi, F., Bunnegar, B. & Ghil, M. Successive refinements in long-termintegrations of planetary orbits. Astrophys. J. 592, 620–-630 (2003).
20. Laskar, J. et al. A long term numerical solution for the insolation quantities ofEarth. Astron. Astrophys. 428, 261–-285 (2004).
21. Machlus, M., Hemming, S. R., Olsen, P. E. & Christie-Blick, N. Eocenecalibration of geomagnetic polarity time scale reevaluated: Evidence from theGreen River Formation of Wyoming. Geology 32, 137–-140 (2004).
22. Koch, P. L. et al. in Causes and Consequences of Globally Warm Climates in theEarly Paleogene (eds Wing, S. L., Gingerich, P. D., Schmitz, B. & Thomas, E.)49–-64 (Special Paper 369, Geological Society of America, Boulder, Colorado,2003).
23. Zachos, J. C. et al. Rapid acidification of the ocean during the Paleocene-Eocene Thermal Maximum. Science (in the press).
24. O’Neil, J. R., Clayton, R. N. & Mayeda, T. K. Oxygen isotope fractionation indivalent metal carbonates. J. Chem. Phys. 51, 5547–-5558 (1969).
25. Shackleton, N. J. Oxygen isotope analyses and Pleistocene temperaturesreassessed. Nature 215, 15–-17 (1967).
26. Zachos, J. C. et al. A transient rise in tropical sea surface temperature duringthe Paleocene-Eocene thermal maximum. Science 302, 1151–-1154 (2003).
27. Svensen, H. et al. Release of methane from a volcanic basin as a mechanismfor initial Eocene global warming. Nature 429, 542–-545 (2004).
Supplementary Information is linked to the online version of the paper atwww.nature.com/nature.
Acknowledgements This research used samples and data provided by theOcean Drilling Program (ODP). This work was supported by the NetherlandsOrganisation for Scientific Research (L.J.L., A.S. and D.K.), Utrecht BiogeologyCentre (A.S.), Deutsche Forschungsgemeinschaft (U.R.), and the NationalScience Foundation (J.C.Z., E.T. and J.B.). We thank the scientific and non-scientific crew of ODP Leg 208, J. Suhonen in particular, and G. Ittman, A. E. vanDijk, G. M. Ganssen, S. J. A. Jung, H. B. Vonhof, P. L. Koch, H. Brinkhuis,F. J. Hilgen, T. Kouwenhoven and J. W. Zachariasse for technical support, adviceand comments.
Author Information Reprints and permissions information is available atnpg.nature.com/reprintsandpermissions. The authors declare no competingfinancial interests. Correspondence and requests for materials should beaddressed to L.J.L. ([email protected]).
NATURE|Vol 435|23 June 2005 LETTERS
1087© 2005 Nature Publishing Group