Embed Size (px)
Citation preview
Void-fraction measurements and sound-speed fields in bubble plumes generated by breaking waves
Eric Lamarre and W. K. Melville a) R. M. Parsons Laboratory, Department of Civil and Environmental Engineering, Massachusetts Institute of Technology, Cambridge, Massachusetts 02139
(Received 17 April 1992; revised 20 September 1993; accepted 12 October 1993)
Recent field and laboratory experiments have confirmed that low-frequency sound (10 to 300 Hz) is generated under breaking waves. It has been proposed titat collective oscillations of the bubble plume generated by breakintg may be the mechanism responsible for the generation of this sound. Confirmation of this process requires independent measurement of the void fraction, and therefore sound speed, in the bubbly mixture. Detailed measurements are presented of the evolution of the void-fraction field in bubble plumes generated by large-scale three-dimensional (3-D) laboratory breaking waves. Various moments of the void-fraction field are calculated and compared with results from two-dimensional (2-D) laboratory breaking waves [Lamarre and Melville, Nature 351, 469-472 ( 1991)]. The kinematics of the bubble plume reveals that the initial horizontal velocity of the plume is approximately 0.7C, where C is the wave phase speed. The centroid of the bubble plume is found to deepen at a speed of approximately 0.2H/T, where H and T are the wave height at breaking and the wave period, respectively. The radial dependence of the void-fraction and sound-speed field is characterized in terms of simple functions of time. Finally, the void-fraction measurements described here, along with independent measurements of the pressure fluctuations under breaking waves [Loewen and Melville, J. Acoust. Soc. Am. 95, 1329-1343 (1994)], support the hypothesis that low-frequency sound is generated by the collective oscillations of the bubble plume.
PACS numbers: 43.30.Pc, 43.30.iFt, 43.30.Lz, 43.30.Nb
INTRODUCTION
Over the past 6 years, there has been much interest in determining the natural mechanisms responsible for the generation of sound at the ocean surface. Field experiments have given ample evidence that breaking waves generate sound in the audio range.•'2 However, there is still specu- lation as to which physical mechanisms are: responsible for the sound generation within the breaking wave. In the fre- quency range from 500 Hz to 20 kHz, there is strong evi- dence both from laboratory 34 and field exlperiments, 7 and from modeling 8 that the primary source of sound in break- ing waves is newly created bubbles oscillating at their low- est linear resonant frequency (the "breathing" mode).
Field experiments have shown that breaking waves can generate significant sound levels below 500. Hz.• Based on reviews of measurements and theory, it has been proposed 9'm that the collective oscillations (or volume os- cillations) of the bubble plume generate, d by breaking waves may be an important mechanism for the generation of sound at these low frequencies (10 to :500 Hz). Yoon et al. TM have conducted a laboratory experiment where a cylindrical bubble column was generated by a series of hypodermic needles located at the bottom of a tank. The peak low-frequency pressure fluctuations f¾om the bubble
a)Present address: Scripps Institution of Oceanography, University of Cal- ifornia San Diego, La Jolla, CA 92093-0213.
column (260 to 550 Hz) matched very well with the the- oretical frequencies predicted by the bubble cloud model of Lu et al. n These measurements showed evidence of a col- lective oscillation phenomenon for a steady vertical cylin- drical bubble plume but it remains to be demonstrated that collective oscillations exist in plumes generated by break- ing waves. Recently, Kolaini et al. •3 have conducted exper- iments on the low-frequency acoustic signature of bubble plumes generated by dropping water from a cylindrical container. They observed that low-frequency sound was generated when a large "substructure" detached from the plume. They suggested that this may be a new mechanism for the generation of low-frequency sound, distinct from the collective oscillations discussed above.
The key to the prediction of the low-frequency sound generated 'by the collective oscillations of a bubble plume is a knowledge of the space-time distribution of void fraction from which one can calculate the sound speed using an equation derived by Wood. TM Until recently, it has been difficult to make even order-of-magnitude estimates of the void fraction inside these bubble plumes and this has been an impediment to the study of the mechanisms responsible for the generation of low-frequency sound. • We now have direct evidence both in the laboratory 16 and in the field •7 that void fractions well above 1% are present for signifi- cant times in bubble plumes generated by breaking waves. Lamarre and Melville •6 have presented a detailed set of measurements of the evolution of the void-fraction field in
1317 J. Acoust. Soc. Am. 95 (3), March 1994 0001-4966/94/95(3)/1317/12/$6.00 @ 1994 Acoustical Society of America 1317

2-D laboratory breaking waves. These measurements have shown that moments of the void-fraction field (i.e., volume of air entrained, plume cross-sectional area, mean plume void fraction, and plume potential energy) evolved as sim- ple functions of time. Of special interest was the fact that the energy required to entrain the bubbles against buoy- ancy represented 30% to 50% of the total surface wave energy dissipated during breaking. In view of these results, it was concluded that the air entrainment process was closely coupled with the dynamics of the breaking wave.
In this paper, we review our earlier 2-D measurements •6 conducted in a 2-D wave channel (see the Appendix) and present new measurements of the void- fraction field in bubble plumes generated by large-scale 3-D laboratory breaking waves. The various moments of the 3-D void-fraction field are compared with the 2-D results. The radial dependence of the void-fraction and sound- speed field is also investigated. Finally, we point out that the frequency of the collective oscillations of the bubble plume predicted from the void-fraction measurements for both 2-D and 3-D breaking waves compare favorably with measurements of the low-frequency pressure fluctuations (see Loewen and Melville'S).
I. EXPERIMENTS
A. Facilities
The experiments on 3-D breaking waves were con- ducted in the large multidirectional wave basin facility at the Offshore Technology Research Center (OTRC) of Texas A&M University in June 1991. The basin is 45.7 m long and 30.5 m wide and filled with fresh water to a depth of 5.8 m (Fig. 1). One end of the basin is outfitted with several wave absorber metal screens deployed over the full depth. The other end is equipped with 48 hydraulic wave paddles hinged at a depth of 3 m and controlled by a DEC workstation for the signal generation, and three 80386 PC computers for the D/A conversion. A motorized platform spanning the basin was used to mount the instrumentation. The breaking waves were obtained by radially focusing (see radial crest lines in Fig. 1 ) a wave packet made up of progressively decreasing frequencies. The center frequency of the wave packet and the bandwidth were approximately 0.5 and 1.0 Hz, respectively. The dispersive properties of water waves focused the packet at a predetermined posi- tion down the basin.
B. Instrumentation
The waveheight was measured with five capacitance wave gauges calibrated daily. The volume fraction of air (or void fraction hereafter) in the bubble plumes generated by the breaking waves was measured with a vertical array of six void-fraction probes separated by 15 cm. The void fraction in an air-water mixture can be measured by mak- ing use of the large difference in electrical conductivity between air and water. The probes used in these experi- ments have an effective measuring volume of approxi- mately 5 cm in diameter and 20 cm in length. We defined a detection threshold of 0.3% (void fraction) to be unam-
48 hinged
5 Wave Gouges 6 vertical 30.5 rn
Void- Fraction -- probes
Video Camera
4otorized Instrument Pla14orrn
Observation window
I 45.7 m -I
Top View
6 veHi½ol Void-Fraction
Metal Screen probes
Side View
FIG. 1. Top and side view of the multidirectional wave basin facility at the Offshore Technology Research Center (OTRC). The radial lines sketched in the top view represent the wave eresis.
biguously above the rms noise of the instrument which was approximately 0.1% (void fraction) with some electronics modules offering lower noise levels. Signals above the de- tection threshold were therefore positively due to bubbles in the water and not to electronic noise. The frequency response of the electronics was approximately flat out to 100 Hz (3-dB point). The characteristics of the probe and its calibration are given in Lamarre and Melville? Video cameras equipped with a time-code generator were used to visualize the bubble plume both from above and below the water surface. Two hydrophones and a microphone were deployed close to the breaking waves in order to measure the acoustic signature (see Loewen and Melville, •s for a discussion of the acoustic results).
II. PROCEDURE
The experiment consisted of measuring the void- fraction field in a cross section of the bubble plume located at the centerline of the basin for three different amplitudes of the same wave packet. The amplitude of the packet was controlled through a gain factor G applied to the signal fed to the wave maker. Table I gives the important wave pa- rameters for the three waves studied. A breaking wave was generated every two minutes, and at each new position of the instrumentation three repeats of the experiment were averaged in order to reduce the inherent variance of the void-fraction signal. In our earlier 2-D experiments, the void-fraction measurements were found to have good re- peatability when ensemble averaged over three repeats of the breaking wave.•7 For each breaking event, void fraction
1318 J. Acoust. Sac. Am., VoL 95, No. 3, March 1994 E. Lamarre and W. Melville: Sound speed in bubble plumes 1318

TABLE I. Characteristics of the three wave packet amplitudes studied. G is the gain of the signal and it is used here to identify the wave packet. The time from initial motion of' the paddles up to breaking is t o which is taken as the time when the forward-moving jet of the breaker strikes the free surface at a distance x 0 from the paddles. Note that t o is also the time when the underwater acoustic signature from the breaking wave begins. The earliest time when complete maps of the void-fraction field are available is t a . The maximum wave height at x=x0 is H. V0 and Eo are the volume of air entrained by and the potential energy of the bubble plume per unit width at t= to+ 0.4s which is the earliest time 'when complete void-fraction maps are available for all three wave packet amplitudes. The radius r0 = x/•-o/rr. The measurements of the void fraction were taken on a grid of size •x by &z. The data was interpolated on a finer grid of size Ax, by fi2,,.
t o t d x o H V o r o E o Ax Az Ax.• G (s) (s) (m) (m) (cm 2) (cm) (J/m) (cm) (cm) (cm) (era)
0.70 10.45 10.60 16.7 0.783 217.4 8.3 29.4 10.16 7.5 2.0 1.5 0.55 10.20 10.60 15.9 0.704 138.1 6.6 18.0 10.16 7.5 1.1 1.1 0.40 10.35 10.75 15.2 0.534 73.7 4.8 7.0 7.62 5.0 1.1 1.0
and wave gauge data were acquired along with video from above and below the surface. All data acqnisition systems and the video recorder were triggered from the wave maker system in order to obtain synchronized data from one breaking event to the next.
III. RESULTS
A. Waveheight measurements
Approximately 300 repeats of the same.. breaking wave were necessary in order to map the void-fraction field in the central cross section of the bubble plume. A two- minute repetition cycle was found to be sufficient to allow for the water surface to come to rest between each breaking event. Figure 2(a)-(c) shows wave gauge time series up- stream and downstream of breaking for three repeats of the experiment (i.e., three curves are shown on .each plot). The
(t th)/T -5.0 2.5 0.0 25 50 ?.5
40 (C)
(t t•)/T 5.0 -25 00 2.5 5.0 7.5
t tb(S )
FIG. 2. Wave gauge measurement for three repeats of the experiment at (a) 6.6 m upstream of breaking, (b) 1.0 m downstream, and (c) 8.6 m downstream. At each position, the three plotted repeats are essentially indiscernible and the wave profile shows excellent repeatability. (d)-(f) Time series of wave gauge measurements for two wave gauges placed symmetrically at 4.9 m on either side of the basin's ce. nterline at (d) 6.6 m upstream of breaking, (e) 1.0 m downstream, and (f) 8.6 m down- stream. The figure clearly shows that the wave profile was symmetric with respect to the centerline. The time t--t o corresponds to the beginning of breaking and T is the characteristic period of the wave packet. All time series are for a gain G=0.7.
time t--tb=O corresponds to the beginning of breaking when the forward moving jet strikes the free surface. The characteristic period of the wave packet is T=2 s. These time series show excellent repeatability of the wave profile both upstream and downstream for the full 30 s shown. The symmetry of the wave packet with respect to the cen- terline of the basin was also checked by positioning two wave gauges at 4.9 m on either side of the centerline. Fig- ure 2 (d)-(f) shows time series for these two gauges both upstream and downstream of breaking. Slight phase and amplitude differences can be observed but overall the wave packet was symmetric.
Estimates of the energy dissipation due to breaking have been difficult to make. The energy dissipation per unit width (along the wave crest) in the breaking region is probably large and may be comparable to the 2-D case ]9 but, when averaged over the full width of the tank, it is much smaller since the ratio of breaker width (along the wave crest) to tank width is approximately 0.1 for the most energetic breaking wave studied. Therefore, wave gauge measurements must be taken on a very fine grid in order to resolve accurately the wave energy flux as it propagates downstream, and the wave-absorbing beach must prevent all reflections.
B. Qualitative differences between 2-D and 3-D
breaking waves
As the., 3-D wave progresses toward breaking, the cen- tral section of the wave crest plunges forward first and breaking continues by spreading laterally. This effect is depicted in Fig. 3(a) which shows a photograph of a breaking wave taken at the OTRC facility. Figure 3(b) shows a similar photograph taken during the surface wave dynamics experiment (SWADE) off the coast of Delaware in a water depth of approximately 2400 m. Figure 3 (a) and (b) have similarities with a characteristic forward plung- ing jet stm•ing at the center of the wave crest where it is steeper and progressively breaking from the center to the edges. As is typical, for both 2oD and 3-D plunging waves, a large bubble plume is produced along with a secondary plume generated by the splash from the initial impact at breaking. The secondary plume is generally shallower and is located ,downstream of the primary plume. In the 3-D
1319 J. Acoust. Soc. Am., VoL 95, No. 3, March 1994 E. tamarre and W. Melville: Sound speed in bubble plumes 1319

(a)
(b)
FIG. 3. (a) Breaking wave at OTRC (Photograph by R. P. Johnson of OTRC). (b) Breaking wave photographed in deep water during the sur- face wave dynamics experiment off the coast of Delaware. Both waves begin to break at the center of the wave crest and progressively break from the center toward the edges.
case, we have observed less penetration of the secondary plume even though the elevation of the splash in both the 2-D and 3-D cases were comparable (and of the order of the wave amplitude at breaking). One possible explanation for this effect is that in the 3-D case the splash is not only projected forward but also laterally. Therefore, all of the splash water generated at impact lands over a greater area in the 3-D case because of this lateral spreading effect. Since there is less water falling onto the surface per unit surface area, there is accordingly less penetration of the secondary bubble plume being generated by this falling water. Finally, the last qualitative feature of 3-D breaking waves we wish to indicate is the characteristic curvature of
both the primary and secondary bubble plumes. This fea- ture is due to the fact that the central part of the breaker not only plunges forward first but it also plunges further downstream followed progressively by lateral sections which break later in time and upstream in space.
C. Moments of the 3-D void-fraction field and
comparisons with 2-D data
Typical void-fraction time series obtained using the array of void-fraction probes are shown in Fig. 4. Figure 4(a) shows a time series of the wave amplitude obtained from a wave gauge located at the same position as the vertical array of void-fraction probes. Figure 4(b)-(g) shows void-fraction time series for probes separated verti- cally by 15 cm with the uppermost probe [Fig. 4(b)] being located at the still water level. The large "steplike" transi- tions in Fig. 4(b) and (c) are due to the crossing of the
3O
v(cm) o 3O
100
50
25
100
50
0
10
0 --
4
2 0
4 3
1 0
0g
O4 0.2 0.0
(t tb)/T -0.5 0 0 0.5 1,0 I 5 2 0
I I
(c)
- I
(d)
I I -- (e)
I I
(f)
I 0 I ;2 3 4
t Lb(S)
FIG. 4. Typical time series at 200 Hz of (a) wave gauge measurement; (b)-(g) void-fraction measurements at depths 0, -- 15, -- 30, --45, -- 60, and --75 cm, respectively. Notice the different void-fraction scales for the various plots. Note how the probes cross the water surface in (b} and (c} and generate large "steplike" features in the void-fraction time series. The probe in (c) does not quite cross the water surface during the first wave trough. All time series are for G 0.7.
water surface by the void-fraction probes. The data were edited to eliminate these transitions (see Ref. 17 for a dis- cussion on "surface effect"). Video imaging of the void- fraction probes helped in this task. Notice how the start of the void-fraction signal at each probe in Fig. 4 is slightly delayed as the plume moves downward from one probe to the next.
The void-fraction measurements in the bubble plume cross section were made on a grid spacing of Ax by •z which are given in Table I. Void-fraction measurements at each position on this grid were ensemble averaged over three repeats of the experiments to reduce the inherent fluctuations of the void-fraction measurements. ]? Spatial maps of the void-fraction field were reconstructed from the ensemble averages. Raw data was time averaged over a 0.05~s window and interpolated on a finer grid of stze Ax,, and •z,, (see Table I) using a Laplacian and spline scheme. ]? The inherent assumption behind this interpola- tion process is that the ensemble averaged void-fraction field varies smoothly across the bubble plume. Void frac- tions below 0.3% were assumed to be below the detection
threshold of the instrument. Figure 5(a)-(d) shows a se- quence of color contour maps of the void-fraction field for the wave with a gain G=0.7. The color scale is linear and
1320 J. Acoust. Soc. Am., Vol. 95, No. 3, March 1994 E. Lamarre and W. Melville: Sound speed in bubble plumes 1320
Z {m)?'
0.• 8 1• ]8 L)• 30 • m.l• •8 •1 • •0 GO 80 1001•01•101801G•]L•00
al
! i
c) ! I
di I I
! I
X llm/dlv)
el
! I
h! ! I
I I
X ilm/div)
7/H
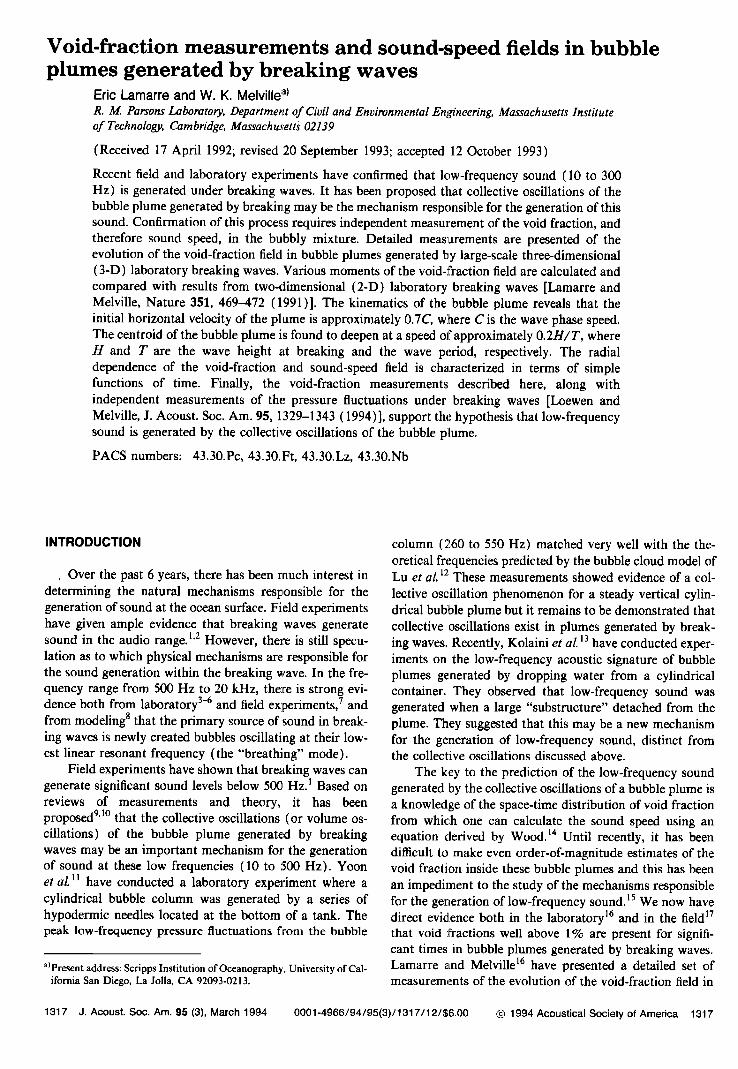
FIG. 5. (a)-(d) Color contour maps of the void-fraction field. The wave moves from left to right and the corresponding times t--t b are (a) O. 15T, (b) 0.25T, (c) 0.35T, (d) 0.ST. The void-fraction color scale increases by uniform increments of 6% starting at 0.3%. (e)-(h) Corresponding color contour maps of the sound-speed field. The sound-speed color scale increases by increments of 20 m/s and corresponds to the range covered by the void-fraction scale. The breaking wave shown is for (7=0.7.
increases in steps of 6% void fraction from 0.3% up to 54.3%. At early times, the data show sharply decreasing void fractions from the center of the plume out to the edges. At later times, the void-fraction field is more uni- form due to the fast degassing of the plume caused by bubbles rising back to the surface, and mixing of the plume with the ambient fluid.
Equivalent maps for the sound speed within the bubble plume are shown in Fig. 5(e)-(h) where the void fraction is directly converted to sound speed using Wood's
equation. •4 The sound-speed color scale is linear and cov- ers the equivalent void-fraction scale of Fig. 5(a)-(d). In contrast to the void-fraction maps, the sound-speed maps at early times show important gradients on the edges of the plume. At later times, when the void fraction in the plume has dropped to O(1%), we find important sound-speed gradients throughout the plume. These differences are ob- viously due to the character of Wood's equation. •4
From the void-fraction measurements, various mo- ments of the void-fraction field can be computed,
1321 J. Acoust. Soc. Am., Vol. 95, No. 3, March 1994 E. Lamarre and W. Melville: Sound speed in bubble plumes 1321

A=fA dA, (1)
V= f•adA, (2) •= V/A, (3)
E=pg f.• az dA, (4) where A is the total cross-sectional area of the bubble
plume above a void-fraction threshold of 0.3%; V is the volume of air entrained per unit width; a is the void frac- tion; E is the work per unit width required to entrain air against buoyancy; p is the water density; g is the acceler- ation due to gravity; z is the depth from the water surface; and 5 is the average void fraction. It should be pointed out that V and E are volume and potential energy of the plume per unit width along the crest of the breaking wave. In order to compare the results of the 3-D experiments with those of the 2-D experiments, the various moments de- scribed above are normalized as follows: V*=V/Vo, A*=A/V o, and E*=E/E o, where Vo=V(t=to+0.4s), Eo---E(t=to-{-0.4s), and t o is the time at which breaking begins with the impact of the surface on itself. The specific time t=to+0.4s selected to define V0 and E 0 was chosen because it was the earliest time for which complete maps of the void-fraction field were available for all three waves.
Note that in the 2-D case, Vand A had been normalized by the volume per unit width of the "cylinder" of air enclosed at t = t o which was measured with a video camera from the side of the channel. In the 3-D experiments, such video measurements are much more difficult to realize and may not even be possible because of the curvature of the wave crest. Furthermore, it should be pointed out that the po- tential energy E in the 2-D experiments was normalized by E d, the total energy dissipated by breaking (see the Ap- pendix). Table I shows the values used for V0 and E0 in the 3-D experiments.
Figure 6 shows the above moments for the three waves studied. The dashed lines are the functional forms obtained
in the 2-D experiments of Lamarre and Melville? A re- view of the 2-D results for the moments of the void-
fraction field is given in the Appendix. The data for I/* in Fig. 6(a) shows that up to 0. ST, the bubble plume degas- ses at approximately the same rate as in the 2-D case after which it assumes an appreciably slower decay rate out to 1.5T. The slower decay rate seen in the 3-D experiments during the later stage of the bubble plume evolution is also a characteristic of the other moments as we will see
shortly. The data for A* [Fig. 6(b)] show a faster initial increase in the bubble plume cross-sectional area and a slower decrease at later times when compared to the 2-D case. The plume's cross-sectional area is also consistently higher than the 2-D fit (dashed line). The mean void frac- tion • [Fig. 6(c)] shows decay rates comparable to the 2-D case for up to 0.5T and slower rates later. The initial offset of the data with the dashed line representing the 2-D fit is due to the faster initial increase in cross-sectional area in
25 •
[ • ' ' (b)
o i t oo 05 1o 1,5 oo 05 1o 15
(t lt•) T (t tt•)/T
FIG. 6. Moments of the void-fraction field as a function of time. (a) Normalized volume of air entrained per unit width V*, (b) normalized bubble plume cross-sectional area A*, (c) mean void-fraction a, (d) nor- realized potential energy E* of the bubble plume required to entrain the air against buoyancy. Dashed lines are best fits from 2D experiments of Lamarre and Melville •6 (see the Appendix). The characteristic wave pe- riod is T=2 s. G=0.7 (O), G=0.55 ([2), and G=0.4 (A).
the 3-D case. Data for E* [Fig. 6(d)] show decay rates consistent with the 2D fit up to 0. ST after which the data follows a slower rate (between 0.5 and -- 1.0T) and finally a faster one again (after • 1.0T). Interpretation of the differences between the 2-D and 3-D results noticed at later
times (after 0.5T) will be given in the discussion. Insight into the kinematics of the bubble plume can be
gained by computing the horizontal and vertical centroids of the bubble plume
f.axdA / fAadA, (5) L odA / fAa,iA, (6)
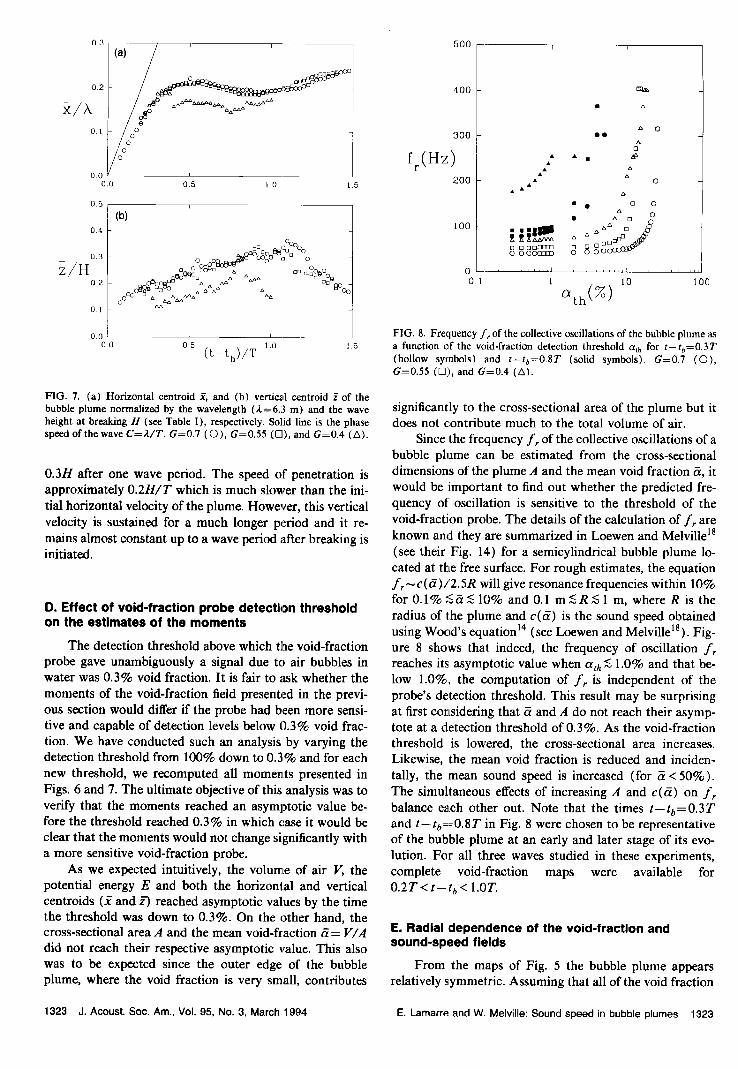
where x is the horizontal distance from x 0, the location when the forward-moving jet of the breaker strikes the free surface (i.e., at the beginning of breaking), and z is the depth from the free surface. Figure 7(a) shows the hori- zontal centroid normalized by • = 6.3 m, the characteristic wavelength of the wave packet. The bubble plume moves quickly downstream to approximately 0.2Jr in about 0.3 T. The horizontal velocity of the plume immediately after breaking is approximately 0.7C, where C=,k/T is the phase speed of the wave. The local minimum is due to the reversal in the orbital velocity at the trough of the wave which occurs approximately one wave period after onset of breaking. Figure 7(b) shows the vertical centroid normal- ized by the height of the wave at breaking H (given in Table I). The vertical centroid •/H represents the mean penetration depth of the bubble plume scaled by the wave height prior to breaking. The vertical centroid in the 3-D experiments moves to its maximum value of approximately
1322 J. Acoust. Soc. Am., Vol. 95, No. 3, March 1994 E. Lamarre and W. Melville: Sound speed in bubble plumes 1322
500
(a) /
00• • 0.0 05 1.0
0.5
0.4
0.2
0.0 0.0
t.5
t.5
400
300
fr(Hz) •oo
lOO
0,1 I 10 100
FIG. 8. Frequency f, of the collective oscillations of the bubble plume as a function of the void-fraction detection threshold •th for t--tt•=O.3T (hollow symbols) and t--tb=0.ST (solid symbols). G=0.7 (¸), G=0.$$ (FI), and G=0.4 (A).
FIG. 7. (a) Horizontal centroid .•, and (b) vertical centroid • of the bubble plume normalized by the wavelength (•=6.3 m) and the wave height at breaking H (see Table I), respectively. Solid line is the phase speed of the wave C=2c/T. G=0.7 (O), G=0.55 (O), and G=0.4 (A).
0.3H after one wave period. The speed o:f penetration is approximately 0.2H/T which is much slower than the ini- tial horizontal velocity of the plume. However, this vertical velocity is sustained for a much longer period and it re- mains almost constant up to a wave period after breaking is initiated.
D. Effect of void-fraction probe detection threshold on the estimates of the moments
The detection threshold above which the void-fraction
probe gave unambiguously a signal due to air bubbles in water was 0.3% void fraction. It is fair to ask whether the
moments of the void-fraction field presented in the previ- ous section would differ if the probe had been more sensi- tive and capable of detection levels below 0.3% void frac- tion. We have conducted such an analysis by varying the detection threshold from 100% down to 0.3% and for each
new threshold, we recomputed all moments presented in Figs. 6 and 7. The ultimate objective of this analysis was to verify that the moments reached an asymptotic value be- fore the threshold reached 0.3% in which case it would be
clear that the moments would not change significantly with a more sensitive void-fraction probe.
As we expected intuitively, the volume of air V, the potential energy E and both the horizontal and vertical centroids (• and z-) reached asymptotic values by the time the threshold was down to 0.3%. On the other hand, the cross-sectional area A and the mean void-fraction t•= V/A
did not reach their respective asymptotic value. This also was to be expected since the outer edge of the bubble plume, where the void fraction is very small, contributes
significantly to the cross-sectional area of the plume but it does not contribute much to the total volume of air.
Since the frequency fr of the collective oscillations of a bubble plume can be estimated from the cross-sectional dimensions of the plume A and the mean void fraction •, it would be important to find out whether the predicted fre- quency of' oscillation is sensitive to the threshold of the void-fraction probe. The details of the calculation of fr are known and they are summarized in Loewen and Melville 18 (see their Fig. 14) for a semicylindrical bubble plume lo- cated at the free surface. For rough estimates, the equation f•_• c (•)/2.5R will give resonance frequencies within 10% for 0.1%;-•<• 10% and 0.1 mœR•< 1 m, where R is the radius of the plume and c(5) is the sound speed obtained using Wood's equation 14 (see Loewen and Melvillet s). Fig- ure 8 shows that indeed, the frequency of oscillation f• reaches its. asymptotic value when ata <• 1.0% and that be- low 1.0%, the computation of f• is independent of the probe's detection threshold. This result may be surprising at first considering that & and A do not reach their asymp- tote at a detection threshold of 0.3%. As the void-fraction
threshold is lowered, the cross-sectional area increases. Likewise, the mean void fraction is reduced and inciden- tally, the :mean sound speed is increased (for • <50%). The simultaneous effects of increasing .4 and c(ff) on f• balance each other out. Note that the times t--t•=O.3T and t--to=O.8T in Fig. 8 were chosen to be representative of the bubble plume at an early and later stage of its evo- lution. For all three waves studied in these experiments, complete void-fraction maps were available for 0.2T<t--tb< 1.0T.
E. Radial ,dependence of the void-fraction and sound-speed fields
From the maps of Fig. 5 the bubble plume appears relatively symmetric. Assuming that all of the void fraction
1323 J. Acoust. Sec. Am., Vol. 95, No. 3, March 1994 E. Lamarre and W. Melville: Sound speed in bubble plumes 1323

0.• O.S I • • ? Q 11 13 1S
vold-frac•[on (Y3
a]
X (lm/dlv)
FIG. 9. (a) Color contour maps of the void-fraction field for t--tb=O.35T (G=0.7). lb) Equivalent semicylindrical plume of color map shown in (a).
is repositioned to form an ideal equivalent semicylindrical plume without any azimuthal dependence of the void frac- tion, it then becomes possible to determine an equivalent radial dependence of the void fraction. Figure 9(a) shows the void-fraction field at t--to=O.35T for the wave with gain G=0.7, and Fig. 9lb) shows the equivalent semicy- lindrical plume. The equivalent semicylindrical color map [Fig. 9lb)] is assembled from the original color map [Fig. 9(a)] by repositioning the elements of void fraction such
that the area f•bdA between any two limits a a and a b is a
conserved.
Figure 10(a),(b) shows how the void fraction and sound speed vary as a function of the radius for two spe- cific times, t--tb=O. 3T and 0. ST. The radius of the semi- cylindrical plume r has been normalized by r0 = where F' 0 has been used to normalize I/and it is given in Table I. A simple exponential fit of the form
a(r,t) =.40(t)exp[.41 (t) (r/r o) ] (7)
has been performed on the void-fraction data for all three wave amplitudes for times up to 0.8T. The coefficients ,4 o and .4 ] are given in Fig. 11 (a), (b) as a function of time. As expected, the constant term .4o (with respect to r), which represents the void fraction in the center of the plume, decreases rapidly shortly after breaking when the degassing of the plume is very rapid. The steepness of the void- fraction gradient described by Eq. (7) is governed by the coefficient A I. As shown in Fig. 11 lb) the sharpest gradi- ents are observed immediately after the onset of breakingß As breaking evolves, the plume degasses, entrains ambient fluid and expands. The final result of this process will be to significantly decrease the void-fraction gradient as time
10o
10
1
lOO
80
6o
40
:30
(a)
(b)
A ß ß
0 1 2 ;3 4 5 6 7
o
FIG. 10. (a) Void-fraction and lb) sound-speed radial profiles for t--tb=O.3T (hollow symbols) and t--t•=O. ST (solid symbols). G=0.7 ( 0 ), G=0.55 (r-i), and G=0.4 (A). Solid lines are best fits based on (a) Eq. (7) and lb) Eq. (8). The radius is normalized by r o =
evolves. Void-fraction radial profiles fitted with Eq. (7) have standard deviations below 0.15.4 0.
The same analysis can be carried out for the sound- speed radial profiles of Fig. 10(b). The second-order poly- nomial fit is
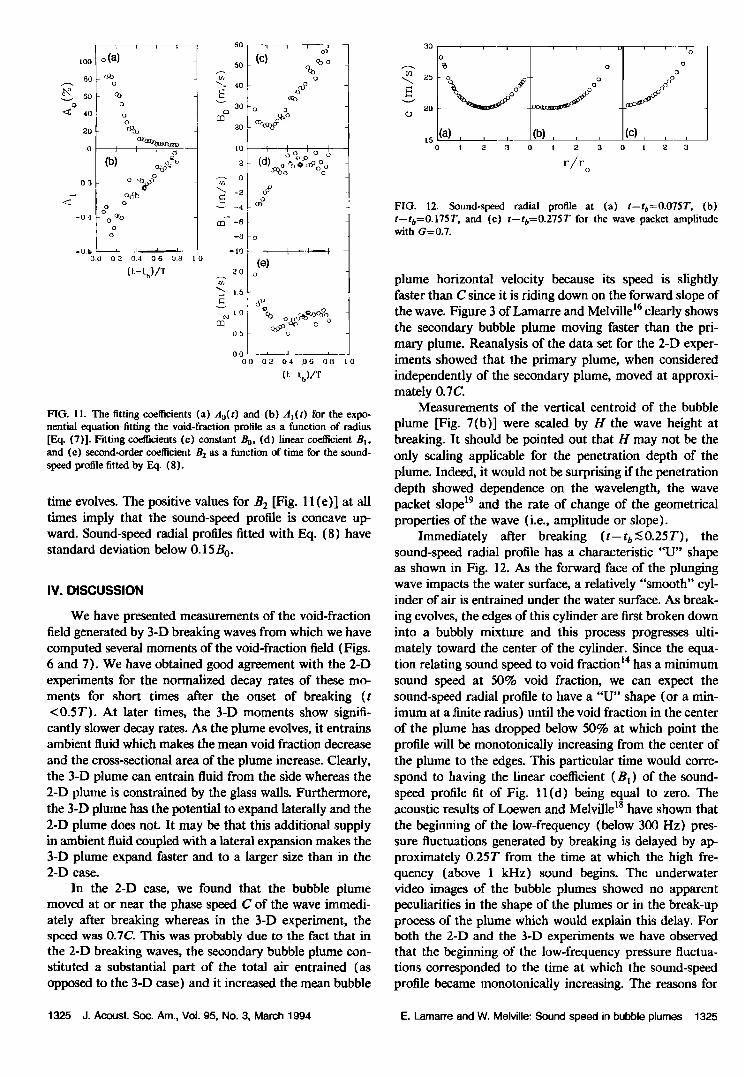
c(r,t)=Bo(t)+Bl(t)(r/ro)+Bz(t)(r/ro) 2, (8) where B o, B l, and B2 are functions of time and are given in Fig. 11(c),(e) for times ranging from 0.15T to 0. ST. The sound speed in the center of the plume is given by Bolt) which shows an initial decrease up to 0.25T corre- sponding to the void fraction dropping from 100% down to 50% [see .40(t) in Fig. 11(a)] followed by a steady increase after 0.25T. The linear coefficient B• represents the slope of the sound-speed profile ac/ar at r=0. Figure 11 (d) shows that B• is initially negative which means that the sound speed decreases as r increases in the neighbor- hood of r=0. After t--tb=0.25 T, B• becomes positive and increases with time indicating that the slope of the sound- speed profile near r--0 is positive and becomes steeper as
1324 J. Acoust. Soc. Am., Vol. 95, No. 3, March 1994 E. Lamarre and W. Melville: Sound speed in bubble plumes 1324
8O
• 4,0
(d)o:•o• ' a9:%o
FIG. 11. The fitting coefficients (a) Ao(t) and (b) Al(t) for the expo- nential equation fitting the void-fraction profile as a function of radius [Eq. (7)]. Fitting coefficients (c) constant B0, (d) linear coefficient and (e) second-order coefficient B 2 as a function of time for the sound- speed profile fitted by Eq. (8}.
time evolves. The positive values for B2 [Fig. 11 (e)] at all times imply that the sound-speed profile is concave up- ward. Sound-speed radial profiles fitted with Eq. (8) have standard deviation below 0.15 Bo.
IV. DISCUSSION
We have presented measurements of the void-fraction field generated by 3-D breaking waves from which we have computed several moments of the void-fraction field (Figs. 6 and 7). We have obtained good agreement with the 2-D experiments for the normalized decay rates of these mo- ments for short times after the onset of breaking (t <0.ST). At later times, the 3-D moments show signifi- cantly slower decay rates. As the plume evolves, it entrains ambient fluid which makes the mean void fraction decrease
and the cross-sectional area of the plume increase. Clearly, the 3-D plume can entrain fluid from the side whereas the 2-D plume is constrained by the glass walls. Furthermore, the 3-D plume has the potential to expand laterally and the 2-D plume does not. It may be that this additional supply in ambient fluid coupled with a lateral expansion makes the 3-D plume expand faster and to a larger size than in the 2-D case.
In the 2-D ease, we found that the bubble plume moved at or near the phase speed C of the wave immedi- ately after breaking whereas in the 3-D experiment, the speed was 0.7C. This was probably due to the fact that in the 2-D breaking waves, the secondary bubble plume con- stituted a substantial part of the total air entrained (as opposed to the 3-D case) and it increased the mean bubble
20
o ø ø
oO (a) , (b) , , , I(c) , ,
0 I 2 0 I 2 3 I :• 3
UfU o
FIG. 12. Sound-speed radial profile at (a) t--tb=O.O75T, (b) t--tb=O. 175T , and (c) t--tb=O.275T for the wave packet amplitude with G=0.7.
plume horizontal velocity because its speed is slightly faster than C since it is riding down on the forward slope of the wave. Figure 3 of Lamarre and Melville •6 clearly shows the secondary bubble plume moving faster than the pri- mary plume. Reanalysis of the data set for the 2-D exper- iments showed that the primary plume, when considered independently of the secondary plume, moved at approxi- mately 0.7C.
Measurements of the vertical centroid of the bubble
plume [Fig. 7(b)] were scaled by H the wave height at breaking. It should be pointed out that H may not be the only scaling applicable for the penetration depth of the plume. Indeed, it would not be surprising if the penetration depth showed dependence on the wavelength, the wave packet slope 19 and the rate of change of the geometrical properties of the wave (i.e., amplitude or slope).
Immediately after breaking (t--tb•<O.25T), the sound-speed radial profile has a characteristic "U" shape as shown in Fig. 12. As the forward face of the plunging wave impacts the water surface, a relatively "smooth" cyl- inder of air is entrained under the water surface. As break-
ing evolves, the edges of this cylinder are first broken down into a bubbly mixture and this process progresses ulti- mately toward the center of the cylinder. Since the equa- tion relating sound speed to void fraction •4 has a minimum sound speed at 50% void fraction, we can expect the sound-speed radial profile to have a "U" shape (or a min- imum at a finite radius) until the void fraction in the center of the plume has dropped below 50% at which point the profile will be monotonically increasing from the center of the plume to the edges. This particular time would corre- spond to having the linear coefficient (B•) of the sound- speed profile fit of Fig. 11(d) being equal to zero. The acoustic results of Loewen and Melville 18 have shown that the beginning of the low-frequency (below 300 Hz) pres- sure fluctuations generated by breaking is delayed by ap- proximately 0.25T from the time at which the high fre- quency (above I kHz) sound begins. The underwater video images of the bubble plumes showed no apparent peculiarities in the shape of the plumes or in the break-up process of the plume which would explain this delay. For both the 2-D and the 3-D experiments we have observed that the beginning of the low-frequency pressure fluctua- tions corresponded to the time at which the sound-speed profile became monotonically increasing. The reasons for
1325 d. Acoust. Soc. Am., Vol. 95, No. 3, March 1994 E. Lamarre and W. Melville: Sound speed in bubble plumes 1325
this are still unclear but it may be that specific conditions on the shape of the sound-speed profile must be satisfied before collective oscillations can be initiated.
Differences have been observed between fresh and sea-
water bubble population spectra. •ø Recent "tipping bucket" laboratory experiments have shown order of mag- nitude differences in the number density of bubbles at their spectral peak. iø However, Monahah and Wang 2ø inte- grated their bubble spectra over 0.5-s windows to give the void fraction as a function of time. They found that the maximum void-fraction levels in fresh and seawater did not
differ substantially but that important differences were ob- served at later times when the void-fraction levels in both
fresh and salt water were significantly lower. In our exper- iments, the high void-fraction levels (0.3% to 100% } are present in the first wave period following the onset of breaking. The findings of the tipping bucket experiments suggest that the results of our fresh water experiments would also apply in seawater for these short times after breaking.
V. CONCLUSIONS
The present work has been motivated in part by our need to understand the role played by bubble plumes in generating and scattering sound at the ocean surface. Progress in this field has been impeded by our poor knowl- edge of the evolution of the void-fraction and sound-speed fields in bubble plumes generated by breaking waves. In this paper, we have described a series of laboratory mea- surements of the void-fraction field in bubble plumes gen- erated by 3-D breaking waves. Important moments of the void-fraction field describing the bulk properties of the bubble plumes have been determined and compared with previous results from experiments conducted in a 2-D wave channel.
The normalized moments of the void-fraction field
evolved according to simple functions of time and showed decay rates consistent with the 2-D experiments up to 0.5T after which the decay rates became slower. The normalized volume of air entrained and the mean void-fraction for all
three wave packet amplitude studied collapsed well onto the same functional form [cf. Fig. 6(a) and (½)].
The secondary bubble plume generated by the splash from the impact at breaking showed significantly less pen- etration depth in the 3-D experiments than in the 2-D counterpart. It is suggested that this effect may have been caused by the lateral spreading of the splash in the 3-D breaking.
The kinematics of the plume was investigated by track- ing the centroid of the void-fraction field. In the 3-D ex- periments where the secondary plume was found to be negligible, the horizontal ½entroid was found to move at 0.7C, where C is the phase speed of the wave. In the 2-D experiments, the speed was closer to C but reanalysis of the data showed that the primary plume, when considered in- dependently of the secondary plume, moved at nearly 0.7C. The horizontal centroid also showed that the bubble plume was moved horizontally by the orbital velocity of the wave after breaking. The vertical centroid of the plume in the 3D
experiments was found to deepen at a speed of approxi- mately 0.2H/T, where H and T are the waveheight at breaking and the wave period, respectively. The maximum penetration depth ranged between 0.2H to 0.35H. These results were consistent with the 2-D experiments for the most energetic breaking wave.
The radial structure of an equivalent semicylindrical bubble plume was investigated. It was found that the radial dependence of the void-fraction and sound-speed field can be described with relatively simple functions which depend on the bubble plume radius and time. These functional forms hold well for times up to 0.8 T which covers the time period when the bubble plume is acoustically active (Loc- wen and Melville•S). Finally, the void-fraction measure- ments described here along with independent measure- ments of the low-frequency pressure fluctuations generated by breaking (Loewen and Melville •s) support the hypoth- esis that low frequency sound is generated by collective oscillations of the bubble plume.
ACKNOWLEDGMENTS
We thank Peter Johnson and his staff at the Offshore
Technology Research Center of Texas A&M University for their invaluable assistance in making the 3-D experiments possible. We thank Mark Loewen for his collaboration in the experiments and extensive discussions of the results. We also thank an anonymous reviewer for helpful com- ments. This work is supported by the Office of Naval Re- search (Ocean Acoustics } and the National Science Foun- dation (Physical Oceanography }.
APPENDIX: MOMENTS OF VOID-FRACTION FIELD IN BUBBLE PLUMES GENERATED BY 2-D BREAKING WAVES
To facilitate comparisons with the 3-D measurements, the 2-D measurements of Lamarre and Melville •6 are briefly reviewed here. The experiments were conducted at the R.M. Parsons Laboratory (MIT} in a wave channel 25 m long, 0.76 m wide filled with fresh water to a depth of 0.6 m. The experiments consisted of generating breaking waves and mapping the bubble plume created by breaking for three different amplitudes of the same wave packet. The breaking waves were produced by a piston-type wave maker generating a packet of waves with progressively de- creasing frequencies. Table AI gives the characteristics of the three wave packet amplitudes studied. The experiments are described in detail in Lamarre and Melville. •6J?
The important moments describing the bubble plumes are presented in Figs. A 1 and A2. All moments were cal- culated using Eqs. (1) to (4) and (5) and (6}. The nor- malized volume of air entrained V*= l//V o is shown in Fig. A1 (a). Here, Vis the total volume of air entrained per unit width and l• 0 is the volume of the air pocket per unit width enclosed by the forward-moving jet as it strikes the free surface at t= t b. Here, l/0 was measured from video images taken from the side of the channel. The results show that the initial volume of air entrained per unit width Y0 is conserved for up to a quarter of a wave period after
1326 J. Acoust. Soc. Am., Vol. 95, No. 3, March 1994 E. Lamarre and W. Melville: Sound speed in bubble plumes 1326

TABLE AI. Characteristics of the three wave packet amplitudes studied in the 2-D experiments of Lamarre and Melville? 6 The wave packet was composed of 32 sinusoidal components of equal slope a•k• where a i and k• are the amplitude and wave number of the/th component. The slope of the wave packet is defined as S=•a•k•. •9 The center frequency of the wave packet and the bandwidth were both 0.88 Hz. The time from initial motion of the peddles up to breaking is t b which is taken as the time when the forward-moving jet of the breaker strikes the free surface at a distance xb from the paddles. Note that tb is also the time when the underwater acoustic signature from the breaking wave begins. The maximum wave height at x=x 6 is H. //o is the total volume of air per unit width enclosed by the forward jet as it impacts the free surface and it was measured from video images taken from the side of the channel. E,• is the total energy dissipated by breaking. •9 The measurements of the void fraction were taken on a grid of size Ax by A•.
tb Xb H re Ed •0, • S (s) (m) (m) (cm 2) (J/m) (cm) (cm)
0.54 14.4 8.05 0.335 98.0 17.8 5 5
0.45 14.3 7.70 0.276 46.0 8.6 5 3
0.38 14.3 7.70 0.214 25.0 4.3 5 2
onset of breaking. Degassing of the plume is very rapid, with only 5% of the initially entrained air remaining after a full wave period. The normalized cross-sectional area of the bubble plume ,4* =A/Vo is shown in Fig. AI (b) and the mean void-fraction d= V/`4 ---- V*/`4* is shown in Fig. AI (c). Mean void fractions remain above 1% within the first wave period after breaking is initiated. The work re- quired to keep the air entrained against the buoyancy force E s is shown in Fig. A1 (d) where it has been normalized by the total wave energy dissipated by breaking, E s (see Table
, ' (a)
VOA
(L-tb)/T (t tb)/T
FIG. A1. Moments of the void-fraction field for the 2-D experiments. •6 (a) Normalized volume of air entrained I/*= V/V o, (b) normalized bub- ble plume cross-sectional area d*=`4/V o, (c) mean void fraction •, (d) potential energy E• of the plume normalized by E a, the energy dissipated by breaking. Solid lines are best exponential fits for g* and E•'Ea, and best power law fit for • The data for ,4* have been fitted by using the functional form for •' divided by that for •. The values for V 0 and E a used in normalizing g, ,4, and Es are given in Table AI. Symbols are S=0.54 {O), S=0.45 ((3), and S=0.38 (A) where $ is defined in Table AL
10
0.8
0G -
(a)
oo • .... oo
I (b)
el I
0 0
I0 15
r
o q I U I .)
FIG. A2. Centroids of the bubble plume for the 2D experiments. is (a) Horizontal centreid .• of the bubble plume normalized by 2. = 1.94 m, the characteristic wavelength of the wave packet. (b) Vertical centreid i normalized by H the height of the wave at breaking (see Table AI). Solid line is the phase speed of the wave C=A/T. Symbols are S=0.54 (O), S=0.45 ((3), and $=0.38 (A) where $ is defined in Table AL
AI). Dissipation (i.e., E a) is calculated by taking the dif- ference in surface displacement variances between wave- gauge measurements upstream and downstream of breaking? Figure Al(d) shows that a large fraction (30%-50% and maybe more) of the energy lost during breaking is expended in entraining the bubble plume. Sur- face wave evolution and air entrainment have therefore
considerable coupling. The horizontal and vertical centroids of the void-
fraction field are shown in Fig. A2. In these experiments, the horizontal centreid [Fig. A2(a)] was found to initially move at roughly the phase speed of the wave. The vertical centreid [Fig. A2(b)] of the bubble plume was normalized by H the wave height at breaking (see Table AI). The data for the most energetic breaking wave ($----0.54) show that the vertical eentroid deepens with time at a speed 0.2H/T and reaches a maximum depth of approximately 0.35H. The trend for the data with $=0.45 remains unexplained.
D. Farmer and S. Vagle, "Waveguide propagation of ambient sound in the ocean surface bubble layer," J. Acoust. Soc. Am. 86, 1897-1908 (1989).
ZP. A. Crowther, "Bubble noise creation mechanisms", in Sea Surface Sound, edited by B. R. Kerman (Kluwer Academic, Boston, 1988), pp. 131-150.
M. L. Banner and E. H. Cato, "Physical mechanisms of noise genera- tion by breaking wave--laboratory study," in Sea Surface Sound, ed- ited by B. R. Kerman (Kluwer Academic, Boston, 1988), pp. 429-436.
4H. Mealwin and M. M. Beaky, "Bubble sources of the Knudsen sea noise spectra," J. Acoust. Soc. Am. 86, 1124-1130 (1989).
sH. Medwin and A. C. Daniel, "Acoustical measurements of bubble production by spilling breakers," J. Acoust. Soc. Am. 88, 408-412 (1990).
1327 J. Acoust. Sec. Am., VoL 95, No. 3, March 1994 E. Lamarre and W. Melville: Sound speed in bubble plumes 1327
SH. C. Pumphre¾ and I.E. Ffowcs Williams, "Bubbles as sources of ambient noise," IEEE J. Oceanic Eng. 15, 268-274 (1990).
?G. E. Updegratf and V. C. Anderson, "Bubble noise and wavelet spills recorded I m below the ocean surface," J. Acoust. Soc. Am. $9, 2264- 2279 ( 1991 ).
8M. R. Loewen and W. K. Melville, "A model of the sound generated by breaking waves," J. Aeoust. Soc. Am. 90, 2075-2080 (1991).
9A. Prosperetti, "Bubble dynamics in oceanic ambient noise," in Sea Surface Sound, edited by B. R. Kerman (Kluwer Academic, Boston, 1988), pp. 151-171.
tow. M. Carey and D. O. Browning, "Low frequency ocean ambient noise: measurement and theory," in Sea Surface Sound, edited by B. R. Kerrnan (Kluwer Academic, Boston, 1988), pp. 361-376.
it $. W. Yoon, L. A. Crum, A. Prosperetti, and N. Q. Lu, "An investi- gation of the collective oscillations of a bubble cloud," J. Acoust. Soc. Am. 89, 700-706 (1991).
tiN. Q. Lu, A. Prosperetti, and S. W. Yoon, "Underwater noise emissions from bubble clouds," IEEE J. Oceanic Eng. 15, 275-281 (1990).
t3A. Kolaini, R. A. Roy, and L. A. Crum, "An investigation of the acoustic emissions from a bubble plume," $. Aeoust. Soc. Am. $9, 2452-2455 ( 1991 ).
t4A. B. Wood, • Textbook afSound (Bell, London, 1941), pp. 360-362. tSW. M Carey, J. W. Fitzgerald, and D. (}. Browning, "Low frequency
noise from breaking waves," in Natural Physical Sources of Underu•ater Sound, edited by B. R. Kennan (Kiuwer Academic, Boston, 1993), pp. 277-304.
tSE. Lamarre and W. K. Melville, "Air entrainment and dissipation in breaking waves," Nature 351, 469-472 ( 1991 ).
t7 E. Lamarre and W. K. Melville, "Instrumentation for the measurement of void-fraction in breaking waves: laboratory and field results," IEEE J. Oceanic Eng. 17, 204-215.
taM. R. Loewen and W. K. Melville, "An experimental investigation of the collective oscillations of bubble plumes entrained by breaking waves," •. Acoust. Soc. Am. 95, 1329-1343 (1994).
tgR. J. Rapp and W. K. Melville, "Laboratory measurements of deep- water breaking waves," Philos. Trans. R. Soc. London Ser. A 331, 735-800 { 1990).
•øE. C. Monahah and Q. Wang, "Temporal evolution of the bubble plumes generated by breaking waves: Acoustical implications," J. Aenust. Soe. Am. 91, 2322-2323 (A) {1992).
1328 J. Acoust. Soc. Am., Vol. 95, No. 3, March 1994 E. Lamarre and W. Melville: Sound speed in bubble plumes 1328

![Equilibrium chromatography (isothermal adsorption)...Flow rate: ! [!! "]; cross section: % [m#]; void fraction: ’ (fluid volume/column volume); superficial velocity: ( = $ +; interstitial](https://img.dokumen.tips/doc/110x75/5fd1e9f58854c74de834d68b/equilibrium-chromatography-isothermal-adsorption-flow-rate-.jpg)