Embed Size (px)
Citation preview

Voice of the American Shareholder Voice of the American Shareholder Quarterly Poll – Wave 2Quarterly Poll – Wave 2
Prepared for:Prepared for:
National Association of National Association of
Investors Corporation (NAIC)Investors Corporation (NAIC)
February 26, 2004February 26, 2004

2
Table of Contents
Study Objectives . . . . . . . . . . . . . . . . . . . . . . . . . . . . . . . . . . . . . . . . . . . . . . . . . . . . . 3
Overview of Methodology . . . . . . . . . . . . . . . . . . . . . . . . . . . . . . . . . . . . . . . . . . . . . . 4
Executive Summary . . . . . . . . . . . . . . . . . . . . . . . . . . . . . . . . . . . . . . . . . . . . . . . . . . . 5
Detailed Findings . . . . . . . . . . . . . . . . . . . . . . . . . . . . . . . . . . . . . . . . . . . . . . . . . . . . .13
What Does A Typical Shareholder’s Portfolio Look Like? . . . . . . . . . . . . . . . . . . . . . . . . . . . . . . .14
How Do Shareholders Feel About The Economy and Stock Market? . . . . . . . . . . . . . . . . . . . . . 23
How Do Shareholders Feel About The Recent Mutual Fund Scandals? . . . . . . . . . . . . . . . . . . . .30
What Do Shareholders Know About The “Trade Through Rule”? . . . . . . . . . . . . . . . . . . . . . . . . .40
What Are The Differences Between Male and Female Shareholders? . . . . . . . . . . . . . . . . . . . .43
Demographics . . . . . . . . . . . . . . . . . . . . . . . . . . . . . . . . . . . . . . . . . . . . . . . . . . . . . . . 51
Detailed Methodology . . . . . . . . . . . . . . . . . . . . . . . . . . . . . . . . . . . . . . . . . . . . . . . . .56

3
Study Objectives
The National Association of Investors Corporation (NAIC) commissioned Harris Interactive to conduct a research study to better understand the attitudes and behaviors of American investors. This study represents the second wave of research conducted for NAIC.
By regularly reporting on these findings, NAIC expects to capture the voice of the American shareholder.
The survey questions are designed to measure a few key trends in shareholders’ portfolios and investing behavior as well as to understand shareholders’ attitudes and views towards current issues. Specifically, the survey focused on the following topics:
Investment profile, goals and strategy;
Views towards the economy and stock market;
Attitudes towards the recent mutual fund scandals; and
Understanding of the “trade through rule.”

4
Overview of Methodology
Sample includes 1,169 U.S. adults aged 18 or older who currently own individual stocks or stock mutual funds.
Interviewing was conducted between January 7 and 19, 2004.
The interview averaged 7 minutes in length.
All interviewing was conducted online using the Harris Poll Online (HPOL) database consisting of several million members who have agreed to participate in survey research.

5
Executive SummaryExecutive Summary

6
Executive SummaryExecutive Summary
Profile of the typical American shareholder
In general, the typical American shareholder’s behaviors and investment profile has remained virtually unchanged since September 2003.
Shareholders hold a variety of investments such as IRAs and bonds in addition to individual stocks and stock mutual funds.
Expected returns on investments is holding steady at 10%.
Shareholders continue to rate their investments as moderately risky (a rating of 4 on a 7-point scale).
But, some changes have occurred.
Compared to September ‘03, shareholders have more money invested in individual stocks and less in stock mutual funds.
7
Executive Summary (cont’d)Executive Summary (cont’d)
Views towards the economy and stock market
Compared to September 2003, shareholders in January 2004 are far more optimistic about the direction of the economy and stock market.
Over four out of ten (44%) shareholders are more optimistic that the stock market will go up in the near future (that is, in the next three months) compared to 32% who felt the same in September ‘03.
An overwhelming 71% of shareholders are confident in the economy today, a dramatic increase from 57% in September ‘03.
The NAIC Index of shareholder confidence in the stock market was created using the data collected in the January 2004 survey.
Currently the NAIC Index is a 27. On a scale from -100 to +100 (where zero indicates a neutral attitude towards the stock market), an Index of 27 represents cautious optimism towards the stock market.

8
Executive Summary (cont’d)Executive Summary (cont’d)
Attitudes Towards Investing
While investors are slightly encouraging of new investors entering the stock market, they have mixed feelings about current stock values and investment risk level.
Just over six out of ten (62%) shareholders believe it is a good time for new investors to get into the stock market.
However, while 43% think that stocks are a better bargain today than three years ago, nearly a third (31%) do not feel this way.
Nearly equal proportions think now is the time to move from safe to risky investments as those who do not feel this way (34% agree vs. 35% disagree).
9
Executive SummaryExecutive Summary
Attitudes towards recent mutual fund industry scandals
Shareholders have been paying attention to the recent scandals affecting the mutual fund industry – and have been taking steps in reaction to the scandals.
Nearly eight out of ten (77%) shareholders are aware of the mutual fund scandals.
For those who are aware, about half (48%) are paying a good deal of attention to the issues and are concerned (50%) about the scandals.
There is evidence that the scandals have caused some shareholders to take action – but many have not.
Becoming more informed (31%) and discussing issues with friends and family (27%) are the top ways shareholders have been dealing with the mutual fund scandal. Few shareholders (11%) actually sold some or all of their mutual fund investments.
That said, about four out of ten (41%) shareholders said that they didn’t take any action – mostly because they think of their mutual funds as long-term investments.
10
Executive SummaryExecutive Summary
Attitudes towards recent mutual fund industry scandals (cont’d)
A modest majority of shareholders believe that the mutual fund industry themselves should be responsible for fixing the problems. And, many shareholders feel there are effective reforms that can be used to prevent future scandals.
Over half (56%) of shareholders want to see the mutual fund industry through an independent oversight board resolve the issues that caused the scandals.
Convicting fund managers of criminal charges (88%) and requiring funds to provide a full disclosure of their fees on their client’s statements (83%) are seen as the most effective reforms.
11
Executive Summary (cont’d)Executive Summary (cont’d)
Awareness of the “trade through rule”
Few shareholders are aware of the “trade through rule” which would prohibit an exchange, such as the New York Stock Exchange, from executing orders at a lower price than what is offered through another market.
Only 13% of all shareholders have heard or seen anything about the “trade through rule.”
About a third (31%) are familiar with the “trade through rule”.
12
Executive Summary (cont’d)Executive Summary (cont’d)
Differences Among Shareholders By Gender
As in September 2003, there continues to be differences between men and women shareholders. Men are more confident and riskier about their investments than are women.
Men continue to have slightly riskier investments than women – but perhaps given the improved economic picture, women are closing this gap.
Men make different investing decisions than women if they had more money to invest – they are more likely than women to put money into individual stocks or stock mutual funds if they had a large amount of money to invest.
Men are more likely than women to feel it’s a good time for new investors to get involved in the stock market.

13
Detailed FindingsDetailed Findings
14
WHAT DOES THE TYPICAL SHAREHOLDER’S PORTFOLIO LOOK LIKE?

15
Shareholders today have more money invested in individual stocks – and slightly less in stock mutual funds – compared to four months ago.
Total Amount Invested in Individual Stocks and Stock Mutual Funds
Q940: You mentioned that you have the following investments. About how much do you have invested in the following…?Base: Have individual stocks or stock mutual funds
Individual Stocks Stock Mutual Funds
Sept ‘03 Jan ‘04 Sept ‘03 Jan ‘04
% % % %
Less than $5,000 37 41 26 30
$5,000 - $9,999 13 10 8 8
$10,000 - $49,999 20 20 25 29
$50,000 - $99,999 8 9 11 9
More than $100,000 12 19 18 24
MEAN $62,400 $108,900 $95,200 $84,100
MEDIAN $6,000 $7,000 $18,000 $19,000

16
Q430: Please indicate which types of investments or investment accounts you personally have. Do you currently have . . .?Base: All shareholders
Sept ’03 Jan ‘04
% %
Individual stocks (not including stock options or restricted stocks from the company that I work for)
70 71
Stock mutual funds 68 67
All other investments (net) 87 85
Individual retirement account that I control (i.e., IRA, KEOGH, SEP)
54 56
Individual retirement accounts through my employer (i.e., 401(k) retirement savings plan or 403(b) retirement savings plan, or profit sharing plan)
49 52
Bonds or bond funds 34 33
Stock options or restricted stocks from the company that I work for
12 15
Other type of investment not mentioned 24 21
In addition to individual stocks and stock mutual funds, the large majority of shareholders continue to own other investments such as IRAs and bonds.
Types of Investments Owned

17
From Both Employer Plan and on My Own
35%
On My Own Only49%
Employer Plan Only17%
Q435: You mentioned that you personally have investments in stock mutual funds. Did you get these investments through an employer plan, on your own or through both ways? Base: Shareholders who have stock mutual fund investments
The majority of shareholders with stock mutual fund investments got their mutual funds at least partly through their own initiative.
How Obtained Stock Mutual Fund Investments
From Both Employers and on My Own/On My Own Only (Net) = 83%
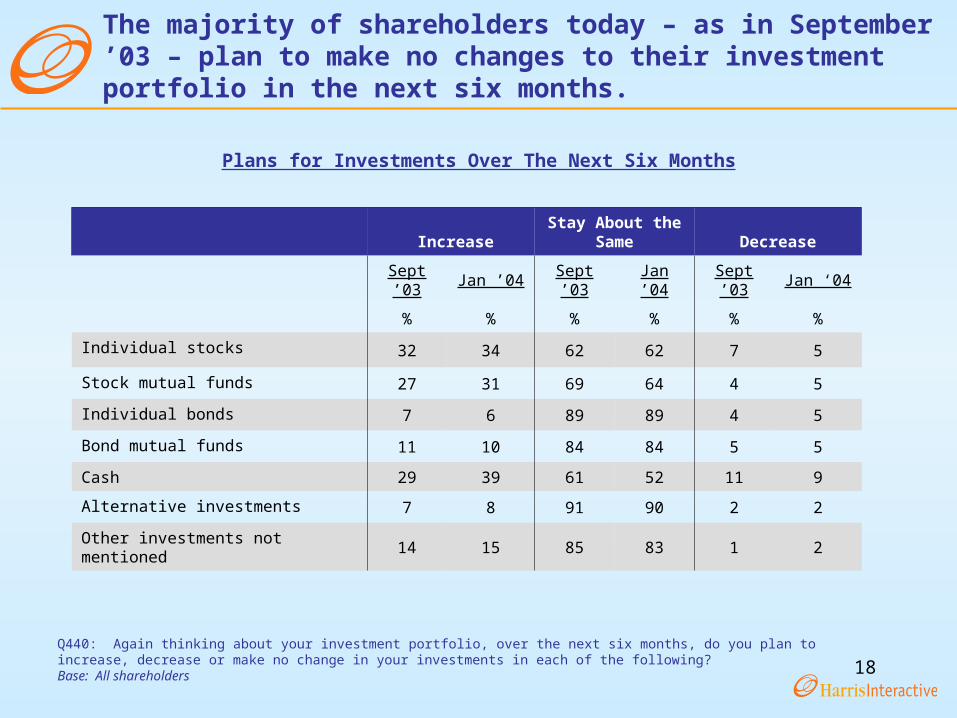
18Q440: Again thinking about your investment portfolio, over the next six months, do you plan to increase, decrease or make no change in your investments in each of the following? Base: All shareholders
The majority of shareholders today – as in September ’03 – plan to make no changes to their investment portfolio in the next six months.
Plans for Investments Over The Next Six Months
IncreaseStay About the
Same Decrease
Sept ’03 Jan ’04 Sept ’03 Jan ’04 Sept ’03 Jan ‘04
% % % % % %
Individual stocks 32 34 62 62 7 5
Stock mutual funds 27 31 69 64 4 5
Individual bonds 7 6 89 89 4 5
Bond mutual funds 11 10 84 84 5 5
Cash 29 39 61 52 11 9
Alternative investments 7 8 91 90 2 2
Other investments not mentioned 14 15 85 83 1 2

19Q460: In the past year, what is the average rate of return you earned on your stocks?Base: All shareholders
Typically, investors earned a return of 8% on their stocks in the past year.
Earned Return on Stocks
MEAN = 16.3%MEDIAN = 8%
Return of 15% or more32%
Return of 10-14%15%
Return of 5-9%23%
Return less than 5%30%
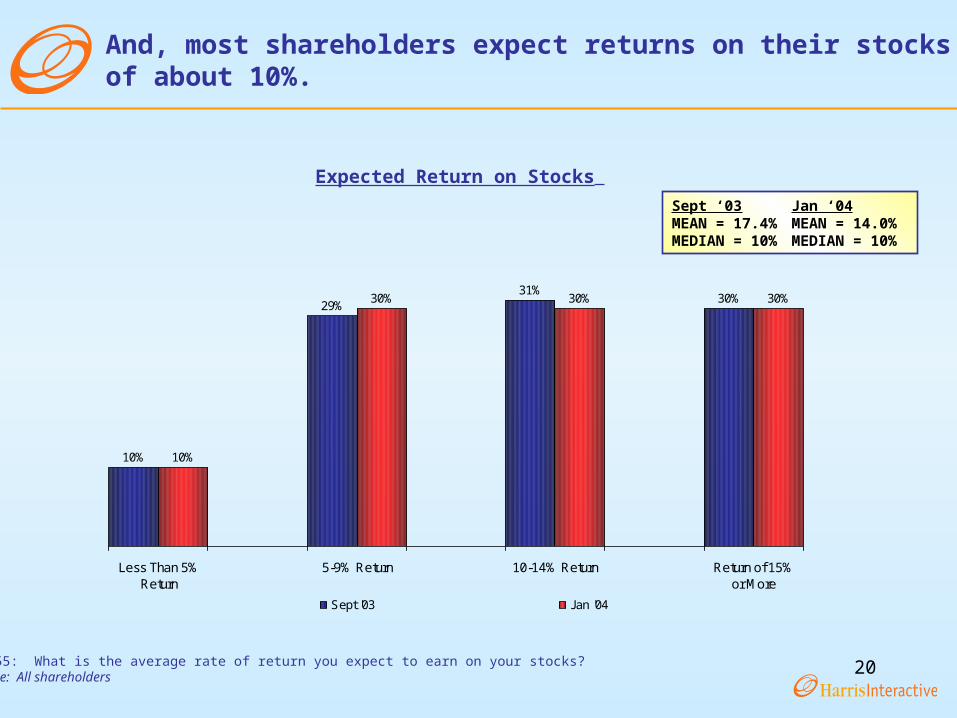
20Q455: What is the average rate of return you expect to earn on your stocks?Base: All shareholders
And, most shareholders expect returns on their stocks of about 10%.
Expected Return on Stocks
10%
29%31%
30%
10%
30% 30% 30%
Less Than 5%Return
5-9% Return 10-14% Return Return of 15%or More
Sept '03 Jan '04
Sept ‘03 Jan ‘04MEAN = 17.4% MEAN = 14.0%MEDIAN = 10% MEDIAN = 10%
21
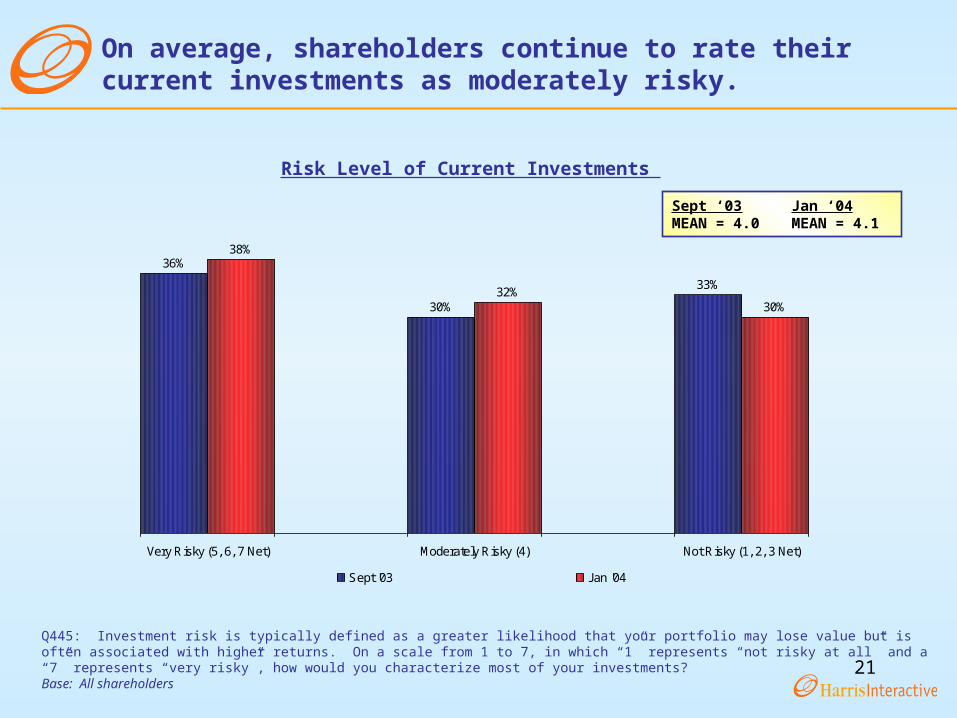
On average, shareholders continue to rate their current investments as moderately risky.
Q445: Investment risk is typically defined as a greater likelihood that your portfolio may lose value but is often associated with higher returns. On a scale from 1 to 7, in which “1” represents “not risky at all” and a “7” represents “very risky”, how would you characterize most of your investments?Base: All shareholders
Risk Level of Current Investments
36%
30%
33%
38%
32%30%
Very Risky (5, 6, 7 Net) Moderately Risky (4) Not Risky (1, 2, 3 Net)
Sept '03 Jan '04
Sept ‘03 Jan ‘04MEAN = 4.0 MEAN = 4.1

22
Q442: If you had $10,000/$100,000 to invest, how much would you invest in each of the following? Base: All shareholdersNote: For this question, half of all respondents were asked to allocate $10,000 across the investments listed above and the other half were asked to allocate $100,000 across the investments listed above.
Regardless of how much money they have to invest, shareholders are most likely to place their money in individual stocks or stock mutual funds.
Have $10,000 to Invest
Total
Have $100,000 to Invest
Total
% %
Individual stocks 32 27
Stock mutual funds 26 27
Cash 14 13
Bond mutual funds 10 9
Individual bonds 6 6
Alternative investments 3 5
Other investments 7 13
Percentage Allocated to Each Investment

23
HOW DO SHAREHOLDERS FEEL ABOUT THE ECONOMY AND STOCK MARKET?

24
Shareholders’ confidence today in the United States economy has dramatically increased compared to September ‘03.
Q410: How much confidence do you have that the United States’ economy is generally moving in the right direction?Base: All shareholders
57%
43%
71%
29%
A Great Deal/A Fair Amount (Net) Not Much/None At All (Net)
Sept '03 Jan '04
Confidence in the U.S. Economy
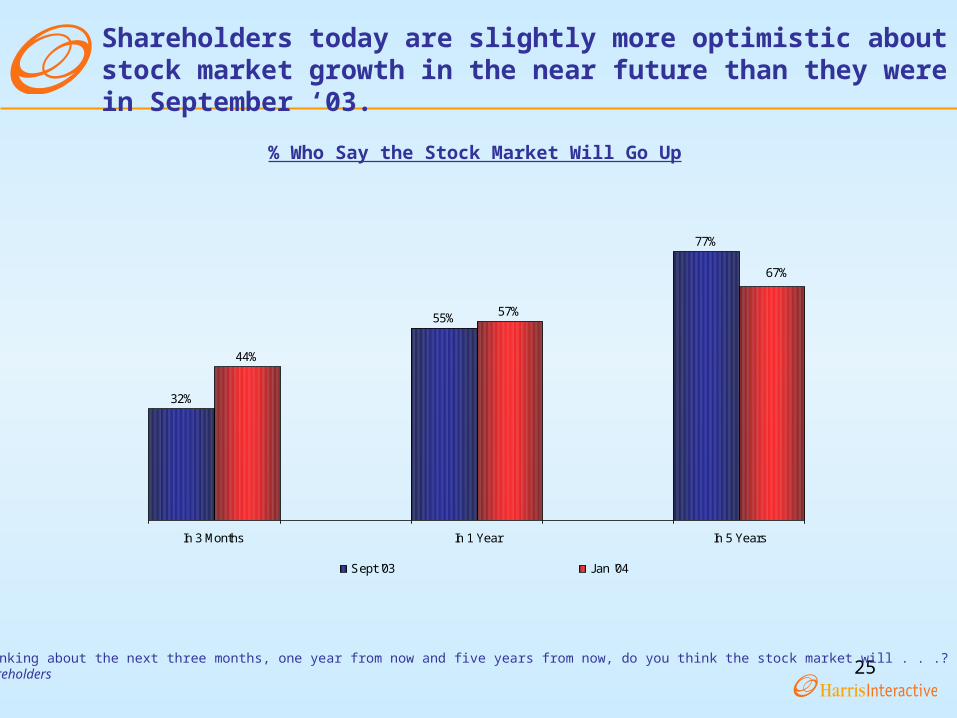
25Q415: Thinking about the next three months, one year from now and five years from now, do you think the stock market will . . .?Base: All shareholders
Shareholders today are slightly more optimistic about stock market growth in the near future than they were in September ‘03.
% Who Say the Stock Market Will Go Up
32%
55%
77%
44%
57%
67%
In 3 Months In 1 Year In 5 Years
Sept '03 Jan '04

26
100º
80º
60º
40º
20º
0º
-20º
-40º
-60º
-80º
-100º
NAIC INDEX
26.7
The NAIC Index* of 27 in January ‘04 reflects a cautious optimism towards the stock market.
Question Positive Neutral NegativeComponent
Scores
Q410 20.7 73.8 5.5 15.2Q415 - 3 mos 48.2 38.9 12.8 35.4Q415 - 12 mos 56.4 30.8 12.8 43.5Q415 - 5 yrs 66.7 18.7 14.5 52.2Q441 - 01 32.1 63.1 4.8 27.3Q441 - 02 31.5 62.9 5.6 25.8Q445 37.6 31.7 30.6 7.0Q486 - 01 35.8 31.6 32.6 3.3Q486 - 02 42.4 25.0 32.6 9.8Q486 - 03 62.1 22.8 15.1 47.0
= 266.6
NAIC Index = 26.7
Component Scores for Each Item Included in NAIC Index
Note: The NAIC Index was calculated based on 10 components that reflect shareholder confidence in the economy and stock market and is rated on a scale from -100 to +100 where 0 is the midpoint. A more detailed explanation of the Index is found in the Detailed Methodology.

27Q485: How strongly do you agree or disagree with each of the following statements? Base: All shareholders
A majority of shareholders feel it is a good time for new investors to get involved in the stock market.
62%
24%
15%
Agree Neither agree nor disagree Disagree
“It’s a good time for new investors to get involved in the stock market.”

28Q485: How strongly do you agree or disagree with each of the following statements? Base: All shareholders
But, less than half feel most stocks are a better bargain now than one year ago.
43%
26%31%
Agree Neither agree nor disagree Disagree
“Most stocks are a better bargain now than they were one year ago.”

29Q485: How strongly do you agree or disagree with each of the following statements? Base: All shareholders
And, they have mixed feelings about whether it is the best time to move from safer to more risky investments.
34% 32%35%
Agree Neither agree nor disagree Disagree
“It’s a good time to move money into safer, lower risk investments from higher return/higher risk investments.”

30
HOW DO SHAREHOLDERS FEEL ABOUT THE RECENT MUTUAL FUND SCANDALS?
31
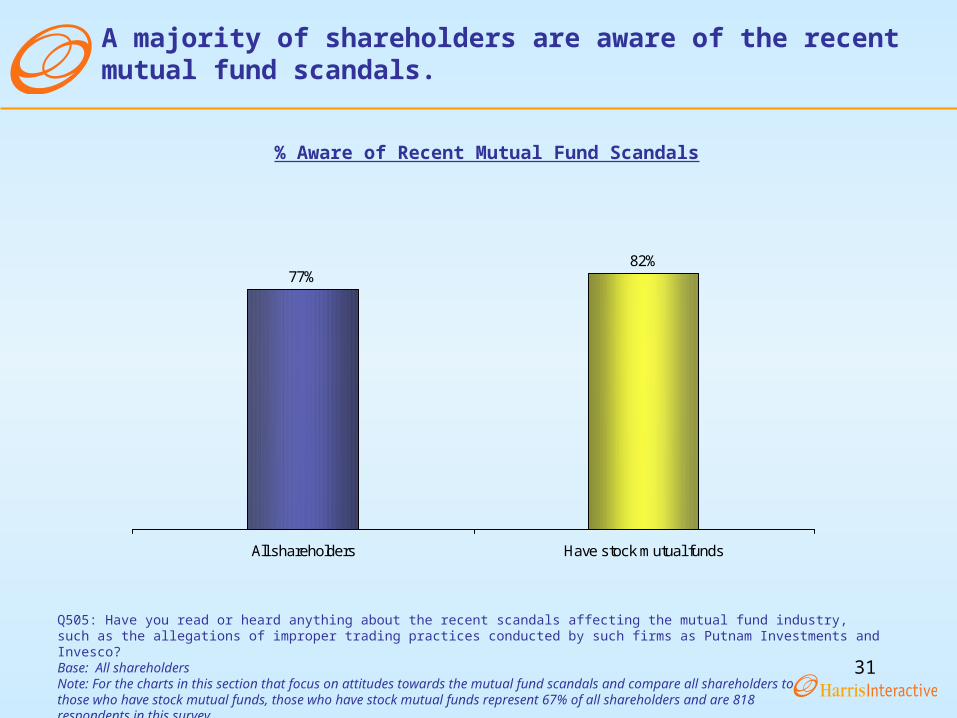
Q505: Have you read or heard anything about the recent scandals affecting the mutual fund industry, such as the allegations of improper trading practices conducted by such firms as Putnam Investments and Invesco? Base: All shareholdersNote: For the charts in this section that focus on attitudes towards the mutual fund scandals and compare all shareholders to those who have stock mutual funds, those who have stock mutual funds represent 67% of all shareholders and are 818 respondents in this survey.
A majority of shareholders are aware of the recent mutual fund scandals.
77%82%
All shareholders Have stock mutual funds
% Aware of Recent Mutual Fund Scandals
32
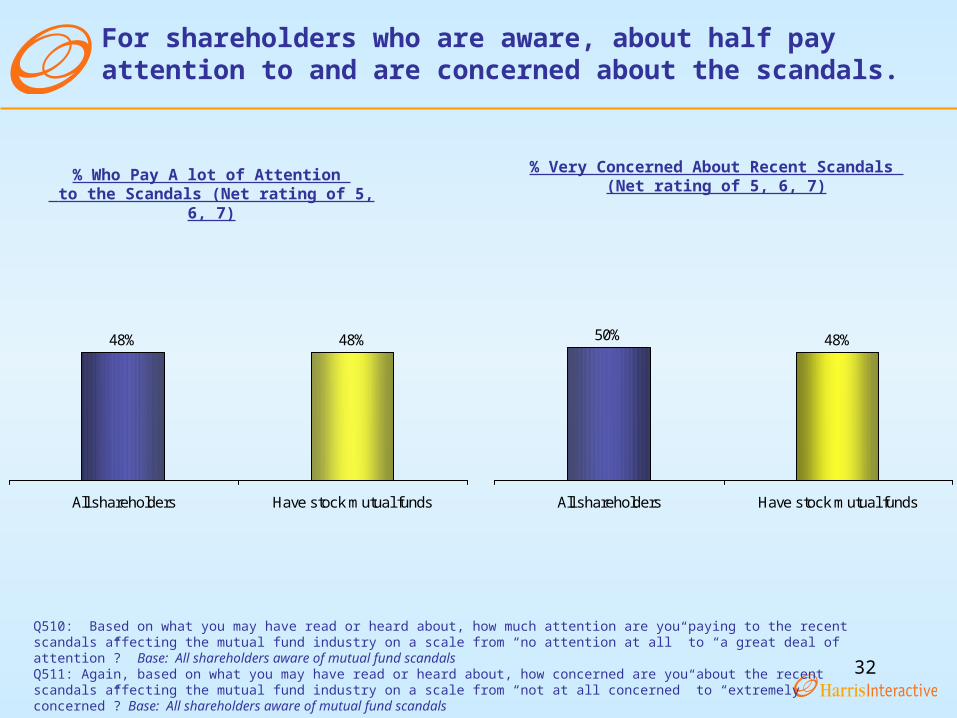
50% 48%
All shareholders Have stock mutual funds
Q510: Based on what you may have read or heard about, how much attention are you paying to the recent scandals affecting the mutual fund industry on a scale from “no attention at all” to “a great deal of attention”? Base: All shareholders aware of mutual fund scandalsQ511: Again, based on what you may have read or heard about, how concerned are you about the recent scandals affecting the mutual fund industry on a scale from “not at all concerned” to “extremely concerned”? Base: All shareholders aware of mutual fund scandals
For shareholders who are aware, about half pay attention to and are concerned about the scandals.
% Who Pay A lot of Attention to the Scandals (Net rating of 5, 6, 7)
% Very Concerned About Recent Scandals (Net rating of 5, 6, 7)
48% 48%
All shareholders Have stock mutual funds
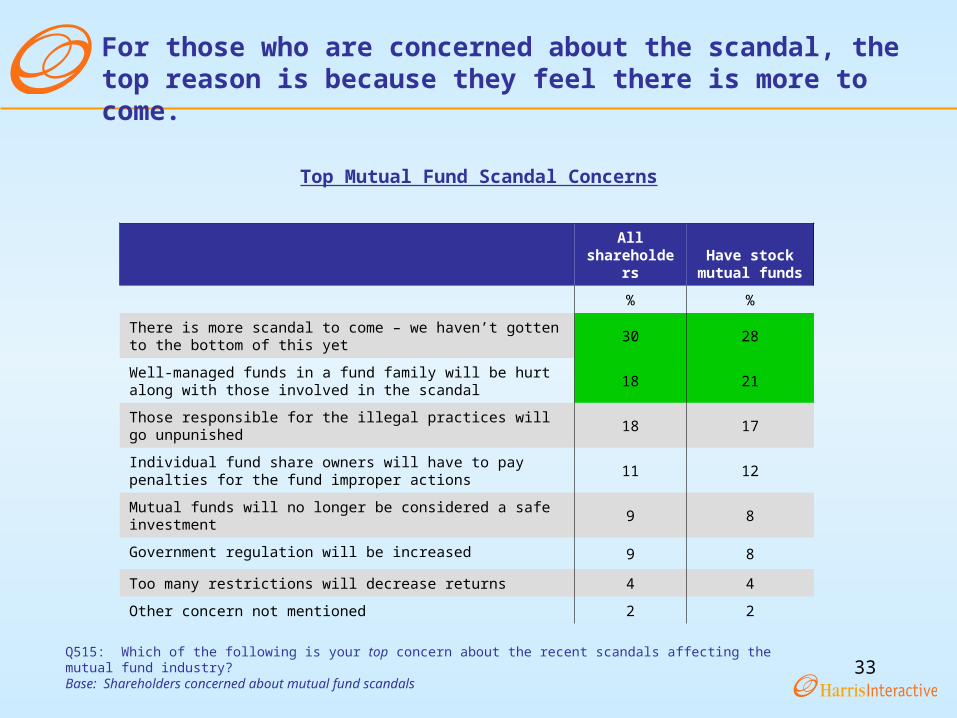
33Q515: Which of the following is your top concern about the recent scandals affecting the mutual fund industry? Base: Shareholders concerned about mutual fund scandals
For those who are concerned about the scandal, the top reason is because they feel there is more to come.
Top Mutual Fund Scandal Concerns
All shareholders
Have stock mutual funds
% %
There is more scandal to come – we haven’t gotten to the bottom of this yet
30 28
Well-managed funds in a fund family will be hurt along with those involved in the scandal
18 21
Those responsible for the illegal practices will go unpunished 18 17
Individual fund share owners will have to pay penalties for the fund improper actions
11 12
Mutual funds will no longer be considered a safe investment 9 8
Government regulation will be increased 9 8
Too many restrictions will decrease returns 4 4
Other concern not mentioned 2 2
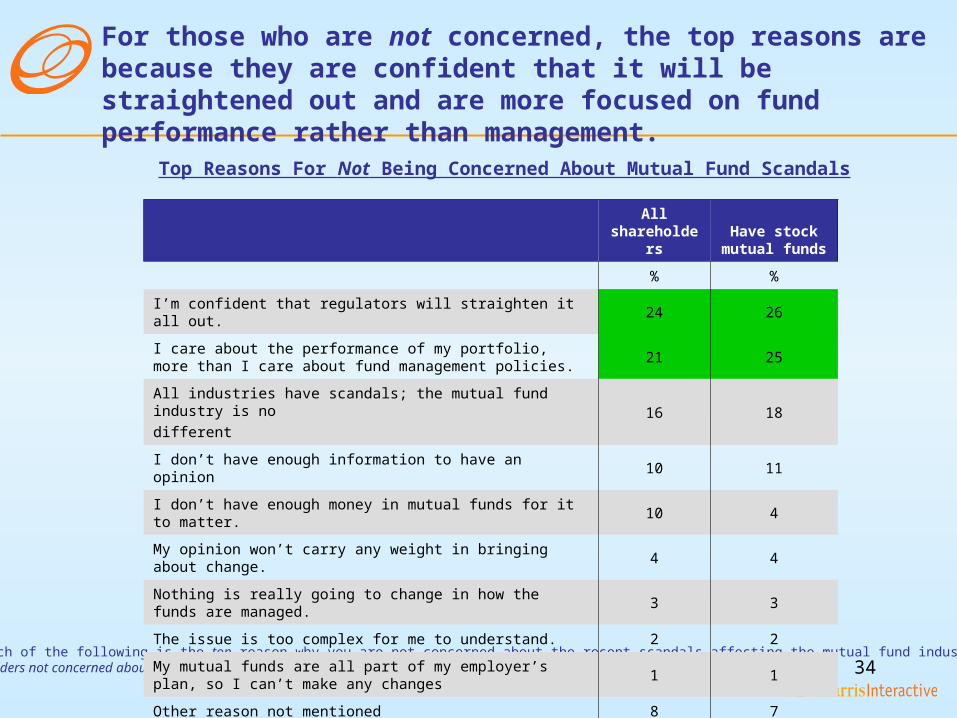
34Q520: Which of the following is the top reason why you are not concerned about the recent scandals affecting the mutual fund industry? Base:Shareholders not concerned about mutual fund scandals
For those who are not concerned, the top reasons are because they are confident that it will be straightened out and are more focused on fund performance rather than management.
All shareholders
Have stock mutual funds
% %
I’m confident that regulators will straighten it all out. 24 26
I care about the performance of my portfolio, more than I care about fund management policies.
21 25
All industries have scandals; the mutual fund industry is no
different 16 18
I don’t have enough information to have an opinion 10 11
I don’t have enough money in mutual funds for it to matter. 10 4
My opinion won’t carry any weight in bringing about change. 4 4
Nothing is really going to change in how the funds are managed. 3 3
The issue is too complex for me to understand. 2 2
My mutual funds are all part of my employer’s plan, so I can’t make any changes
1 1
Other reason not mentioned 8 7
Top Reasons For Not Being Concerned About Mutual Fund Scandals

35Q525: Which of the following actions have you personally taken after seeing or hearing about the recent mutual fund scandals? Base: Aware of mutual fund scandals
After hearing about the scandals, the most common actions shareholders took were learning more about the issues and discussing the scandals with friends or family.
All shareholders
Have stock mutual funds
% %
Became better educated about the issues 31 34
Discussed issues with friends or family 27 26
Discussed issues with financial professional 20 23
Sold some or all of my mutual fund investments 11 11
Contacted the fund family as a concerned shareholder 5 7
Talked to my employer about the funds offered through
our 401(k) plan 5 5
Contacted a government official to share my views 4 4
Other action not mentioned 5 6
I have not taken any actions 41 37
Actions Taken After Hearing About Mutual Fund Scandals

36
41%37%
All shareholders Have stock mutual funds
Q535: You mentioned that you have made no changes to your mutual fund investments. Which of the following best describes why you have not made any changes? Base: Made no change in mutual fund investments
Four out of ten shareholders did not make any changes to their mutual funds after hearing about the scandals – primarily because they view mutual funds as long term investments. This is even more so for those with stock mutual funds.
Top 5 Reasons for Not Changing Mutual Fund Investments
All shareholders
Have stock mutual funds
% %
I think of my mutual funds as long-term investments so I will stick with them. 45 58
I am still getting good returns on my investments 22 29
I think it is too early to worry about the problems and make changes. 14 16
I don’t have enough money in mutual funds for it to matter. 12 10
I want to avoid the tax implications of making a change 6 9
I think the reforms already implemented will be enough to prevent future abuses.
6 6
Whether Made Changes to Mutual Fund Investments

37
11% 11%
All shareholders Have stock mutual funds
Q540: You mentioned that you sold some or all of your mutual fund investments. Which of the following types of investments did you move your money to? Base: Sold all or some of mutual fund investments
Only a few shareholders sold their mutual funds after hearing about the recent scandals. Of these, approximately half converted their funds to cash.
Mutual Fund Investment Shifts After Hearing About Scandals
All shareholders
Have stock mutual funds
% %
Cash 48 49
Individual stocks 25 20
Another fund family 23 30
Real estate 19 20
Money market funds/T bills 17 16
Alternative investments 9 11
Individual bonds 6 4
Other investments not mentioned 7 4
% Sold Some or All Mutual Funds

38Q550: Which of the following should have the responsibility for fixing the problems facing the mutual fund industry? Base: Aware of mutual fund scandals
Over half of all shareholders believe the mutual fund industry – through an independent board – is best equipped to fix the problems facing its industry.
Groups Best Able to Fix Mutual Fund Industry Problems
All shareholders
Have stock mutual funds
% %
Mutual fund industry through an independent oversight board
56 54
Individual mutual fund companies
21 22
Government 21 22
Other group not mentioned 3 3
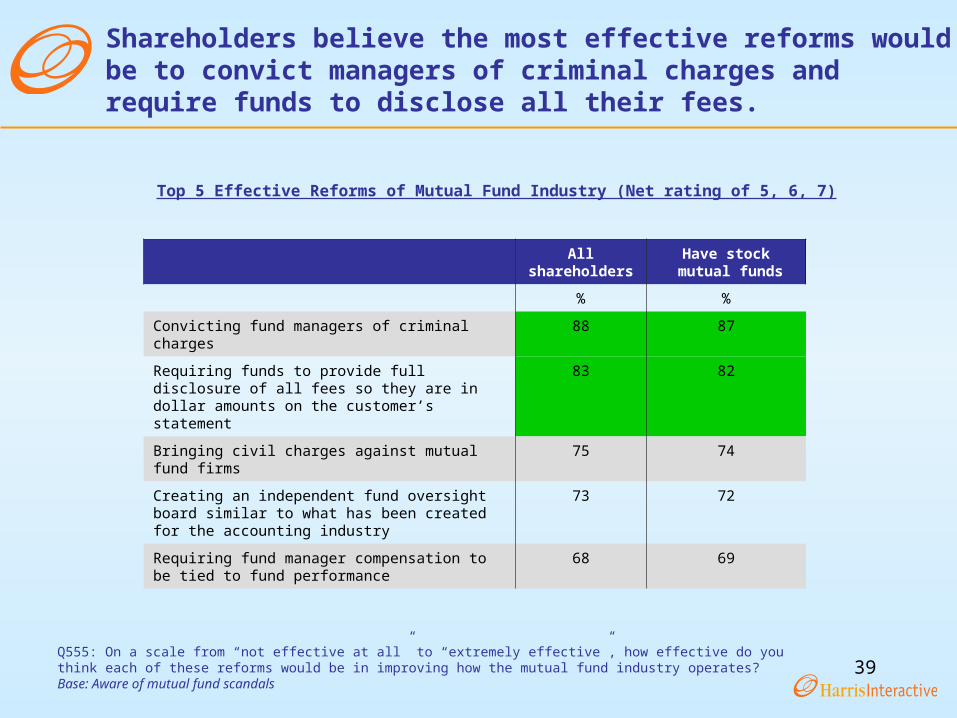
39Q555: On a scale from “not effective at all” to “extremely effective”, how effective do you think each of these reforms would be in improving how the mutual fund industry operates? Base: Aware of mutual fund scandals
Shareholders believe the most effective reforms would be to convict managers of criminal charges and require funds to disclose all their fees.
All shareholders
Have stock mutual funds
% %
Convicting fund managers of criminal charges 88 87
Requiring funds to provide full disclosure of all fees so they are in dollar amounts on the customer’s statement
83 82
Bringing civil charges against mutual fund firms 75 74
Creating an independent fund oversight board similar to what has been created for the accounting industry
73 72
Requiring fund manager compensation to be tied to fund performance
68 69
Top 5 Effective Reforms of Mutual Fund Industry (Net rating of 5, 6, 7)

40
WHAT DO SHAREHOLDERS KNOW ABOUT WHAT DO SHAREHOLDERS KNOW ABOUT THE “TRADE THROUGH RULE”?THE “TRADE THROUGH RULE”?

41
Yes13%
No87%
Q700: Have you heard or seen anything about the “trade through rule”? Base: All shareholdersQ705: How familiar are you with the “trade through rule” on a scale from “not at all familiar” to “extremely familiar”? Base: Heard about trade through rule
Few shareholders have heard of the “trade through rule” and are familiar with it.
31%
24%
45%
Very Familiar (Netrating 5, 6, 7)
SomewhatFamiliar (4)
Not Very Familiar(Net rating 1, 2, 3)
Whether Heard of “Trade Through Rule” Familiarity with “Trade Through Rule”
MEAN = 3.8

42
SUBGROUP ANALYSISSUBGROUP ANALYSIS

43
WHAT ARE THE DIFFERENCES BETWEEN WHAT ARE THE DIFFERENCES BETWEEN MALE AND FEMALE SHAREHOLDERS?MALE AND FEMALE SHAREHOLDERS?

44
Men still have more confidence in the economy than do women.
Q410: How much confidence do you have that the United States’ economy is generally moving in the right direction?Base: All shareholders
Confidence in U.S. Economy - A Great Deal/Fair Amount (Net)
Men Women
62%
50%
75%
63%
Sept '03 Jan '04

45
On average, men continue to have riskier investments than women – however, the gap between the two is shrinking.
Q445: Investment risk is typically defined as a greater likelihood that your portfolio may lose value but is often associated with higher returns. On a scale from 1 to 7, in which “1” represents “not risky at all” and a “7” represents “very risky”, how would you characterize most of your investments?Base: All shareholders
Risk Level of Investments
Men Women
% %
Very Risky (5, 6, 7) (Net)
Sept ’03 42 27
Jan ‘04 45 28
Moderately Risky (4)
Sept ’03 29 31
Jan ‘04 28 38
Not Risky at All (1, 2, 3) (Net)
Sept ’03 28 41
Jan ‘04 27 33
MEAN
Sept ’03 4.2 3.7
Jan ‘04 4.2 3.9
46
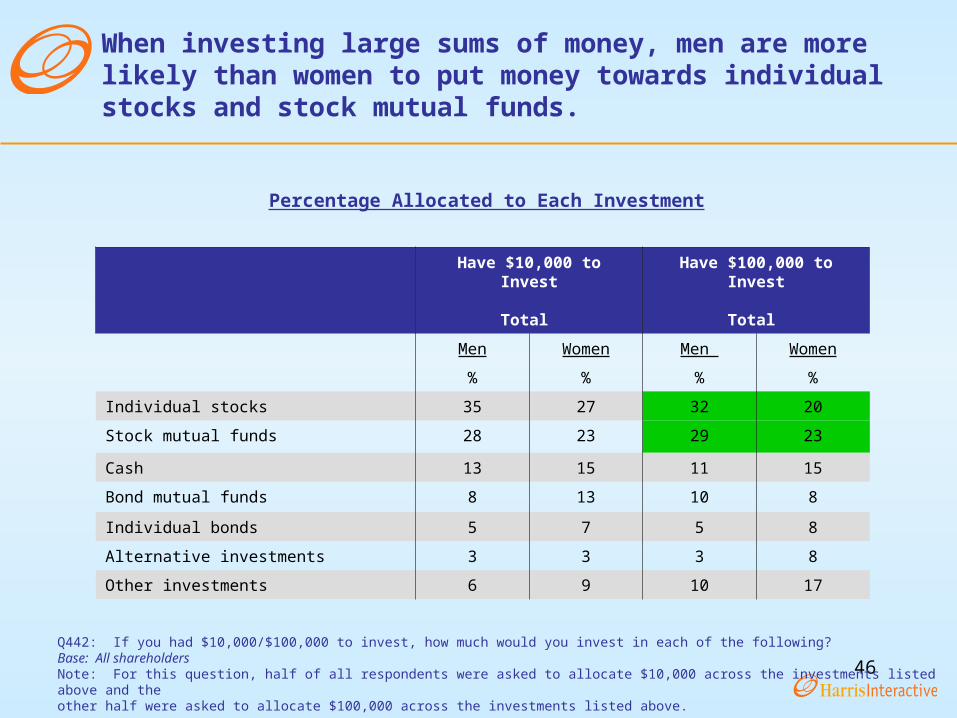
Q442: If you had $10,000/$100,000 to invest, how much would you invest in each of the following? Base: All shareholdersNote: For this question, half of all respondents were asked to allocate $10,000 across the investments listed above and the other half were asked to allocate $100,000 across the investments listed above.
When investing large sums of money, men are more likely than women to put money towards individual stocks and stock mutual funds.
Have $10,000 to Invest
Total
Have $100,000 to Invest
Total
Men Women Men Women
% % % %
Individual stocks 35 27 32 20
Stock mutual funds 28 23 29 23
Cash 13 15 11 15
Bond mutual funds 8 13 10 8
Individual bonds 5 7 5 8
Alternative investments 3 3 3 8
Other investments 6 9 10 17
Percentage Allocated to Each Investment
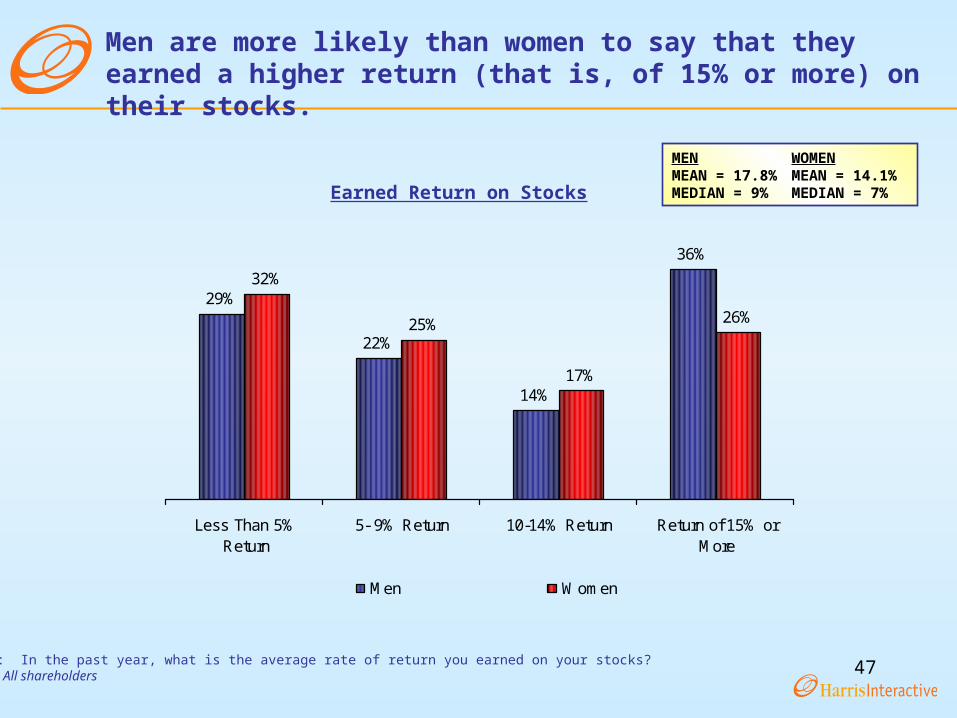
47Q460: In the past year, what is the average rate of return you earned on your stocks?Base: All shareholders
Men are more likely than women to say that they earned a higher return (that is, of 15% or more) on their stocks.
Earned Return on Stocks
29%
22%
14%
36%
32%
25%
17%
26%
Less Than 5%Return
5- 9% Return 10-14% Return Return of 15% orMore
Men Women
MEN WOMENMEAN = 17.8% MEAN = 14.1%MEDIAN = 9% MEDIAN = 7%

48
Men are more likely than women to feel it is a good time for new investors to enter the stock market.
Q486: How strongly do you agree or disagree with each of the following statements?Base: All shareholders
66%
56%
Men Women
% Strongly/Somewhat Agree:“It’s a good time for new investors to get involved in the stock market.”

49
And, men are less likely than women to feel it is a good time to move investments from high risk to safer investments.
Q486: How strongly do you agree or disagree with each of the following statements?Base: All shareholders
29%
40%
Men Women
% Strongly/Somewhat Agree:“It’s a good time to move money into safer, lower risk investments from
higher return/higher risk investments.”

50
Men are more likely than women to be aware of and pay attention to the mutual fund scandals.
Q505: Have you read or heard anything about the recent scandals affecting the mutual fund industry, such as the allegations of improper trading practices conducted by such firms as Putnam Investments and Invesco? Base: All shareholdersQ510: Based on what you may have read or heard about, how much attention are you paying to the recent scandals affecting the mutual fund industry on a scale from “no attention at all” to “a great deal of attention”? Base: All shareholders aware of mutual fund scandalsQ511: Again, based on what you may have read or heard about, how concerned are you about the recent scandals affecting the mutual fund industry on a scale from “not at all concerned” to “extremely concerned”? Base: All shareholders aware of mutual fund scandals
83%
17%
68%
32%
Yes No
Men Women
Whether Aware of Mutual Fund Scandals
51%
42%
% Paying A Lot of Attention to the Scandals (Net Rating of 5, 6, 7)
% Concerned About the Scandals (Net Rating of 5, 6, 7)
51%47%

51
DemographicsDemographics
52
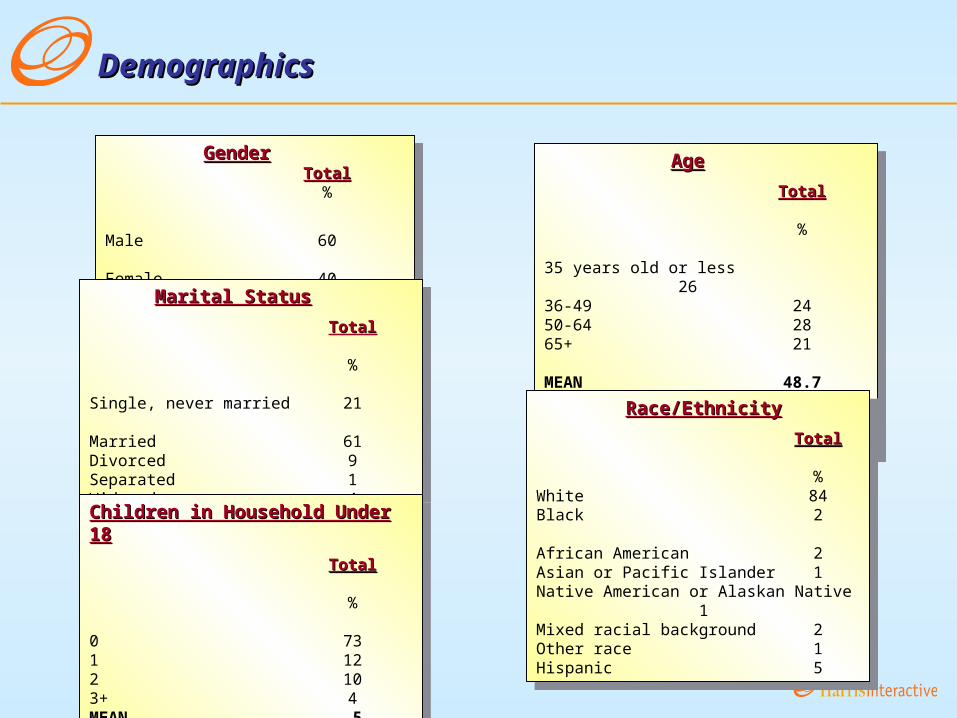
DemographicsDemographics
GenderGenderTotalTotal
%
Male 60
Female 40
GenderGenderTotalTotal
%
Male 60
Female 40
AgeAge
TotalTotal
%
35 years old or less 2636-49 2450-64 2865+ 21
MEAN 48.7
MEDIAN 49
AgeAge
TotalTotal
%
35 years old or less 2636-49 2450-64 2865+ 21
MEAN 48.7
MEDIAN 49
Marital StatusMarital Status
TotalTotal
%
Single, never married 21
Married 61Divorced 9Separated 1Widowed 4Living with partner 4
Marital StatusMarital Status
TotalTotal
%
Single, never married 21
Married 61Divorced 9Separated 1Widowed 4Living with partner 4Children in Household Under 18Children in Household Under 18
TotalTotal
%
0 731 122 103+ 4MEAN .5MEDIAN -
Children in Household Under 18Children in Household Under 18
TotalTotal
%
0 731 122 103+ 4MEAN .5MEDIAN -
Race/EthnicityRace/Ethnicity
TotalTotal
%White 84Black 2
African American 2Asian or Pacific Islander 1Native American or Alaskan Native 1Mixed racial background 2Other race 1Hispanic 5
Race/EthnicityRace/Ethnicity
TotalTotal
%White 84Black 2
African American 2Asian or Pacific Islander 1Native American or Alaskan Native 1Mixed racial background 2Other race 1Hispanic 5

53
Demographics (Cont’d)Demographics (Cont’d)
EducationEducation
TotalTotal%
High school graduate or less 18Some college, but no degree 34College (e.g., B.A., B.S.) 27Some graduate school, but no degree 6Graduate school (e.g., M.S., M.D., Ph.D.) 14
EducationEducation
TotalTotal%
High school graduate or less 18Some college, but no degree 34College (e.g., B.A., B.S.) 27Some graduate school, but no degree 6Graduate school (e.g., M.S., M.D., Ph.D.) 14
Party IdentificationParty Identification
TotalTotal
%
Republican 44Democrat 29Independent 27
Party IdentificationParty Identification
TotalTotal
%
Republican 44Democrat 29Independent 27
Political PhilosophyPolitical Philosophy
TotalTotal
%
Conservative 36Moderate 46Liberal 17
Political PhilosophyPolitical Philosophy
TotalTotal
%
Conservative 36Moderate 46Liberal 17
EmploymentEmployment
TotalTotal%
Employed (net) 65Employed full-time 47Employed part-time 9Self-employed 12
Not employed, but looking for work 3Not employed and not looking for work 3Retired 26Student 6Homemaker 7
EmploymentEmployment
TotalTotal%
Employed (net) 65Employed full-time 47Employed part-time 9Self-employed 12
Not employed, but looking for work 3Not employed and not looking for work 3Retired 26Student 6Homemaker 7

54
Demographics (Cont’d)Demographics (Cont’d)
Household’s Total Net WorthHousehold’s Total Net Worth
TotalTotal%
Less than $50,000 15$50,000 to $99,999 14$100,000 - $249,999 15$250,000 or more 32Not sure 5Decline to answer 17
Household’s Total Net WorthHousehold’s Total Net Worth
TotalTotal%
Less than $50,000 15$50,000 to $99,999 14$100,000 - $249,999 15$250,000 or more 32Not sure 5Decline to answer 17
Investable AssetsInvestable Assets
TotalTotal%
Less than $50,000 32$50,000 to $99,999 11$100,000 - $249,999 13$250,000 or more 17Not sure 10Decline to answer 18
Investable AssetsInvestable Assets
TotalTotal%
Less than $50,000 32$50,000 to $99,999 11$100,000 - $249,999 13$250,000 or more 17Not sure 10Decline to answer 18
Household IncomeHousehold Income
TotalTotal%
Less than $50,000 28$50,000 to $99,999 33$100,000 to $149,999 18$150,000 or more 10
Decline to answer 11
Household IncomeHousehold Income
TotalTotal%
Less than $50,000 28$50,000 to $99,999 33$100,000 to $149,999 18$150,000 or more 10
Decline to answer 11

55
Demographics (Cont’d)Demographics (Cont’d)
RegionRegion
TotalTotal%
East 24Midwest 20South 33West 23
RegionRegion
TotalTotal%
East 24Midwest 20South 33West 23
Size of PlaceSize of Place
TotalTotal
%Central counties of metro areas of 1 million or more 48Fringe counties of metro areas of 1 million or more 5Counties in metro areas of 250,000 to 1 million 23Counties in metro areas of fewer than 250,000 8Urban population of 20,000 or more, adjacent to metro area 4Urban population of 20,000 or more, not adjacent to metro area 3Urban population of 2,500-19,999, adjacent to metro area 4Urban population of 2,500-19,999, not adjacent to metro area 4Completely rural or less than 2,500 urban population, 1adjacent to metro areaCompletely rural or less than 2,500 urban population, 1not adjacent to metro areaNA 1

56
Detailed MethodologyDetailed Methodology
57
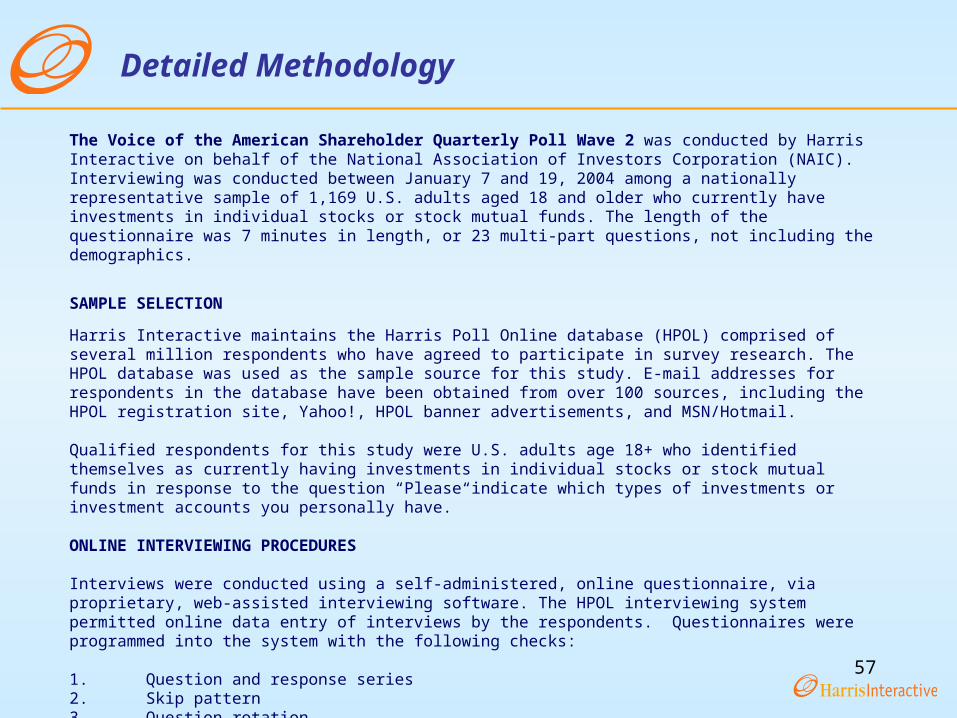
Detailed Methodology
The Voice of the American Shareholder Quarterly Poll Wave 2 was conducted by Harris Interactive on behalf of the National Association of Investors Corporation (NAIC). Interviewing was conducted between January 7 and 19, 2004 among a nationally representative sample of 1,169 U.S. adults aged 18 and older who currently have investments in individual stocks or stock mutual funds. The length of the questionnaire was 7 minutes in length, or 23 multi-part questions, not including the demographics.
SAMPLE SELECTION
Harris Interactive maintains the Harris Poll Online database (HPOL) comprised of several million respondents who have agreed to participate in survey research. The HPOL database was used as the sample source for this study. E-mail addresses for respondents in the database have been obtained from over 100 sources, including the HPOL registration site, Yahoo!, HPOL banner advertisements, and MSN/Hotmail.
Qualified respondents for this study were U.S. adults age 18+ who identified themselves as currently having investments in individual stocks or stock mutual funds in response to the question “Please indicate which types of investments or investment accounts you personally have.”
ONLINE INTERVIEWING PROCEDURES
Interviews were conducted using a self-administered, online questionnaire, via proprietary, web-assisted interviewing software. The HPOL interviewing system permitted online data entry of interviews by the respondents. Questionnaires were programmed into the system with the following checks: 1. Question and response series2. Skip pattern3. Question rotation4. Range checks5. Mathematical checks6. Consistency checks7. Special edit procedures
58
Detailed Methodology (cont’d)
ONLINE INTERVIEWING PROCEDURES (cont’d)
To maintain the reliability and integrity in the sample, each invitation contained a password that is uniquely assigned to that e-mail address. A respondent was required to enter the password at the beginning of the survey to gain access into the survey. Password protection ensured that a respondent completed the survey only one time.
To increase the number of respondents in the survey and to improve overall response rates, up to two additional reminder invitations are typically mailed at 2-4 day intervals to those respondents who have not yet participated in the survey. For this study, two reminders were sent to respondents.
To increase the number of respondents in the survey and to improve overall response rates, respondents were provided with a summary of some of the survey responses. This too was done via the Internet. Respondents were sent an email that provided them access to web site that contained the survey findings. As with the survey itself, this was a password protected site that was accessible for a limited period (1-2 weeks).
All data were then tabulated, checked for internal consistency and processed by computer. A series of computer-generated tables were produced for each of the key sample groups that showed the results of each survey question, both by the total number of respondents and by the key subgroups.

59
Detailed Methodology (cont’d)
WEIGHTING
Completed interviews were weighted to figures obtained from the Current Population Survey (CPS). Harris used several demographic variables (e.g., sex, age, education, race and ethnicity and income) to generalize survey results to the population at large. In addition, Harris Interactive applied a proprietary technique to the data called "propensity weighting" that essentially balanced all the characteristics (e.g., demographic, attitudinal, and behavioral) of online respondents. It is no surprise that certain kinds of people have a greater or lesser likelihood to be online and therefore to reply to our surveys. To account for this, Harris gave each individual a “propensity weight” which corresponded to their likelihood to be online. This ensured that the sample represented the general shareholder population at large and was not skewed toward more active online users or survey takers. In addition, people who had a lesser likelihood to be online acted as a proxy for those who are not online at all. Typical propensity weights that were used included measures of activity (our online respondents do more things), knowledge (our online samples are better informed), and attitudes (our online samples are more skeptical or cynical). One example of the success of Harris’ online methodology was our Election 2000 surveys. Election 2000 involved a series of national surveys on the presidential election from January to November 2000 as well as statewide polling on the presidential, Senate and governership races in 38 states. The Election 2000 surveys outperformed all other surveys – both telephone and online – and were the most accurate publicly reported surveys. The Election 2000 survey program represented major successes in: 1) the reliability of the data; and 2) the ability to undertake large-scale research that could not be accomplished just by telephone.

60
Detailed Methodology (cont’d)
WEIGHTING (CONT’D)
It is also worth mentioning that Harris conducts parallel telephone and online research on a regular basis through The Harris Poll, our monthly omnibus survey. By conducting this research, Harris is able to track results to make comparisons between data collected online and by phone, closely examine the biases and most importantly, develop strategies for correcting these biases. In fact, Harris has an internal department that is entirely focused on conducting this “research on research.”
EDITING AND CLEANING THE DATA
The data-processing staff performed machine edits and additional cleaning for the entire data set. Our edit programs acted as a verification of the skip instructions and other data checks that were written into the online program. The edit programs listed any errors by case number, question number and type. These were then resolved by senior personnel, who inspected the original file and made appropriate corrections. Complete records were kept of all such procedures.
61
Detailed Methodology (cont’d)
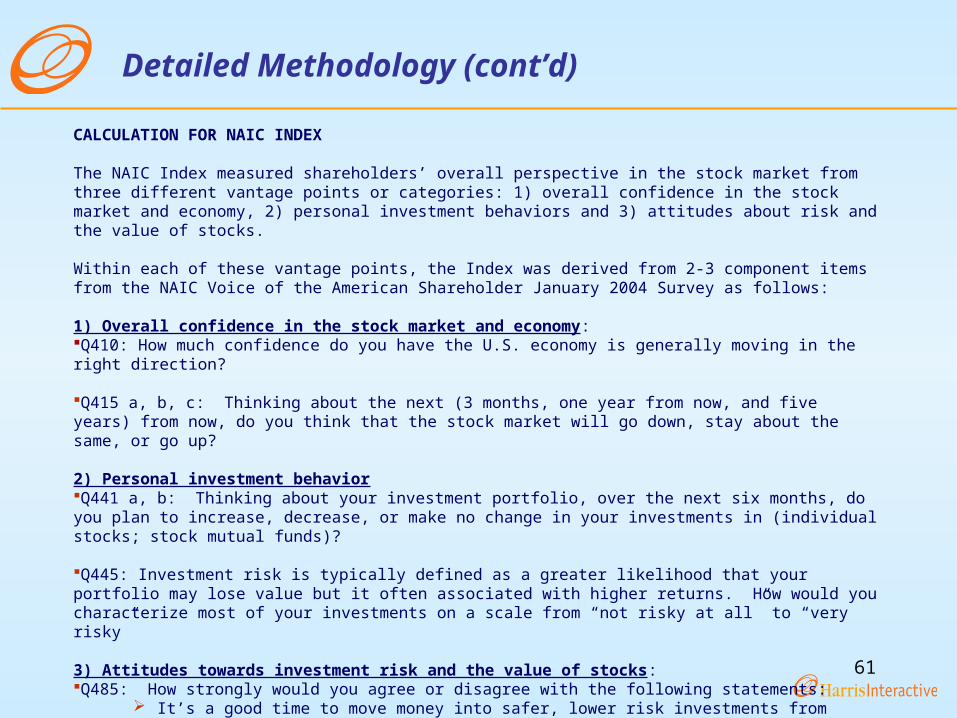
CALCULATION FOR NAIC INDEX
The NAIC Index measured shareholders’ overall perspective in the stock market from three different vantage points or categories: 1) overall confidence in the stock market and economy, 2) personal investment behaviors and 3) attitudes about risk and the value of stocks.
Within each of these vantage points, the Index was derived from 2-3 component items from the NAIC Voice of the American Shareholder January 2004 Survey as follows:
1) Overall confidence in the stock market and economy:Q410: How much confidence do you have the U.S. economy is generally moving in the right direction?
Q415 a, b, c: Thinking about the next (3 months, one year from now, and five years) from now, do you think that the stock market will go down, stay about the same, or go up?
2) Personal investment behaviorQ441 a, b: Thinking about your investment portfolio, over the next six months, do you plan to increase, decrease, or make no change in your investments in (individual stocks; stock mutual funds)?
Q445: Investment risk is typically defined as a greater likelihood that your portfolio may lose value but it often associated with higher returns. How would you characterize most of your investments on a scale from “not risky at all” to “very risky”
3) Attitudes towards investment risk and the value of stocks:Q485: How strongly would you agree or disagree with the following statements:
It’s a good time to move money into safer, lower risk investments from higher return/higher risk investments.
Most stocks are a better bargain now than they were a year ago. It’s a good time for new investors to get involved in the stock market.

62
Detailed Methodology (cont’d)
CALCULATION FOR NAIC INDEX – (cont’d)
For each component item within the three overall categories, a ‘component score’ was calculated by taking the difference of the percentage of positive responses and the percentage of negative responses.
For example, in January 2004, Q445a: “Thinking about the next 3 months, do you think that the stock market will go down, stay about the same, or go up?”
48.2% responded that the market would go up, 38.9% responded that it would stay the same, and 12.8% said it would go down
This yielded a component score of 48.2% - 12.8% = 35.4%
To calculate the NAIC Shareholder Index, we then took the mean of the 10 component scores.

63
Detailed Methodology (cont’d)
CALCULATION FOR NAIC INDEX – (cont’d)
The following table shows the component scores for each item used in calculating the Index for both September 2003 and January 2004.
Please note that since the three statements that make up Q486 were not asked in the January 2004 survey, the scores below should only be used to get a general sense of how the scores have changed on the other items that were repeated between September 2003 and January 2004.
Component Item Sept '03 Jan '04
Q410, Confidence that US economy is moving in right direction 5.9 15.2Q415, Stock market will go down, stay the same, or go up, next 3 mos 14.6 35.4Q415, Stock market will go down, stay the same, or go up, next 12 mos 42.0 43.5Q415, Stock market will go down, stay the same, or go up, next 5 yrs 66.3 52.2Q441*, Increase, decrease, or make no change in individual stock investments, next 6 months 24.0 27.3Q441*, Increase, decrease, or make no change in stock mutual funds, next 6 months 21.8 25.8Q445, How would you characterize most of your investments (1=not risky, 7=very risky) -- 7.0Q486, Good time to move money into safer, lower risk investments -- 3.3Q486, Most stocks are a better bargain now than they were a year ago -- 9.8Q486, Good time for new investors to get involved in the market -- 47.0* Q441 was numbered Q636 in Sept '03
Component Scores
64
Detailed Methodology (cont’d)
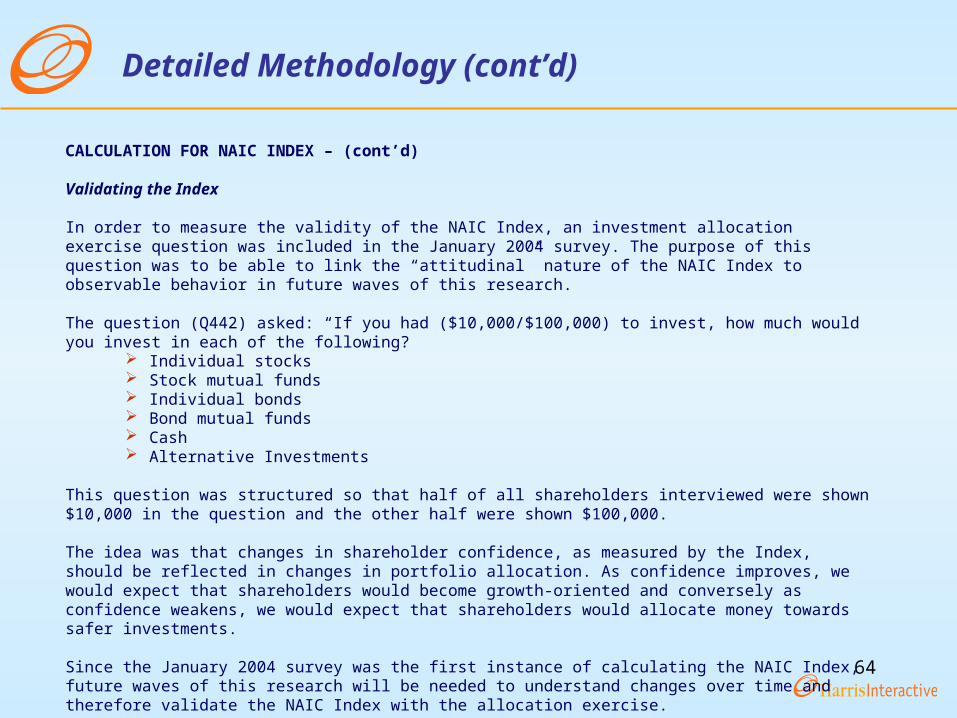
CALCULATION FOR NAIC INDEX – (cont’d)
Validating the Index
In order to measure the validity of the NAIC Index, an investment allocation exercise question was included in the January 2004 survey. The purpose of this question was to be able to link the “attitudinal” nature of the NAIC Index to observable behavior in future waves of this research.
The question (Q442) asked: “If you had ($10,000/$100,000) to invest, how much would you invest in each of the following?
Individual stocks Stock mutual funds Individual bonds Bond mutual funds Cash Alternative Investments
This question was structured so that half of all shareholders interviewed were shown $10,000 in the question and the other half were shown $100,000.
The idea was that changes in shareholder confidence, as measured by the Index, should be reflected in changes in portfolio allocation. As confidence improves, we would expect that shareholders would become growth-oriented and conversely as confidence weakens, we would expect that shareholders would allocate money towards safer investments.
Since the January 2004 survey was the first instance of calculating the NAIC Index, future waves of this research will be needed to understand changes over time and therefore validate the NAIC Index with the allocation exercise.