Embed Size (px)
Citation preview
February 2018
By Chetan Gabhane
Reference Architecture Guide
VMware Horizon View 7 with Instant Clone on Hitachi Unified Compute Platform HC

FeedbackHitachi Vantara welcomes your feedback. Please share your thoughts by sending an email message to [email protected]. To assist the routing of this message, use the paper number in the subject and the title of this white paper in the text.
Revision History
Revision Changes Date
MK-SL-035-00 Release replacing AS-590-01 February 20, 2018
Table of ContentsSolution Overview 2
User Workloads 2
Logical Design 4
Key Solution Components 5
Hitachi Unified Compute Platform HC 6
VMware Horizon 7
VMware vSAN 7
Brocade Networking 7
Solution Design 7
Storage Infrastructure 7
Deploy VMware Horizon Virtual Machines 7
Deploy Master Image for the Microsoft Windows 10 Virtual Desktop 8
Deploy the Automated Desktop Pool for Microsoft Windows 10 Instant Clones 8
Prepare the Host for Microsoft Windows Server 2012 R2 RDS 9
Deploy RDS Farm — Automated Linked Clones 9
Engineering Validation 11
Test Methodology 11
Test Results 12
Conclusion 32

1
VMware Horizon View 7 with Instant Clone on Hitachi Unified Compute Platform HC Reference Architecture Guide
Use this reference architecture guide to design a hyper-converged solution for VMware Horizon View 7 with Instant Clone on Hitachi Unified Compute Platform HC V240F (UCP HC V240F) for a VDI environment.
This describes the performance of Microsoft® Windows® 10 virtual desktops and Microsoft RDSH remote sessions on a 4-node Unified Compute Platform HC V240F compute vSAN cluster with a mixture of power workers, knowledge workers, and task workers using Instant Cloning features.
This environment uses integrated servers, storage systems, and network with storage software in a unified compute converged solution for VDI environment.
The dedicated Unified Compute Platform HC V240F nodes run VMware ESXi 6.0 U2 with VMware vSAN 6.0 clusters using VMware Horizon View 7.
This VDI environment solution uses Microsoft Windows 10 virtual desktops and Microsoft Windows Server® 2012 R2 RDSH remote sessions.
Performance validation for this this solution used the following Login VSI 4.1.15 as a benchmarking tool.
This document is for the following audiences:
Corporate desktop administrators
Storage administrators
IT help desk
IT professionals
Chief information officer
To use this reference architecture guide, you need familiarity with the following:
VMware Horizon View 7
Hitachi Unified Compute Platform HC V240F
Hyper-converged concept
VMware vSAN
All flash storage
Login VSI 4.1.15
Esxtop from VMware
VMware ESXi 6.0 U2
Microsoft Remote Desktop Session
1

2
Note — These practices were developed in a lab environment. Many things affect production environments beyond prediction or duplication in a lab environment. Follow recommended practice by conducting proof-of-concept testing for acceptable results before implementing this solution in your production environment. Test the implementation in a non-production, isolated test environment that otherwise matches your production environment.
Solution OverviewThis describes the solution overview for Horizon View 7 with AppVolumes and Instant Clone on Hitachi Unified Compute Platform HC V240F.
Legacy IT infrastructure is not well suited for VDI initiatives. Siloed data centers, composed of independent compute, storage, and networks with distinct administrative interfaces are inherently inefficient, cumbersome, and costly.
Each platform requires support, maintenance, licensing, power, and cooling—not to mention a set of dedicated resources capable of administrating and maintaining these elements. Rolling out a new application such as VDI is manually intensive, and time-consuming. It involves different technology platforms, management interfaces, and operations teams.
Expanding system capacity can take days or weeks, and require complex provisioning and administration. Troubleshooting problems and performing routine data backup, replication, and recovery tasks can be just as inefficient.
While grappling with this complexity, organizations also need to address challenges that are unique to VDI, including the following:
Difficulty sizing VDI workloads upfront, due to the randomness and unpredictability of user behavior
Periodic spikes in demand, such as login storms and boot storms, that may significantly degrade performance if not properly handled
High cost of downtime in the event of an outage
Hitachi Unified Compute Platform HC addresses each of these challenges by providing a scalable, building block style approach to deploying infrastructure for VDI. It offers predictable cost, delivering a high-performing desktop experience
User WorkloadsFor this solution, VDI performance has been captured for task, knowledge, and power users.
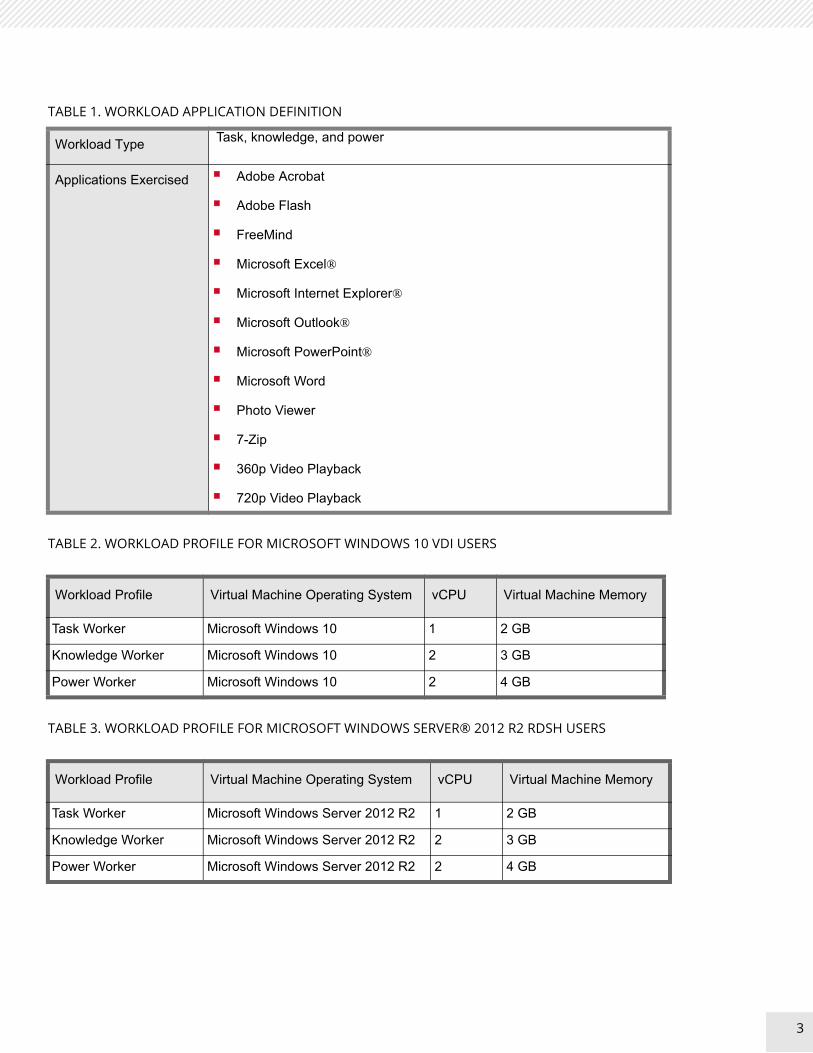
The workloads used for this solution are based on LoginVSI and extended the functionality of the LoginVSI base of the task, knowledge and power workload tests. Table 1, “Workload Application Definition,” on page 3 lists the applications that LoginVSI exercised during workload testing.
2
3
TABLE 1. WORKLOAD APPLICATION DEFINITION
Workload Type Task, knowledge, and power
Applications Exercised Adobe Acrobat
Adobe Flash
FreeMind
Microsoft Excel®
Microsoft Internet Explorer®
Microsoft Outlook®
Microsoft PowerPoint®
Microsoft Word
Photo Viewer
7-Zip
360p Video Playback
720p Video Playback
TABLE 2. WORKLOAD PROFILE FOR MICROSOFT WINDOWS 10 VDI USERS
Workload Profile Virtual Machine Operating System vCPU Virtual Machine Memory
Task Worker Microsoft Windows 10 1 2 GB
Knowledge Worker Microsoft Windows 10 2 3 GB
Power Worker Microsoft Windows 10 2 4 GB
TABLE 3. WORKLOAD PROFILE FOR MICROSOFT WINDOWS SERVER® 2012 R2 RDSH USERS
Workload Profile Virtual Machine Operating System vCPU Virtual Machine Memory
Task Worker Microsoft Windows Server 2012 R2 1 2 GB
Knowledge Worker Microsoft Windows Server 2012 R2 2 3 GB
Power Worker Microsoft Windows Server 2012 R2 2 4 GB
3
4
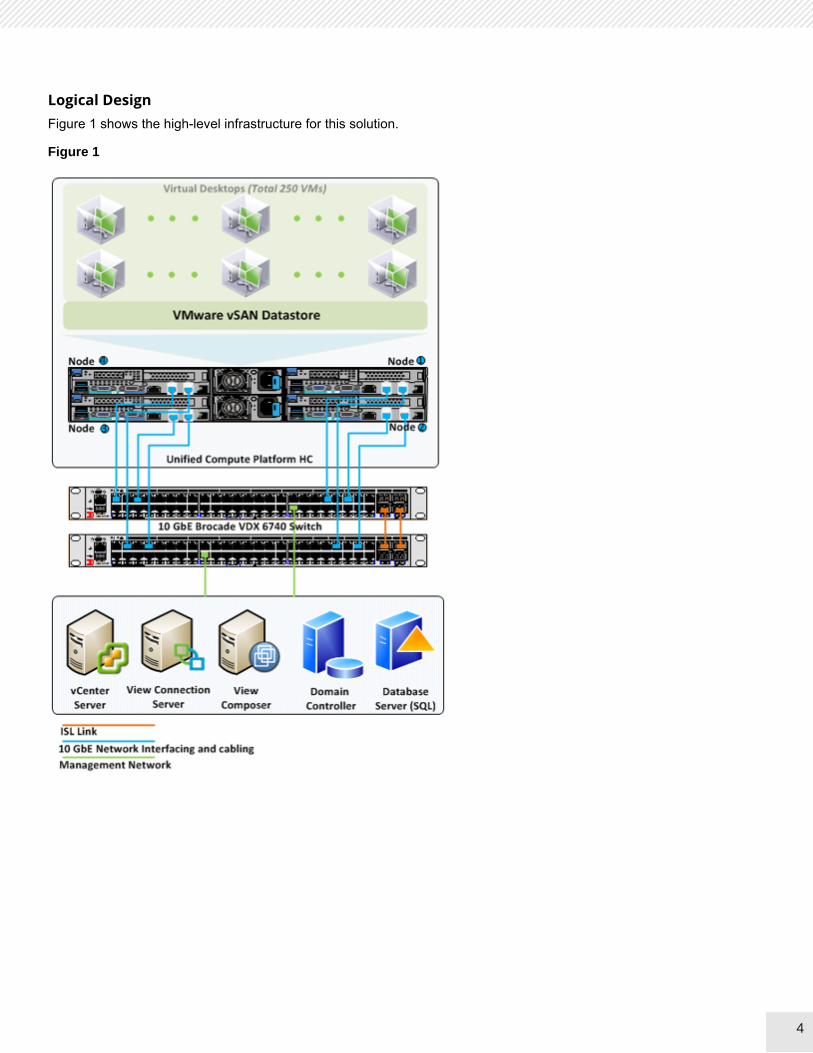
Logical DesignFigure 1 shows the high-level infrastructure for this solution.
Figure 1
4

5
Key Solution ComponentsThe key solution components are in Table 4, “Hardware Components,” on page 5, Table 5, “Software Components,” on page 5, and Table 6, “VMware Horizon View 7 Components,” on page 6.
TABLE 4. HARDWARE COMPONENTS
Hardware Detailed Description Version Quantity
Hitachi Unified Compute Platform HC V240F all-flash appliance
4-node chassis
Intel ® Xeon ® CPU E5-2680 v3 @2.50Ghz (per host )
2 × 10GbE NIC ports:
NIC options:
RJ-45 connections: Dual port 10GigE Base-T Intel X540 OCP Mezzanine card
SFP+ connections: Dual port 10GigE Intel 82599ES SFP+ OCP Mezzanine Card
1 × 10/100 Base-T RJ45 port for remote (out-of-band) management 1 × 800GB SSD for Cache Tier
2 fully redundant power supplies
LSI SAS 3008 RAID controller mezzanine card
Fault-tolerant Virtual SAN datastore
BIOS Firmware: S2S_3A18
BMC: 3.36.00
1
Brocade VDX6740 switch
10 GbE ports (at least 16 ports)
Top of rack switch
nos 7.0.0.a 2
TABLE 5. SOFTWARE COMPONENTS
Software Version Function
VMware vCenter server 6.0. U2 , Build 3634788 Management console
VMware ESXi 6.0. U2 , Build 3620759 Operating system
VMware vSphere Client 6.0. U2 , Build 3634788 Management console
Microsoft Windows Server 2012 Datacenter, R2 Operating system
5

6
Configure all virtual machines with LSI Logic SAS Controller. Deploy the domain controller to support user authentication and domain services for the VMware Horizon infrastructure.
Configure the compute nodes as follows:
Configure all four VMware ESXi 6.0 U2 nodes on a Hitachi Unified Compute Platform HC V240F cluster for task, knowledge, and power user desktops.
Place VMware Horizon management and administration components on a separate infrastructure cluster.
Hitachi Unified Compute Platform HCCombining compute, storage, and virtualization into a hyperconverged infrastructure, Hitachi Unified Compute Platform HC (UCP HC) answers challenges of growing demands of faster delivery of business services while facing rising costs managing disparate technology resources. Using VMware Virtual SAN with software from Hitachi Data Systems, this software-defined storage extends the agility and simplicity of the Hitachi Unified Compute Platform family.
Microsoft SQL Server 2012 SP1 Database server
Microsoft Windows 10 Enterprise Edition, SP1 Operating system
VMware Horizon View VMware Horizon View 7.0.0, Build 3634043
Management console
VMware Horizon Client 3.5.2, Build 3634043 Management console
TABLE 6. VMWARE HORIZON VIEW 7 COMPONENTS
Server Name vCPU Memory Disk Size Disk Type Operating System
View Connection Server 4 16 GB 40 GB Eager ZeroedThick
Windows Server 2012 R2
View Composer 4 12 GB 40 GB Eager ZeroedThick
Windows Server 2012 R2
Domain Controller 2 8 GB 40 GB Eager ZeroedThick
Windows Server 2012 R2
Database Server 4 16 GB 40 GB (operating system)
60 GB (data)
Eager ZeroedThick
Windows Server 2012 R2
Microsoft SQL Server 2014 SP1
TABLE 5. SOFTWARE COMPONENTS (CONTINUED)
Software Version Function
6
7
Unified Compute Platform HC provides a comprehensive dashboard to view a virtual machine. There are health monitors for CPU, memory, storage, and virtual machine usage for the all clusters, including individual appliances and individual nodes.
You need minimal IT experience to deploy, configure, and manage the Unified Compute Platform HC appliance. Leveraging VMware’s core products, your administrators can apply existing VMware knowledge, best practices, and processes.
VMware Horizon VMware Horizon transforms static desktops into secure, virtual workspaces that can be delivered on demand. Provision virtual or remote desktops and applications through a single VDI platform to streamline management and easily entitle end users.
Dynamically allocate resources with virtual storage, virtual compute and virtual networking to simplify management and drive down costs. With Horizon, reduce day-to-day operations costs with a single platform that allows you to extend virtualization from the data center to your devices.
VMware vSANSeamlessly extending virtualization to storage with an integrated hyper-converged solution that works with your overall VMware environment, VMware vSAN reduces the risk in digital transformation by using existing tools, skillsets, and solutions.
Built by VMware, enjoy the best integration with VMware vSphere features with vSAN. Discover the flexibility to expand with other VMware SDDC and multi-cloud offerings as your needs grow. Protect current storage infrastructure investments with the only hyperconverged infrastructure solution built on policy-based management that extends per-virtual machine policies and automated provisioning to modern SAN and NAS storage systems.
Brocade NetworkingBrocade and Hitachi Data Systems partner to deliver storage networking and data center solutions. These solutions reduce complexity and cost, as well as enable virtualization and cloud computing to increase business agility.
The solution using the following Brocade products:
Brocade VDX6740 switch
Solution DesignPlace the infrastructure servers for VMware Horizon 7 and Hitachi Unified Compute Platform HC V240F used for this solution on separate infrastructure clusters with dedicated resources.
Storage Infrastructure The SAN architecture for this reference architecture is not a requirement. Hitachi Unified Compute Platform HC V240F is used with VMware vSAN, which has local drive clustering.
Deploy VMware Horizon Virtual MachinesVMware Horizon is the virtual desktop host platform for VMware vSphere. This offers advantages for end users and IT staff.
End users are not locked into a particular machine.
End users can access their system and files from anywhere at any time.
Horizon View simplifies and automates desktop and application management.
7
8
To install and configure the following core Horizon View components, do the following.
1. Install View Connection Server
The most important VMware View component is the View Connection server. This server is a connection broker, responsible for authenticating clients and connecting them to the appropriate virtual desktop.
2. Install View Administrator
View Administrator, or management console, is a web component for deploying and managing virtual desktops.
3. Install View Client
View Client establishes a connection from physical devices to a View Connection server.
Install View client on the user's devices, such as thin clients, zero clients, mobile devices, laptops, desktops, or any other supported devices.
4. Install View agent
View agent is the application installed on virtual desktops that allows VMware View to manage access from clients.
5. Install View Composer (Optional)
View composer is an optional application. However, it is necessary to manage all of the operations associated with linked clones, such as pool creation, refresh, recompose, and rebalance.
Deploy Master Image for the Microsoft Windows 10 Virtual DesktopTo create a master image for a Microsoft Windows 10 desktop, do the following.
1. Prepare the virtual machine desktop.
(1) Create a virtual machine.
(2) Install the Microsoft Windows 10 operating system on the virtual machine.
(3) Configure the Microsoft Windows operating system on the virtual machine.
(4) Run VMware optimizer for Microsoft Windows 10.
(5) Install VMware Tools.
(6) Install View Agent.
2. Shut down the virtual machine.
3. Take a snapshot of the virtual machine.
Deploy the Automated Desktop Pool for Microsoft Windows 10 Instant ClonesTo provision the Microsoft Windows 10 instant clones for power, knowledge and task users, do the following.
1. From View Administrator, click Select and add View Connection Server, and then click Add vCenter to View Administrator.
2. Create a new desktop pool using the Automated Desktop pool option for Instant clone.
3. you're your desktop pool following the naming pattern. For example, use Power-Pool.
4. To create three different pools, select the Microsoft Windows 10 snapshot for power, knowledge and task users.
5. Select storage option as Unified Compute Platform HC V240F vSAN Datastaore to deploy instant clones.
8
9
Prepare the Host for Microsoft Windows Server 2012 R2 RDSTo prepare the host for Microsoft Windows Server 2012 R2 RDS, do the following.
1. Create a virtual machine.
2. Prepare the operating system on the virtual machine.
(1) Install the Microsoft Windows 2012 R2 operating system.
(2) Configure the operating system.
(3) Enable the High Performance Power option.
(4) Run VMware OS Optimization Tool for Windows Server 2012 R2.
3. Prepare Microsoft .NET Framework 4 on the virtual machine.
(1) Install Microsoft .NET 4 software.
(2) Disable the event tracker shutdown.
i. From the Start menu, type the following in the Search text box: gpedit.msc
The Group Policy Editor (gpedit) is in the application search results.
ii. To open the Group Policy Editor window, double-click gpedit.
iii. In the left pane, under Local Computer Policy, expand Administrative Templates and then click System.
iv. In the right pane, double-click Display Shutdown Event Tracker. The Display Shutdown Event Tracker dialog box opens.
v. Click the Disabled option and close the window.
Keep the Group Policy Editor open.
(3) Disable the server manager.
i. In the Group Policy Editor, with System clicked, double-click Server manager. The Do not display Server Manager automatically at logon dialog box opens.
ii. Click the Enabled option and close the window.
iii. Close the Group Policy Editor
4. Install VMware tool.
5. Install Microsoft Office 2013 Key Management Service (KMS) host.
6. Install VMware View Agent for VMware View Horizon Automated Farm.
7. Shut down the virtual machine for the server.
8. Take a snapshot the virtual machine for the server.
Deploy RDS Farm — Automated Linked Clones This solution uses VMware View Composer. SysPrep requires a customization specification in VMware vCenter because QuickPrep is not supported with RDS farms.
Use the Customization Specification Manager to prepare Microsoft Windows SysPrep.
9

10
To create an automated farm of linked clones, do the following.
1. From the home page in VMware vCenter, click Customization Specification Manager.
2. Make sure your RDS View Agents have the VMware Horizon View Composer Agent feature installed.
3. In View Administrator, on the left, expand Resources and click Farms.
4. Create a new farm.
(1) On the right, click Add. A wizard opens.
(2) On the Type page, click Automated Farm and click Next.
(3) On the vCenter Server page, click vCenter Server and View Composer and click Next.
(4) On the Identification and Settings page, type a name for the farm. This creates a folder with the same name in VMware vCenter.
(5) For Allow users to choose protocol, click No.
(6) Make timeout settings.
i. For Empty session timeout, set it to 1 minute.
ii. For When timeout occurs, click Log off. You usually want the session to end when users close all applications.
iii. For Log off disconnected sessions, specify a disconnect timer. This is in addition to the idle timer configured in Global Settings in View Configuration.
iv. Select the Allow HTML Access check box and click Next.
(7) Make the provisioning settings.
i. On the Provisioning Settings page, enter a naming pattern. Make sure that the name includes the following: {n:fixed=3}
This solution uses three RDS hosts: Power, Knowledge, and Task Users.
ii. Type the number of machines to create and click Next.
(8) On the Storage Optimization page, click Next.
(9) Make the VMware vCenter settings.
i. On the vCenter Settings page, click Browse. Then, select which options to use.
ii. For the datastore, select Unified Compute Platform HC vSAN.
iii. Select a customization specification and then click Next.
(10) On the Ready to Complete page, click Finish.
5. Prepare automated desktop pools by using the RDS hosts created in the previous step, naming these pools Power, Knowledge, and Task.
10

11
Engineering ValidationThis explains how the environment was validated and what the results were.
Test MethodologyThis is how the environment was validated.
LoginVSI Test Run for Microsoft Windows 10 VDI and RDS Pool
Testing was performed using LoginVSI.
The following was launched and configureed using the Management Console in LoginVSI:
1. Run task workload profile for VDI pool name Task Pool with 62 sessions.
2. Run knowledge workload profile for VDI pool name Knowledge pool with 63 sessions.
3. . Run power workload profile for VDI pool name Power pool with 125 sessions.
These test runs were executed for all three workload profiles with the following configuration:
1. Start the tests with 10 launchers on the target desktop pool with the required number of sessions for each test.
2. Allow the tests to run for 2880 seconds (48 minutes) and then take 2 minutes for logging off all sessions for each of the tests.
3. Collect and check the LoginVSI logs for each of the tests.
Test Objectives
The series of tests that were run for this reference architecture are designed to capture the performance and data reduction capabilities of Hitachi Unified Compute Platform HC V240F for Microsoft Windows 10 VDI users and Windows Server 2012 RDS users.
There were two scenarios used to capture the performance results separately:
A Microsoft Windows 10 VDI pool of 250 virtual machines was deployed and the results were captured.
Later this pool was erased and the Unified Compute Platform HC V240F vSAN cluster was recreated to deploy a new RDS pool of 250 virtual machines to capture those performance results separately.
Test Case 1: Deduplication and Compression Testing
The deduplication and compression testing highlights the data footprint reduction available with real-world data.
Test Case 2: Boot Storm Testing
Boot storms occur when all virtual desktops power on simultaneously. The boot storm puts a heavy load on the storage system because all of the virtual desktops are competing for the shared storage resources.
During boot storm testing, all 250 virtual desktops were powered on directly from VMware vCenter to show overall response of the system simulating a worst-case power on scenario after a data center power outage.
Configuration 1 — 250 Microsoft Windows 10 virtual desktops were powered on.
Configuration 2 — 250 Microsoft Windows Server 2012 R2 RDS machines were powered on.
11

12
Test Case 3: Login Storm, Steady State, and Logoff Testing
Login storms occur when a large number of users log in to the virtual desktops at the same time. Unlike boot storms, login storms cannot be avoided in an environment where end users start work at the same time.
Steady state occurs when users interact with the desktop. The IOPS for steady state varies because user activities differ. Login VSI medium workload was used to measure the IOPS during steady state.
LoginVSI enabled testing of login storms, and generated the workload for the steady state lab validation testing.
Configuration 1 — 250 Microsoft Windows 10 virtual desktops were under three workload profiles, task, knowledge, and power, for 2880 minutes with each profile using LoginVSI.
Configuration 2 — 250 Microsoft Windows Server 2012 R2 RDS machines were under three workload profiles, task, knowledge, and power, for 2880 minutes with each profile using LoginVSI.
Test ResultsThese are the test results following the defined methodology.
Deduplication and Compression
Figure 2 on page 12 and Figure 3 on page 13 show the test results before and after deduplication and compression for 250 virtual desktops.
Figure 2
This is an overview for deduplication and compression testing.
In Figure 2, deduplication and compression is enabled for vSAN clusters before deployment of the VDI and RDS pools.
Deduplication and compression overview is shows the following:
Before compression and deduplication, the storage size was 3.23 TB.
After deduplication and compression, the size was reduced to 789.16 GB.
The savings is 2.46 TB, with a ratio of 4.19 times.
12

13
Figure 3
Figure 3 was used to calculate the capacity breakdown before it was deduplicated and compressed. Similar test results have been observed for 250 RDS virtual machines.
Boot Storm
These are the test results for the environment operating during a boot storm. The 250 users boot storm took five minutes eighty seconds to complete. This time was measured from when the Microsoft Windows 10 desktops were flagged available in VMware Horizon View Administrator.
Multiple performance metrics were collected using the esxtop command. Figure 4 on page 14, Figure 5 on page 15, and Figure 6 on page 16 show the performance data for the 250-user boot storm.
13

14
Figure 4
The performance metrics show the following:
Percent utilization peaks at approximately 78% during boot storm.
Hypervisor Memory Performance
Four vSAN cluster nodes were tested, each containing 262 GB of RAM. A 250 Microsoft Windows 10 user desktop pool was split between 4 nodes, allowing commitment of 2048 MB, 3072 GB, and 4096 MB RAM to task, knowledge, and power users respectively.
There were 62 task virtual machines with 2048 MB, 63 knowledge virtual machines with 3072 MB, and 125 power virtual machines with 4096 MB (126976 MB, 193536 MB, and 512000 MB respectively) total approximately 832512 MB (832 GB).
Figure 5 on page 15 shows memory utilization during a boot storm of 250 virtual machines.
14

15
Figure 5
The performance metrics show the following:
During a boot storm, shared virtual machine memory reached approximately100000 MB. This shows memory utilization during a boot storm can vary.
PSshare saving memory reached 50000 MB peaks during a boot storm.
Boot Storm IOPS
To simulate a boot storm, the 250 virtual desktops were powered on simultaneously from vCenter.
Figure 6 on page 16 shows the Hitachi Unified Compute Platform HC V240F storage (vSAN) characteristics during the boot storm, the all-flash storage, delivered 10,000 IOPS under the peak load during this test at an average of 6,000 IOPS per virtual machine.
15

16
Figure 6
vSAN Storage Performance
Figure 7 shows the storage latency statistics. The performance metrics show the following:
During boot storm, average read latency increases to 35ms
During boot storm, average write latency increases to 30ms
Figure 7
16

17
Login and Steady State
These are the test results for the environment operating during login storm and steady state operations.
Compute Infrastructure
Multiple performance metrics were collected from the VMware ESXi hypervisors during the test operations. Figure 8 on page 17 through Figure 12 on page 20 show the performance data for the 250 user test operations.
Hypervisor CPU Performance
Figure 8 shows the physical CPU metrics collected on the ESXi hypervisors while running test operations for 250 RDS users.
There are two operations that occur during this test executed by LoginVSI:
Login storm (minutes 1-48)
Steady state (minutes 48-50)
The performance metrics show the following:
Percent utilization peaks at approximately 72% during login storm.
Percent utilization peaks at approximately 63% during steady state.
This shows that there is still headroom on the Unified Compute Platform HC V240F vSAN to support bursts in workloads while still maintaining acceptable end user performance.
Figure 8
17
18
Hypervisor Memory Performance
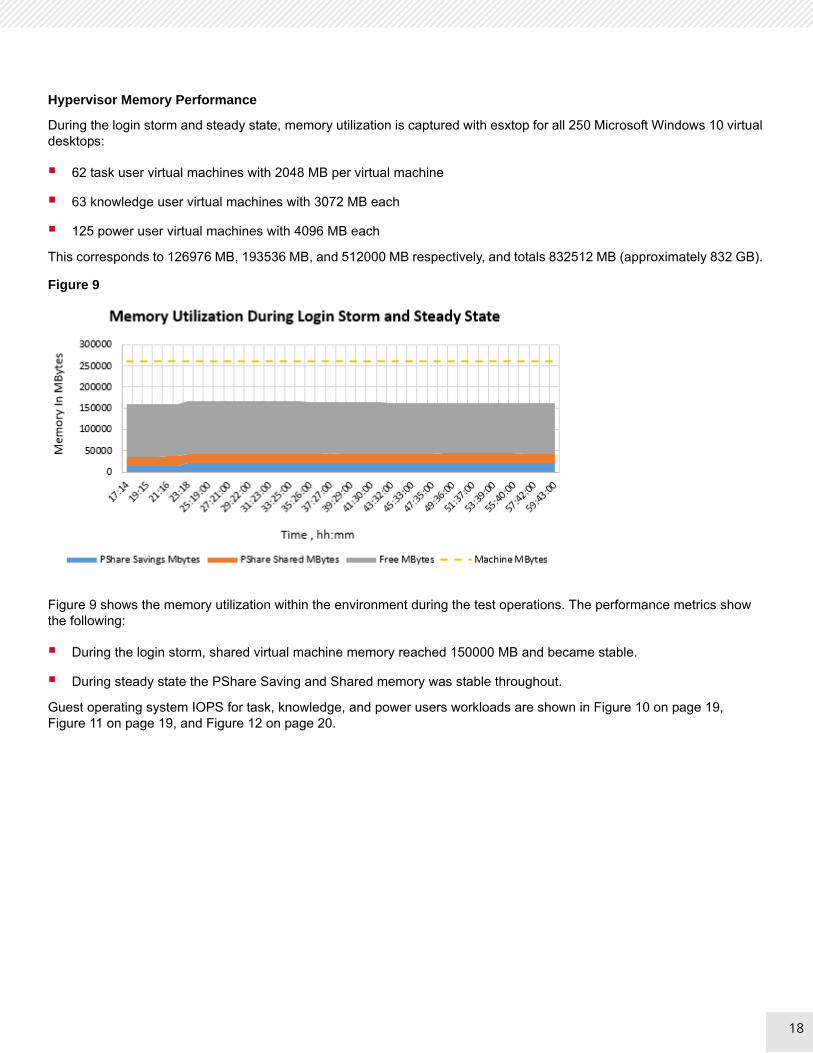
During the login storm and steady state, memory utilization is captured with esxtop for all 250 Microsoft Windows 10 virtual desktops:
62 task user virtual machines with 2048 MB per virtual machine
63 knowledge user virtual machines with 3072 MB each
125 power user virtual machines with 4096 MB each
This corresponds to 126976 MB, 193536 MB, and 512000 MB respectively, and totals 832512 MB (approximately 832 GB).
Figure 9
Figure 9 shows the memory utilization within the environment during the test operations. The performance metrics show the following:
During the login storm, shared virtual machine memory reached 150000 MB and became stable.
During steady state the PShare Saving and Shared memory was stable throughout.
Guest operating system IOPS for task, knowledge, and power users workloads are shown in Figure 10 on page 19, Figure 11 on page 19, and Figure 12 on page 20.
18
19
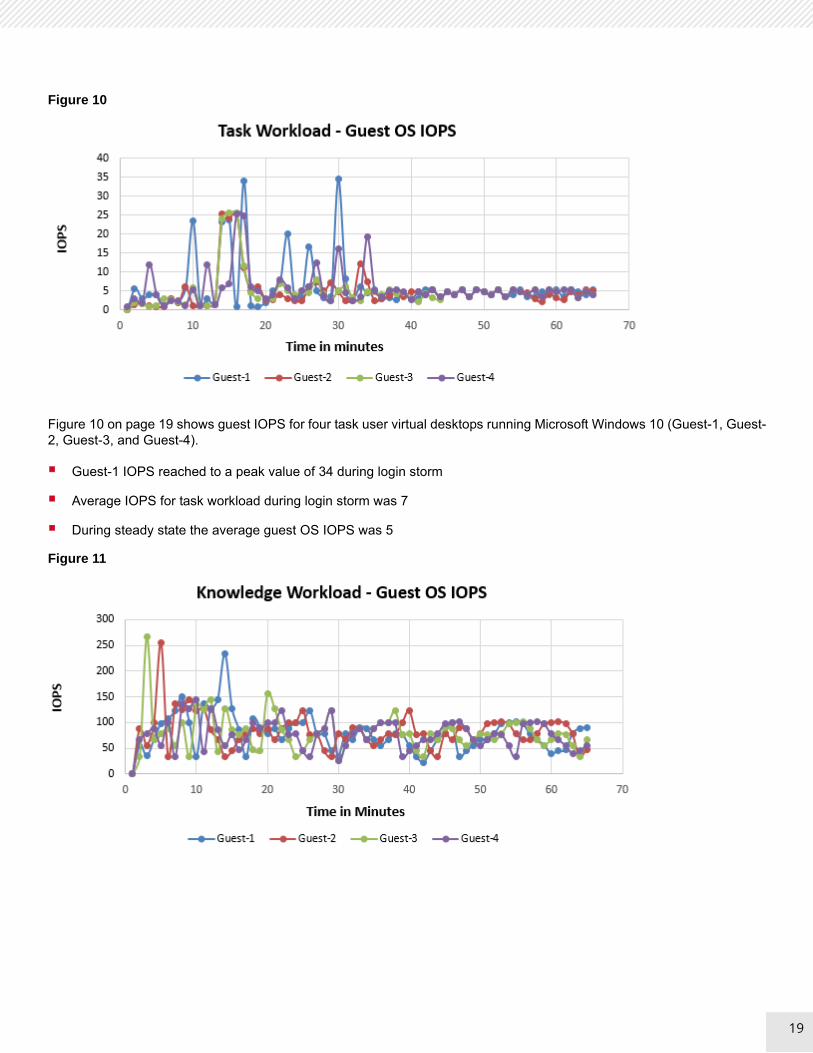
Figure 10
Figure 10 on page 19 shows guest IOPS for four task user virtual desktops running Microsoft Windows 10 (Guest-1, Guest-2, Guest-3, and Guest-4).
Guest-1 IOPS reached to a peak value of 34 during login storm
Average IOPS for task workload during login storm was 7
During steady state the average guest OS IOPS was 5
Figure 11
19
20
Figure 11 shows guest IOPS for four knowledge worker virtual desktops running Microsoft Windows 10 (Guest-1, Guest-2, Guest-3, and Guest-4).
Guest-3 IOPS reached to a peak value of 267 during login storm
Average IOPS for task workload during login storm was 89
During steady state the average guest OS IOPS was 78
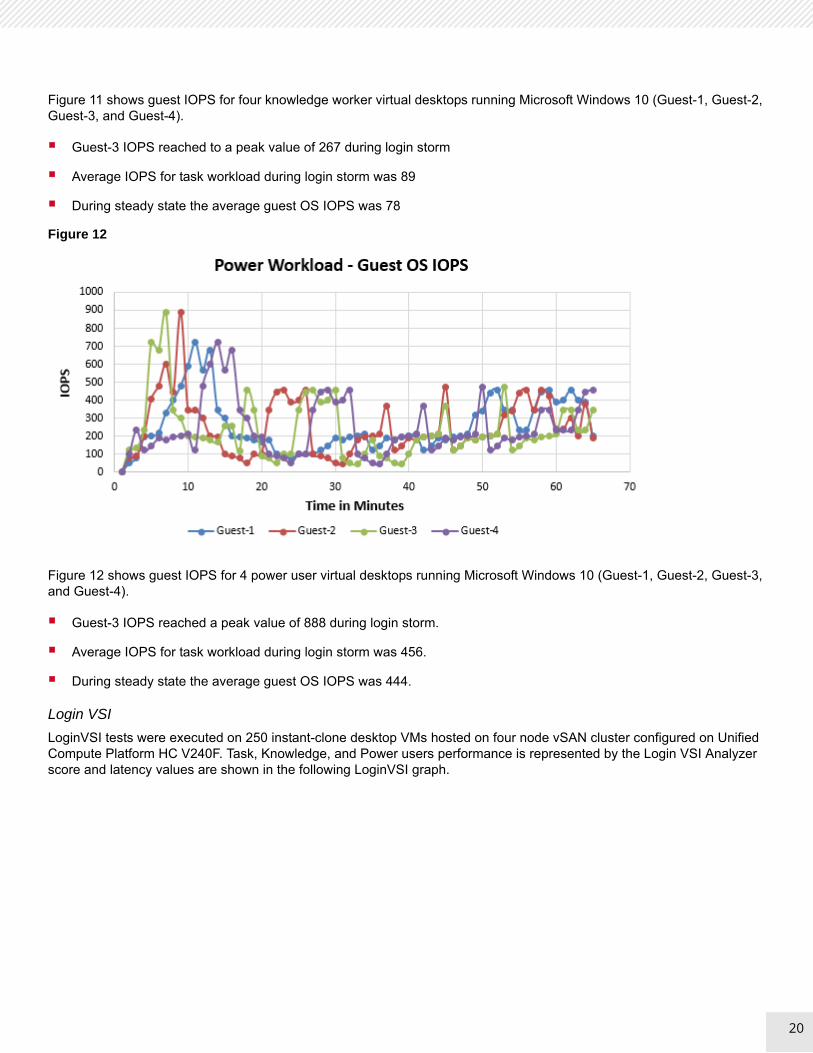
Figure 12
Figure 12 shows guest IOPS for 4 power user virtual desktops running Microsoft Windows 10 (Guest-1, Guest-2, Guest-3, and Guest-4).
Guest-3 IOPS reached a peak value of 888 during login storm.
Average IOPS for task workload during login storm was 456.
During steady state the average guest OS IOPS was 444.
Login VSI
LoginVSI tests were executed on 250 instant-clone desktop VMs hosted on four node vSAN cluster configured on Unified Compute Platform HC V240F. Task, Knowledge, and Power users performance is represented by the Login VSI Analyzer score and latency values are shown in the following LoginVSI graph.
20

21
LoginVSI Response -Task Worker Workload
Figure 13
Figure 13 shows the task user workload results using Login VSI:
VSI baseline performance was 1528.
The Login VSI index average score is 645 lower than the threshold. It is possible to launch more sessions in this configuration.
61 sessions ran successfully out of 62. The VSImax was not reached.
21
22
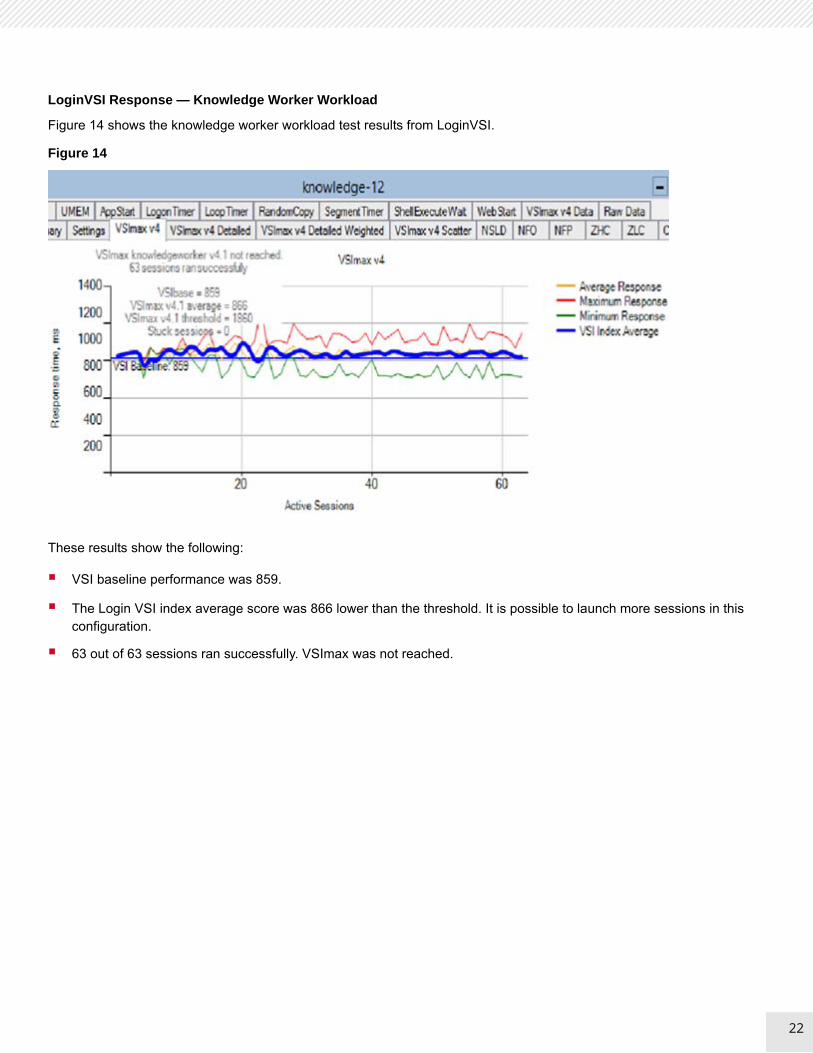
LoginVSI Response — Knowledge Worker Workload
Figure 14 shows the knowledge worker workload test results from LoginVSI.
Figure 14
These results show the following:
VSI baseline performance was 859.
The Login VSI index average score was 866 lower than the threshold. It is possible to launch more sessions in this configuration.
63 out of 63 sessions ran successfully. VSImax was not reached.
22
23
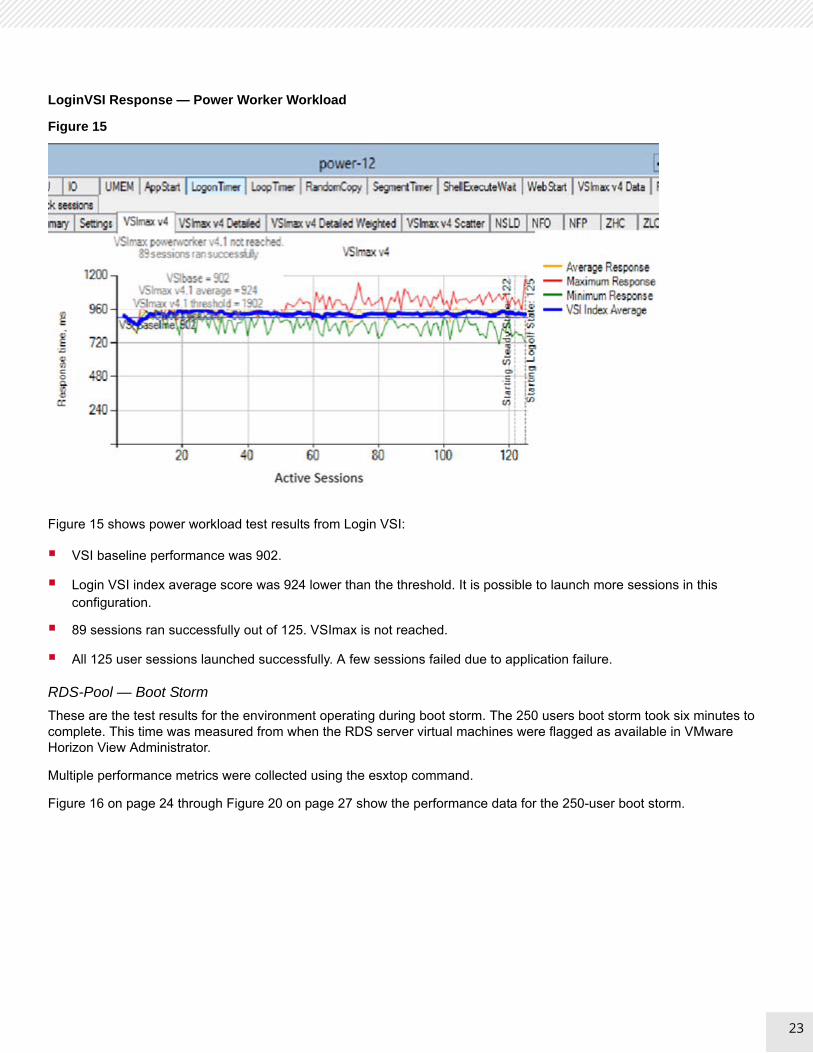
LoginVSI Response — Power Worker Workload
Figure 15
Figure 15 shows power workload test results from Login VSI:
VSI baseline performance was 902.
Login VSI index average score was 924 lower than the threshold. It is possible to launch more sessions in this configuration.
89 sessions ran successfully out of 125. VSImax is not reached.
All 125 user sessions launched successfully. A few sessions failed due to application failure.
RDS-Pool — Boot Storm
These are the test results for the environment operating during boot storm. The 250 users boot storm took six minutes to complete. This time was measured from when the RDS server virtual machines were flagged as available in VMware Horizon View Administrator.
Multiple performance metrics were collected using the esxtop command.
Figure 16 on page 24 through Figure 20 on page 27 show the performance data for the 250-user boot storm.
23

24
Hypervisor CPU Performance during Boot Storm
Figure 19 shows the physical CPU metrics collected on the VMware ESXi hypervisors while powering on 250 users.
Figure 16
The performance metrics show the following:
Percent utilization peaks at approximately 86% during boot storm.
Hypervisor Memory Performance
The four vSAN cluster nodes were tested, each containing 262 GB of RAM. 250 virtual machines running Microsoft Windows Server 2012 R2 were deployed on the four nodes, allowing a commitment of 2048 MB, 3072 GB, and 4096 MB RAM to task, knowledge, and power users respectively. This results in the following:
62 task virtual machines with 2048 MB per virtual machine
63 knowledge virtual machines with 3072 MB each
125 power virtual machines with 4096 MB each
24

25
This is 126976 MB, 193536 MB, and 512000 MB respectively, and equals 832512 MB (approximately 832 GB).
Figure 17
Figure 17 shows the memory utilization within the environment during the test operations. The performance metrics show the following:
During boot storm, shared virtual machine memory reached approximately 140000 MB and slightly reduced until it was flagged as available in VMware Horizon View Administrator. This shows the true randomness of the boot storm.
PSshare saving memory peaked at 40000 MB during boot storm and reduced slightly at the end of the boot storm.
Boot Storm IOPS
To simulate a boot storm, the 250 virtual desktops were powered on simultaneously from VMware vCenter. Figure 18 on page 26 shows the Hitachi Unified Compute Platform HC storage (vSAN) characteristics during the boot storm. The all flash Unified Compute Platform HC delivered 13,000 IOPS under peak load during this test at an average of 5678 IOPS per virtual machine.
25

26
Figure 18 shows IOPS during a boot storm.
Figure 18
vSAN Storage Performance
Figure 19
Figure 19 shows the storage latency statistics. The performance metrics show the following:
During a boot storm, the average read latency rises 35 ms.
During a boot storm, the average write latency rises 30 ms.
RDS-Pool — Login and Steady State
These are the test results for the environment operating during login storm, steady state operations.
26

27
Hypervisor CPU Performance
Figure 20 shows the physical CPU metrics collected on the VMware ESXi hypervisors while running the 250 RDS users test operations.
The following operations occur during this test that is executed by LoginVSI:
Login storm (minutes 1-48)
Steady state (minutes 48-50)
The performance metrics show the following:
Percent utilization peaks at approximately 66% during login storm.
Percent utilization peaks at approximately 73% during steady state.
This shows that there is still headroom on the Hitachi Unified Compute Platform HC vSAN to support bursts in workloads while still maintaining acceptable end user performance.
Figure 20
Hypervisor Memory Performance
Memory utilization during a login storm is almost stable. Free memory during a login storm is 100 GB for each of the hosts.
27

28
Figure 21 shows memory utilization during a boot storm of 250 virtual desktops.
Figure 21
Figure 22
Figure 22 shows guest IOPS for four Microsoft Windows 10 task virtual desktops (Guest-1, Guest-2, Guest-3, and Guest-4).
Guest-1 IOPS reached a peak value of 34 during login storm.
Average IOPS for task workload during login storm was 7.
28
29
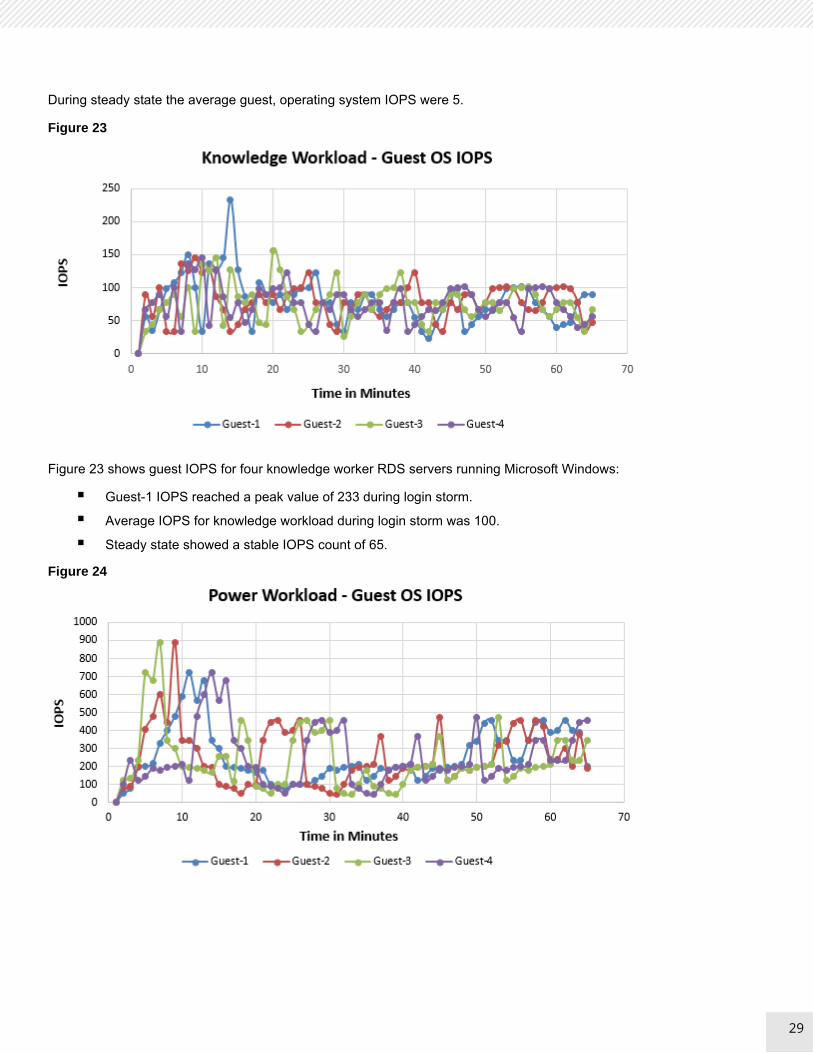
During steady state the average guest, operating system IOPS were 5.
Figure 23
Figure 23 shows guest IOPS for four knowledge worker RDS servers running Microsoft Windows:
Guest-1 IOPS reached a peak value of 233 during login storm.
Average IOPS for knowledge workload during login storm was 100.
Steady state showed a stable IOPS count of 65.
Figure 24
29

30
Figure 24 shows guest IOPS for 4 knowledge RDS servers running Microsoft Windows:
Guest-1 IOPS reached a peak value of 233 during login storm.
Average IOPS for knowledge workload during login storm was 100.
Steady state showed a stable IOPS count of 65.
RDS — LoginVSI
These are the LoginVSI results for the RDS servers.
RDS-LoginVSI Response — Task Worker Workload
Figure 25
Figure 25 shows task workload Login VSI test results:
VSI baseline performance was 899.
Login VSI index average score is 962 lower than the threshold. It is possible to launch more sessions in this configuration.
53 sessions ran successfully out of 62. The VSImax was not reached.
All 62 user sessions launched successfully. A few sessions failed due to application failure.
30
31
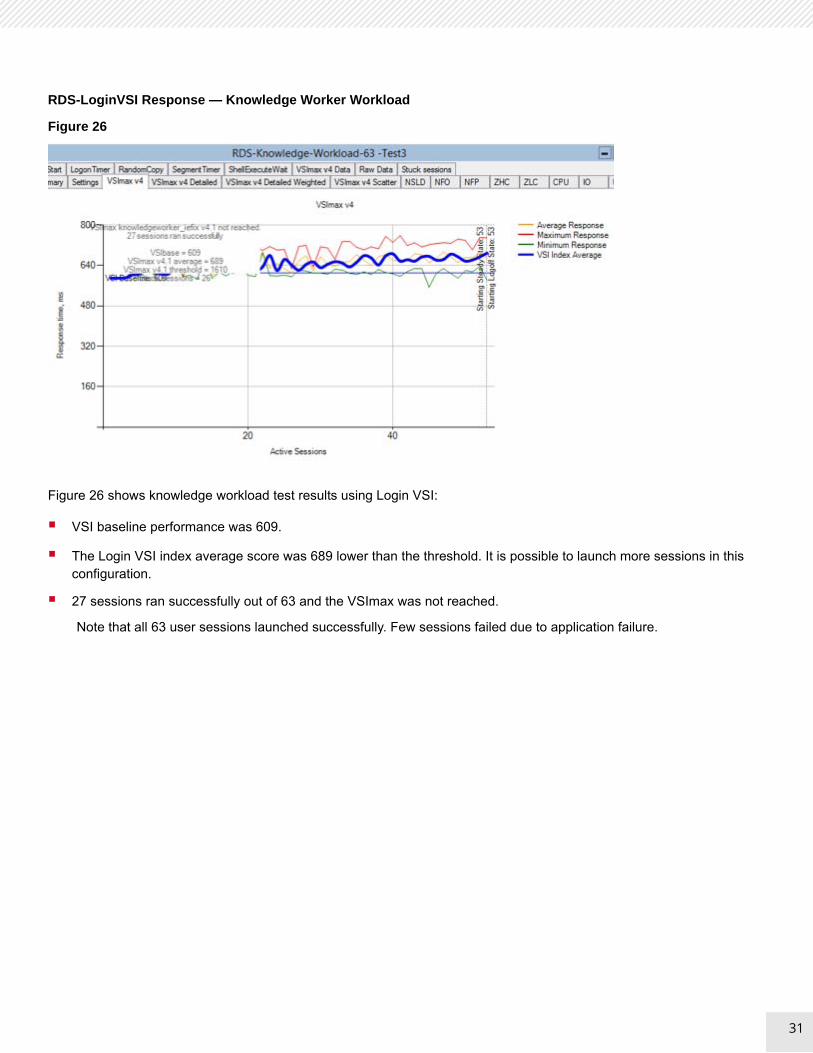
RDS-LoginVSI Response — Knowledge Worker Workload
Figure 26
Figure 26 shows knowledge workload test results using Login VSI:
VSI baseline performance was 609.
The Login VSI index average score was 689 lower than the threshold. It is possible to launch more sessions in this configuration.
27 sessions ran successfully out of 63 and the VSImax was not reached.
Note that all 63 user sessions launched successfully. Few sessions failed due to application failure.
31

32
RDS-LoginVSI Response -Power Worker Workload
Figure 27
Figure 27 shows the power workload test results for Login VSI:
VSI baseline performance was 635.
The Login VSI index average score was 793 lower than the threshold. It is possible to launch more sessions in this configuration.
48 sessions ran successfully out of 125 and the VSImax was not reached.
125 user sessions launched successfully. Few sessions failed due to application failure.
ConclusionIf you are looking to VDI solutions like VMware Horizon to reduce software licensing, distribution, and administration expenses, and to improve security and compliance. the market-leading hyperconverged Hitachi Unified Compute Platform HC delivers the promised benefits of VDI while overcoming many common challenges.
Unified Compute Platform HC for VDI provides the following:
Simplify a hyperconverged infrastructure deployment.
Ability to start small and scale out in affordable increments, from pilot to production.
Have the highest density of desktops per node in the hyperconverged infrastructure category.
Unmatched VDI performance for a superb end user experience that was independently validated.
Deploy full-clone desktops with the same data efficiency as linked clones.
Use enterprise-class data protection and resiliency.
32
For More InformationHitachi Vantara Global Services offers experienced storage consultants, proven methodologies and a comprehensive services portfolio to assist you in implementing Hitachi products and solutions in your environment. For more information, see the Services website.
Demonstrations and other resources are available for many Hitachi products. To schedule a live demonstration, contact a sales representative or partner. To view on-line informational resources, see the Resources website.
Hitachi Academy is your education destination to acquire valuable knowledge and skills on Hitachi products and solutions. Our Hitachi Certified Professional program establishes your credibility and increases your value in the IT marketplace. For more information, see the Hitachi Vantana Training and Certification website.
For more information about Hitachi products and services, contact your sales representative, partner, or visit the Hitachi Vantara website.

1
Corporate Headquarters2845 Lafayette StreetSanta Clara, CA 96050-2639 USAwww.HitachiVantara.com | community.HitachiVantara.com
Regional Contact InformationAmericas: +1 408 970 1000 or [email protected], Middle East and Africa: +44 (0) 1753 618000 or [email protected] Pacific: +852 3189 7900 or [email protected]
Hitachi Vantara
© Hitachi Vantara Corporation, 2018. All rights reserved. HITACHI is a trademark or registered trademark of Hitachi, Ltd. VSP is a trademark or registered trademark of Hitachi Vantara Corporation. Microsoft, RDS, Windows, and Windows Server are trademarks or registered trademarks of Microsoft Corporation. All other trademarks, service marks, and company names are properties of their respective owners.
Notice: This document is for informational purposes only, and does not set forth any warranty, expressed or implied, concerning any equipment or service offered or to be offered by Hitachi Vantara.
MK-SL-035-00, February 2018