Embed Size (px)
Citation preview

VMware Horizon 6.0 with View Reference Architecture
V1.0 – August 2014

2
VMware Horizon 6.0 with View | 2
Copyright 2014 Nutanix, Inc.
All rights reserved. This product is protected by U.S. and international copyright and intellectual property laws.
Nutanix is a trademark of Nutanix, Inc. in the United States and/or other jurisdictions. All other marks and names mentioned herein may be trademarks of their respective companies.

3
VMware Horizon 6.0 with View | 3
Table of Contents 1. Executive Summary .......................................................................................................... 4
2. Audience and Purpose ..................................................................................................... 5
3. Solution Overview ............................................................................................................. 6 Web-scale Powering Desktops on Demand .................................................................... 6 Nutanix Architecture ................................................................................................................. 7 Better together: Nutanix and VMware ............................................................................. 10 VMware Horizon 6.0 with View ........................................................................................... 12
4. Solution Design ................................................................................................................. 13 Desktop & RDS Sizing ............................................................................................................ 16 Desktop and RDS Optimizations ......................................................................................... 17 Horizon View Composer ......................................................................................................... 18 View Composer with Shadow Clones and VCAI .......................................................... 19 Shadow Clones .......................................................................................................................... 19 Nutanix Support for View Composer API for Array Integration ........................... 20 Nutanix Web-scale Converged Infrastructure ............................................................... 21 Network ........................................................................................................................................ 21 Logical Network Design ........................................................................................................ 22
5. Validation and Benchmarking .................................................................................... 24 Nutanix Configuration ........................................................................................................... 24 Login VSI Benchmark ............................................................................................................ 26
6. Validation Results ........................................................................................................... 30 View Composer with VCAI for a 4-node NX-3060 (NX-3460) ............................ 30 View Composer with VCAI for a 4-node NX-3060 (NX-3460+NX-3260) ........ 32 View Composer with VCAI with 8-nodes NX-3060 (2x NX-3460) ..................... 34 Linear Scale ................................................................................................................................ 37 Boot Storm ................................................................................................................................. 37 High Availability and Continuity ......................................................................................... 38 Remote Desktop Services on NX-3460 (4-nodes) .................................................... 39
7. Solution Application ...................................................................................................... 42 Scenario: 12 Nodes .................................................................................................................. 42 Scenario: 24 Nodes ................................................................................................................. 44
8. Conclusion ......................................................................................................................... 47
9. Appendix: Configuration .............................................................................................. 48
10. References ....................................................................................................................... 49 Table of Figures ....................................................................................................................... 49 Table of Tables ......................................................................................................................... 50
11. About the Authors ....................................................................................................... 52

4
VMware Horizon 6.0 with View | 4
1. Executive Summary
This validated reference architecture document highlights the use of Nutanix web-scale converged infrastructure to seamlessly scale and deliver consistent robust performance for VMware Horizon 6 (with View). Nutanix is able to eliminate bottlenecks and deliver both desktops and RDS (Remote Desktops Services) across many nodes to meet small or large business requirements. This paper demonstrates scaling from 4 to 6 to 8 nodes.
The following table provides highlights of the testing results:
Linear scaling with over 110 medium (2 vCPU) workload desktops per node—supports 440 users in 2U, inclusive of compute and storage.
Room to grow -- VSImax was not reached at 886 users with 8 Nutanix nodes
Consistent desktop performance at any scale
Only 6 minutes to boot over 880 desktops
Zero downtime during loss of storage controller
View Composer Array Integration for fast non-impacting cloning
Clone large 100+ GB RDS servers in 8 seconds

5
VMware Horizon 6.0 with View | 5
2. Audience and Purpose This reference architecture document is part of the Nutanix Solutions Library. It is intended for architects and systems engineers responsible for designing, managing, and supporting Nutanix infrastructures running VMware Horizon with View. Consumers of this document should already be familiar with vSphere, Horizon with View, and Nutanix.
This document will cover the following subject areas:
o Overview of the Nutanix solution
o Overview of VMware Horizon with View and its use cases
o The benefits of VMware Horizon with View on Nutanix
o Architecting a complete VMware Horizon with View on the Nutanix platform
o Sizing guidance for scaling VMware Horizon with View deployments on Nutanix
o Design and configuration considerations when architecting a VMware Horizon with View solution on Nutanix
o Benchmarking VMware Horizon with View performance on Nutanix using both Windows 7 for VDI and Windows 2012 R2 for Remote Desktop Services (RDS)

6
VMware Horizon 6.0 with View | 6
3. Solution Overview
Web-scale Powering Desktops on Demand
Nutanix delivers an out-of-the-box infrastructure solution for virtual desktops that eliminates the high cost, variable performance, and extensive risk of conventional solutions. The Nutanix web-scale converged infrastructure is a turnkey solution that comes ready to run VMware Horizon View. The Nutanix platform’s unique architecture allows enterprises to scale their virtual desktops from 50 to tens of thousands of desktops in a linear fashion, providing customers with a simple path to enterprise deployment with the agility of public cloud providers.
Figure 1 Web-scale properties of Nutanix
The Nutanix platform supports every type of VDI user, from task and knowledge workers to power and data scientists. Whether you have persistent desktops that are customized for knowledge workers, shared hosted virtual desktops (HVD) for a general workforce, or the most 3D graphics intensive users, Nutanix provides the right resources in a single-box solution.

7
VMware Horizon 6.0 with View | 7
Nutanix Architecture
The Nutanix web-scale converged infrastructure is a scale-out cluster of high-performance nodes (or servers), each running a standard hypervisor and containing processors, memory, and local storage (consisting of SSD Flash and high capacity SATA disk drives). Each node runs virtual machines just like a standard virtual machine host.
Figure 2 Nutanix Node Architecture
In addition, local storage from all nodes is virtualized into a unified pool by the Nutanix Distributed File System (NDFS). In effect, NDFS acts like an advanced NAS that uses local SSDs and disks from all nodes to store virtual machine data. Virtual machines running on the cluster write data to NDFS as if they were writing to shared storage.
Figure 3 Nutanix Architecture

8
VMware Horizon 6.0 with View | 8
NDFS understand the concept of a virtual machine and provides advanced data management features. It brings data closer to virtual machines by storing the data locally on the system, resulting in higher performance at a lower cost. Nutanix platforms can horizontally scale from as few as three nodes to a large number of nodes, enabling organizations to scale their infrastructure as their needs grow.
The Nutanix Elastic Deduplication Engine is a software-driven, massively scalable and intelligent data reduction technology. It increases the effective capacity in the disk tier, as well as the RAM and flash cache tiers of the system, by eliminating duplicate data. This substantially increases storage efficiency, while also improving performance due to larger effective cache capacity in RAM and flash. Deduplication is performed by each node individually in the cluster, allowing for efficient and uniform deduplication at scale. This technology is increasingly effective with full/persistent clones or P2V migrations.
Figure 4 Elastic Deduplication Engine
Nutanix Shadow Clones delivers distributed localized caching of virtual disks performance in multi-reader scenarios, such as desktop virtualization using VMware Horizon 6 using Linked Clones. With Shadow Clones, the CVM actively monitors virtual disk access trends. If there are requests originating from more than two remote CVMs, as well as the local CVM, and all of the requests are read I/O and the virtual disk will be marked as immutable. Once the disk has been marked immutable, the virtual disk is then cached locally by each CVM, so read operations are now satisfied locally by local storage.
NDFSNDFS
Only a single instance of the shared VM data is pulled into the cache upon read
StorageStorage
... VM NVM NVM 1VM 1
CacheCache
HypervisorHypervisor
Cache CVMCVM
Each node participates in, and performs, its own fingerprinting and deduplication
StorageStorage
... VM NVM NVM 1VM 1
CacheCache
HypervisorHypervisor
Cache CVMCVM
Sequential streams of data are fingerprinted at 4K granularity for efficient deduplication
StorageStorage
... VM NVM NVM 1VM 1
CacheCache
HypervisorHypervisor
Cache CVMCVM
...

9
VMware Horizon 6.0 with View | 9
Figure 5 Nutanix Shadow Clone Functionality
10
VMware Horizon 6.0 with View | 10
Better together: Nutanix and VMware
Benefits of the combined VMware and Nutanix solution include:
Simple, out-of-the-box deployment: Ready to deploy virtual desktops in under 60 minutes, managed from the virtualization console.
Linear scale out: Scale users seamlessly and modularly with no performance degradation. Data locality allows local caching of data to remain close to the workload and reduces congestion on the network. A control plane that spans all of the nodes ensures that resources are never stranded like flash and managed ineffectively.
Better than PC performance: NOS features, including inline-deduplication, eliminate IOPS resulting in fast application response and boot/login experience. Base images can be fingerprinted enabling the benefits of in-line deduplication with no overhead. The Nutanix platform provides up to 130,000 plus random read IOPS and over 78,000 random write IOPS up in a compact 2U 4-node cluster.
Lower costs: Lower infrastructure CAPEX than a PC and lower ongoing operating costs due to ease of use and small footprint.
Eliminate project risk: Start small and expand as warranted – always utilizing the latest advances in CPU, memory, and flash.
Business continuity: Built-in native replication and disaster recovery (DR) features enable highly available desktops to be deployed in mission-critical environments. Block awareness allows larger clusters to lose up to 4-nodes without using any additional capacity.
Enterprise-grade management : Nutanix Prism delivers a simplified and intuitive consumer-grade approach to managing large clusters, including a converged management tool that serves as a single pane for servers and storage, alert notifications, and provides the IPv6 bonjour mechanism to auto-detect new nodes in the cluster. It provides the ability to spend more time enhancing your environment, not maintaining it.
Prism Central allows control over multiple clusters, enabling true multi-tenancy and desktop as service. Prism Central allows the VMware Horizon Cloud Pod Architecture to be managed with ease and provides the ability to have physical separation and control over clusters in local or remote datacenters. Businesses can decide on a deployment plan that works best for them and their users.
VMware Integration: Support for View Composer Array Integration (VCAI), and vStorage APIs for Array Integration (VAAI). Due to Nutanix’s ability to cache to local RAM, the View Storage Accelerator doesn’t need to be used, saving deployment time and storage. In some use cases, Nutanix can remove the need for additional components, like View Composer, to due strong product integration.

11
VMware Horizon 6.0 with View | 11
Application Delivery: Nutanix provides space savings by using VMCaliber clones since Horizon View Composer does not support cloning RDS servers. The Controller Virtual Machine (CVM) running on each Nutanix Node provides rich data services to prevent the IO blender effect and provide limitless per-VM snapshots independent of the hypervisor to give peace of mind for mission-critical applications. Nutanix also provides per-VM monitoring with Cluster Health to prevent problems and ease troubleshooting.
Graphics acceleration: Platforms powered with K1 and K2 cards from Nvidia GRID and Teradici APEX power tough, graphics-intensive desktops.
The benefits of the Nutanix Platform are now exposed to scale out vSphere deployments:
Figure 6 Add one node at a time to meet your needs.

12
VMware Horizon 6.0 with View | 12
VMware Horizon 6.0 with View
Horizon with View allows organizations to deliver virtualized or remote desktops and applications through a single platform and support end users with access to all of their desktops and applications in one place.
Figure 7 Horizon with View, platform for end user computing.
Desktop virtualization with Horizon View enables organizations to do more with less and adopt a user-centric, flexible approach to computing. By decoupling applications, data, and operating systems from the endpoint—and by moving these components into the datacenter where they can be centrally managed in your cloud—desktop and application virtualization offers IT a more streamlined, secure way to manage users and provide agile, on-demand desktop services.

13
VMware Horizon 6.0 with View | 13
4. Solution Design With the Horizon View on Nutanix solution you have the flexibility to start small with a single block and scale up incrementally a node, a block, or multiple blocks at a time. This provides the best of both worlds–the ability to start small and grow to massive scale without any impact on performance.
The following section covers the design decisions and rationale for the Horizon View deployments on the Nutanix Virtual Computing Platform. View Composer linked clones where testing using
Table 1: Platform Design Decisions
Item Detail Rationale
General
Minimum Size 3 x Nutanix nodes (3 vSphere hosts) Minimum size requirement
Scale Approach Incremental modular scale
Allow for growth from PoC (hundreds of desktops) to massive scale (thousands of desktops)
Scale Unit Node(s), Block(s), or Pod(s) Granularly scale to precisely meet capacity demands
Scale in node increments
Blocks consisting of 2,000 user
Pods consisting of up to 10,000 users
Infrastructure Services Small deployments: Shared cluster
Large deployments: Dedicated cluster (Node A from 3 blocks or a 1350)
Dedicated infrastructure cluster for larger deployments (best practice)
vSphere
Cluster Size Up to 12-24 vSphere hosts (Minimum of 4 hosts)
Isolated fault domains
VMware best practice
Clusters per vCenter Up to 2x24 or 4x12 host clusters Task parallelization
Datastore(s) 1 x Nutanix datastore per pod (Horizon with View, SQL Server, VM clones, etc.)
(Max 2058 machines per container)
Nutanix handles I/O distribution/localization
n-Controller model
Nutanix
Cluster Size Up to 24-48-nodes Isolated fault domains
Storage Pool(s) 1 x Storage Pool per cluster Standard practice
ILM handles tiering

14
VMware Horizon 6.0 with View | 14
Container(s) 1 x Container for VMs
(Max 2058 machines per container)
Standard practice
High Availability limit Features/ Enhancements
Increase CVM Memory to 24-32GB+ (CVM was set to 32GB for the RA)
Best practice
Table 2: VMware Design Decisions
Item Detail Rationale Horizon View Infrastructure
Connection Brokers(s) Min: 2 (n+1) Scale: 1 per additional pod
HA for Connection Brokers
Users per Broker Up to 2,000 users Horizon View best practice
Load Balancing F5 or Load Balancer Ensures availability of controllers Balances load between brokers
Connection Brokers
Virtual Hardware Specs
vCPU: 4 Memory: 10 GB Disk: 60GB vDisk
Standard sizing practice
Connection Broker(s) per Pod
Up to 5 + 2 spare Based upon sizing considerations
Load Balancing F5 or other Load Balancer Ensures availability and balances load between controllers.
vCenter
vCenter Appliance 5.5.0.10100 Build 1750781
1appliance per 2000 VM’s Installed separately from vCenter
Task Parallelization
Virtual Hardware Specs
vCPU: 8 RAM: 12 GB
Resources for fast provisioning
Note: Due to the smaller environment one vCenter was shared between the management and desktop\RDS infrastructure. Larger environments should have separate vCenter systems for management and desktop clusters. View Composer Services
View Composer 1 per vCenter Installed separately from vCenter
Best Practice
Virtual Hardware Specs
vCPU: 2 RAML 4 GB
Best Practice
View Security Servers
View Security Servers(s)
Min: 2 (n+1)
HA for security servers
Virtual Hardware Specs
vCPU: 4 RAM: 10 GB
Resources for fast provisioning
Load Balancing F5 or Load Balancer Ensures availability of storefront servers Balances load between storefront servers & pods

15
VMware Horizon 6.0 with View | 15
Table 3: Infrastructure Design Decisions
Item Detail Rationale Active Directory
Global Catalog/DNS Server(s)
Min: 2 (n+1) per site
HA for GC/DNS Microsoft Best Practice
DHCP
DHCP Server(s) Min: 2 (n+1) per site
HA for DHCP Servers
Load Balancing DHCP Server Failover Relationship Ensures availability of DHCP Servers Balances load between DHCP Servers in operation
File Services
DFS Server(s) Min: 2 (n+1) per site
HA for DFS Servers
Load Balancing Lowest Cost Ensures availability of DFS Balances load between DFS Servers
SQL Server
SQL Server(s) Min: 2 (n+1) per site Scale: 2 per additional pod
HA for SQL Servers
Data Protection SQL AlwaysOn Availability Group Ensures availability of SQL Servers
Table 4: Network Design Decisions
Item Detail Rationale Virtual Switches
vSwitchNutanix Use: vSphere to CVM local communication Uplink(s): N/A
Nutanix Default
vSwitch0 \ vDS Use: All external VM communication Uplink(s): vmnic2,vmnic3
Nutanix Default
NIC Teaming
NetAdapterTeam NIC(s): 2 x 10Gb Teaming mode: standard vSwitch: Port ID Distrusted vSwitch: Load based Teaming
Utilize both 10Gb adapters active/active
VLANs
Management VLAN ID: Varies Mask: /24 Components: vSphere Hosts Nutanix CVMs vCenter SQL Servers AD/ DHCP/DFS Servers View Connection Servers
Dedicated infrastructure VLAN Best Practice

16
VMware Horizon 6.0 with View | 16
vMotion VLAN ID: Varies Mask: /24 Components: vSphere Hosts
vSphere Best Practice
Front-end VLAN(s) ID: DMZ (for external) Mask: Varies Components: Storefront
Network segmentation for front-end or external services
Desktop & RDS Sizing
Nutanix can host both virtual desktops and remote application services. Densities will vary based upon specific images and workload. For VDI testing, we used a medium workload using LoginVSI. To test Horizon View RDS functionality, shared hosted desktops were created to test loads using a LoginVSI 4.1 light workload. The task worker represents a comparable workload when determining Remote App densities due to a limited number of applications launched per user and no heavy video being played.
The following are examples of some typical scenarios for desktop deployment and utilization.
Table 5: Desktop Scenario Definition
Scenario Definition
Task Workers Task workers and administrative workers perform repetitive tasks within a small set of applications, usually at a stationary computer. The applications are usually not as CPU and memory-intensive as the applications used by knowledge workers. Task workers who work specific shifts might all log in to their virtual desktops at the same time. Task workers include call center analysts, retail employees, and warehouse workers.
Knowledge Workers
Knowledge workers’ daily tasks include accessing the Internet, using email, and creating complex documents, presentations, and spreadsheets. Knowledge workers include accountants, sales managers, and marketing research analysts.
Power Users Power users include application developers and people who use graphics-intensive applications.
The following table contains initial recommendations for desktop sizing for a Windows 7 desktop. Note: These are recommendations for sizing and should be modified after a current state analysis.

17
VMware Horizon 6.0 with View | 17
Table 6: Desktop Scenario Sizing
Scenario vCPU Memory Disks Task Workers 1 1GB 30GB (OS) Knowledge Workers 1-2 2GB 30GB (OS) Power Users 2 4GB 30GB+ (OS)
Desktop and RDS Optimizations
Following are some high-level desktop optimizations we followed for this design:
• Size desktops appropriately for each particular use case.
• Use a mix of applications installed in gold images and application virtualization, depending on the scenario.
• Disable unnecessary OS services and applications.
• Redirect home directories or use a profile management tool for user profiles and documents.
• Set a page file size.
Table 7: Virtual Desktop - Node Sizing Estimates
Node Type Workload/User Density Task Medium Heavy Virtual Desktop 120 100 60
Table 8 RDS - Node Sizing Estimates
Node Type Workload/User Density Light Medium Heavy RDS(shared hosted desktops)
200 170 90
The following figure shows an example of a RDS node providing hosted shared desktops:

18
VMware Horizon 6.0 with View | 18
Figure 8 RDS node providing hosted shared desktops.
Horizon View Composer
Horizon View Composer utilizes a standardized model for hosted virtual desktop creation. Leveraging a base, or “Golden Image”, View Composer will create clone VMs which consist of a delta and identity disk, which links back to the base VMs disks.
The following figure shows the main architectural components of a Horizon View deployment on Nutanix and the communication path between services.
Figure 9 Connectivity with View Composer

19
VMware Horizon 6.0 with View | 19
View Composer with Shadow Clones and VCAI
The next figure describes the high-level IO path for a View Composer based desktop on Nutanix. As shown, all IO operations are handled by NDFS and occur on the local node to provide the highest possible IO performance. Read requests will occur locally for desktops hosted on the same vSphere node as the Replica VM and over 10GbE for desktops hosted on other nodes. The Replica VM is created based off the selected golden image by ensuring a locked-in state for the duration of its use. It is possible for the Replica VM to become the bottleneck for performance.
Figure 10 View Composer IO Overview
Shadow Clones
The following figure describes the detailed IO path for a Horizon with View based desktop on Nutanix. All write IOs will occur locally on the local node’s SSD tier to provide the highest possible performance. Read requests for the Replica VM will occur locally for all desktops when the NDFS Shadow Clone feature is enabled, as this enables distributed caching of the Replica VM. These reads are served from the high performance read cache (if cached) or the SSD tier. Each node will also cache frequently accessed data in the read cache for any local data (delta disks, personal vDisks (if used)). Nutanix ILM will continue to constantly monitor data and the IO patterns to choose the appropriate tier placement. This helps to eliminate any performance bottlenecks.

20
VMware Horizon 6.0 with View | 20
Figure 11 Shadow Clones IO Detail
Nutanix Support for View Composer API for Array Integration
Full clones are made when View Composer calls the NFS VAAI (vSphere API for Array Integration). The full clones are made by taking a copy of the golden image, known as the replica. Full clones have their own metadata for full read and write operations. VMs created with VCAI can use the local storage controller and eliminate any bottlenecks that might happen by having to rely on the replica for reads. The rest is the same as before, reads are served from the high performance read cache (if cached) or the SSD tier. Each node will also cache frequently accessed data in the read cache for any local data (delta disks, personal vDisks (if used)). Nutanix ILM will continue to constantly monitor data and the IO patterns to choose the appropriate tier placement. This helps to eliminate any performance bottlenecks.
Figure 12 View Composer with VCAI IO Detail

21
VMware Horizon 6.0 with View | 21
Nutanix Web-scale Converged Infrastructure
The Nutanix web-scale converged infrastructure provides an ideal combination of both high-performance compute with localized storage to meet any demand. True to this capability, this reference architecture contains zero reconfiguration of or customization to the Nutanix product to optimize for this use case.
The next figure shows a high-level example of the relationship between a Nutanix block, node, storage pool, and container:
Figure 13 Nutanix Component Architecture
The following table shows the Nutanix storage pool and container configuration.
Table 9: Nutanix Storage Configuration
Name Role Details SP01 Main storage pool for all data All Disks CTR-RF2-VDI-01 Container for all Desktops vSphere – Datastore CTR-RF2-RDS-01 Container for all Servers vSphere – Datastore
Network
Designed for true linear scaling, Nutanix leverages a Leaf-Spine network architecture. A Leaf-Spine architecture consists of two network tiers: an L2 Leaf and an L3 Spine based on 40GbE and non-blocking switches. This architecture maintains consistent performance without any throughput reduction due to a static maximum of three hops from any node in the network.
The following figure shows a design of a scale-out Leaf-Spine network architecture that provides 20Gb active throughput from each node to its Leaf and scalable 80Gb

22
VMware Horizon 6.0 with View | 22
active throughput from each Leaf to Spine switch providing scale from 1 Nutanix block to thousands without any impact to available bandwidth:
Figure 14 Leaf Spine Network Architecture
Logical Network Design
Each vSphere host has two default switches for internal and external communication. The standard vSwitch or vDS switch is utilized for external node communication and VM traffic and has 10GbE uplinks in a team. The vSwitch Nutanix is utilized for NFS I/O between the vSphere host and the Nutanix CVM.
The following figure shows a logical network representation of the network segments used in the solution and corresponding components attached.

23
VMware Horizon 6.0 with View | 23
Figure 15 Logical Network Connectivity
24
VMware Horizon 6.0 with View | 24
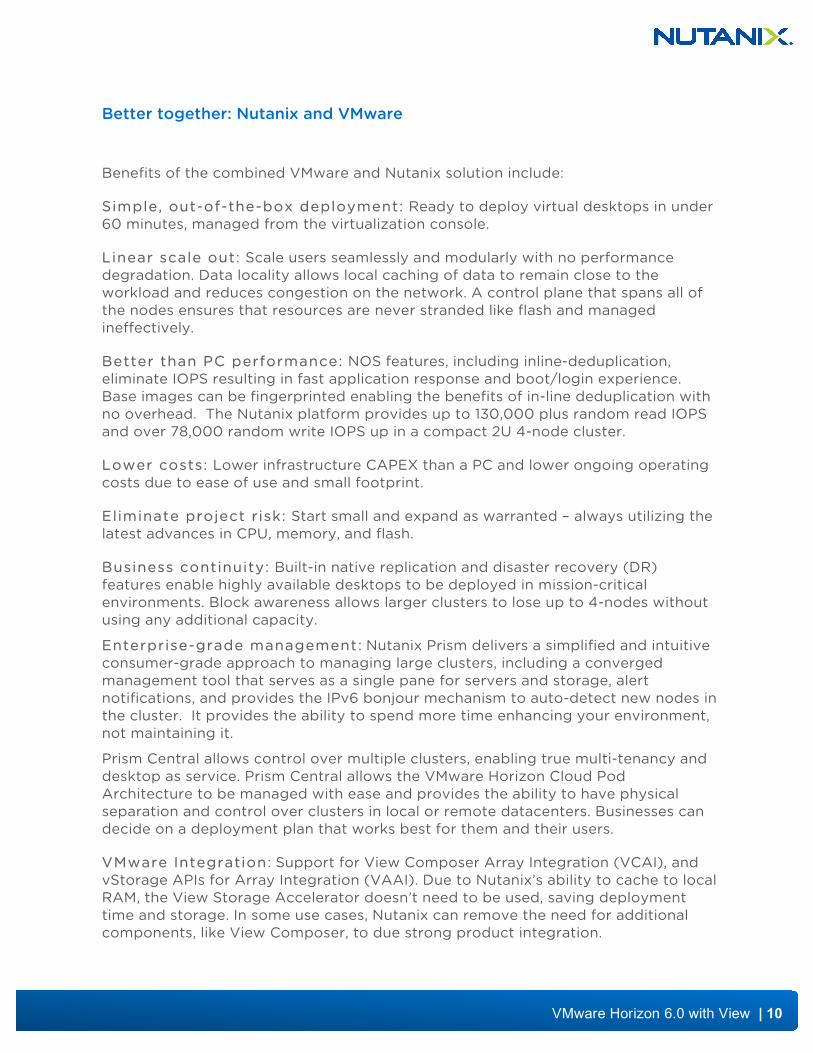
5. Validation and Benchmarking The solution and testing provided in this document were completed with VMware Horizon 6 with View deployed on vSphere 5.5 U1 on the Nutanix Virtual Computing Platform.
The Login VSI 4.1 medium workload was leveraged to detail the desktop performance and light workload was leveraged for RDS.
Nutanix Configuration
A Nutanix NX-3460 was used to host all infrastructure and Horizon services, as well as the Login VSI test harness. Active Directory services ran inside of the infrastructure cluster as well DHCP and SQL.
Two Nutanix NX-3460 were utilized as the target environment and provided all desktop and RDS hosting. Tests were ran with:
• 4-node VDI & RDS
• 6-node VDI
• 8-node VDI
Testing shows that Nutanix can handle Tier 1 workloads and scale in a linear fashion.
Both Nutanix blocks were connected to a top-of-rack switch via 10GbE.
Figure 16 Test Environment Overview

25
VMware Horizon 6.0 with View | 25
Test Environment Configuration
Assumptions:
o Medium workload for virtual desktops, light workload for RDS
o VDI using View Composer with VCAI enabled
o RDS using Nutanix Quick Clones for quick provisioning.
Hardware:
o Storage/Compute:, 2 Nutanix NX-‐3460, NOS 4.0.1
o Network: Arista 7050Q(L3 Spine)/7050S(L2 Leaf) Series Switches
Login VSI:
o Login VS 4.1.0.757 Professional
Horizon View Configuration:
Table 10: Horizon View Configuration
VM Qty vCPU Memory Disks
Connection Brokers 2 4 10 GB 1 x 60GB (OS)
View Composer 1 2 4 GB 1 x 60GB (OS)
SQL 1 4 8 GB 3 X 60 GB (OS, DATA, Logs)
vCenter Appliance 1 8 10 GB 1 X 80 GB, 1 X 100 GB
:
Table 11: Horizon View Test Image Configuration
Attribute VDI -Window 7 SP1 64 bit RDS -Window 2012 R2
Hardware 10 GB 1 x 60GB (OS)
CPU 2 vCPUs N/A
Memory 8 GB 3 X 60 GB (OS, DATA,

26
VMware Horizon 6.0 with View | 26
Logs)
Memory reserved 10 GB 1 X 80 GB, 1 X 100 GB
Video RAM 128 MB 128MB
3D Graphics Off Off
NICs 1 1
Virtual network adapter VMXNet3 Adapter VMXNet3 Adapter
Virtual SCSI controller 0 Paravirtual Paravirtual
Virtual disk VMDK1 50 GB 100 GB
Virtual floppy drive Removed Removed
Virtual CD/DVD drive 1 Removed Removed
Applications Adobe Acrobat 11
Adobe Flash Player 11
Doro PDF 1.82
FreeMind
Internet Explorer 11
MS Office 2010
Adobe Acrobat 11
Adobe Flash Player 11
Doro PDF 1.82
FreeMind
Internet Explorer 11
MS Office 2010
VMware Tools 9.4.5.173405 9.4.5.173405
VMware View Agent 6.0 6.0
Login VSI Benchmark
Login Virtual Session Indexer (Login VSI) is the de facto industry standard benchmarking tool to test the performance and scalability of centralized Windows desktop environments, including Server Based Computing (SBC) and Virtual Desktop Infrastructures (VDI).
Login VSI is 100% vendor independent and is used to test virtual desktop environments including VMware Horizon View, or any other Windows-based SBC or VDI solution.

27
VMware Horizon 6.0 with View | 27
Login VSI is used for testing and benchmarking by all major hardware and software vendors, and is recommended by both leading IT analysts and the technical community. Login VSI is vendor-independent and works with standardized user workloads, therefore conclusions that are based on Login VSI test data are objective, verifiable, and replicable.
For more information about Login VSI visit http://www.loginvsi.com/
For more information about Login VSI test workflows visit http://www.loginvsi.com/pdf/documentation/Login-VSI-40-Workloads.pdf
Interpreting the Login VSI Results
Login VSI is a test benchmark used to simulate real world user workload on a desktop. These values are the full time it takes for an application or task to complete (for example, launch Word) and are not in addition to traditional desktop response times. These do not refer to the round trip time (RTT) for network IO, rather the total time to perform an action on the desktop.
During the test, all VMs were powered on and the workload used a launch window of 2,880 second for all tests.
Evaluation was quantified using the following metrics:
o Minimum Response: Minimum response indicates the minimum response time for all the measurements taken when the indicated number of sessions on the X-axis were active.
o Average Response: Average response indicates the average response time for all the measurements taken when the indicated number of sessions on the X-axis were active.
o Maximum Response: Maximum response indicates the maximum response time for all the measurements taken when the indicated number of sessions on the X-axis were active.
o VSImax v4 detailed: The individual measurements taken during a test in a combined graph. This graph shows the minimum, average, and maximum response times for each individual measurement. There is also a Total metric that combines all of the metric into a single number. The minimum, average, and maximum for this combined value is shown as well.
o VSI Index Average: Indicates the average value as calculated by VSI. The VSI Index Average differs from Average Response on the fact that Average Response is the pure average. VSI Index Average applies certain statistical rules to the average to avoid spikes from influencing the average too much.
o VSImax v4: Shows the amount of sessions can be active on a system before the system is saturated. The blue X shows the point where VSImax was reached. This number provides an indication of the scalability of the environment (higher is better).

28
VMware Horizon 6.0 with View | 28
o VSIbase(line): shows the VSI index average for the environment when there is no to little load on the environment. This number is used as an indication of the base performance of the environment (lower is better). This number in combination with the VSImax number will tell you:
o How well an environment performs (VSIbase)
o And how long the environment can maintain that performance, how scalable the VSIbase performance is (VSImax).
o LogonTimer: An indication of the time it takes for a session to logon. The graph shows the trend of logon times during the test. The logon time is specified in seconds. Please note that this is an indication of the logon time. VSI measures the time from the logon scripts running, shortly after group policy has been processed but before the shell has loaded (Windows Explorer), and the windows shell being loaded.
Based on user experience and industry standards, Nutanix recommends that the values be kept below the following values (LoginVSI 4.x):
Table 12: Login VSI Metric Values Metric Value(ms) Rationale Minimum Response <1,000 Acceptable ideal response time Average Response <4,000 Acceptable average response time Maximum Response <8,000 Acceptable peak response time VSI Baseline <5,000 Acceptable ideal response time VSI Index Average <4,000 Acceptable average response time
Login VSI Graphs
The Login VSI graphs show the values defined obtained from the launching of each desktop session. The following figure shows an example graph showing the test data. The y-axis is the response time in milliseconds and the x-axis is the number of active sessions.

29
VMware Horizon 6.0 with View | 29
Figure 17 Sample LoginVSI graph

30
VMware Horizon 6.0 with View | 30
6. Validation Results All tests had 111 users launched per node with the objective of getting 110 or more users to run as the Nutanix cluster scaled from 4,6,8-nodes proving the linear scalability.
View Composer with VCAI for a 4-node NX-3060 (NX-3460)
The following are the test results for a 4-node NX-3460 with View Composer Array Integration enabled with LoginVSI medium user profile supported by Window 7 SP1
Login VSI Medium Results
During the testing, VSImax was not reached with a baseline of 1346 and average VSImax of 3376ms. The VSImax threshold was 3946. 441 sessions ran successfully.
Figure 18 VSImax for a 441 Horizon View users on 4-nodes.

31
VMware Horizon 6.0 with View | 31
CVM CPU Metrics
At the peak of the test execution, CVM CPU utilization for the vSphere hosts averaged at 53%. During the boot phase of all 36 Servers CVM usage did reach 72%
Figure 19 CPU Utilization for all CVM’s during the testing for 4-nodes.
Nutanix Storage Metrics
The 4-node tests showed IO footprints on the Nutanix platform with a peak of 3,65 aggregate IOPS during the test runs. IO latencies averaged < 2.4 ms and peaked at 3.1 ms during the test.

32
VMware Horizon 6.0 with View | 32
Figure 20 4 Node - Total Cluster Read &Write IOPS during testing
Figure 21 4-node IO latency during testing with a peak of 3.1ms
Overall Cluster CPU and Memory Consumption
The overall CPU did reach 93.32% during the peak of the run and overall memory ~ 80% utilized across the 4-nodes.
Figure 22 Overall Cluster CPU and Memory Consumption for 4-nodes
View Composer with VCAI for a 4-node NX-3060 (NX-3460+NX-3260)
The following are the test results for a 6-node configuration using NX-3060 nodes with View Composer Array Integration enabled with LoginVSI medium user profile supported by Window 7 SP1.

33
VMware Horizon 6.0 with View | 33
Login VSI Medium Results
During the testing, VSImax was reached with a baseline of 1264 and average VSImax of 2708ms. The VSImax threshold was 3864. VSImax was 664 users.
Figure 23 VSImax for a 664 Horizon View users on 6 nodes.
CVM CPU Metrics
At the peak of the test execution, CVM CPU utilization for the vSphere hosts averaged at 65%. During the peak of testing with 6 nodes, CPU utilization peaked at 99.68%

34
VMware Horizon 6.0 with View | 34
Figure 24 CPU Utilization for all CVM’s during the testing for 6 nodes with 664 users.
Nutanix Storage Metrics
The 6-node tests showed IO footprints on the Nutanix platform with a peak of 5,740 aggregate IOPS during the test runs. IO latencies averaged < 1.7 ms and peaked at 2.21 ms during the test.
Figure 25 Aggregate cluster IOPS for 6 nodes
View Composer with VCAI with 8-nodes NX-3060 (2x NX-3460)
The following are the test results for an 8-node configuration using NX-3060-nodes with View Composer Array Integration enabled with LoginVSI medium user profile supported by Window 7 SP1
Login VSI Medium Results
During the testing VSImax was not reached with a baseline of 1293 and average VSImax of 3690ms. The VSImax threshold was 3893. The 8-node configuration using NX-3060 was able to support 886 user sessions.

35
VMware Horizon 6.0 with View | 35
Figure 26 VSImax for 886 Horizon View users on 8-nodes.
CVM CPU Metrics
At the peak of the test execution, CVM CPU utilization for the vSphere hosts averaged at 49%. During the peak of testing with 8-nodes CPU utilization peaked at 97.95%.
Figure 27 CPU Utilization for all CVM’s during the testing for 6-nodes with 664 users.

36
VMware Horizon 6.0 with View | 36
Nutanix Storage Metrics
The 8-node tests showed IO footprints on the Nutanix platform with a peak of 8,150 aggregate IOPS during the test runs. IO latencies averaged < 1.9 ms and peaked at 2.7 ms during the test.
Figure 28 8 Node - Total Cluster Read & Write IOPS during testing
Figure 29 6-node - IO latency during testing with a peak of 2.7ms
Overall Cluster CPU and Memory Consumption
The overall CPU did reach 94.68% during the peak of the run and overall memory ~ 84% utilized across the 8-nodes.

37
VMware Horizon 6.0 with View | 37
Figure 30 Overall Cluster CPU and Memory Consumption for 8 Nodes
Linear Scale
During testing the 4-, 6- and 8-nodes test runs for Horizon View the number of users per node and VSImax stayed consistent. Small variance can be contributed to background cluster tasks that are allowing running to ensure high available for the cluster like self-healing.
Figure 31 Linear Scale as nodes are added to the cluster.
Boot Storm
Boot storms can be avoided or planned for but bad things happen like power outages, maintenance windows and if you’re dealing with events like shift change, like in Health Care, you need to have ability to boot your desktops quickly. The clock started at 2:25:34 in vCenter and the watch stopped when all the agents reported back in the Horizon View Connection broker at 2:31:32. The system required 6 minutes to boot 888 desktops running on 8 Nutanix NX-3460 nodes.

38
VMware Horizon 6.0 with View | 38
Figure 32 Cluster CPU did hit high briefly with the current vCenter settings but that’s to be expected.
Figure 33 Minimal latency when booting all of the desktops
Figure 34 Over 50,000 IOPS to boot the desktops. Most of the IOPS coming from local cache.
High Availability and Continuity
One of the added benefits of scale-storage is the addition of multiple storage controllers. When you have more than 2 storage controllers and you lose one due to failure or maintenance like a rolling upgrade, you can do so with minimal impact.
Below are the results of 8-node cluster with 700 desktops running a LoginVSI medium workload. One of the 8 storage controllers is shutdown to see the impact on the cluster. No desktops were rebooted or shutdown. IOPS dropped 2,000 to 1,496 and latency had a brief spike from 4ms to 22.37 ms.

39
VMware Horizon 6.0 with View | 39
Figure 35 Impact of shutting off a Nutanix Storage Controller
Remote Desktop Services on NX-3460 (4-nodes)
The following are the test results for a 4-node configuration using NX-3060 nodes with View Composer Array Integration enabled with LoginVSI light user profile supported by Windows 2012 R2. The task worker profile best represents Horizon with View’s delivery of remote applications to users. Each Nutanix node had 8x Windows 2012 R2 VM’s with 5 vCPU and 24 GB of RAM each.
Login VSI Light Workload Results
During the testing, VSImax was reached with a baseline of 1084 and average VSImax of 3606. The VSImax threshold was 3685. The 4-node Nutanix NX-3460 was able to support 799 user sessions.
Figure 36 VSImax for 799 Horizon View RDS users on 4-nodes.
40
VMware Horizon 6.0 with View | 40
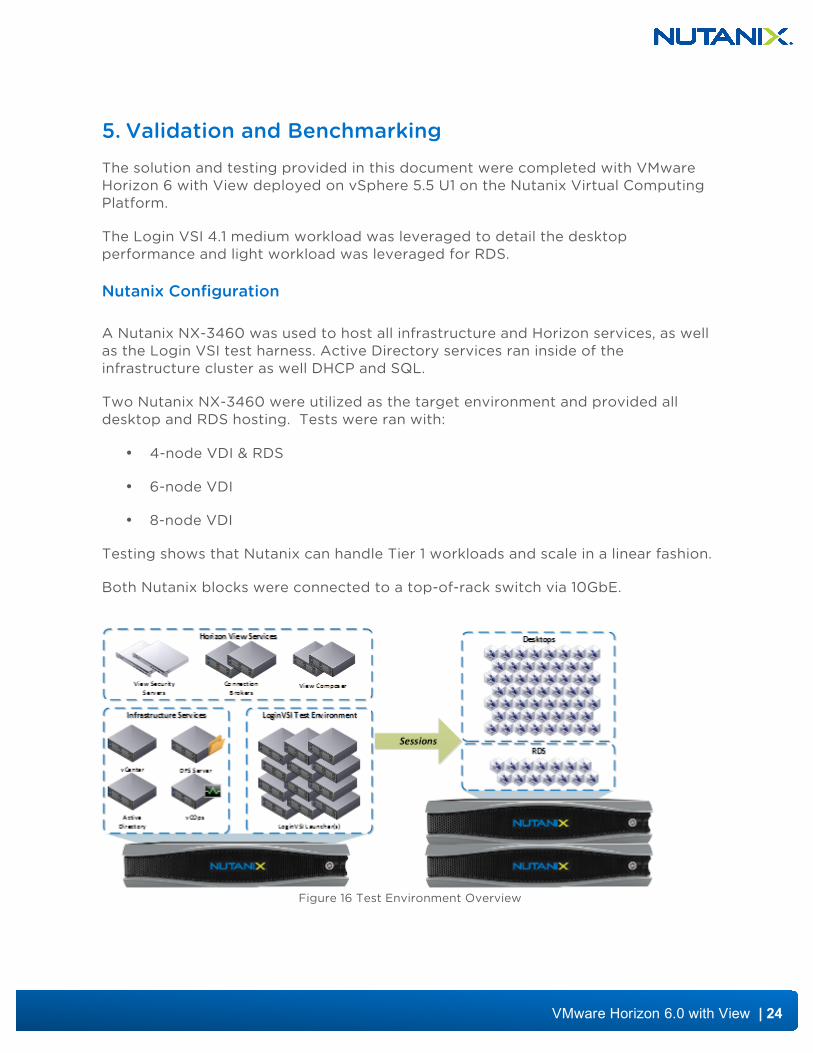
CVM CPU Metrics
At the peak of the test execution, CVM CPU utilization for the vSphere hosts averaged at 41%. During the peak of testing with 4-nodes CPU utilization peaked at 49%.
Figure 37 CPU Utilization for all CVM’s during the testing for 6 nodes with 664 users.
Nutanix Storage Metrics
The 4-node tests showed light IO footprints on the Nutanix platform with a peak of 1,313 aggregate IOPS during the test runs. IO latencies averaged < 4.8 ms and peaked at 5.62 ms during the test.
Figure 38 4 Node RDS - Total Cluster Read & Write IOPS during testing

41
VMware Horizon 6.0 with View | 41
Figure 39 4-node RDS - IO latency during testing with a peak of 5.79 ms
VMCaliber Clone - Time to Provision
Table 13: Time to Provision
Time to take a full clone using Nutanix VMCaliber
Start Time End Time Total Time Windows Server 2012 R2 – 120 GB VMDK
11:33:16 11:33:24 8 sec
With Integration of VAAI (vStorage APIs for Array Integration) support, Nutanix can clone large servers like Windows Server 2012 R2 being used for RDS in seconds. This is very important as Horizon View relies on host/virtualization for deployment of RDS host. The ability to use Nutanix VMCaliber clones also saves flash for performance instead of being used for copy operations.

42
VMware Horizon 6.0 with View | 42
7. Solution Application This section applies this pod-based reference architecture to real-world scenarios and outlines the sizing metrics and components. The applications below assume a standard medium user workload, however will vary based upon utilization and workload.
NOTE: Detailed hardware configuration and product models can be found in the appendix. Any starting size of 3 or more nodes can form the base of a Nutanix cluster.
Scenario: 12 Nodes
Allocating 8-nodes for VDI and 4-nodes for RDS.
Table 14: Detailed Component Breakdown – 12 Nodes
Item Value Item Value Components Infrastructure # of Nutanix nodes 12 # of vCenter Servers 1 # of Nutanix blocks 3 # of vSphere Hosts 12 # of RU (Nutanix) 6 # of vSphere Clusters 2 # of 10GbE Ports 24 # of Datastore(s) 1 # of 100/1000 Ports (IPMI) 12 # of RDS Servers Up to 32 # of L2 Leaf Switches 2 # of RDS Users 800 # of L3 Spine Switches 1 # of Virtual Desktops 880

43
VMware Horizon 6.0 with View | 43
Figure 40 Rack Layout– 12 Nodes
Availability Domains
Availability Domains is a key construct for distributed systems to abide by for determining component and data placement. When you have 3 or more uniform blocks each with a minimum of 2 nodes you can lose a block and the cluster will keep running. No additional capacity is used to achieve this redundancy just intelligent data placement.
With the following configuration, a whole block can be down and the Nutanix Cluster will still run. This allows for more than one node to be down for maintenance at time, which leads to better OPEX during maintenance windows and overall higher availability.
44
VMware Horizon 6.0 with View | 44
Figure 41 12-node availability domain with VDI & RDS
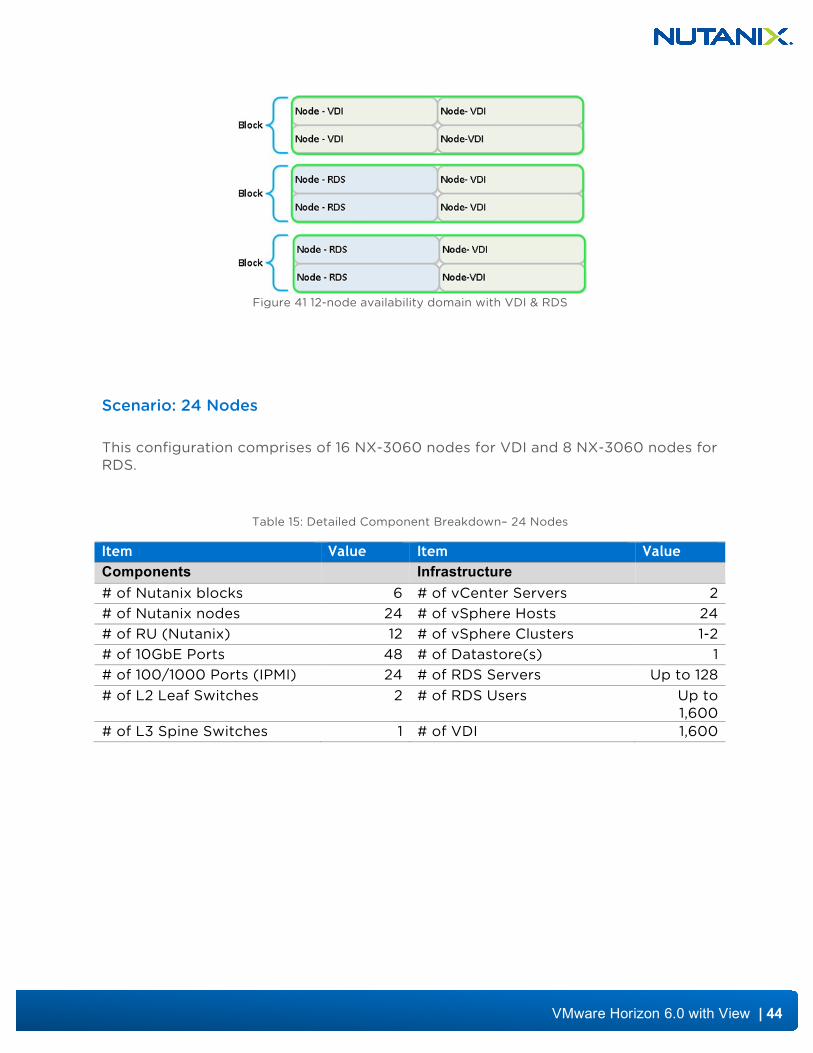
Scenario: 24 Nodes
This configuration comprises of 16 NX-3060 nodes for VDI and 8 NX-3060 nodes for RDS.
Table 15: Detailed Component Breakdown– 24 Nodes
Item Value Item Value Components Infrastructure # of Nutanix blocks 6 # of vCenter Servers 2 # of Nutanix nodes 24 # of vSphere Hosts 24 # of RU (Nutanix) 12 # of vSphere Clusters 1-2 # of 10GbE Ports 48 # of Datastore(s) 1 # of 100/1000 Ports (IPMI) 24 # of RDS Servers Up to 128 # of L2 Leaf Switches 2 # of RDS Users Up to
1,600 # of L3 Spine Switches 1 # of VDI 1,600

45
VMware Horizon 6.0 with View | 45
Figure 42 Rack Layout – 24 Nodes

46
VMware Horizon 6.0 with View | 46
Availability Domains
With the following configuration a whole block can be down and the Nutanix Cluster will still run. This allows for more than one node to be down for maintenance at time, which leads to better OPEX during maintenance windows and overall higher availability.
Figure 43 24-node availability domain with VDI & RDS

47
VMware Horizon 6.0 with View | 47
8. Conclusion The VMware Horizon with View and Nutanix solution provides a single high-density platform for desktop and application delivery. This modular linearly scaling approach enables these deployments to easily grow. Localized and distributed Shadow Clone cache, VAAI support allows RDS and Full Clone desktops to be quickly deployed without wasting high-performance flash. Robust self-healing and multi-storage controllers deliver high availability in the face of failure or rolling upgrades.
Horizon user density will be primarily driven by the available host CPU resources and not due to any IO or resource bottleneck for both virtual desktops and RDS deployments on Nutanix. Login VSI test results showed densities of over 110 users per Nutanix node for VDI and almost 200 users per node for RDS. From starting at 4-nodes and then scaling from 6- to 8-nodes, testing shows that Nutanix can offer a ‘pay as you grow’ model like public cloud providers, but in the comfort and security of your own premises.
By having Nutanix Clusters with both RDS and virtual desktops, you can achieve greater resiliency by allowing enough nodes to meet the requirements for Availability Domains. The ability to lose up to 4 nodes without downtime comes without sacrificing storage capacity and allows IT operations teams to have smaller maintenance windows.
Infrastructure can be added on your terms and on your schedule without sacrificing performance or overspending upfront.

48
VMware Horizon 6.0 with View | 48
9. Appendix: Configuration
Hardware o Storage / Compute
▫ 2 * Nutanix NX-3460
o Per node specs (4-nodes per 2U block):
§ CPU: 2x Intel Xeon E5-2670
§ Memory: 256 GB Memory
o Network
▫ Arista 7050Q - L3 Spine
▫ Arista 7050S - L2 Leaf
Software o Nutanix
▫ NOS 4.0.1 ▫ CVM – 8vCPUs, 32 GB of RAM
o Horizon View
▫ 6.0
o Virtual Desktop
o Windows 7 SP1
o RDS Server
▫ Microsoft Windows Server 2012 R2 o Infrastructure
▫ vSphere 5.5 U1 Build 1881737
VM o RDS
▫ CPU: 5 vCPU ▫ Memory: 24 GB (static)
o Storage: ▫ 1 x 120 GB OS Disk on CTR-RF2-RDS-01 NDFS backed NFS datastore

49
VMware Horizon 6.0 with View | 49
10. References
Table of Figures
Figure 1 Web-scale properties of Nutanix ....................................................................................... 6
Figure 2 Nutanix Node Architecture .................................................................................................. 7
Figure 3 Nutanix Architecture .............................................................................................................. 7
Figure 4 Elastic Deduplication Engine .............................................................................................. 8
Figure 5 Nutanix Shadow Clone Functionality .............................................................................. 9
Figure 6 Add one node at a time to meet your needs. ............................................................. 11
Figure 7 Horizon with View, platform for end user computing. ............................................ 12
Figure 8 RDS node providing hosted shared desktops. .......................................................... 18
Figure 9 Connectivity with View Composer ................................................................................. 18
Figure 10 View Composer IO Overview .......................................................................................... 19
Figure 11 Shadow Clones IO Detail ................................................................................................. 20
Figure 12 View Composer with VCAI IO Detail .......................................................................... 20
Figure 13 Nutanix Component Architecture ................................................................................. 21
Figure 14 Leaf Spine Network Architecture ................................................................................. 22
Figure 15 Logical Network Connectivity ........................................................................................ 23
Figure 16 Test Environment Overview ........................................................................................... 24
Figure 17 Sample LoginVSI graph .................................................................................................... 29
Figure 18 VSImax for a 441 Horizon View users on 4-nodes. ................................................ 30
Figure 19 CPU Utilization for all CVM’s during the testing for 4-nodes. ............................ 31
Figure 20 4 Node - Total Cluster Read &Write IOPS during testing ................................. 32
Figure 21 4-node IO latency during testing with a peak of 3.0 ms ..................................... 32
Figure 22 Overall Cluster CPU and Memory Consumption for 4-nodes ........................... 32
50
VMware Horizon 6.0 with View | 50
Figure 23 VSImax for a 664 Horizon View users on 6 nodes. ............................................... 33
Figure 24 CPU Utilization for all CVM’s during the testing for 6 nodes with 664 users.34
Figure 25 Aggregate cluster IOPS for 6 nodes ........................................................................... 34
Figure 26 VSImax for a 886 Horizon View users on 8-nodes. ............................................... 35
Figure 27 CPU Utilization for all CVM’s during the testing for 6-nodes with 664 users.35
Figure 28 8 Node - Total Cluster Read & Write IOPS during testing ................................. 36
Figure 29 6-node - IO latency during testing with a peak of 2.9 ms .................................. 36
Figure 30 Overall Cluster CPU and Memory Consumption for 8 Nodes ........................... 37
Figure 31 Linear Scale as nodes are added to the cluster. ..................................................... 37
Figure 32 Cluster CPU did hit high briefly with the current vCenter settings but that’s to be expected. ........................................................................................................................................ 38
Figure 33 Minimal latency when booting all of the desktops ................................................ 38
Figure 34 Over 50,000 IOPS to boot the desktops. Most of the IOPS coming from local cache. ................................................................................................................................................ 38
Figure 35 Impact of shutting off a Nutanix Storage Controller ............................................ 39
Figure 36 VSImax for 799 Horizon View RDS users on 4-nodes. ........................................ 39
Figure 37 CPU Utilization for all CVM’s during the testing for 6 nodes with 664 users.40
Figure 38 4 Node RDS - Total Cluster Read & Write IOPS during testing ...................... 40
Figure 39 4-node RDS - IO latency during testing with a peak of 5.62 ms ..................... 41
Figure 40 Rack Layout– 12 Nodes .................................................................................................... 43
Figure 41 12 node availability domain with VDI & RDS ............................................................ 44
Figure 42 Rack Layout – 24 Nodes .................................................................................................. 45
Figure 43 24-node availability domain with VDI & RDS .......................................................... 46
Table of Tables
Table 1: Platform Design Decisions ................................................................................................... 13

51
VMware Horizon 6.0 with View | 51
Table 2: VMware Design Decisions ................................................................................................... 14
Table 3: Infrastructure Design Decisions ........................................................................................ 15
Table 4: Network Design Decisions .................................................................................................. 15
Table 5: Desktop Scenario Definition .............................................................................................. 16
Table 6: Desktop Scenario Sizing ...................................................................................................... 17
Table 7: Virtual Desktop - Node Sizing Estimates ...................................................................... 17
Table 8 RDS - Node Sizing Estimates .............................................................................................. 17
Table 9: Nutanix Storage Configuration ......................................................................................... 21
Table 10: Horizon View Configuration ............................................................................................ 25
Table 11: Horizon View Test Image Configuration ...................................................................... 25
Table 12: Login VSI Metric Values ..................................................................................................... 28
Table 13: Time to Provision .................................................................................................................. 41
Table 14: Detailed Component Breakdown – 12 Nodes ........................................................... 42
Table 15: Detailed Component Breakdown– 24 Nodes ........................................................... 44

52
VMware Horizon 6.0 with View | 52
11. About the Authors
Dwayne Lessner is a technical marketing engineer on the product marketing team at Nutanix, Inc. In this role, Dwayne helps design, test, and build solutions on top of the Nutanix Virtual Computing Platform. Dwayne has worked in healthcare and oil & gas for over ten years in various roles. A strong background in server and desktop virtualization has given Dwayne the opportunity to work with many different applications frameworks and architecture. Dwayne has been a speaker at BriForum and various VMUG events and conferences.
Steven Poitras is a solution architect on the technical marketing team at Nutanix, Inc. In this role, Steven helps design architectures combining applications with the Nutanix platform, creating solutions helping solve critical business needs and requirements and disrupting the infrastructure space. Prior to joining Nutanix, he was one of the key solution architects at the Accenture Technology Labs where he was focused on the Next Generation Infrastructure (NGI) and Next Generation Datacenter (NGDC) domains. In these spaces, he has developed methodologies, reference architectures, and frameworks focusing on the design and transformation to agile, scalable, and cost-effective infrastructures that can be consumed in a service-oriented or cloud-like manner.

53
VMware Horizon 6.0 with View | 53