Embed Size (px)
Citation preview

SummaryVitamin A deficiency is a common form of micronutrient malnutritionaffecting 21.1% of preschool-age children and 5.6% of pregnant womenworldwide.
The published literature linking vitamin A interventions to cause-specific child mortality due to measles, diarrhoea, malaria and other infec-tious diseases and to all-cause maternal mortality was comprehensivelyreviewed. Randomized controlled trial data of vitamin A interventionsand survival were used to estimate the risk of mortality associated withvitamin A deficiency. The published relative risks were adjusted for theestimated prevalence of deficiency at study baseline. Summary relativerisks were calculated from meta-analyses (for measles, diarrhoea, andother infectious disease causes of child mortality) or from single studies(malaria mortality among children and all-cause maternal mortality).
The estimated relative risks associated with vitamin A deficiency inchildren were 1.86 (95% CI 1.32–2.59) for measles mortality, 2.15 (95% CI 1.83–2.58) for diarrhoea mortality, 1.78 (95% CI 1.43–2.19)for malaria mortality, 1.13 (95% CI 1.01–1.32) for other infectiousdisease mortality and 4.51 (95% CI 2.91–6.94) for all-cause maternalmortality.
The available evidence suggests that nearly 800000 deaths worldwidecan be attributed to vitamin A deficiency among women and children.Approximately 20–24% of child mortality from measles, diarrhoea andmalaria and 20% of all-cause maternal mortality can be attributed tothis preventable condition. Africa and South-East Asia have the highestburden of disease.
Chapter 4
Vitamin A deficiency
Amy L. Rice, Keith P. West Jr. and Robert E. Black

1. IntroductionThe objective of this chapter is to summarize the available evidence thatcan be used to quantitatively estimate the risk of adverse health outcomesassociated with vitamin A deficiency and to calculate the associatedburden of disease for different regions of the world. Vitamin A is anessential nutrient required for maintaining immune function, eye health,vision, growth and survival in human beings. Over the years, numerousstudies have been conducted to identify the biological functions ofvitamin A, the health consequences associated with deficiency, and themechanisms that explain these relationships. Causal relationships havebeen clearly demonstrated in some instances and comprehensive reviewson the subject have been published (Sommer and West 1996).
According to World Bank estimates, vitamin A supplementation forpreschool-age children is one of the most cost-effective child survivalinterventions (World Bank 1993). National level public health pro-grammes to prevent and treat vitamin A deficiency are currently beingimplemented in countries in Asia, Africa and elsewhere. Internationaldonors and agencies including the Canadian International DevelopmentAgency (CIDA), United Nations Children’s Fund (UNICEF), the UnitedStates Agency for International Development (USAID), the World HealthOrganization (WHO) and others have actively supported both nationaland global level initiatives to raise awareness about the problem ofvitamin A deficiency and to promote efforts to implement effective andaffordable solutions (Mason et al. 2001). Reducing the prevalence ofvitamin A deficiency will lessen disease burden by improving immunefunction, lowering mortality rates and preventing blindness, especiallyamong children. This chapter will contribute to ongoing efforts to assessthe global problem of vitamin A deficiency by using existing data to esti-mate global prevalence rates, to identify and quantify the adverse healthconsequences associated with deficiency, and to estimate the future healthbenefits that could be gained by implementing even more effectivecontrol programmes.
2. Definition of malnutrition and vitamin A deficiency
Malnutrition is a complex phenomenon. Broadly defined, malnutritionrefers to the condition of inappropriate nutrition. In the past, discussionsof malnutrition in the context of health issues in low-income countriesoften used this term to refer to the condition of “undernutrition” asso-ciated with what was presumed to be protein–energy malnutrition andoperationally defined as a deficit in anthropometric status or by the pre-sence of clinical signs such as oedema or altered hair colour. In morerecent years, various vitamin and mineral deficiencies, including vitaminA, iron, iodine and zinc have been recognized as discrete types of mal-
212 Comparative Quantification of Health Risks

nutrition that adversely affect human health and contribute to diseaseand mortality. Some of these nutrients affect closely related biologicalsystems; for example both vitamin A and zinc play important roles inmaintaining different aspects of immune function (Shankar 2001) andboth vitamin A and iron affect haemoglobin metabolism (Semba andBloem 2002). Ecological-level studies have demonstrated that the pre-valence of these micronutrient deficiencies are high in many of the samecountries, thus many individuals may suffer from multiple micronutri-ent deficiencies at the same time. However, relatively few data are cur-rently available for quantifying either the joint distribution of multipledeficiencies or the impact that multiple micronutrient deficiencies haveon specific health outcomes. Therefore, the comparative risk assessment(CRA) project will estimate the separate contribution of these risk factorsto the global burden of disease. Individual reviews are available for therisk factors of iron deficiency (chapter 3), zinc deficiency (chapter 5) andunderweight status (chapter 2) in addition to vitamin A deficiency, whichis the subject of the current chapter.
Vitamin A is an essential nutrient required for maintaining immunefunction, eye health, vision, growth and survival in human beings(National Research Council 1989). Although animal studies that identi-fied vitamin A as a necessary factor for rat growth were conducted inthe early 1900s and the chemical structure of the vitamin was elucidatedover 20 years later, reports describing the link between xerophthalmia(signs in the eye of disease due to a severe lack of the vitamin) and suc-cessful treatment with animal liver (a rich source of the vitamin) dateback to the medical writings of ancient Egypt (Olson 1996).
At present, vitamin A deficiency remains a widespread public healthproblem, especially in countries of South Asia and Africa. Globally,preschool-age children and women of reproductive age are the two population groups most commonly recognized to be at risk of this nutritional deficiency and its adverse health consequences. A combina-tion of chronically lower than required dietary intakes of vitamin A-rich foods (eggs, milk, liver, deep orange fruits and dark green leafyvegetables, etc.) combined with malabsorption and increased vitamin Aexcretion rates associated with some common illnesses places manywomen and children at risk of developing vitamin A deficiency (Christian et al. 1998b; IVACG 1997; Sommer and West 1996;Stephensen 2001).
No single indicator can be reliably used to assess the full spectrum ofvitamin A deficiency. Different aspects of vitamin A status are assessedusing clinical indicators, biochemical indicators, functional indicatorsand histological indicators (WHO 1996). In humans, vitamin A is storedalmost exclusively (>90%) in the liver and some investigators proposeliver and/or total body stores as a primary indicator of vitamin A status.Although recent isotope dilution techniques to indirectly measure livervitamin A stores have yielded promising results (Haskell et al. 1999;
Amy L. Rice et al. 213

Ribaya-Mercado et al. 1999) these techniques have not yet been used inlarge-scale population-based surveys.
Severe vitamin A deficiency can be identified by the presence of theclassical eye signs of xerophthalmia in individuals. However, becausesevere vitamin A deficiency is relatively rare in most populations, a largenumber of individuals must be surveyed in order to generate a reliableprevalence estimate. Depending on the severity of vitamin A deficiencyin a population, the sample size requirement for a xerophthalmia surveymay be nearly ten times higher than what would be required to generate a reliable prevalence estimate for other indicators of vitamin Astatus, such as low serum retinol concentrations, which may occur morefrequently in the same population (Sommer and Davidson 2002; WHO1996).
Milder vitamin A deficiency is far more common, but the assessmentof vitamin A deficiency that does not result in relatively easily observ-able eye signs is also more problematic. One way to identify milder formsof vitamin A deficiency is to collect blood samples and measure the concentration of circulating serum retinol in an individual. Values<0.70mmol/l have traditionally been considered indicative of deficiencyin children, based on empirical data from population-based studies thatdid not exclude individuals based on measurements of acute phase pro-teins. In adults, appropriate cut-off levels are less firmly established, butvalues <0.70mmol/l and <1.05mmol/l have been used for different pur-poses. Because serum retinol concentrations are transiently depressedduring the acute phase response to certain infections, some investigatorshave questioned the validity of using this indicator to assess the vitaminA status of individuals (Stephensen 2001). However, determining theprevalence of serum retinol concentrations below a defined cut-off pointremains one of the most commonly used and widely accepted approachesfor assessing the vitamin A status of entire populations (Sommer andDavidson 2002).
At the population level, the prevalence of vitamin A deficiency can bedetermined based on the prevalence of either: (i) night blindness, usuallyobtained by verbal recall; (ii) other eye signs of xerophthalmia (Bitot’sspots or corneal lesions); or (iii) biochemical indicator values (serumretinol, breast milk retinol, relative dose-response test, modified relativedose-response test, or serum 30-day response), or histological indicatorvalues (conjunctival impression cytology [CIC] that fall below a definedcut-off point (WHO 1996). Until recently the majority of nationally rep-resentative, large-scale surveys related to vitamin A deficiency were con-ducted primarily among preschool-age children. However, in the past fewyears some large-scale surveys, including recent demographic and healthsurveys, have also attempted to estimate the prevalence of night blind-ness among pregnant women. More limited survey findings are availablefor serum and breast milk retinol concentrations among women. Surveysthat included data on any or all of the indicators listed above were used
214 Comparative Quantification of Health Risks

as a basis for estimating the global prevalence of vitamin A deficiency asa risk factor for the CRA project. The categorical definitions chosen torepresent “vitamin A deficiency” among children (aged 0–4 years) andwomen (aged 15–44 years) for the CRA project are described in the fol-lowing sections. A description of the data, indicators, and the processused to estimate the current prevalence of vitamin A deficiency amongpreschool-age children and pregnant women is presented in section 3.5.
2.1 Definitions for children (0–4 years)
Globally, the most reliable population-based survey data provide esti-mates of vitamin A deficiency among children aged <5 years, primarilybecause this is the most well-established high-risk age group for thisnutritional risk factor. In the CRA project prevalence estimates have beendeveloped only for the 0–4-year age group, although there is some evi-dence that slightly older children also suffer from vitamin A deficiencyand its adverse health consequences.
In order to calculate the attributable fraction of an adverse healthoutcome that is due to a risk factor, compatible definitions must be usedwhen estimating the relative risk of the adverse outcome associated withthe risk factor and the prevalence of the risk factor itself in a popula-tion. This stringent requirement for a compatible definition greatly influenced the data that were suitable for use in the CRA project. Themajority of large-scale vitamin A intervention trials involving preschool-age children have been mortality studies that assumed (but did notconfirm for all participants) that the children were mildly deficient (i.e.had low serum retinol concentrations). In general, very few participantsin those studies exhibited eye signs of xerophthalmia, which is consis-tent with the expected epidemiological pattern of vitamin A deficiency.Vitamin A receipt was associated with a lower relative risk of adverseoutcomes in those trials, even among children who had no eye signs ofdeficiency.
After considering the availability of intervention trial data and globalprevalence data for vitamin A deficiency among preschool-age children,a definition of vitamin A deficiency related to low serum retinol con-centrations among children in the 0–4-year age range emerged as themost appropriate choice for use in the CRA project:
• Vitamin A deficient: serum retinol concentration <0.70mmol/l.
• Vitamin A sufficient: serum retinol concentration ≥0.70mmol/l.
2.2 Global prevalence estimates for children
The 1995 WHO report Global prevalence of vitamin A deficiencyincluded prevalence estimates of vitamin A deficiency among preschool-age children for two classes of indicators: (i) clinical eye signs of disease(xerophthalmia); and (ii) low serum retinol concentrations. However,data were reported only for the individual countries that met the defini-
Amy L. Rice et al. 215

tion of a significant public health problem, which was defined as a population prevalence of low serum retinol (<0.70mmol/l) ≥10%, ofnight blindness (XN) >1%, of Bitot’s spots (X1B) >0.5%, of cornealxerosis and/or ulceration (X2, X3A, X3B) >0.01%, or of xerophthalmia-related corneal scars (XS) >0.05% (WHO 1995). Estimates for countriesthat did not meet those definitions were not incorporated into the globalprevalence estimate. A global estimate for the total number of childrenat risk of vitamin A deficiency (~254 million) was generated by addingthe estimated number of children with low serum retinol concentrations(~251 million) and the estimated number with clinical eye signs ofvitamin A deficiency (~3 million).
In 1998, the Micronutrient Initiative, UNICEF and Tulane Universitypublished a joint report reviewing the recent progress of vitamin A inter-vention programme activities (Micronutrient Initiative/UNICEF/TulaneUniversity 1998). To generate prevalence estimates for vitamin A defi-ciency among children, this group used a different approach and devel-oped a modelling process that attempted to take into account the effectsof time trends and vitamin A intervention programmes. Data from asubset of countries that had conducted prevalence surveys since the mid-1980s were used to estimate the regional and global prevalence ofvitamin A deficiency among children. The number of children affectedby low serum retinol concentrations was estimated to range from 75 to140 million, while the number of children with clinical eye signs of defi-ciency was estimated as 3 million. The sizeable discrepancy in the esti-mated prevalence of vitamin A deficiency from these two sources, 254million and 78 to 143 million children, respectively, was due in part todifferences in the data and methodology used, but also to a calculationerror in the WHO report (West 2002).
An updated estimate for the global prevalence of vitamin A deficiencyin children appears in the 2002 publication Extent of vitamin A defi-ciency among preschool children and women of reproductive age (West2002), hereafter referred to as the 2002 West report. A brief descriptionof the methodology used in developing the estimate is described in thischapter in section 3.5. Those prevalence data served as the basis for cal-culating the global burden of disease attributable to vitamin A deficiencyamong children aged 0–4 years for the CRA project.
2.3 Definitions for pregnant women (15–44 years)
In recent years, women of reproductive age have increasingly been recognized as an important group at risk of vitamin A deficiency and the adverse health outcomes associated with this condition (West 2002).However, when compared to preschool-age children, far less informa-tion is available to quantitatively estimate the burden of disease amongwomen. Current areas of active research include assessing the magnitudeof the problem, investigating the causes of deficiency in women, describ-ing the range of associated adverse health outcomes, and identifying
216 Comparative Quantification of Health Risks

appropriate interventions for preventing and treating vitamin A deficiency.
Standardized indicators and definitions of vitamin A deficiency amongwomen are only beginning to be developed. To date, relatively few large-scale surveys have been conducted to estimate the prevalence of vitaminA deficiency in women—primarily in Asia and Africa. Although manysurveys used the presence of night blindness as an indicator of poorvitamin A status among women, some survey data related to low serumretinol and breast milk vitamin A concentrations are also available.However, very few studies have been conducted to date that quantita-tively relate the risk of vitamin A deficiency (defined by any indicator)to adverse health outcomes in women. Despite the inherent limitationsin the current data related to vitamin A deficiency in women, the evi-dence was considered strong enough to generate initial estimates of therelated global burden of disease. Further work in this area of researchwill certainly lead to a refinement of these estimates.
The requirement to have a compatible definition of vitamin A defi-ciency for estimating the relative risk of adverse health outcomes and the global prevalence of vitamin A deficiency among women determined which data were suitable for use in the CRA project. Afterconsidering the availability of intervention trial data and global preva-lence data for vitamin A deficiency in women, a definition related to lowserum retinol concentrations among pregnant women in the 15–44-yearage range emerged as the most appropriate choice for use in the CRAproject.
Estimates for the prevalence of vitamin A deficiency have been gen-erated only for pregnant women in the 15–44-year age range primarilybecause the strongest information is available for this particular groupof women. Future projects that quantify the global burden of diseasemay include non-pregnant and older women as well, if stronger datahave become available for quantitatively estimating the prevalence ofdeficiency and adverse health outcomes in these groups. Vitamin A deficiency in pregnant women aged 15–44 years was operationallydefined as:
• Vitamin A deficient: Serum retinol concentration <0.70mmol/l.
• Vitamin A sufficient: Serum retinol concentration ≥0.70mmol/l.
2.4 Global prevalence estimates for pregnant women
The first comprehensive estimate for the global prevalence of vitamin Adeficiency among women of reproductive age appeared in the 2002 Westreport (West 2002). A brief description of the methodology used in devel-oping the estimate has been described in this chapter in section 3.5.Those prevalence data will serve as the basis for calculating the globalburden of disease attributable to vitamin A deficiency among pregnantwomen aged 15–44 years for the CRA project.
Amy L. Rice et al. 217

3. Adverse health outcomes considered for review
Within the framework of the larger Global Burden of Disease (GBD)project, health states (in this case vitamin A deficiency) can contributedirectly or indirectly to death and disability. The total amount of deathand disability attributed to vitamin A deficiency is therefore a sum of itsdirect and indirect effects. The direct contribution is measured by esti-mating the burden associated with the sequelae assigned to vitamin Adeficiency as defined by the corresponding chapter in the InternationalStatistical Classification of Diseases and Related Health Problems, tenthrevision (ICD-10), whereas the indirect contribution is measured by con-sidering vitamin A deficiency as a risk factor for other causes of deathand disability.
Adverse health outcomes generally associated with micronutrient andmineral deficiencies were initially considered for review in relation tovitamin A deficiency. These included blindness; impaired cognitive func-tion; impaired physical work capacity; morbidity (incidence and/or sever-ity) due to diarrhoea, measles, acute respiratory infections, malaria andother infectious diseases; cause-specific mortality related to these dis-eases; and all-cause mortality. Outcomes potentially associated withvitamin A deficiency in pregnant women included fetal loss, low birthweight, preterm birth, all-cause infant mortality, maternal morbidity andmaternal mortality.
3.1 Selection criteria for adverse health outcomes
The adverse health outcomes selected for review and inclusion in theCRA project were those that fulfilled the following criteria: (i) a healthoutcome included in the 2000 GBD study; (ii) a health outcome wheredata exist to support a probable causal relationship with vitamin A defi-ciency; and (iii) a health outcome where data were available to quanti-tatively estimate the relationship with vitamin A deficiency.
Blindness and an increased risk of all-cause mortality are two of themost well-established adverse outcomes associated with vitamin A defi-ciency in preschool-age children (Sommer 1982; Sommer and West1996). According to recent estimates, vitamin A deficiency that leads tocorneal scarring remains one of the most common preventable causes ofchildhood blindness in developing countries (Gilbert and Foster 2001).In the 1980s, vitamin A supplementation was shown to significantlyreduce all-cause child mortality in a series of eight large-scale trials con-ducted in Asia and Africa. Meta-analyses of those trial data suggest a23% to 34% reduction in all-cause mortality among children 6 monthsto 5 years of age (Beaton et al. 1993; Fawzi et al. 1993; Glasziou andMackerras 1993; Tonascia 1993). Studies that provided vitamin A sup-plements to newborn infants immediately after birth have also demon-strated a reduction in mortality (Humphrey et al. 1996; Tielsch et al.
218 Comparative Quantification of Health Risks

2001), although other trials involving vitamin A supplementation ofyoung infants post-neonatally through five months of age have notshown a survival benefit (Anonymous 1998b; Daulaire et al. 1992; Westet al. 1995).
Blindness was excluded as a health outcome from the risk factoranalysis because in the GBD study, vitamin A-related blindness is considered to be a direct functional outcome of the deficiency, and thedisability associated with blindness was measured in this manner(Murray et al. 1996a, 1996b). In the case of child mortality, the contri-bution of vitamin A deficiency to the global burden of disease was mea-sured primarily through its contribution as a risk factor for several typesof cause-specific mortality, rather than as a risk factor for all-cause mor-tality. However, a small number of child deaths have also been directlyattributed to vitamin A deficiency in the GBD database, because vitaminA deficiency itself appears as the underlying cause of death in some vitalregistration data sets. For this specific cause of death, by definition, thetotal number of deaths in a subregion1 was directly assigned the valueobtained from the relevant child mortality statistics for that subregion(Murray et al. 2001). Thus, for the CRA project the total number ofchild deaths attributable to vitamin A deficiency is the sum of those thatare directly and indirectly attributed to the deficiency.
Five outcomes potentially associated with maternal vitamin A defi-ciency during pregnancy were also excluded from the risk factor analy-sis because the outcomes were not assessed in the 2000 GBD study orthe data were insufficient to quantitatively assess the risk of their occur-rence. These were fetal loss, low birth weight, preterm birth, all-causeinfant mortality and general maternal morbidity (Christian et al. 1998b,2000, 2001; Katz et al. 2000; Semba et al. 1998). Impaired cognitivefunction and impaired physical work capacity were excluded from theanalysis because there is little evidence to suggest a biologically plausi-ble association with vitamin A deficiency, except for the condition ofmaternal night blindness, which appears to limit the time for perform-ing household chores to daylight hours (Christian et al. 1998a). Althoughexperimental animal data and observational human data suggest a bio-logically plausible role for vitamin A deficiency predisposing children toacute respiratory infections (Bloem et al. 1990; Milton et al. 1987;Sommer and West 1996; Sommer et al. 1987), morbidity and cause-specific mortality related to acute respiratory infections were excludedfrom the analysis because the data from controlled intervention trials in humans have not, to date, consistently revealed measurable effects ofvitamin A on incidence, duration or severity of acute respiratory infec-tions (Anonymous 1995).
After excluding those outcomes from the initial list of outcomes underconsideration, the following remained for a more detailed review: (i)morbidity and mortality associated with measles in children; (ii) mor-bidity and mortality associated with diarrhoea in children; (iii) morbid-
Amy L. Rice et al. 219

ity and mortality related to malaria in children; (iv) selected other infec-tious disease causes of death in children (other than measles, diarrhoea,malaria or acute respiratory infections); and (v) all-cause maternal mor-tality. All-cause maternal mortality was a compilation of three separateconditions: maternal sepsis; maternal haemorrhage; and obstructedlabour. These last three outcomes related to maternal mortality wereselected from the limited number of maternal health conditions that arecoded separately in the ICD-10 coding scheme.
The health outcomes selected for children aged <5 years represent the most common preventable causes of death among this age group(Murray et al. 2001). Although some studies have also explored the linkbetween vitamin A and other specific infectious diseases coded as indi-vidual cause of death categories in the GBD study (for examplehelminthic infections and tuberculosis), the strength of the current evidence was considered insufficient to demonstrate a causal link andquantitatively estimate the associated risk with these specific outcomes.HIV/AIDS was also excluded as a quantifiable health outcome for thesame reason. The findings relevant to the outcomes that were chosen forinclusion are presented below.
3.2 Methods for identifying relevant studies and review materials
The following sources were initially consulted to identify relevant materials for this chapter: Medline database; published books aboutvitamin A, international health, and nutrition; International Vitamin AConsultative Group (IVACG) statements; meeting reports; abstracts andconference proceedings; and other non-peer reviewed literature sourcesrelated to vitamin A programme implementation and cost-effectivenessanalyses. The Medline database was searched for literature publishedbetween 1966 and 2001 in English or with an English language abstract.Combinations of the following keywords were used: vitamin A, vitaminA deficiency, blindness, mortality, acute respiratory infection, pneumo-nia, diarrhoea, measles, malaria, stillbirth, fetal loss, miscarriage, lowbirth weight, women.
Abstracts of articles concerning the relationship between vitamin Adeficiency in humans, intervention trials, and the health outcomes ofinterest were reviewed and copies of relevant articles were obtained.Additional publications and reference materials were identified from thecitation lists in those sources and through discussions with investigatorsworking in the field.
3.3 Inclusion criteria for individual studies
The individual studies and reports presented in this chapter wererestricted to the results of controlled intervention trials because thesefindings provide strong evidence for a causal relationship and the data
220 Comparative Quantification of Health Risks

can be used to quantify the risk associated with either documented orsuspected vitamin A deficiency (Rothman and Greenland 1998). For theoutcomes where published meta-analyses or international consensusstatements from IVACG exist, the results from those sources have beenincluded in this chapter rather than a detailed presentation of data fromthe individual trials.
3.4 Description of excluded studies
Numerous observational cohort studies, case–control studies, and case-series investigations have been conducted over the years to explore therelationships between vitamin A and morbidity or mortality from spe-cific diseases in children. However, the results of those studies are notpresented or discussed in detail in this chapter because such designsprovide weaker evidence for a causal relationship as compared to ran-domized controlled intervention trials. Comprehensive reviews of thenumerous cohort studies, case–control studies, and case-series reportsrelated to various adverse health outcomes can be found elsewhere(Bauernfiend 1986; Sommer and West 1996). The findings from inter-vention studies related to vitamin A deficiency and child morbidity havealso been summarized elsewhere (Nalubola and Nestel 1999).
3.5 Estimating risk factor levels
The prevalence of vitamin A deficiency (defined as serum retinol con-centrations <0.70mmol/l) among children aged 0–4 years and pregnantwomen aged 15–44 years was estimated for each of the 14 subregions.This process involved several steps.
First, country-specific prevalence rates were estimated for each one ofthe 191 WHO Member States. Updated country-specific prevalence rateswere obtained from the recent review, 2002 West report (West 2002),which includes the estimated prevalence and number of deficient chil-dren and pregnant women in countries where vitamin A deficiency iseither documented or presumed to exist, based on non-population-basedvitamin A status data or other indirect indicators. Since separate preva-lence estimates were not reported for boys and girls, the same prevalencerate was applied to both of these groups in the CRA project analyses.Next, the prevalence of vitamin A deficiency for the countries notincluded in that review was assumed to be zero. A suitable database was created for analysis and the findings were summarized across the 14subregions.
A detailed description of the methods used to compile the data for the 2002 West report appears in that document (West 2002), but abrief summary is presented here. In addition, a file that contains a com-plete listing of the contributing studies and technical notes associatedwith the 191 countries can be found at http://www.jhsph.edu/chn/ GlobalVAD.html.
Amy L. Rice et al. 221

DATA SOURCES
A wide variety of data sources related to vitamin A deficiency werereviewed in order to obtain the most current information possible. Theseincluded: (i) the 1995 comprehensive survey report compiled by theWHO Micronutrient Deficiency Information System (MDIS) (WHO1995); (ii) a 2001 update from the MDIS group at WHO that includednational survey data published after 1995; (iii) the 1998 report publishedby the Micronutrient Initiative, UNICEF and Tulane University(Micronutrient Initiative/UNICEF/Tulane University 1998), which incor-porated both the 1995 MDIS data and more recent country updates from107 countries with UNICEF offices and programmes; (iv) publishedsurveys and field studies that reported vitamin A status indicators inwomen or children; and (v) unpublished reports, meeting presentationsand personal communication about recent field surveys and studies notincluded in other data sources.
INDICATORS
The 2002 West report presents prevalence data for xerophthalmia ratesand serum retinol concentrations <0.70mmol/l among children and fornight blindness rates and serum retinol concentrations <0.70mmol/l and<1.05mmol/l among populations of pregnant women. Since the CRAproject only utilized serum retinol data, the methodology used to gener-ate xerophthalmia estimates is not discussed further in this chapter.
In preschool-age children the prevalence of serum retinol concentra-tions <0.70mmol/l was directly estimated from survey data wheneverpossible. When such data were unavailable, the prevalence was assigneda value equivalent to the population prevalence of abnormal CIC results.Survey data referring to children in a narrower age than 0–4 years orsurveys that included data that extended slightly beyond the fifth yearof life were used as the prevalence estimate for children aged 0–4 years.
For pregnant women the prevalence of serum retinol concentrations<0.70mmol/l was directly estimated from appropriate survey data when-ever possible. When such data were lacking, the prevalence was assigneda value equivalent to the prevalence among non-pregnant or lactatingwomen in the early postpartum period or a value equivalent to the preva-lence of breast milk retinol concentrations <1.05mmol/l. When serologi-cal or breast milk data were reported as a mean and SD, rather than asa prevalence rate, the prevalence was derived by assuming the data werenormally distributed and calculating the standard normal deviate (z-score) and the probability associated with the area under the left tail ofthe normal curve.
DATA EXTRAPOLATION
Separate algorithms were developed for the different subregions of theworld to estimate the country-specific prevalence estimates for serumretinol concentrations <0.70mmol/l among children and pregnant
222 Comparative Quantification of Health Risks

women (West 2002). In brief, nationally representative survey data, asdeduced from individual reports or stated as such from aggregate WHOor other agency reports, were reported whenever possible. In the absenceof national level data, results from sub-national or smaller surveys wereused and adjustment factors were applied following the precedent of previous analysts (Micronutrient Initiative/UNICEF/Tulane University1998; WHO 1995), although the subjective weight may have changedfrom the previous reports owing to new or reinterpreted results for acountry. For countries where no data were available, estimates were gen-erated by extrapolation in situations where cultural, dietary, demo-graphic, health and development patterns as well as existing rates ofadult and child mortality suggested that vitamin A deficiency is likely to exist. Prevalence rates were extrapolated either by assigning a valuefrom a nearby country with comparable characteristics (primarily in the WHO Region of South-East Asia) or by assigning a median value fromneighbouring country national surveys. Prevalence estimates amongpreschool-age children were also adjusted downwards in countries wherethe survey data preceded coverage reports from recent vitamin A supple-mentation programmes that reported coverage rates >75%. The preva-lence data for women were not adjusted to account for any potentialprogrammatic impact, because although postpartum maternal vitamin Asupplementation programmes are slowly emerging, programmes toprevent vitamin A deficiency during pregnancy are virtually non-existentin the developing world at the present time.
The 2002 West report did not generate prevalence estimates for coun-tries where there was no plausible evidence to suggest the presence ofvitamin A deficiency. Therefore, those subregional prevalence estimatesdo not reflect the contribution of other countries in the world that wereassumed to have a 0% prevalence rate of serum retinol concentrations<0.70mmol/l. Over half of the countries assigned a 0% prevalence rateare located in the subregions classified as EUR-A, EUR-B, EUR-C orAMR-A, where child mortality rates are low (Murray et al. 2001).
The distribution of the 191 countries included in the CRA project isshown in Table 4.1 by the type of survey data used for estimating serumretinol prevalence rates <0.70mmol/l in children. To calculate subregionalprevalence rates of serum retinol concentrations <0.70mmol/l, thenumber of affected individuals was totalled for the countries in each subregion and then divided by the subregional population base. For children <5 years of age, the population base was obtained from the 2001 State of the world’s children report (UNICEF 2001), whichreported data for the year 1999. For pregnant women the annual numberof live births was chosen to represent the population global base for preg-nant women, and data were obtained from the same source (UNICEF2001). The countries that were assigned 0% prevalence accounted foronly approximately 17% of the base population of children (Table 4.2)and pregnant women (Table 4.3).
Amy L. Rice et al. 223

224 Comparative Quantification of Health Risks
Tabl
e 4.
1D
istr
ibut
ion
of 1
91 W
HO
Mem
ber
Stat
es b
y po
pula
tion
grou
p fo
r w
hich
the
pre
vale
nce
of s
erum
ret
inol
conc
entr
atio
ns <
0.70
mmol
/l w
as e
stim
ated
by
subr
egio
n an
d ty
pe o
f da
ta u
sed
to g
ener
ate
subr
egio
nal p
reva
lenc
ees
timat
es
Popu
latio
n gr
oup
Child
ren
(0–4
yea
rs)
Preg
nant
wom
en (
15–4
4 ye
ars)
Impu
ted
No
avai
labl
e su
rvey
Im
pute
d N
o av
aila
ble
surv
eyN
atio
nal
Sub-
natio
nal
prev
alen
ce
data
,ass
igne
d 0%
N
atio
nal
Sub-
natio
nal
prev
alen
ce
data
,ass
igne
d 0%
Subr
egio
nTo
tal
leve
l dat
ale
vel d
ata
estim
ates
>0
prev
alen
ce e
stim
ate
Tota
lle
vel d
ata
leve
l dat
aes
timat
es >
0pr
eval
ence
est
imat
e
AFR
-D26
57
140
261
520
0
AFR
-E20
107
30
203
710
0
AM
R-A
30
00
33
00
03
AM
R-B
269
20
1526
02
915
AM
R-D
64
11
06
01
50
EMR
-B13
11
011
130
00
13
EMR
-D9
23
40
91
35
0
EUR
-A26
00
026
260
00
26
EUR
-B16
10
015
160
00
16
EUR
-C9
00
09
90
00
9
SEA
R-B
32
10
03
03
00
SEA
R-D
73
03
17
22
30
WPR
-A5
00
05
50
00
5
WPR
-B22
52
96
222
212
6
Wor
ld19
142
2434
9119
19
2564
93

Amy L. Rice et al. 225Ta
ble
4.2
Glo
bal p
reva
lenc
e of
ser
um r
etin
ol c
once
ntra
tions
<0.
70mm
ol/l
amon
g ch
ildre
n ag
ed <
5 ye
ars,
by s
ubre
gion
Coun
trie
s w
ith n
o as
signe
d pr
eval
ence
es
timat
es (
prev
alen
ceCo
untr
ies
with
ass
igne
d pr
eval
ence
est
imat
esa
set
to 0
%)
Subr
egio
nal a
nd g
loba
l tot
als
Prev
alen
ce o
f Pr
eval
ence
of
Child
ren
with
ser
um
Child
ren
seru
m r
etin
ol
Child
ren
Child
ren
with
ser
umCh
ildre
n se
rum
ret
inol
retin
ol c
once
ntra
tions
<5 y
ears
conc
entra
tions
<5 y
ears
re
tinol
con
cent
ratio
ns<5
yea
rsco
ncen
tratio
nsSu
breg
ion
Coun
trie
s<0
.70
mmol
/l (0
00s)
(000
s)<0
.70
mmol
/l (%
)Co
untr
ies
(000
s)Co
untr
ies
<0.7
0mm
ol/l
(000
s)(0
00s)
<0.7
0mm
ol/l
(%)
AFR
-D26
1355
247
653
28.4
0N
A26
1355
247
653
28.4
AFR
-E20
1985
356
281
35.3
0N
A20
1985
356
281
35.3
AM
R-A
0N
AN
AN
A3
2188
63
021
886
0.0
AM
R-B
117
010
3825
618
.315
656
526
701
044
821
15.6
AM
R-D
61
209
931
913
.00
NA
61
209
931
913
.0EM
R-B
244
97
412
6.1
119
022
1344
916
434
2.7
EMR
-D9
1221
552
406
23.3
0N
A9
1221
552
406
23.3
EUR
-A0
NA
NA
NA
2621
852
260
2185
20.
0EU
R-B
145
152
29.5
1517
935
1645
1808
70.
2EU
R-C
0N
AN
AN
A9
1256
59
012
565
0.0
SEA
R-B
313
538
2843
447
.60
NA
313
538
2843
447
.6SE
AR
-D7
4227
414
057
530
.10
NA
742
274
140
575
30.1
WPR
-A0
NA
NA
NA
58
019
50
801
90.
0W
PR-B
1617
128
122
006
14.0
63
792
2217
128
125
798
13.6
Wor
ld10
112
727
350
249
425
.390
101
636
191
127
273
604
130
21.1
NA
Not
app
licab
le.
aC
ount
ry-s
peci
fic d
ata
used
to
estim
ate
subr
egio
nal p
reva
lenc
e ra
tes
wer
e ba
sed
on t
he r
evie
w a
rtic
le “
Glo
bal p
reva
lenc
e of
vita
min
A d
efici
ency
am
ong
pres
choo
l chi
ldre
n an
d w
omen
of r
epro
duct
ive
age”
(W
est
2002
).Te
chni
cal n
otes
and
dat
a fo
r in
divi
dual
cou
ntri
es a
re lo
cate
d at
ww
w.jh
sph.
edu/
chn/
Glo
balV
AD
.htm
l.In
the
rev
iew
art
icle
,the
num
ber
of c
hild
ren
with
ser
um r
etin
ol c
once
ntra
tions
<0.
70mm
ol/l
in a
cou
ntry
was
eith
er e
stim
ated
bas
ed o
n ex
istin
g su
rvey
dat
a or
impu
ted
for
coun
trie
s w
here
vita
min
A d
efici
ency
was
like
ly t
o ex
ist
base
d on
cul
tura
l,di
etar
y,de
mog
raph
ic,h
ealth
and
dev
elop
men
t pa
tter
ns a
s w
ell a
s ex
istin
g ra
tes
of c
hild
mor
talit
y.In
ord
er t
o ca
lcul
ate
subr
egio
nal a
nd g
loba
l pre
vale
nce
rate
s fo
rth
e C
RA
pro
ject
,the
pre
vale
nce
estim
ate
was
set
to
0% fo
r th
e re
mai
ning
90
coun
trie
s w
here
no
data
on
pres
choo
l chi
ld v
itam
in A
defi
cien
cy o
r xe
roph
thal
mia
wer
e av
aila
ble,
but
child
hood
vita
min
A d
efici
ency
was
con
side
red
unlik
ely
to e
xist
.The
se a
re a
ll cl
assi
fied
as “
A”
or “
B” a
ccor
ding
to
the
WH
O C
ompa
rativ
e R
isk
Ass
essm
ent
Inde
x (W
HO
200
1):
Reg
ion
of
the
Am
eric
as(n
=18
) Ant
igua
and
Bar
buda
,Arg
entin
a,Ba
ham
as,B
arba
dos,
Can
ada,
Chi
le,C
uba,
Gre
nada
,Guy
ana,
Jam
aica
,Par
agua
y,Sa
int
Kitt
s an
d N
evis
,Sai
nt L
ucia
,Sa
int V
ince
nt a
nd t
he G
rena
dine
s,Su
rina
me,
Trin
idad
and
Tob
ago,
Uni
ted
Stat
es o
f Am
eric
a an
d U
rugu
ay;E
aste
rn M
edit
erra
nean
Reg
ion
(n=
11)
Bahr
ain,
Cyp
rus,
Jord
an,K
uwai
t,Le
bano
n,Li
byan
Ara
b Ja
mah
iriy
a,Q
atar
,Sau
di A
rabi
a,Sy
ria,
Tuni
sia
and
Uni
ted
Ara
b Em
irat
es;E
uro
pean
Reg
ion
(n=
50) A
ll co
untr
ies
wer
e ex
clud
ed,e
xcep
t The
form
er Y
ugos
lav
Rep
ublic
of
Mac
edon
ia;W
este
rn P
acifi
c R
egio
n(n
=11
) Aus
tral
ia,B
rune
i Dar
ussa
lam
,Fiji
,Jap
an,M
ongo
lia,N
auru
,New
Zea
land
,Niu
e,R
epub
lic o
f K
orea
,Sam
oa a
nd S
inga
pore
.

226 Comparative Quantification of Health Risks
3.6 Children (0–4 years)
The subregional and global prevalence rates of serum retinol concentra-tions <0.70mmol/l among children aged 0–4 years are shown in Table4.2. The prevalence estimates from the smaller number of countries thatcontributed to the 2002 West report are compared to the global esti-mates generated for the CRA project. The results indicate that globally,approximately 21% of all children have serum retinol concentrations<0.70mmol/l. The highest prevalence rates and the largest number ofaffected children live in the South-East Asian and African Regions. Theestimated number of affected children is similar to what was reportedby the Micronutrient Initiative, UNICEF and Tulane University group(Micronutrient Initiative/UNICEF/Tulane University 1998).
3.7 Pregnant women (15–44 years)
The subregional and global prevalence rates of serum retinol concentra-tions <0.70mmol/l among pregnant women aged 15–44 years are shownin Table 4.3. The prevalence estimates from the smaller number of countries that contributed to the 2002 West report are compared to theglobal estimates generated for the CRA project. The results indicate thatglobally, approximately 5.6% of all pregnant women have serum retinolconcentrations <0.70mmol/l. Although the prevalence rates among preg-nant women are approximately one-fourth those observed in childrenaged <5 years, a similar risk distribution emerged—with the highestprevalence rates and number of affected women being located in theSouth-East Asian and African Regions. Although the global prevalenceis low, vitamin A deficiency may be an important contributing factor toadverse health outcomes for pregnant women in selected areas of theworld.
3.8 Other groups
There is very little, if any, information available about the global preva-lence of vitamin A deficiency and the associated risk in other populationgroups. Therefore, the prevalence of serum retinol concentrations<0.70mmol/l among children aged ≥5 years, among non-pregnantwomen aged 15–44 years, among men aged 15–44 years, and amongadults aged ≥45 years was not estimated.
4. Assessing causality and quantifying riskfactor–disease relationships
There is often a discrepancy between the problems that motivate a studyand the data available for addressing the issue. This applies to the presentwork, especially when identifying data to be used in estimating the relative risk of adverse health outcomes associated with vitamin A defi-ciency. Ideally, the results of multiple studies would be available for eachoutcome of interest from different countries located in different regions

Amy L. Rice et al. 227
Tabl
e 4.
3G
loba
l pre
vale
nce
of s
erum
ret
inol
con
cent
ratio
ns <
0.70
mmol
/l am
ong
preg
nant
wom
en a
ged
15–4
4 ye
ars,
bysu
breg
ion
Coun
trie
s w
ith n
o as
signe
d pr
eval
ence
estim
ates
(pr
eval
ence
Coun
trie
s w
ith a
ssig
ned
prev
alen
ce e
stim
ates
ase
t to
0%
)Su
breg
iona
l and
glo
bal t
otal
s
Preg
nant
wom
en
Prev
alen
ce o
f Pr
egna
nt w
omen
Prev
alen
ce o
f w
ith s
erum
ret
inol
seru
m r
etin
ol
with
ser
um r
etin
olse
rum
ret
inol
co
ncen
tratio
ns
Live
birt
hsco
ncen
tratio
ns
Live
birt
hsco
ncen
tratio
nsLi
ve b
irths
conc
entra
tions
<0.7
0mm
ol/l
per
year
<0.7
0mm
ol/l
amon
g pe
r ye
ar
<0.7
0mm
ol/l
per
year
<0
.70
mmol
/l am
ong
Subr
egio
nCo
untr
ies
(000
s)(0
00s)
preg
nant
wom
en (
%)
Coun
trie
s(0
00s)
Coun
trie
s(0
00s)
(000
s)pr
egna
nt w
omen
(%
)
AFR
-D26
101
111
185
9.0
0N
A26
101
111
185
9.0
AFR
-E20
144
113
240
10.9
0N
A20
144
113
240
10.9
AM
R-A
0N
AN
AN
A3
423
83
04
238
0.0
AM
R-B
1128
27
956
3.5
151
348
2628
29
304
3.0
AM
R-D
693
201
14.
60
NA
693
201
14.
6EM
R-B
0N
AN
AN
A13
341
013
03
410
0.0
EMR
-D9
938
1200
37.
80
NA
993
812
003
7.8
EUR
-A0
NA
NA
NA
264
233
260
423
30.
0EU
R-B
0N
AN
AN
A16
374
316
03
743
0.0
EUR
-C0
NA
NA
NA
92
527
90
252
70.
0SE
AR
-B3
538
593
39.
10
NA
353
85
933
9.1
SEA
R-D
71
714
3027
95.
70
NA
71
714
3027
95.
7W
PR-A
0N
AN
AN
A5
162
95
01
629
0.0
WPR
-B16
124
024
806
5.0
676
122
124
025
567
4.8
Wor
ld98
725
710
741
36.
893
2188
919
17
257
129
302
5.6
NA
Not
app
licab
le.
aC
ount
ry-s
peci
fic d
ata
used
to
estim
ate
regi
onal
pre
vale
nce
rate
s w
ere
base
d on
the
rev
iew
art
icle
“G
loba
l pre
vale
nce
of v
itam
in A
defi
cien
cy a
mon
g pr
esch
ool c
hild
ren
and
wom
en o
fre
prod
uctiv
e ag
e” (
Wes
t 20
02).
Tech
nica
l not
es a
nd d
ata
for
indi
vidu
al c
ount
ries
are
loca
ted
at w
ww
.jhsp
h.ed
u/ch
n/G
loba
lVA
D.h
tml.
In t
he r
evie
w a
rtic
le t
he n
umbe
r of
pre
gnan
tw
omen
age
d 15
–45
year
s w
ith s
erum
ret
inol
con
cent
ratio
ns <
0.70
mmol
/l in
a c
ount
ry w
as e
ither
est
imat
ed b
ased
on
exis
ting
surv
ey d
ata
or im
pute
d fo
r co
untr
ies
whe
re m
ater
nal
vita
min
A d
efici
ency
was
like
ly t
o ex
ist
base
d on
cul
tura
l,di
etar
y,de
mog
raph
ic,h
ealth
and
dev
elop
men
t pa
tter
ns a
s w
ell a
s ex
istin
g ra
tes
of a
dult
and
child
mor
talit
y.In
ord
er t
oca
lcul
ate
subr
egio
nal a
nd g
loba
l pre
vale
nce
rate
s fo
r th
e C
RA
pro
ject
,the
pre
vale
nce
estim
ate
was
set
to
0% fo
r th
e re
mai
ning
93
coun
trie
s,w
here
no
prev
alen
ce d
ata
on m
ater
nal
vita
min
A d
efici
ency
or
nigh
t bl
indn
ess
wer
e av
aila
ble,
but
mat
erna
l vita
min
A d
efici
ency
was
con
side
red
unlik
ely
to e
xist
.The
se a
re a
ll cl
assi
fied
as “
A”
or “
B” a
ccor
ding
to
the
WH
OC
ompa
rativ
e R
isk
Ass
essm
ent
Inde
x (W
HO
200
1):R
egio
n o
f th
e A
mer
icas
(n=
18) A
ntig
ua a
nd B
arbu
da,A
rgen
tina,
Baha
mas
,Bar
bado
s,C
anad
a,C
hile
,Cub
a,G
rena
da,G
uyan
a,Ja
mai
ca,P
arag
uay,
Sain
t K
itts
and
Nev
is,S
aint
Luc
ia,S
aint
Vin
cent
and
the
Gre
nadi
nes,
Suri
nam
e,Tr
inid
ad a
nd T
obag
o,U
nite
d St
ates
and
Uru
guay
;Eas
tern
Med
iter
rane
an R
egio
n(n
=13
) Ba
hrai
n,C
ypru
s,Ir
an,J
orda
n,K
uwai
t,Le
bano
n,Li
byan
Ara
b Ja
mah
iriy
a,O
man
,Qat
ar,S
audi
Ara
bia,
Syri
a,Tu
nisi
a an
d U
nite
d A
rab
Emir
ates
;Eur
ope
an R
egio
n(n
=51
) All
coun
trie
s w
ere
excl
uded
;Wes
tern
Pac
ific
Reg
ion
(n=
11) A
ustr
alia
,Bru
nei D
arus
sala
m,F
iji,J
apan
,Mon
golia
,Nau
ru,N
ew Z
eala
nd,N
iue,
Rep
ublic
of
Kor
ea,S
amoa
and
Sin
gapo
re.

of the world. This would allow the subregional estimates to be based onempirical data for each location. However, this type of data is simply notavailable. In the absence of such information the best data possibleshould be compiled and any important limitations recognized. There areseveral important limitations of the data and methodology used to esti-mate risk estimates for this project that deserve comment.
First, no definitive criteria exist for determining with certainty whetheror not a particular risk factor is causally related to an adverse healthoutcome. However, many investigators have adopted the general princi-ples that were originally proposed by Hill for use as guidelines whenevaluating potential causal relationships (Hill 1965). A review of vitaminA studies conducted using different designs reveals that many of thesegeneral principles hold true when the entire body of evidence is consid-ered together. However, experimental evidence—in this case the demon-stration that a vitamin A-related intervention prevents an adverse healthoutcome—provides some of the strongest evidence for a causal relation-ship. Therefore, the present review has been restricted to the results ofrandomized placebo-controlled vitamin A intervention trials conductedin areas with either documented or suspected vitamin A deficiency. Theinference commonly made from such a study is that if the vitamin Aintervention prevents the occurrence of an adverse health outcome, thenvitamin A deficiency is causally associated with it.
The design used for the prospective trials of vitamin A and child mortality was to assign the participants to either a vitamin A or controlgroup, to implement the intervention, and to then follow the participantsover time. Aside from observing the presence of clinical eye signs of deficiency, the vitamin A status (serum retinol concentration) of each and every participant was not assessed. The baseline vitamin A status of the populations under study was either inferred from prior survey data gathered in the same subregion or from a subset of the study participants.
Second, the risk estimates reported in the original publications ofvitamin A and child mortality represent the protective effect of thevitamin A interventions against adverse health outcomes, rather than therelative risk of an adverse outcome associated with vitamin A deficiencyper se. The risk of an adverse outcome was estimated from the originaltrial results as the inverse of the protective relative risk (= 1/protectiverelative risk). The following assumptions were made when using theintervention trial data in this manner: (i) that all children participatingin the trials were vitamin A deficient at the beginning of the interventionperiod; and (ii) that the deficiency was corrected in all children assignedto the intervention group, while those in the placebo group remaineddeficient. Neither of these assumptions is likely to have been met in allof the trials. Thus the unadjusted risk estimates from the trials mayunderestimate the true relationship between vitamin A deficiency and anadverse health outcome.
228 Comparative Quantification of Health Risks

Finally, the data from the original intervention trials were analysed on an intention-to-treat basis, rather than on the basis of achieved com-pliance. In reality both compliance and the biological efficacy of the particular intervention under study would influence the measured rela-tionship between the vitamin A intervention and an adverse healthoutcome. Secondary analyses from one of the child mortality studies thattook actual compliance into account estimated a far greater reduction inall-cause mortality than was observed in the original intention-to-treatanalysis (Sommer and Zeger 1991).
On the other hand, the summary risk estimates from the meta-analyses of the individual intervention trials conducted in a variety ofcountries provide a certain level of built-in control for unmeasuredfactors that may have differed across sites. The United Nations Admin-istrative Committee on Coordination/Subcommittee on Nutrition(ACC/SCN) meta-analysis of the child mortality trials examined theeffect of age and sex on observed mortality and concluded there wereno significant differences of vitamin A supplementation on all-cause mor-tality between males and females or by age category for children between6 months and 5 years of age (Beaton et al. 1993). In addition, there wasno detectable relationship between the effects of the vitamin A inter-vention and anthropometric status on child mortality.
For the purpose of the CRA project, relative risk estimates for childand maternal health outcomes used vitamin A intervention trial data asthe starting point. However, the relative risk estimates were adjusted totake into account the fact that many, but not all, of the study partici-pants had low serum retinol concentrations at the beginning of the inter-vention trials. The following section describes how the adjustmentprocess was conducted. The same process was applied to data for boththe child and maternal health outcomes.
The adjusted relative risks were calculated using a four-step process.
1. A quantitative estimate of the protective effect that a vitamin A inter-vention had in preventing an adverse health outcome was found inthe published literature.
2. The prevalence of serum retinol concentrations <0.70mmol/l was esti-mated among the study population at baseline.
3. An adjusted relative risk was calculated by constructing a hypotheti-cal population of 100000 individuals and dividing them into twostrata using a serum retinol concentration cut-off of <0.70mmol/l andthe prevalence estimate obtained in the second step. The relative riskof an adverse outcome was then calculated for both strata separatelyby setting the background incidence rate of the adverse outcome tobe equivalent among the following groups: (i) the vitamin A inter-vention group in the entire study population; (ii) the vitamin A intervention and control groups in the strata with serum retinol con-
Amy L. Rice et al. 229

centrations ≥0.70mmol/l; and (iii) the vitamin A intervention group inthe stratum with serum retinol concentrations <0.70mmol/l. The rel-ative risk for children in the stratum with serum retinol concentra-tions ≥0.70mmol/l represents the effect of the vitamin A interventionamong children who were not deficient before the trial began. In thisstratum the relative risk is 1.0 because those children were notexpected to benefit (in terms of reducing all-cause mortality) from theintervention. The relative risk for children in the other stratum islower than the overall trial estimate (representing a greater protectiveeffect) because those children were deficient when the trial began andall of the observed benefit (in terms of reducing all-cause mortality)associated with the vitamin A intervention was presumably observedamong this subgroup of children.
4. The final step in the adjustment process was to calculate the relativerisk of all-cause mortality associated with vitamin A deficiency by cal-culating the inverse of the adjusted protective effect (= 1/protectiverelative risk). See Table 4.4 for an example calculation based on a23% reduction in child deaths (protective relative risk of 0.77) asso-ciated with a vitamin A intervention and a 41% baseline prevalencerate of serum retinol concentrations <0.70mmol/l in the study popu-lation. In this example, the originally reported protective effect asso-ciated with the vitamin A intervention is a relative risk of 0.77; theadjusted protective relative risk associated with the vitamin A inter-vention is 0.58 (equivalent to a 42% reduction in child deaths); andthe adjusted relative risk of child death associated with vitamin A deficiency is 1.72.
This adjustment process requires estimates for the baseline serumretinol concentrations <0.70mmol/l for the populations contributing re-lative risk data to each adverse heath outcome. The baseline prevalenceestimates are shown in Table 4.5. For some, but not all, adverse healthoutcomes, baseline prevalence data were directly available from the pub-lished reports that contributed relative risk estimates to the adjustmentprocess. In other cases, the prevalence rates were extrapolated accord-ingly. The process used to derive prevalence rates for each includedadverse health outcome is described below.
In order to derive estimates for the measles, diarrhoea, malaria andother infectious disease causes of death and disability in children attrib-utable to vitamin A deficiency, it was necessary to estimate a single under-lying prevalence of deficiency that existed in the southern Asian andAfrican populations in which eight large community-based, vitamin Achild-mortality intervention trials were conducted. Knowing a single,underlying prevalence of deficiency across these diverse trial populationsreveals the background burden of vitamin A deficiency that is under-stood to account for the overall estimated reduction of 23% in
230 Comparative Quantification of Health Risks

Amy L. Rice et al. 231
Tabl
e 4.
4Ex
ampl
e of
how
to
calc
ulat
e th
e ad
just
ed r
elat
ive
risk
of
child
dea
th a
ssoc
iate
d w
ith v
itam
in A
defi
cien
cy a
ssum
ing
apu
blis
hed
rela
tive
risk
of
0.77
for
child
sur
viva
l ass
ocia
ted
with
the
rec
eipt
of
vita
min
A in
a c
ontr
olle
d in
terv
entio
ntr
ial a
nd a
41%
bas
elin
e pr
eval
ence
rat
e of
‘vita
min
A d
efici
ency
’ am
ong
the
child
ren
(defi
ned
as s
erum
ret
inol
conc
entr
atio
ns <
0.70
mmol
/l)
Prot
ectiv
e %
red
uctio
n in
dea
ths
due
toSt
udy
popu
latio
nD
ied
Surv
ived
Tota
lIn
ciden
ce o
f de
ath
rela
tive
risk
vitam
in A
inte
rven
tion
Entir
e st
udy
popu
latio
nV
itam
in A
gro
up38
549
615
5000
00.
0077
0.77
23C
ontr
ol g
roup
500
4950
050
000
0.01
00To
tal
885
9911
510
000
0
Child
ren
with
ser
um r
etin
ol c
once
ntra
tions
≥0.
70mm
ol/l
Vita
min
A g
roup
227
2927
329
500
0.00
771.
000
Con
trol
gro
up22
729
273
2950
00.
0077
Tota
l45
458
456
5900
0
Child
ren
with
ser
um r
etin
ol c
once
ntra
tions
<0.
70mm
ol/l
Vita
min
A g
roup
158
2034
220
500
0.00
770.
58a
42C
ontr
ol g
roup
273
2027
220
500
0.01
33To
tal
431
4056
941
000
aIn
the
exa
mpl
e ab
ove
the
rela
tive
risk
of
child
dea
th a
ssoc
iate
d w
ith v
itam
in A
defi
cien
cy w
as c
alcu
late
d by
usi
ng a
n ov
eral
l obs
erve
d re
lativ
e ri
sk o
f ch
ild s
urvi
val a
ssoc
iate
d w
ith r
ecei
ptof
vita
min
A (
0.77
) an
d es
timat
ing
the
rela
tive
risk
of
child
sur
viva
l am
ong
the
59%
of
child
ren
who
had
ser
um r
etin
ol c
once
ntra
tions
≥0.
70mm
ol/l
(1.0
0) a
nd t
he 4
1% o
f ch
ildre
n w
ithco
ncen
trat
ions
bel
ow t
hat
cut-
off
(0.5
8).T
he r
elat
ive
risk
of
child
dea
th a
ssoc
iate
d w
ith v
itam
in A
defi
cien
cy w
as t
hen
calc
ulat
ed a
s 1.
72,w
hich
equ
als
the
inve
rse
of t
he p
rote
ctiv
e ef
fect
amon
g “v
itam
in A
defi
cien
t” c
hild
ren
who
rec
eive
d vi
tam
in A
:1.7
2 [1
.00/
0.58
].

preschool-age child mortality achieved with vitamin A interventions(Beaton et al. 1993).
An overall background prevalence of serum retinol concentrations<0.70mmol/l was derived by estimating the size and prevalence ofvitamin A deficiency for each national or regional population judged tobe represented by each intervention trial (Table 4.6). The prevalence ratefor each country as available, was applied to the estimated number ofpreschool-age children in order to estimate the number of vitamin A defi-cient preschool-age children in each population represented by a trial.These steps resulted in a subjective re-weighting of the sizes of the pop-ulations at-risk in each area that were independent of sample sizes foreach trial. Finally, numbers of deficient children in each population rep-resented by a trial were summed and divided by the sum of the popula-tion estimates of children aged <5 years, resulting in a prevalence thatis, roughly, weighted by the sizes of populations at risk that were repre-sented by the trials. This exercise produced prevalence rates of serumretinol <0.70mmol/l that ranged from 28% in the Sudan, to 72% as mea-sured during a vitamin A child mortality trial in Ghana (Ghana VASTStudy Team 1993). An estimated 19 million children, or 41%, amongthe estimated 46.5 million children living in areas at risk of vitamin Adeficiency, representing the underlying, local populations of interest,were considered to be vitamin A deficient. In the absence of additionaldata, this underlying prevalence was further judged to represent theunderlying pool of deficient children for whom death from severeepisodes of diarrhoea, measles and other non-malarial infectious diseaseillnesses could be averted each year with vitamin A.
232 Comparative Quantification of Health Risks
Table 4.5 Estimated baseline prevalence of serum retinolconcentrations <0.70mmol/l in the intervention studies usedto estimate the relative risk of cause-specific mortalityassociated with vitamin A deficiencya
Estimated baseline prevalence of serum retinol concentrations <0.70 m/l in
Cause of death the intervention trials (%) Data source
ChildrenDiarrhoea 41 See Table 4.6Measles 41 See Table 4.6Malaria 55 See Table 1 in Shankar et al. (1999)Other infectious causes 41 See Table 4.6
WomenMaternal conditions 19 See Table 2 in West et al. (1999)
a The cause of death outcomes were defined using the following GBD codes: measles (U015); diarrhoea(U010); malaria (U020); other infectious causes (U037); all-cause maternal mortality corresponds to theGBD code for maternal conditions (U042).

Amy L. Rice et al. 233
Table 4.6 Baseline prevalence estimates for serum retinolconcentrations <0.70mmol/l among populations of childrenaged <5 years from eight vitamin A intervention trials, bycountry
Population Prevalence of serum Number of vitamin<5 years of agea retinol concentations A-deficient children
Host country (000s) <0.70 mmol/l (000s)
Ghana, Kitampo 1063b 0.72c 765
India, Andra 8709d 0.31e 2700Pradhesh
India, Tamil Nadu 7143d 0.37f 2643
Indonesia 22006g 0.48h 10563
Nepal 3485i 0.35j 1220
Sudan 4162k 0.28l 1165
Total/Overall 46567 0.41m 19055
a Based on Table 1 of the State of the world’s children’s report (UNICEF 2001), unless otherwise noted.b Given that the vitamin A trial in Ghana (Ghana VAST Study Team 1993) was carried out in the central
part of the country, which is considered to be at higher risk than the southern, palm-oil consumingareas of the country, only one-third of the Ghanaian child population <5 years of age (3 189 000,UNICEF 2001) was considered to be represented by children in the trial.
c D Ross et al., personal communication, 1995, reported in Sommer and West (1996).d Based on government of India census data for 2001 indicating 11.5% of the country’s rural population
was <5 years, applied to statewide census estimates for both Tamil Nadu and Andra Pradesh; statewidepopulations were assumed to represent the at-risk population for each trial.
e In the absence of serum retinol data from the trial or from representative population surveys of AndraPradesh, a prevalence of 31% (West 2002) was applied to the state population.
f Rahmathullah et al. (1990).g Indonesia is represented by its entire population given that the two mortality trials carried out in Aceh
(Sommer et al. 1986) and West Java (Muhilal et al. 1988) were conducted in the north and central partsof the country, respectively.
h Prevalence based on the West Java trial (Muhilal et al. 1988) was assumed to represent Aceh and therest of Indonesia in the early-mid-1980s, amidst evidence of higher subsequent prevalence rates(Kjolhede et al. 1995; West 2002).
i Because two population-based trials (Daulaire et al. 1992; West et al. 1991) were conducted in diverseand different parts of the country, the entire population of Nepalese preschool children (UNICEF 2001)was considered to be the underlying population at risk.
j In the absence of biochemical data from either child mortality trial in Sarlahi (West et al. 1991) or Jumla(Daulaire et al. 1992), a prevalence of 35% obtained from the 1998 National Micronutrient Survey(Anonymous 1998a) was taken to represent the prevalence during both trials and for the country.
k In the absence of risk differentials across different population groups of the Sudan, the entire populationwas assumed to be represented by children in the trial (Herrera et al. 1992).
l Median prevalence (28%) of distribution of 33 national prevalence estimates obtained for African andEastern Mediterranean Regions was assumed to represent the status of Sudanese preschool children.
m Calculated by dividing 19 055 by 46 567.
A prevalence of 55% was assigned for populations of preschool-agechildren whose risk of death and disability due to Plasmodium falci-parum malaria could be averted by vitamin A supplementation. Thisprevalence estimate was based on the data reported in Table 1 from a

single, community-based randomized trial in Papua New Guinea thatmeasured effects of vitamin A supplementation on P. falciparum malariaclinic attack rates (Shankar et al. 1999). The assigned prevalence ratewas calculated based on the published mean and standard deviationserum retinol concentration for the population at baseline and applyingan assumption of normally distributed data.
A prevalence of 19% was assigned to represent populations of preg-nant women living in areas of the world where risk of mortality may bereduced by approximately 40% with improved, regular, supplementalintakes of vitamin A, based on the data reported in Table 2 from a single,large randomized community recently conducted in rural Nepal (West et al. 1999). The same overall adjustment process was used to calculateadjusted relative risks of adverse health outcomes for each of theincluded child and maternal health outcomes. For the child health out-comes, the same adjusted relative risk was reported for children aged0–4 years (boys and girls) for all regions of the world.
5. Risk factor–disease outcome relationshipsThe following section describes the individual studies that were used toevaluate and quantify the relative risk of an adverse health outcome asso-ciated with vitamin A deficiency. The intervention trials and results arereported separately for children aged 0–4 years and pregnant womenaged 15–44 years. Insufficient data were available to quantitatively eval-uate the risks of vitamin A deficiency in other population groups. Table4.7 describes the individual studies that were used to estimate the rela-tive risk of adverse health outcomes for the CRA project with respect tovitamin A. The studies are listed in the same order that the outcomes arediscussed in the chapter. Mortality associated with measles and diar-rhoeal disease in children appears first, followed by malaria incidenceand malaria mortality in children, mortality associated with other infec-tious causes of death in children, and finally all-cause maternal mortal-ity among pregnant women.
Unless otherwise noted, the risk estimates cited for individual studiesare the findings that were originally reported in the literature and rep-resent the protective effect of the vitamin A intervention against adversehealth outcomes. An adjusted relative risk was calculated from these datato represent the risk of adverse health outcomes associated with vitaminA deficiency following the procedure described in section 4.
5.1 Risk estimates for preschool children (0–4 years)
Preschool-age children have traditionally been considered to be a high-risk group for vitamin A deficiency and its consequences. Most of thelarge-scale controlled intervention trials that have been conducted weredesigned to explore the relationships between vitamin A supplementa-tion, morbidity and mortality among children aged <6 years.
234 Comparative Quantification of Health Risks

Amy L. Rice et al. 235
Tabl
e 4.
7St
udie
s us
ed t
o es
timat
e th
e re
lativ
e ri
sk o
f ad
vers
e he
alth
out
com
es fo
r th
e C
RA
pro
ject
,by
outc
omea
Out
com
e(R
efer
ence
)St
udy
desig
nLo
catio
nSt
udy
popu
latio
n
Child
ren
Mea
sles
mo
rtal
ity
(Bea
ton
et a
l.19
93)
Met
a-an
alys
is o
f ra
ndom
ized
,4
tria
ls (
Gha
na;I
ndia
;Sar
lahi
,C
hild
ren
6–60
mon
ths
plac
ebo-
cont
rolle
d vi
tam
in A
N
epal
;Jum
la,N
epal
)su
pple
men
tatio
n tr
ials
Ori
gina
l stu
dies
incl
uded
in t
he m
eta-
anal
ysis
:(G
hana
VA
ST S
tudy
Tea
m 1
993)
Larg
e do
se v
itam
in A
eve
ry 4
mon
ths
Gha
naC
hild
ren
6–90
mon
ths
(Rah
mat
hulla
h et
al.
1990
)R
DA
of
vita
min
A in
wee
kly
dose
sIn
dia
Chi
ldre
n 6–
60 m
onth
s(W
est
et a
l.19
91)
Larg
e do
se v
itam
in A
eve
ry 4
mon
ths
Sarl
ahi,
Nep
alC
hild
ren
6–72
mon
ths
(Dau
lair
e et
al.
1992
)La
rge
dose
vita
min
A o
nce
with
a
Jum
la,N
epal
Chi
ldre
n 1–
59 m
onth
s5
mon
th fo
llow
-up
Dia
rrho
ea m
ort
alit
y(B
eato
n et
al.
1993
)M
eta-
anal
ysis
of
rand
omiz
ed,
5 tr
ials
(G
hana
;Ind
ia;S
arla
hi,
Chi
ldre
n 6–
60 m
onth
spl
aceb
o-co
ntro
lled
vita
min
A
Nep
al;J
umla
,Nep
al;S
udan
supp
lem
enta
tion
tria
ls
Ori
gina
l stu
dies
incl
uded
in t
he m
eta-
anal
ysis
:(G
hana
VA
ST S
tudy
Tea
m 1
993)
Larg
e do
se v
itam
in A
eve
ry 4
mon
ths
Gha
naC
hild
ren
6–90
mon
ths
(Rah
mat
hulla
h et
al.
1990
)R
DA
of
vita
min
A in
wee
kly
dose
sIn
dia
Chi
ldre
n 6–
60 m
onth
s(W
est
et a
l.19
91)
Larg
e do
se v
itam
in A
eve
ry 4
mon
ths
Sarl
ahi,
Nep
alC
hild
ren
6–72
mon
ths
(Dau
lair
e et
al.
1992
)La
rge
dose
vita
min
A o
nce
with
a
Jum
la,N
epal
Chi
ldre
n 1–
59 m
onth
s5
mon
th fo
llow
-up
(Her
rera
et
al.1
992)
Larg
e do
se v
itam
in A
eve
ry 4
mon
ths
Suda
nC
hild
ren
9–72
mon
ths cont
inue
d
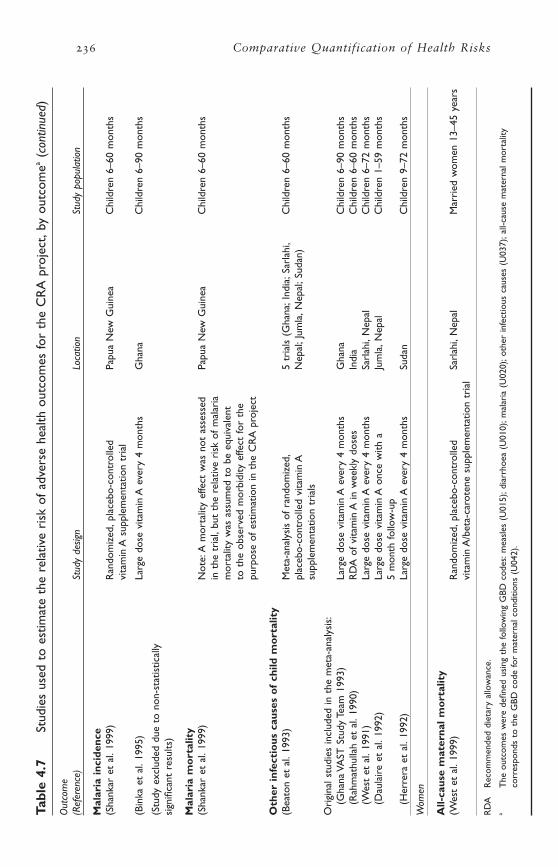
236 Comparative Quantification of Health RisksTa
ble
4.7
Stud
ies
used
to
estim
ate
the
rela
tive
risk
of
adve
rse
heal
th o
utco
mes
for
the
CR
A p
roje
ct,b
y ou
tcom
ea(c
ontin
ued)
Out
com
e(R
efer
ence
)St
udy
desig
nLo
catio
nSt
udy
popu
latio
n
Mal
aria
inc
iden
ce(S
hank
ar e
t al
.199
9)R
ando
miz
ed,p
lace
bo-c
ontr
olle
d Pa
pua
New
Gui
nea
Chi
ldre
n 6–
60 m
onth
svi
tam
in A
sup
plem
enta
tion
tria
l
(Bin
ka e
t al
.199
5)La
rge
dose
vita
min
A e
very
4 m
onth
sG
hana
Chi
ldre
n 6–
90 m
onth
s
(Stu
dy e
xclu
ded
due
to n
on-s
tatis
tical
ly
sign
ifica
nt r
esul
ts)
Mal
aria
mo
rtal
ity
(Sha
nkar
et
al.1
999)
Not
e:A
mor
talit
y ef
fect
was
not
ass
esse
d Pa
pua
New
Gui
nea
Chi
ldre
n 6–
60 m
onth
sin
the
tri
al,b
ut t
he r
elat
ive
risk
of
mal
aria
m
orta
lity
was
ass
umed
to
be e
quiv
alen
t
to t
he o
bser
ved
mor
bidi
ty e
ffect
for
the
pu
rpos
e of
est
imat
ion
in t
he C
RA
pro
ject
Oth
er i
nfec
tio
us c
ause
s o
f ch
ild m
ort
alit
y(B
eato
n et
al.
1993
)M
eta-
anal
ysis
of
rand
omiz
ed,
5 tr
ials
(G
hana
;Ind
ia;S
arla
hi,
Chi
ldre
n 6–
60 m
onth
spl
aceb
o-co
ntro
lled
vita
min
A
Nep
al;J
umla
,Nep
al;S
udan
)su
pple
men
tatio
n tr
ials
Ori
gina
l stu
dies
incl
uded
in t
he m
eta-
anal
ysis
:(G
hana
VA
ST S
tudy
Tea
m 1
993)
Larg
e do
se v
itam
in A
eve
ry 4
mon
ths
Gha
naC
hild
ren
6–90
mon
ths
(Rah
mat
hulla
h et
al.
1990
)R
DA
of
vita
min
A in
wee
kly
dose
sIn
dia
Chi
ldre
n 6–
60 m
onth
s(W
est
et a
l.19
91)
Larg
e do
se v
itam
in A
eve
ry 4
mon
ths
Sarl
ahi,
Nep
alC
hild
ren
6–72
mon
ths
(Dau
lair
e et
al.
1992
)La
rge
dose
vita
min
A o
nce
with
a
Jum
la,N
epal
Chi
ldre
n 1–
59 m
onth
s5
mon
th fo
llow
-up
(Her
rera
et
al.1
992)
Larg
e do
se v
itam
in A
eve
ry 4
mon
ths
Suda
nC
hild
ren
9–72
mon
ths
Wom
en
All-
caus
e m
ater
nal
mo
rtal
ity
(Wes
t et
al.
1999
) R
ando
miz
ed,p
lace
bo-c
ontr
olle
d Sa
rlah
i,N
epal
Mar
ried
wom
en 1
3–45
yea
rsvi
tam
in A
/bet
a-ca
rote
ne s
uppl
emen
tatio
n tr
ial
RD
AR
ecom
men
ded
diet
ary
allo
wan
ce.
aT
he o
utco
mes
wer
e de
fined
usi
ng t
he fo
llow
ing
GBD
cod
es:m
easl
es (
U01
5);d
iarr
hoea
(U
010)
;mal
aria
(U
020)
;oth
er in
fect
ious
cau
ses
(U03
7);a
ll-ca
use
mat
erna
l mor
talit
yco
rres
pond
s to
the
GBD
cod
e fo
r m
ater
nal c
ondi
tions
(U
042)
.
In the early 1990s the ACC/SCN commissioned a review of the exist-ing scientific evidence to assess the effectiveness of vitamin A supple-mentation on child mortality and morbidity (Beaton et al. 1993). Thefindings from ten different community-based mortality trials conductedin Africa (Ghana and the Sudan), the Americas (Haiti) and Asia (India,Indonesia and Nepal), and 20 different morbidity trials conductedaround the world were considered for inclusion in a formal meta-analysis. Sufficient data were available from five of the mortality trials(Daulaire et al. 1992; Fawzi et al. 1993; Ghana VAST Study Team 1993;Rahmathullah et al. 1990; West et al. 1991) to assess the relationshipbetween vitamin A interventions and cause-specific mortality frommeasles, diarrhoea and respiratory illness. Separate relative risks werereported in the meta-analysis of these studies for all-cause mortality, mortality attributed to these three specific causes and mortality attrib-uted to all other causes combined.
All five of those mortality trials were conducted in populations wherevitamin A deficiency (both clinical and subclinical) was prevalent(assessed either as high rates of xerophthalmia or low serum retinol con-centrations). In four of the trials (one in Ghana, two in Nepal and onein the Sudan), the intervention consisted of vitamin A supplementationin age appropriate doses (200000 IU for children ≥12 months of age,100000 IU for children 6 to 11 months of age and, for one trial in Nepal,100000 IU for infants 1 to 11 months of age and 50000 IU for infants<1 month of age) every 4–6 months. In India, the intervention was aweekly supplement that contained a weekly RDA of vitamin A. In theGhana, India and Nepal trials, a statistically significant reduction in all-cause mortality was observed among children in the vitamin A inter-vention group. No statistically significant effect on all-cause mortalitywas observed in the Sudan.
MEASLES
Measles (and thus measles-related mortality) have nearly been eliminatedin the Americas due to the implementation of successful measles controlprogrammes over the past ten years (Hersh et al. 2000). At present, thehighest rates of measles mortality occur among children aged <1 year indeveloping countries. Although unvaccinated children aged >10 yearsand adults are also susceptible to measles and measles mortality, esti-mates for the burden of disease associated with vitamin A deficiency wererestricted to children aged 0–4 years for the CRA analysis.
Incidence and morbidity
Measles is a highly infectious disease caused by the measles virus (Reingold and Phares 2001). Although vitamin A is involved in differ-ent aspects of the immune defence system, there is little evidence tosuggest that vitamin A status affects the incidence of measles. Therefore,
Amy L. Rice et al. 237

the relative risk of experiencing a measles episode associated withvitamin A deficiency was not calculated for the CRA analysis.
Mortality
Vitamin A deficiency appears to increase the risk of measles-related mor-tality. The ACC/SCN meta-analysis of the four prospective community-based trials with information on measles (Ghana, India and two inNepal) suggests that vitamin A supplementation was associated with a26% overall reduction in measles mortality (RR = 74, 95% CI0.53–1.04) (Beaton et al. 1993). In the individual trials, the reduction inmeasles mortality ranged from 18% in Ghana to 75% in Sarlahi, Nepal(Sommer and West 1996). A more recent study from Ghana found nodifference in the acute measles case-fatality rate between vitamin A sup-plemented and placebo groups (Dollimore et al. 1997). Vitamin A sup-plementation, however, has been found to reduce measles severity. Insome (Coutsoudis et al. 1991; Ellison 1932; Hussey and Klein 1990) butnot all (Rosales et al. 1996) hospital-based treatment trials, the surviv-ing children who had received vitamin A experienced complications lessfrequently and recovered faster than their counterparts who receivedplacebo treatment. These findings provide supporting evidence for acausal relationship between vitamin A deficiency and measles mortality.
The relative risk of measles (GBD code U015) mortality among children aged 0–4 years with vitamin A deficiency was estimated for theCRA project from the protective effect of vitamin A interventions (RR= 0.74, 95% CI 0.53–1.04) observed in the ACC/SCN meta-analysis ofcommunity-based trials and a 41% estimated baseline prevalence rate ofserum retinol concentrations <0.70mmol/l among those study popula-tions. The adjusted relative risk estimate derived from those data isRR = 1.86 (95% CI 1.32–2.59). The calculations are shown in Table 4.8.
DIARRHOEA
Diarrhoea and diarrhoea-related mortality are prevalent amongpreschool-age children, particularly in low income countries. The globalburden of disease related to diarrhoea mortality is widely distributedaround the world.
Incidence and morbidity
Diarrhoeal disease can be caused by a variety of bacterial, viral and par-asitic agents (Reingold and Phares 2001). Although vitamin A is involvedin different aspects of the immune defence system, including the main-tenance of the epithelial cell border in the intestinal tract, there is littleevidence from intervention trials to suggest that vitamin A status affectsthe incidence of diarrhoea. Therefore, the relative risk of experiencing adiarrhoea episode associated with vitamin A deficiency was not calcu-lated. However, there is considerable evidence to link vitamin A statusto the severity of diarrhoea episodes (Sommer and West 1996). Children
238 Comparative Quantification of Health Risks
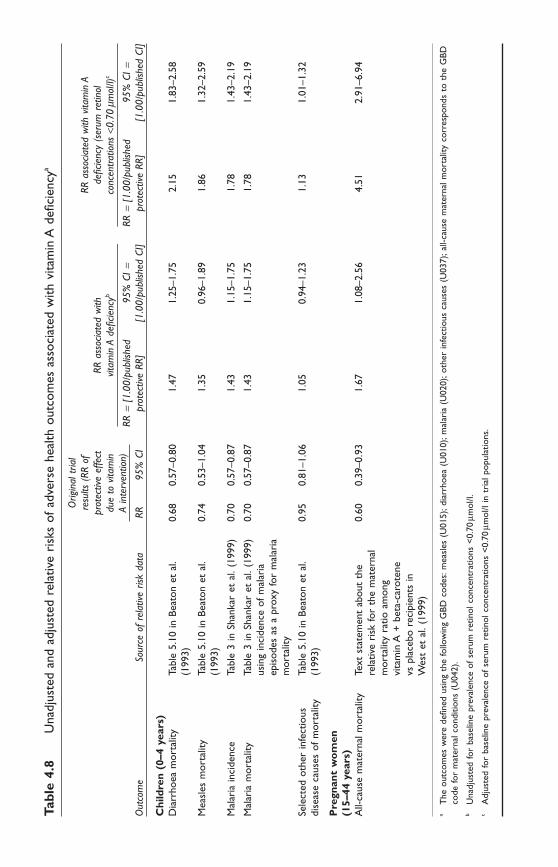
Tabl
e 4.
8U
nadj
uste
d an
d ad
just
ed r
elat
ive
risk
s of
adv
erse
hea
lth o
utco
mes
ass
ocia
ted
with
vita
min
A d
efici
ency
a
Orig
inal
tria
lre
sults
(RR
of
RR a
ssoc
iate
d w
ith v
itam
in A
prot
ectiv
e ef
fect
RR a
ssoc
iate
d w
ith
defic
ienc
y (s
erum
ret
inol
due
to v
itam
invit
amin
A d
eficie
ncyb
conc
entra
tions
<0.
70mm
ol/l)
c
A in
terv
entio
n)RR
=[1
.00/
publ
ished
95%
CI=
RR=
[1.0
0/pu
blish
ed95
% C
I=O
utco
me
Sour
ce o
f re
lativ
e ris
k da
taRR
95%
CI
prot
ectiv
e RR
][1
.00/
publ
ished
CI]
prot
ectiv
e RR
][1
.00/
publ
ished
CI]
Chi
ldre
n (0
–4 y
ears
)D
iarr
hoea
mor
talit
yTa
ble
5.10
in B
eato
n et
al.
0.68
0.57
–0.8
01.
471.
25–1
.75
2.15
1.83
–2.5
8(1
993)
Mea
sles
mor
talit
yTa
ble
5.10
in B
eato
n et
al.
0.74
0.53
–1.0
41.
350.
96–1
.89
1.86
1.32
–2.5
9(1
993)
Mal
aria
inci
denc
eTa
ble
3 in
Sha
nkar
et
al.(
1999
)0.
700.
57–0
.87
1.43
1.15
–1.7
51.
781.
43–2
.19
Mal
aria
mor
talit
yTa
ble
3 in
Sha
nkar
et
al.(
1999
) 0.
700.
57–0
.87
1.43
1.15
–1.7
51.
781.
43–2
.19
usin
g in
cide
nce
of m
alar
iaep
isod
es a
s a
prox
y fo
r m
alar
iam
orta
lity
Sele
cted
oth
er in
fect
ious
Ta
ble
5.10
in B
eato
n et
al.
0.95
0.81
–1.0
61.
050.
94–1
.23
1.13
1.01
–1.3
2di
seas
e ca
uses
of
mor
talit
y(1
993)
Pre
gnan
t w
om
en
(15–
44 y
ears
)A
ll-ca
use
mat
erna
l mor
talit
yTe
xt s
tate
men
t ab
out
the
0.60
0.39
–0.9
31.
671.
08–2
.56
4.51
2.91
–6.9
4re
lativ
e ri
sk fo
r th
e m
ater
nal
mor
talit
y ra
tio a
mon
g vi
tam
in A
+be
ta-c
arot
ene
vs p
lace
bo r
ecip
ient
s in
W
est
et a
l.(1
999)
aT
he o
utco
mes
wer
e de
fined
usi
ng t
he fo
llow
ing
GBD
cod
es:m
easl
es (
U01
5);d
iarr
hoea
(U
010)
;mal
aria
(U
020)
;oth
er in
fect
ious
cau
ses
(U03
7);a
ll-ca
use
mat
erna
l mor
talit
y co
rres
pond
s to
the
GBD
code
for
mat
erna
l con
ditio
ns (
U04
2).
bU
nadj
uste
d fo
r ba
selin
e pr
eval
ence
of
seru
m r
etin
ol c
once
ntra
tions
<0.
70mm
ol/l.
cA
djus
ted
for
base
line
prev
alen
ce o
f se
rum
ret
inol
con
cent
ratio
ns <
0.70
mmol
/l in
tri
al p
opul
atio
ns.

240 Comparative Quantification of Health Risks
with poor vitamin A status tend to suffer from more severe and moreprolonged episodes of diarrhoea. These findings provide supporting evi-dence for a causal relationship between vitamin A deficiency and diar-rhoea mortality.
Mortality
Vitamin A deficiency does appear to increase the risk of diarrhoea mor-tality. The ACC/SCN meta-analysis of the five community-based trialswith information on diarrhoea (Ghana, India, Nepal [two trials] and theSudan) suggest that vitamin A supplementation was associated with a32% reduction in diarrhoea mortality (RR = 0.68, 95% CI 0.57–0.80)(Beaton et al. 1993). In the individual trials that showed a reduction (allbut the Sudan), the reduction in diarrhoea mortality ranged from 34%in Ghana to 52% in India (Sommer and West 1996).
The relative risk of diarrhoea (GBD code U010) mortality among children aged 0–4 years with vitamin A deficiency was estimated fromthe protective effect of vitamin A interventions (RR = 0.68, 95% CI0.57–0.80) observed in the ACC/SCN meta-analysis of community-basedtrials and a 41% estimated baseline prevalence rate of serum retinol con-centrations <0.70mmol/l among those study populations. The adjustedrelative risk estimate derived from those data is RR = 2.15 (95% CI1.83–2.56). The calculations are shown in Table 4.8.
MALARIA
Although malaria is endemic in several areas of the world, countries inAfrica have particularly high prevalence rates and children aged <5 yearsexperience much of the associated burden of disease.
Incidence and morbidity
Malaria is caused by several species of the protozoa Plasmodium, whichare transmitted by mosquitoes from one person to another (Reingold andPhares 2001). In humans, P. falciparum is the species responsible for themajority of malaria-related morbidity and mortality. Both animal andhuman studies have implicated specific immune mechanisms for howvitamin A could influence the incidence and severity of malarial disease(Davis et al. 1998; Krishnan et al. 1976; Serghides and Kain 2002; Stoltzfus et al. 1989). In addition, cross-sectional studies have also docu-mented inverse associations between plasma retinol levels and P. falci-parum parasitaemia in humans (Filteau et al. 1993; Friis et al. 1997;Galan et al. 1990; Samba et al. 1992; Tabone et al. 1992; Thurnhamand Singkamani 1991), and one study has reported that low baselinevitamin A status was associated with an increased risk of parasitaemia (Sturchler et al. 1987).
Findings from more recent randomized controlled intervention trials suggest that vitamin A supplementation appears to reduce both theincidence and severity of malaria illness. In Ghana, cohorts of children

received high-dose vitamin A or a placebo every four months as part of either the Child Health (morbidity) or Child Survival (mortality) Study.Blood samples were collected on a monthly basis from different randomsubsamples of children in a series of cross-sectional surveys conductedover a one-year period. Based on the cross-sectional data, the authorsreported no statistically significant differences in the incidence of fever,malaria parasitaemia, parasite density, or probable malaria illnessbetween the two groups and concluded that vitamin A supplementationhad no impact on malaria (Binka et al. 1995). However, given the rela-tively small sample sizes, these studies had limited statistical power andcould only detect a statistically significant protective effect of vitamin Asupplementation against probable malarial illness that exceeded 70%(Child Survival Study) or 95% (Child Health Study) (Shankar 1995).
A more definitive study of vitamin A supplementation and malaria wasrecently conducted in Papua New Guinea. In that study children aged6–60 months received either high-dose vitamin A or a placebo every three months and were followed over a 13-month period. Malariamorbidity was assessed weekly using community-based case detectionand surveillance of the patients who reported to the local health centre.Blood smears were prepared for children who had a fever >37.5°C at the time of the weekly home visit or for any clinic visit and for all children who participated in the three cross-sectional surveys conductedat baseline, at the midpoint, and at the end of the study. Slide-confirmedcases of malaria were followed prospectively and observed for adversehealth outcomes. Children in the vitamin A group had a 30% lower frequency of P. falciparum febrile illnesses (RR = 0.70, 95% CI0.57–0.87) and younger children (12–36 months) apparently benefitedmost from supplementation. The younger children in the vitamin A groupalso had less severe malaria morbidity, measured as fewer febrile episodes,fewer enlarged spleens and a lower parasite density (Shankar et al. 1999).
The study from Papua New Guinea used a stronger design, evaluateda greater number of disease variables, and had more statistical power toinvestigate a relationship between vitamin A and malaria morbidity ascompared to the Ghana study. Therefore, the findings from Papua NewGuinea were used to assess the relative risk of malaria incidence associated with vitamin A deficiency for the CRA project.
Mortality
To date, no randomized trials have demonstrated a significant reductionin malaria mortality associated with the vitamin A supplementation.However, given the recently observed relationship between vitamin Asupplementation and malaria severity, an equivalent relative risk wasassigned for malaria mortality for the purpose of the CRA project.
The relative risk of malaria incidence (GBD code U020) among chil-dren aged 0–4 years with vitamin A deficiency was estimated for theCRA project from the protective effect of the vitamin A intervention
Amy L. Rice et al. 241

(RR = 0.70, 95% CI 0.57–0.87) observed in the Papua New Guinea trialand a 55% estimated baseline prevalence rate of serum retinol concen-trations <0.70mmol/l in that study population. The adjusted relative riskestimate derived from those data is RR = 1.78 (95% CI 1.43–2.19). Thecalculations are shown in Table 4.8.
The relative risk of malaria mortality (GBD code U020) among chil-dren aged 0–4 years with vitamin A deficiency was estimated by extrapo-lation for the CRA project from the results of the vitamin A interventionon malaria incidence observed in the community-based trial in PapuaNew Guinea (RR = 0.70, 95% CI 0.57–0.87) and a 55% estimated base-line prevalence rate of serum retinol concentrations <0.70mmol/l in thatstudy population. The adjusted relative risk estimate derived from thosedata is RR = 1.78 (95% CI 1.43–2.19). The calculations are shown inTable 4.8.
OTHER INFECTIOUS DISEASES IN CHILDREN
Infectious diseases are a common cause of death among preschool-agechildren worldwide. The global burden of disease related to the GBDcategory of “other infectious diseases” among children is widely dis-tributed around the world.
Although acute respiratory infections, diarrhoeal diseases, measlesand malaria represent the most common causes of childhood illness anddeath, many other bacterial, viral and parasitic agents cause diseaseamong children as well. Since vitamin A is involved in a wide variety ofdifferent biological processes, vitamin A deficiency may also increase therisk of death due to other less common causes of childhood disease,although studies to date have not specifically quantified those relation-ships. The GBD study included a group of “other infectious diseases”(GBD code U037) in children that captured the contribution of manylow-incidence causes of death under one category. Causes of infectiousdiseases not explicitly listed in the other GBD categories for children areincluded under this code (Murray et al. 2001).
Mortality
Data from intervention trials among children suggest that vitamin A deficiency increases the risk of mortality from causes other than diar-rhoea, measles and malaria. The ACC/SCN meta-analysis of the fivecommunity-based trials (Ghana, India, Nepal [two trials] and the Sudan)with information on cause-specific mortality found that vitamin A sup-plementation was associated with a 5% reduction in mortality fromunspecified causes of death (RR = 0.95, 95% CI 0.81–1.06) (Beaton etal. 1993). This risk estimate was used for the purposes of estimation.The relative risk of mortality due to other infectious diseases (GBD codeU037) among children aged 0–4 years with vitamin A deficiency was estimated for the CRA project from the protective effect of vitamin Ainterventions (RR = 0.95, 95% CI 0.81–1.06) observed in the ACC/SCN
242 Comparative Quantification of Health Risks

meta-analysis of community-based trials and a 41% estimated baselineprevalence rate of serum retinol concentrations <0.70mmol/l amongthose study populations. The adjusted relative risk estimate derived fromthose data is RR = 1.13 (95% CI 1.01–1.32). The calculations are shownin Table 4.8.
5.2 Risk estimates for pregnant women (15–44 years)
Over half a million women around the world die each year from causesassociated with pregnancy and childbirth. Most of these maternal deathsoccur in the Regions of Africa and South-East Asia.
Although data from either observational or experimental studiesrelating vitamin A deficiency among women of reproductive age to specific causes of mortality are limited, biologically plausible mechanismsfor such relationships do exist (Faisel and Pittrof 2000). A relative riskof maternal mortality was estimated for vitamin A deficiency amongpregnant women aged 15–44 years, based on the best data currentlyavailable. The risk estimate for these outcomes may be modified in thefuture when more data that specifically address this issue are available.
To date, the only large-scale randomized controlled trial of vitamin Asupplementation among women of reproductive age has been conductedin an area of southern Nepal where high rates of maternal night blind-ness have been reported (West et al. 1999). More than 44000 womenof reproductive age were randomized to continually receive eithervitamin A (7000mg retinol equivalents), an equivalent amount of beta-carotene, or a placebo capsule on a weekly basis over an approximatethree and a half year period; that is, before and during pregnancy,throughout the postpartum period and through any subsequent preg-nancy until close-out of the trial. Over 22000 identified pregnancies werefollowed. Pregnancy-related mortality (defined as a death during preg-nancy or prior to 12 weeks postpartum) was decreased by 40%(RR = 0.60, 95% CI 0.37–0.97) in the vitamin A group and by 49%(RR = 0.51, 95% CI 0.30–0.86) in the beta-carotene group (West et al.1999). These findings provide support for a causal relationship betweenvitamin A deficiency and pregnancy-related mortality.
Data from the study in Nepal were used to estimate the relative riskof maternal mortality associated with vitamin A deficiency. The studypresents several sets of mortality results for women stratified by time andcause of death during pregnancy and the postpartum period. The mor-tality results used for CRA analysis were those that excluded all deaths>6 weeks postpartum and all deaths attributed to reported injury whichare the results that most closely conform to the ICD-10 definition of amaternal death (WHO 1992). The combined results for women in thevitamin A and beta-carotene intervention groups were used to representnon-vitamin A deficient women.
The relative risk of maternal mortality among pregnant women withvitamin A deficiency—due to a wide variety of maternal conditions (GBD
Amy L. Rice et al. 243

code U042)—was estimated for the CRA project from the combined pro-tective effect of the vitamin A and beta-carotene interventions on thematernal mortality ratio (RR = 0.60, 95% CI 0.39–0.93) and a 19%estimated baseline prevalence rate of serum retinol concentrations<0.70mmol/l observed among women in the Nepal trial (West et al.1999). In the absence of other studies linking vitamin A deficiency tocause-specific deaths among women, the risk of maternal death (from awide variety of maternal conditions) was extrapolated from the Nepalstudy. A maternal mortality ratio of 378 deaths per 100000 live birthsamong women in the vitamin A and beta-carotene groups combined(West et al. 1999) was used as the starting point for the adjusted rela-tive risk calculations. The adjusted relative risk estimate derived fromthose data is RR = 4.51 (95% CI 2.91–6.94). The calculations are shownin Table 4.8.
5.3 Risk estimates for all other groups
Limited information is available about the global prevalence of vitaminA deficiency or its associated adverse health effects in children aged ≥5years, in men aged 15–44 years, or in men or women aged ≥45 years.Therefore, quantitative estimates for the prevalence of vitamin A defi-ciency and the associated risk of adverse health outcomes were not devel-oped for these groups.
6. Burden of disease associated with vitamin A deficiency
Summary estimates for three burden of disease measurements are shownin this chapter. The attributable fraction of cause-specific mortality asso-ciated with vitamin A deficiency among children aged 0–4 years andpregnant women aged 15–44 years are shown by subregion in Table 4.9.The estimated number of cause-specific deaths and disability-adjusted lifeyears (DALYs) attributed to vitamin A deficiency is shown in Table 4.9and Table 4.10, respectively.
The attributable fraction results show that worldwide, vitamin A defi-ciency among children is associated with an estimated 20% of measles-related mortality, 24% of diarrhoea mortality, 20% of malaria incidenceand mortality, and 3% of mortality associated with other infectiouscauses of disease. By definition, the attributable fraction of disease asso-ciated with vitamin A deficiency itself is 100%. The attributable frac-tions vary widely by cause and across the different subregions. In general,the attributable fractions (for disease conditions other than vitamin Adeficiency) are highest in the African and South-East Asian Regions,where vitamin A deficiency is most prevalent and child mortality ratesfor the causes of disease assessed in this chapter are high. Worldwide,vitamin A deficiency (serum retinol concentrations <0.70mmol/l) amongpregnant women is associated with over 20% of maternal mortality.
244 Comparative Quantification of Health Risks

Amy L. Rice et al. 245Ta
ble
4.9
Att
ribu
tabl
e fr
actio
n of
cau
se-s
peci
fic m
orta
lity
(%)
due
to v
itam
in A
defi
cien
cy fo
r m
easl
es,d
iarr
hoea
,mal
aria
and
othe
r in
fect
ious
dis
ease
s am
ong
child
ren,
for
cond
ition
s le
adin
g to
mat
erna
l mor
talit
y,an
d fo
r di
rect
seq
uela
e of
vita
min
A d
efici
ency
,by
subr
egio
n
Dise
ases
am
ong
child
ren
(0–4
yea
rs)a
Cond
ition
s le
adin
g to
mat
erna
l
Oth
er in
fect
ious
mor
talit
y am
ong
wom
en (
15–4
4 ye
ars)
aD
irect
seq
uala
e of
vita
min
A d
eficie
ncy
Subr
egio
nM
easle
sD
iarr
hoea
Mal
aria
caus
esM
ater
nal c
ause
sam
ong
all a
ge g
roup
s an
d bo
th s
exes
AFR
-D20
2518
424
100
AFR
-E23
2922
428
100
AM
R-A
bb
bb
bb
AM
R-B
b15
112
10b
AM
R-D
b13
92
14b
EMR
-B2
32
bb
b
EMR
-D17
2115
322
100
EUR
-Ab
bb
bb
b
EUR
-Bb
bb
bb
b
EUR
-Cb
bb
bb
b
SEA
R-B
2935
276
24b
SEA
R-D
2126
194
1710
0
WPR
-Ab
bb
bb
b
WPR
-B10
1410
214
b
Wor
ld20
2420
322
,21c
100
aT
he o
utco
mes
wer
e de
fined
usi
ng t
he fo
llow
ing
GBD
cod
es:m
easl
es (
U01
5);d
iarr
hoea
(U
010)
;mal
aria
(U
020)
;oth
er in
fect
ious
cau
ses
(U03
7);a
ll-ca
use
mat
erna
l mor
talit
y co
rres
pond
sto
the
GBD
cod
e fo
r m
ater
nal c
ondi
tions
(U
042)
.b
A v
alue
for
the
attr
ibut
able
fra
ctio
n is
not
incl
uded
eith
er b
ecau
se t
he p
reva
lenc
e of
vita
min
A d
efici
ency
in t
he s
ubre
gion
was
zer
o or
the
cau
se-s
peci
fic m
orta
lity
was
zer
o or
nea
rly
zero
in t
he a
ssoc
iate
d su
breg
ion-
age-
sex
grou
ps.
cT
he g
loba
l att
ribu
tabl
e fr
actio
ns a
re 2
2% (
for
wom
en a
ged
15–2
9 ye
ars)
and
21%
(fo
r w
omen
age
d 30
–44
year
s).T
hey
are
slig
htly
diff
eren
t be
caus
e th
e to
tal n
umbe
r of
dea
ths
amon
gw
omen
in t
hese
age
gro
ups
diffe
r.

246 Comparative Quantification of Health RisksTa
ble
4.10
Dea
ths
(000
s) f
rom
mea
sles
,mal
aria
,dia
rrho
ea,o
ther
infe
ctio
us d
isea
ses
amon
g ch
ildre
n,fr
om m
ater
nal c
ondi
tions
attr
ibut
able
to
vita
min
A d
efici
ency
,and
tho
se d
irec
tly a
ttri
bute
d to
vita
min
A d
efici
ency
in v
ital r
egis
trat
ion
syst
ems,
by s
ubre
gion
Caus
e-sp
ecifi
c m
orta
lity
amon
g ch
ildre
nCa
use-
spec
ific
mor
talit
yAl
l-cau
se m
orta
lity
(0–4
yea
rs)a
amon
g pr
egna
nt w
omen
dire
ctly
attr
ibut
ed t
oO
ther
infe
ctio
us(1
5–44
yea
rs)a
vitam
in A
defi
cienc
y in
Subr
egio
nM
easle
sD
iarr
hoea
Mal
aria
caus
esTo
tal
Mat
erna
l cau
ses
vital
reg
istra
tion
syst
emsb
Tota
l
AFR
-D41
4679
316
924
1120
2
AFR
-E34
9390
622
338
1327
1
AM
R-A
00
00
00
00
AM
R-B
04
00
42
06
AM
R-D
02
00
22
04
EMR
-B0
00
00
00
0
EMR
-D11
527
373
141
87
EUR
-A0
00
00
00
0
EUR
-B0
00
00
00
0
EUR
-C0
00
00
00
0
SEA
R-B
79
10
175
023
SEA
R-D
2310
710
614
621
216
9
WPR
-A0
00
00
00
0
WPR
-B2
90
112
30
16
Wor
ld11
832
318
719
647
109
2877
8c
aT
he o
utco
mes
wer
e de
fined
usi
ng t
he fo
llow
ing
GBD
cod
es:m
easl
es (
U01
5);d
iarr
hoea
(U
010)
;mal
aria
(U
020)
;oth
er in
fect
ious
cau
ses
(U03
7);a
ll-ca
use
mat
erna
l mor
talit
y co
rres
pond
sto
the
GBD
cod
e fo
r m
ater
nal c
ondi
tions
(U
042)
.b
Am
ong
both
sex
es a
nd a
ll ag
e gr
oups
.c
Dat
a fo
r th
e m
easl
es,d
iarr
hoea
,mal
aria
,oth
er in
fect
ious
cau
ses,
all-c
ause
mat
erna
l mor
talit
y di
rect
ly a
ttri
bute
d to
vita
min
A d
efici
ency
,and
the
tot
als
colu
mns
wer
e ob
tain
ed d
irec
tlyfr
om a
nnex
res
ults
tab
les.
Subr
egio
nal s
ubto
tals
for
child
ren
aged
0–4
yea
rs w
ere
calc
ulat
ed b
y ad
ding
acr
oss
dise
ase
cate
gori
es a
nd t
hen
tota
lling
tho
se r
esul
ts.R
egio
nal s
ubto
tals
for
mat
erna
l cau
ses
of d
eath
wer
e ca
lcul
ated
by
addi
ng a
cros
s th
e 15
–29
and
30–4
4 ye
ar-o
ld a
ge c
ateg
orie
s an
d th
en t
otal
ling
thos
e re
sults
.Any
dis
crep
anci
es in
the
mar
gina
l tot
als
in t
his
tabl
e ar
e at
trib
uted
to
diffe
renc
es in
rou
ndin
g ca
rrie
d ov
er f
rom
the
indi
vidu
al c
olum
ns o
f th
e ba
ckgr
ound
dat
a ta
bles
.

Amy L. Rice et al. 247
Again, the highest attributable fractions are found in the African andSouth-East Asian Regions, where vitamin A deficiency and maternalmortality rates are highest.
Worldwide the majority of deaths (see Table 4.10) and DALYs (seeTable 4.11) associated with vitamin A deficiency occur in Africa andSouth-East Asia. However, the relative distribution of deaths and DALYsvaries somewhat across subregions for the different causes of diseaseburden. A higher proportion of the burden of disease from measles,malaria and all-cause maternal mortality occurs in Africa, while South-East Asia has a higher proportion of the disease burden from diarrhoea.
The total number of maternal and child deaths and disease-relatedmorbidity that could potentially be averted if vitamin A deficiency wereeliminated depends on several factors: (i) the attributable fraction (deter-mined by the prevalence of vitamin A deficiency and the relative risk ofan adverse health outcome); (ii) the global distribution of the adversehealth outcomes; and (iii) the estimated number of affected individualsin each subregion. Subregions with a higher attributable fraction but asmaller number of individuals affected by the adverse health outcomes(due to either a small population base or a low prevalence of the condi-tion) may contribute less in absolute terms to the overall global burdenof disease when compared to subregions or specific causes of death withlower attributable fractions but a larger total number of affected indi-viduals. Conversely, subregions with similar attributable fractions butdifferent causes of death and/or population bases will contribute differ-ent numbers of affected individuals to a global summary.
For example, the AFR-D and SEAR-D subregions have similar attributable fractions of disease for measles (~20%), but the number ofdeaths attributed to vitamin A deficiency is nearly twice as high in AFR-D (41000) when compared to SEAR-D (23000) although the popula-tion base of children in the AFR-D subregion is only a third (13.5million) of the population base of children (42.3 million) in the SEAR-D subregion. For diarrhoea, AFR-D and SEAR-D also have similarattributable fractions of disease (~25%), but in this case the number ofdeaths attributed to vitamin A deficiency is more than twice as high inSEAR-D (107000) when compared to AFR-D (46000). The relative con-tribution of these different factors (attributable fractions, global distrib-ution of disease and population base) should be kept in mind whencomparing the burden of disease attributed to vitamin A deficiency acrosssubregions and specific causes of death.
7. DiscussionThis chapter generated quantitative estimates of the global burden ofdisease due to vitamin A deficiency by applying the analytical frameworkof the CRA project to the best sources of currently available data. Theresults show, despite decades of achievement in paediatric detection and

248 Comparative Quantification of Health RisksTa
ble
4.11
DA
LYs
(000
s) a
ssoc
iate
d w
ith m
easl
es,m
alar
ia,d
iarr
hoea
,and
oth
er in
fect
ious
dis
ease
s am
ong
child
ren,
with
mat
erna
l con
ditio
ns a
ttri
buta
ble
to v
itam
in A
defi
cien
cy a
nd w
ith d
irec
t se
quel
ae o
f vi
tam
in A
defi
cien
cy a
mon
g al
lag
e gr
oups
,by
subr
egio
n
Preg
nant
wom
en
Child
ren
(0–4
yea
rs)a
(15–
44 y
ears
)aBo
th s
exes
(al
l age
gro
ups)
Mat
erna
l cau
ses
of
Sequ
elae
dire
ctly
asso
ciate
dSu
breg
ion
Mea
sles
Dia
rrho
eaM
alar
iaO
ther
infe
ctio
us c
ause
sTo
tal
mor
bidi
ty a
nd m
orta
lity
with
vita
min
A d
eficie
ncy
Tota
l
AFR
-D1
432
155
42
914
955
995
662
378
703
4
AFR
-E1
176
313
13
345
189
784
11
095
438
937
5
AM
R-A
00
00
00
00
AM
R-B
013
22
1014
438
018
2
AM
R-D
084
03
8733
012
1
EMR
-B0
150
217
00
17
EMR
-D38
91
746
253
882
476
401
402
917
EUR
-A0
00
00
00
0
EUR
-B0
10
01
01
2
EUR
-C0
00
00
00
0
SEA
R-B
233
314
3615
598
152
475
4
SEA
R-D
790
360
336
819
14
952
637
100
569
0
WPR
-A0
00
00
00
0
WPR
-B81
319
1137
448
8911
546
Wor
ld4
101
1089
86
931
630
2256
03
106
972
2663
8b
aT
he o
utco
mes
wer
e de
fined
usi
ng t
he fo
llow
ing
GBD
cod
es:m
easl
es (
U01
5);d
iarr
hoea
(U
010)
;mal
aria
(U
020)
;oth
er in
fect
ious
cau
ses
(U03
7);a
ll-ca
use
mat
erna
l mor
talit
y co
rres
pond
sto
the
GBD
cod
e fo
r m
ater
nal c
ondi
tions
(U
042)
.b
Dat
a fo
r th
e m
easl
es,d
iarr
hoea
,mal
aria
,oth
er in
fect
ious
cau
ses,
mat
erna
l cau
ses
of m
orbi
dity
and
mor
talit
y,an
d se
quel
ae d
irec
tly a
ttri
bute
d to
vita
min
A d
efici
ency
,and
the
tot
als
colu
mns
wer
e ob
tain
ed d
irec
tly f
rom
the
ann
ex r
esul
ts t
able
s.Su
breg
iona
l sub
tota
ls fo
r ch
ildre
n ag
ed 0
–4 y
ears
wer
e ca
lcul
ated
by
addi
ng a
cros
s di
seas
e ca
tego
ries
and
the
n to
talli
ngth
ose
resu
lts.S
ubre
gion
al s
ubto
tals
for
mat
erna
l con
ditio
ns w
ere
calc
ulat
ed b
y ad
ding
acr
oss
the
15–2
9 an
d 30
–44
year
-old
age
cat
egor
ies
and
then
tot
allin
g th
ose
resu
lts.A
nydi
scre
panc
ies
in t
he m
argi
nal t
otal
s in
thi
s ta
ble
are
attr
ibut
ed t
o di
ffere
nces
in r
ound
ing
carr
ied
over
fro
m t
he in
divi
dual
col
umns
of
the
back
grou
nd d
ata
tabl
es.

control, that vitamin A deficiency remains a major public health problemamong preschool-age children throughout the world. Globally, 21%, orover 127 million children aged <5 years are vitamin A deficient. Twentyper cent to 24% of early childhood deaths due to measles, diarrhoea andmalaria are attributable to vitamin A deficiency, plus an additional 3%of deaths due to other infectious causes, accounting for 647000 deathsof preschool-age children each year. Vitamin A deficiency appears to espe-cially put children at risk of mortality due to diarrhoea, which accountsfor 50% of all childhood deaths attributable to vitamin A deficiency.
New to the global view of undernutrition is a previously unrecognized,substantial burden of maternal vitamin A deficiency. Not surprisingly theburden of disease among pregnant women appears to parallel the geo-graphic distribution seen in young children, with Asia and Africa bearinga disproportionate burden. This first attempt to define the problem suggests, conservatively, that 5.6% of all pregnant women, or approxi-mately 7.3 million, are vitamin A deficient in a given year. Vitamin A-deficient women are at a 4.5-fold higher risk of pregnancy-relatedmortality than non-deficient women. The estimates generated for thisproject suggest that more than 20% of all maternal deaths in the worldmay be attributable to vitamin A deficiency. The method used to gener-ate this particular estimate (applying the relative risk of death associatedwith vitamin A deficiency to all causes of maternal death) may some-what overestimate the burden of disease related to vitamin A deficiency.It also does not address the prevalence, burden, or potential health con-sequences of vitamin A deficiency among non-pregnant women of repro-ductive age, which remain largely unknown.
In addition to estimating the number of preventable deaths, the resultsfrom this project suggest that approximately 27 million DALYs are asso-ciated with vitamin A deficiency. Given that DALYs provide a compos-ite measure of disease burden associated with both fatal and non-fatalhealth conditions and that childhood mortality related to infectious dis-eases is the primary health outcome known to be associated with vitaminA deficiency, it is not surprising that the vast majority of the estimatedDALYs (~23 million) are related to infectious disease causes of death inchildren.
In summary, vitamin A deficiency affects vulnerable populationsthroughout critical stages of life, as revealed by these estimates of diseaseburden in young children and pregnant women. Successful efforts tocontrol and reduce vitamin A deficiency have the potential to improvethe health and well-being of women and children around the world andto reduce the global burden of disease associated with this nutritionalrisk factor.
Amy L. Rice et al. 249
8. Expected changes in the prevalence ofvitamin A deficiency
Based on the trends observed over the past 20 years, and more specifi-cally on changes over the past 5–10 years, there is reason for optimismand the expectation that the global prevalence of vitamin A deficiency(defined as serum retinol concentrations <0.70mmol/l) will decrease inthe years leading up to 2030.
Numerous factors contribute to the current situation. In recent yearsa favourable global policy environment has been created and global part-nerships have emerged to help guide activities aimed at the control andprevention of vitamin A deficiency. Various groups have contributed tothe positive policy environment including IVACG, international organi-zations, bilateral agencies and individual country governments aroundthe world.
Although these groups initially focused their attention almost exclu-sively on the more obvious problem of vitamin A deficiency among children, the situation is now changing. Policy-makers and programmemanagers are increasingly expanding their efforts in recognition of thefact that vitamin A deficiency is also prevalent among women of repro-ductive age and has potentially severe health consequences for them aswell.
Many countries have already initiated national supplementation pro-grammes for children (most commonly using community-based healthservices as a routine delivery channel or special vitamin A distributioninitiatives combined with national immunization days or child healthdays or weeks) in an effort to prevent severe vitamin A deficiency amongthis age group. Although child-based supplementation programmes donot necessarily directly address the problem of vitamin A deficiencyamong women, other more general approaches may, if the accompany-ing health messages are modified to specifically encourage women as participants and programme beneficiaries. These include widespreadfood fortification initiatives, efforts to improve the availability of vitaminA rich foods through agricultural programmes, nutrition education pro-grammes, etc.
Projections for the global prevalence of vitamin A deficiency for the30-year time period from 2000 to 2030 were developed for the CRAproject based on the assumption that the policy and programming envi-ronment will remain positive and that prevention and control activitieswill not only keep pace, but will exceed future population growth.
The global prevalence of 21.1% for serum retinol concentrations<0.70mmol/l (in preschool-age children) in the year 2000 was used asthe baseline prevalence rate. Reductions of 10%, 20% and 30% wereprojected over the next three decades, resulting in estimated global preva-lence rates of 19.0%, 16.9% and 14.8%, in the years 2010, 2020 and2030, respectively. Although specific programmes to address vitamin A
250 Comparative Quantification of Health Risks
deficiency in women have started much more recently, the same per-centage reductions (10%, 20% and 30%) in prevalence rates wereassumed for the purposes of the CRA project. Starting with an assumedbaseline rate of 5.6% in 2000, prevalence rates of 5.0%, 4.5% and 3.9%were projected for 2010, 2020 and 2030, respectively.
AcknowledgementsSupported by the Family Health and Child Survival (FHACS) Coopera-tive Agreement, between the United States Agency for InternationalDevelopment (USAID), Office of Health and Nutrition, and The JohnsHopkins Bloomberg School of Public Health, Department of Interna-tional Health (JHU), and by the World Health Organization Global Programme on Evidence for Health Policy. The authors thank MariaAndersson and Bruno de Benoist for data used to update the vitamin Adeficiency prevalence estimates, and Anuraj H. Shankar for helpful com-ments on malaria issues. The authors are grateful for the assistance ofSteve Fishman, Jeffrey McGuckin and Jonathan Sugimoto in compilingdata for the project, and for the valuable insight and advice from othercolleagues in the field of international health.
Note1 See preface for an explanation of this term.
ReferencesAnonymous (1995) Potential interventions for the prevention of childhood pneu-
monia in developing countries: a meta-analysis of data from field trials toassess the impact of vitamin A supplementation on pneumonia morbidity andmortality. The vitamin A and pneumonia working group. Bulletin of theWorld Health Organization, 73:609–619.
Anonymous (1998a) Nepal micronutrient status survey. Ministry of Health,Child Health Division, HMG/N, New ERA, Micronutrient Initiative,UNICEF Nepal. World Health Organization, Kathmandu.
Anonymous (1998b) Randomised trial to assess benefits and safety of vitamin A supplementation linked to immunisation in early infancy. WHO/CHDimmunisation-linked vitamin A supplementation study group. The Lancet,352(9136):1257–1263. Erratum in: The Lancet, 1999; 353:154.
Bauernfiend C (1986) Vitamin A deficiency and its control. Academic Press, Inc.,Gainesville, FL.
Beaton GH, Martorell R, Aronson KJ et al. (1993) Effectiveness of vitamin Asupplementation in the control of young child morbidity and mortality indeveloping countries. ACC/SCN State-of-the-art Series. (Nutrition Policy Discussion Paper No. 13.) United Nations Administrative Committee onCoordination/Sub-Committee on Nutrition, Geneva.
Amy L. Rice et al. 251

Binka FN, Ross DA, Morris SS et al. (1995) Vitamin A supplementation and childhood malaria in northern Ghana. American Journal of ClinicalNutrition, 61:853–859.
Bloem MW, Wedel M, Egger RJ et al. (1990) Mild vitamin A deficiency and risk of respiratory tract diseases and diarrhea in preschool and school children in northeastern Thailand. American Journal of Epidemiology,131:332–339.
Christian P, Thorne-Lyman AL, West KP Jr. et al. (1998a) Working after the sungoes down: exploring how night blindness impairs women’s work activitiesin rural Nepal. European Journal of Clinical Nutrition, 52:519–524.
Christian P, West KP Jr., Khatry SK et al. (1998b) Night blindness of pregnancyin rural Nepal—nutritional and health risks. International Journal of Epidemiology, 27:231–237.
Christian P, West KP Jr., Khatry SK et al. (2000) Vitamin A or beta-carotene sup-plementation reduces symptoms of illness in pregnant and lactating Nepaliwomen. Journal of Nutrition, 130:2675–2682.
Christian P, West KP Jr., Khatry SK et al. (2001) Maternal night blindnessincreases risk of mortality in the first 6 months of life among infants in Nepal.Journal of Nutrition, 131:1510–1512.
Coutsoudis A, Broughton M, Coovadia HM (1991) Vitamin A supplementationreduces measles morbidity in young African children: a randomized, placebo-controlled, double-blind trial. American Journal of Clinical Nutrition, 54:890–895.
Daulaire NM, Starbuck ES, Houston RM, Church MS, Stukel TA, Pandey MR(1992) Childhood mortality after a high dose of vitamin A in a high risk pop-ulation. British Medical Journal, 304:207–210.
Davis TM, Skinner-Adams TS, Beilby J (1998) In vitro growth inhibition of Plasmodium falciparum by retinol at concentrations present in normal human serum. Acta Tropica, 69:111–119.
Dollimore N, Cutts F, Binka FN, Ross DA, Morris SS, Smith PG (1997) Measlesincidence, case fatality, and delayed mortality in children with or withoutvitamin A supplementation in rural Ghana. American Journal of Epidemiol-ogy, 146:646–654.
Ellison JB (1932) Intensive vitamin therapy in measles. British Medical Journal,2:708–711.
Faisel H, Pittrof R (2000) Vitamin A and causes of maternal mortality: associa-tion and biological plausibility. Public Health Nutrition, 3:321–327.
Fawzi WW, Chalmers TC, Herrera MG, Mosteller F (1993) Vitamin A supple-mentation and child mortality. A meta-analysis. Journal of the AmericanMedical Association, 269:898–903.
Filteau SM, Morris SS, Abbott RA et al. (1993) Influence of morbidity on serumretinol of children in a community-based study in northern Ghana. AmericanJournal of Clinical Nutrition, 58:192–197.
Friis H, Mwaniki D, Omondi B et al. (1997) Serum retinol concentrations andSchistosoma mansoni, intestinal helminths, and malarial parasitemia: a cross-
252 Comparative Quantification of Health Risks
sectional study in Kenyan preschool and primary school children. AmericanJournal of Clinical Nutrition, 66:665–671.
Galan P, Samba C, Luzeau R, Amedee-Manesme O (1990) Vitamin A deficiencyin pre-school age Congolese children during malarial attacks. Part 2: Impactof parasitic disease on vitamin A status. International Journal for Vitaminand Nutrition Research, 60:224–228.
Ghana VAST Study Team (1993) Vitamin A supplementation in northern Ghana:effects on clinic attendances, hospital admissions, and child mortality. TheLancet, 342:7–12. Erratum in: The Lancet, 1993;342:250.
Gilbert C, Foster A (2001) Childhood blindness in the context of VISION2020—The right to sight. Bulletin of the World Health Organization, 79:227–232.
Glasziou PP, Mackerras DEM (1993) Vitamin A supplementation in infectiousdiseases: a meta-analysis. British Medical Journal, 306:366–370.
Haskell MJ, Mazumder RN, Peerson JM et al. (1999) Use of the deuterated-retinol-dilution technique to assess total-body vitamin A stores ofadult volunteers consuming different amounts of vitamin A. American Journalof Clinical Nutrition, 70:874–880.
Herrera MG, Nestel P, El Amin A, Fawzi WW, Mohamed KA, Weld L (1992)Vitamin A supplementation and child survival. The Lancet, 340:267–271.
Hersh BS, Tambini G, Nogueira AC, Carrasco P, de Quadros CA (2000) Reviewof regional measles surveillance data in the Americas, 1996–99. The Lancet,355:1943–1948.
Hill AB (1965) The environment and disease: association or causation? Proceedings of the Royal Society of Medicine, 58:295–300.
Humphrey JH, Agoestina T, Wu L et al. (1996) Impact of neonatal vitamin Asupplementation on infant morbidity and mortality. Journal of Pediatrics,128:489–496.
Hussey GD, Klein M (1990) A randomized, controlled trial of vitamin A in children with severe measles. New England Journal of Medicine, 323:160–164.
IVACG (1997) Maternal night blindness: extent and associated risk factors. International Life Sciences Institute, Washington, DC.
Katz J, West KP Jr., Khatry SK et al. (2000) Maternal low-dose vitamin A orbeta-carotene supplementation has no effect on fetal loss and early infantmortality: a randomized cluster trial in Nepal. American Journal of ClinicalNutrition, 71:1570–1576.
Kjolhede CL, Stallings RY, Dibley MJ, Sadjimin T, Dawiesah S, Padmawati S(1995) Serum retinol levels among preschool children in Central Java: demographic and socioeconomic determinants. International Journal of Epidemiology, 24:399–403.
Krishnan S, Krishnan AD, Mustafa AS, Talwar GP, Ramalingaswami V (1976)Effect of vitamin A and undernutrition on the susceptibility of rodents to a malarial parasite Plasmodium berghei. Journal of Nutrition, 106:784–791.
Amy L. Rice et al. 253

Mason JB, Lotfi M, Dalmiya N, Sethuraman K, Dietchler M (2001) Themicronutrient report: current progress and trends in the control of vitamin A,iodine, and iron deficiencies. The Micronutrient Initiative, Ottawa, ON.http://www.micronutrient.org.
Micronutrient Initiative/UNICEF/Tulane University (1998) Progress towardscontrolling vitamin A deficiency. The Micronutrient Initiative, Ottawa, ON.
Milton RC, Reddy V, Naidu AN (1987) Mild vitamin A deficiency and childhood morbidity—an Indian experience. American Journal of ClinicalNutrition, 46:827–829.
Muhilal, Permeisih D, Idjradinata YR, Muherdiyantiningsih, Karyadi D (1988)Vitamin A-fortified monosodium glutamate and health, growth, and survivalof children: a controlled field trial. American Journal of Clinical Nutrition,48:1271–1276.
Murray CJ, Lopez AD, eds. (1996a) Global burden of disease: a comprehensiveassessment of mortality and disability from diseases, injuries and risk factorsin 1990 and projected to 2020. Global Burden of Disease and Injury, Vol 1.Harvard School of Public Health on behalf of WHO, Cambridge, MA.
Murray CJ, Lopez AD, eds. (1996b) Global health statistics: a compendium ofincidence, prevalence and mortality estimates for over 200 conditions. GlobalBurden of Disease and Injury, Vol 2. Harvard School of Public Health onbehalf of WHO, Cambridge, MA.
Murray CJL, Lopez AD, Mathers CD, Stein C (2001) The global burden ofdisease 2000 project: aims, methods and data sources. (GPE Discussion PaperNo. 36—revised). World Health Organization, Geneva.
Nalubola R, Nestel P (1999) The effect of vitamin A nutriture on health: areview. ILSI Press, Washington, DC.
National Research Council (1989) Recommended Dietary Allowances. U.S. Subcommittee on the tenth edition of the RDAs. National Academy Press,Washington, DC.
Olson JA (1996) Vitamin A. In: Present knowledge in nutrition. 7th edition.Ziegler EE, Filer LJJ, eds. ILSI Press, Washington, DC.
Rahmathullah L, Underwood BA, Thulasiraj RD et al. (1990) Reduced mortal-ity among children in southern India receiving a small weekly dose of vitaminA. New England Journal of Medicine, 323:929–935.
Reingold AL, Phares CR (2001) Infectious diseases. In: International publichealth: diseases, programs, systems, and policies. Merson MH, Black RE,Mills AJ, eds. Aspen Publishers, Inc., Gaithersburg, MD.
Ribaya-Mercado JD, Mazariegos M, Tang G et al. (1999) Assessment of total body stores of vitamin A in Guatemalan elderly by the deuterated-retinol-dilution method. American Journal of Clinical Nutrition, 69:278–284.
Rosales FJ, Kjolhede C, Goodman S (1996) Efficacy of a single oral dose of 200,000 IU of oil-soluble vitamin A in measles-associated morbidity. American Journal of Epidemiology, 143:413–422.
Rothman KH, Greenland S (1998) Modern epidemiology. 2nd edn. Lipponcott-Raven Publishers, Philadelphia, PA.
254 Comparative Quantification of Health Risks

Samba DC, Basco LK, Bleiberg-Daniel F, Lemmonier D, Le Bras J (1992) Absenceof effect of retinol on the in vitro development of Plasmodium falciparum.International Journal for Vitamin and Nutrition Research, 62:99–100.
Semba RD, Bloem MW (2002) The anemia of vitamin A deficiency: epidemiologyand pathogenesis. European Journal of Clinical Nutrition, 56:271–281.
Semba RD, Miotti PG, Chiphangwi JD et al. (1998) Maternal vitamin A deficiency and infant mortality in Malawi. Journal of Tropical Pediatrics,44:232–234.
Serghides L, Kain KC (2002) Mechanism of protection induced by vitamin A infalciparum malaria. The Lancet, 359:1404–1406.
Shankar AH (1995) Vitamin A and malaria. American Journal of Clinical Nutrition, 62:842–843.
Shankar AH (2001) Nutritional modulation of immunity and infection. In:Present knowledge in nutrition. 8th edn. Bowman BA, Russell RM, eds. International Life Sciences Institute Press, Washington, DC.
Shankar AH, Genton B, Semba RD et al. (1999) Effect of vitamin A supple-mentation on morbidity due to Plasmodium falciparum in young children inPapua New Guinea: a randomised trial. The Lancet, 354:203–209.
Sommer A (1982) Nutritional blindness: xerophthalmia and keratomalacia.Oxford University Press, New York.
Sommer A, Davidson FR (2002) Assessment and control of vitamin A deficiency:the Annecy accords. Journal of Nutrition, 132:S2845–2850.
Sommer A, Tarwotjo I, Djunaedi E et al. (1986) Impact of vitamin A supple-mentation on childhood mortality. A randomised controlled community trial.The Lancet, 1:1169–1173.
Sommer A, Tarwotjo I, Katz J (1987) Increased risk of xerophthalmia followingdiarrhea and respiratory disease. American Journal of Clinical Nutrition,45:77–80.
Sommer A, West KP Jr. (1996) Vitamin A deficiency: health, survival and vision.Oxford University Press, New York.
Sommer A, Zeger SL (1991) On estimating efficacy from clinical trials. Statisticsin Medicine, 10:45–52.
Stephensen CB (2001) Vitamin A, infection, and immune function. AnnualReview of Nutrition, 21:167–192.
Stoltzfus RJ, Jalal F, Harvey PW, Nesheim MC (1989) Interactions betweenvitamin A deficiency and Plasmodium berghei infection in the rat. Journal ofNutrition, 119:2030–2037.
Sturchler D, Tanner M, Hanck A et al. (1987) A longitudinal study on relationsof retinol with parasitic infections and the immune response in children ofKikwawila village, Tanzania. Acta Tropica, 44:213–227.
Tabone MD, Muanza K, Lyagoubi M et al. (1992) The role of interleukin-6 invitamin A deficiency during Plasmodium falciparum malaria and possibleconsequences for vitamin A supplementation. Immunology, 75:553–554.
Amy L. Rice et al. 255

Thurnham DI, Singkamani R (1991) The acute phase response and vitamin Astatus in malaria. Transactions of the Royal Society of Tropical Medicine andHygiene, 85:194–199.
Tielsch JM, Rahmathullah L, Katz J, Thulasiraj RD, Coles CL, Devi S (2001)Impact of vitamin A supplementation for newborns on early infant mortal-ity: a community-based, randomized trial in South India. (Presented at theXX International Vitamin A Consultative Group Meeting 2001 in Hanoi, VietNam).
Tonascia JA (1993) Meta-analysis of published community trials: impact ofvitamin A on mortality. (Proceedings of the Bellagio meeting on vitamin Adeficiency and child mortality.) Helen Keller International, New York.
UNICEF (2001) The state of the world’s children 2001. UNICEF, New York.
West KP Jr. (2002) Extent of vitamin A deficiency among preschool children and women of reproductive age. Journal of Nutrition, 132:S2857–2866.Erratum in: Journal of Nutrition, 2002;132:3432.
West KP Jr., Katz J, Khatry SK et al. (1999) Double blind, cluster ran-domised trial of low dose supplementation with vitamin A or beta caroteneon mortality related to pregnancy in Nepal. British Medical Journal,318:570–575. Erratum in British Medical Journal, 1999;318:1386.
West KP Jr., Katz J, Shrestha SR et al. (1995) Mortality of infants <6 months ofage supplemented with vitamin A: a randomized, double-masked trial inNepal. American Journal of Clinical Nutrition, 62:143–148.
West KP Jr., Pokhrel RP, Katz J et al. (1991) Efficacy of vitamin A in reducingpreschool child mortality in Nepal. The Lancet, 338:67–71.
WHO (1992) International statistical classification of diseases and related healthproblems, 10th revision. World Health Organization, Geneva.
WHO (1995) Global prevalence of vitamin A deficiency. (MDIS Working PaperNo. 2. WHO/NUT/95.3). World Health Organization, Geneva.
WHO (1996) Indicators for assessing vitamin A deficiency and their applicationin monitoring and evaluating intervention programmes. (WHO/NUT/96.10).World Health Organization, Geneva.
World Bank (1993) World development report 1993: investing in health. OxfordUniversity Press, New York.
256 Comparative Quantification of Health Risks


![Practical Laboratory Medicine1. Introduction Vitamin C (L-ascorbic acid, AA) is a water-soluble micronutrient that is required for human health [1].Deficiency of vitamin C causes scurvy,](https://img.dokumen.tips/doc/110x75/5e93cb9fb81e373c172b842b/practical-laboratory-medicine-1-introduction-vitamin-c-l-ascorbic-acid-aa-is.jpg)