Embed Size (px)
Citation preview

Vital Voices: Lessons Learned from Board Members of Color Vernetta L. Walker Director of Consulting Deborah J. Davidson Vice President, Governance Research and Publications BoardSource 1828 L Street NW, Suite 900 Washington, DC 20036 www.boardsource.org

Page 2 of 18
Introduction In order to function at the highest level, nonprofit boards need to ensure that their members represent diverse points of view. It is not enough, however, to “diversify” a board; boards must be inclusive in their policies and practices, thereby creating a culture that encourages and nurtures diverse expression.
Our organization, BoardSource, is a national nonprofit dedicated to advancing the public good by building exceptional nonprofit boards and inspiring board service. We wanted to test how our belief in the importance of inclusivity played out in actual boardrooms, so we conducted a survey and series of focus groups in 2009-2010 and asked questions about attitudes toward and experiences with nonprofit board service.
Unlike other methodologies reported in recent years, however, our survey focused exclusively on the attitudes and experiences of people of color who serve on nonprofit boards. We asked about recruitment practices, on-boarding processes, and board culture and dynamics to ascertain whether diversity was accompanied by inclusivity.
In a classic Harvard Business Review article, Thomas and Ely (1996) first articulated a principle that guided our thinking: that integration (what we call inclusivity) is critical to finding the balance between two opposing views of diversity. Essentially, we interpreted their paradigm to mean that we are all alike (their “discrimination-and-fairness” paradigm) and that we are all different (their “access-and-legitimacy” paradigm). While Thomas and Ely focused on the corporate workplace, we think their concepts are applicable to any group of people recruited to work together, including nonprofit boards of directors.
Background Demographic Surveys of Boards
Much of the existing literature on diversity on boards of directors focuses on determining the level of diversity on boards; some authors then report strategies in place for increasing it or posit new ones. Francie Ostrower and The Urban Institute’s large-scale study of U.S. nonprofits found that 14 percent of board members are non-white, while 51 percent of nonprofit boards are entirely white, non-Hispanic. (2007). A Rockefeller Philanthropy Advisors study the following year found a similar figure in foundation boards. (Chao, Parshall, Amador, Shah and Yanez, 2008). Other surveys reported more localized results.
McGill, Bryan, and Miller (2009) conducted the first U.S. study that simultaneously examined the racial and ethnic demographics of New York City foundations and nonprofit organizations; this study established baseline data on the demographic composition of foundation boards and staff and on how diversity considerations factor into their policies and grantmaking practices. The authors found that one-third of their study’s charity board members and chief executives are people of color (New York City is 65 percent non-white overall). Racial diversity was considerably lower on foundation boards, however; only 17 percent were board members of color.
A similar demographic survey for California’s nonprofit sector, where the state is 57 percent non-white, found 28 percent board members of color (DeVita and Roeger, 2009). Twenty-two percent of Milwaukee nonprofit boards have people of color serving on them (Percy, Kovari and Davis, 2008). An earlier study

Page 3 of 18
of Allegheny county nonprofit boards found 13 percent minority membership (Constance-Huggins and Bangs, 2003), and a very recent survey of Baltimore-Washington region nonprofit boards found 27 percent representation by people of color (DeVita and Roeger, 2010).
Attempts to Diversify the Board
Fredette, Bradshaw, and Inglis (2006) interviewed Canadians who were attempting to diversify their boards and reported a focus on recruitment from “marginalized” communities rather than people of color per se. Focusing on power differentials between those communities and the dominant culture, they uncovered strategies for and approaches to inclusion:
Advertise in ethno-specific publications.
Partner with ethno-cultural organizations to make them aware of available positions and to help identify qualified candidates.
Target individuals who are active within the community.
Build links to services that search for or match boards and qualified board members.
Advertise in major newspapers.
Send e-communications to potential board members when openings become available.
Publish board vacancies on a website.
Mobilize board members to recruit through their networks.
The authors also suggested practices for board meetings that might help foster greater inclusivity:
Hold meetings at times that are convenient for board members with care-giving responsibilities.
Hold meetings in locations that are wheelchair accessible.
Ensure that foods served meet cultural and personal preferences of all board members.
In another Canadian study, Bradshaw, Fredette, and Sukornyk (2009) found a marked lack of ethnic diversity on boards but reported that more-diverse boards were perceived as more effective; policies and practices we found to be helpful in increasing inclusion in our study were more evident on these boards, including printed board policies related to racial, ethnic, or gender board representation; existence of a board diversity committee; and board plans that incorporated diversity goals.
Of the Milwaukee organizations that had discussed diversity issues in the past two to three years, 59 percent had discussed or made an effort to expand their board’s diversity (Percy, Kovari and Davis, 2008). The Allegheny study suggested barriers to board diversity that included not making diversity a priority, conflicting demands on board members’ time, increased competition for board members, and board members’ desire to associate with people similar to themselves.
Diversity Policies
A third of New York City nonprofits surveyed (31 percent) had board diversity policies; 38 percent had them for staff and 17 percent for vendors and consultants (McGill, Bryan, and Miller). Wesley Miller (2009) reported that 59 percent of Michigan nonprofits surveyed had a formal diversity and/or inclusion policy. In our study, a third of our respondents said having such a policy was the second most important route to inclusivity.

Page 4 of 18
Diversity and Performance
While the assumption from the responding organizations in these studies appeared to be that enhanced diversity was desirable, Brown (2002) found a contradictory view in his literature review: Half of the articles reported that board members thought diversity encouraged innovation and enhanced performance, and half reported that the diversity of viewpoints led to discord and frustration. He found that racial diversity was only moderately associated with optimal board performance; the most significant predictor of board performance vis-à-vis diversity was the board’s attitude about it.
Methodology BoardSource developed the Vital Voices: Lessons Learned from Board Members of Color (Vital Voices) survey with assistance from members of an Advisory Committee1. Conducted in October 2009, the survey had as its goal to gain a better understanding of the experiences of board members of color. We sent the survey to BoardSource’s members and to individuals in a wide range of nonprofit organizations.
Race/Ethnicity: We analyzed data only from individuals who self-selected themselves as people of color by answering the question: Do you consider yourself to be a person of color? We also restricted our final data set to individuals who currently serve or formerly served on one or more “mainstream”2 nonprofit boards. Out of 690 responses, we analyzed data from 550 individuals. Of those, 72 percent were African American/Black; 12 percent Hispanic, Latin or Spanish; 9 percent Asian; 3 percent two or more races; 2 percent American Indian or Alaska Native, 2 percent other.
Board Service: Of the people of color (POC) who responded to the survey, most (86 percent) are currently serving on one or more mainstream nonprofit boards. Almost half (46 percent) have served more than six years, while almost a third (32 percent) have served between three and six years, with the remaining (21 percent) having served on the board of a nonprofit organization for fewer than three years. The split between those that have served as board chair (47 percent) and those that have not (52 percent) is almost equal.
Additionally, we conducted a total of five focus groups in three locations: two in Lansing, MI; one in Baltimore, MD; and two Minneapolis, MN. The focus groups were not limited to people of color, and each group had an average of 15 participants.
In Michigan, we partnered with the Council of Michigan Foundations to engage focus group participants. This was the only focus group that targeted foundation trustees.
In Baltimore we worked with faculty from Coppin State University’s American Humanics Program. Our audience for that session consisted of students from the Nonprofit Leadership Program. Only a few of the students had experience serving on a nonprofit board. All had opinions on diversity and inclusion related to future leadership in the nonprofit sector.
In Minneapolis we worked with Target Corporation, a funder of nonprofits in the Twin Cities area. Our audiences there consisted of board members representing a variety of nonprofit organizations.
1 The following individuals served on the Vital Voices Advisory Committee: Kimberly Burton, Vice President of
2 Mainstream in this context means organizations not organized around a particular racial or ethnic group, e.g.,
Congressional Black Caucus Foundation.
Page 5 of 18
In setting forth the results, we’ve included, where appropriate, data from the 1993, 2007, and 2010 BoardSource Governance Index, a comprehensive study of nonprofit board practices in the United States.3
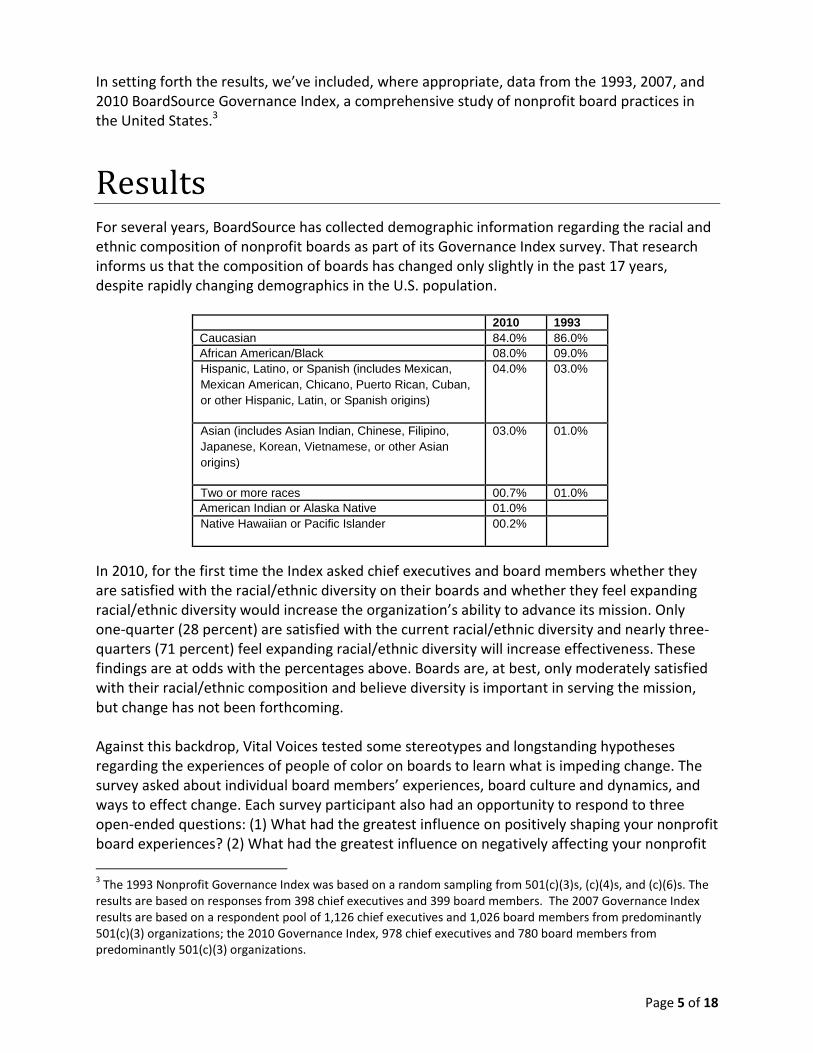
Results For several years, BoardSource has collected demographic information regarding the racial and ethnic composition of nonprofit boards as part of its Governance Index survey. That research informs us that the composition of boards has changed only slightly in the past 17 years, despite rapidly changing demographics in the U.S. population.
2010 1993
Caucasian 84.0% 86.0%
African American/Black 08.0% 09.0%
Hispanic, Latino, or Spanish (includes Mexican,
Mexican American, Chicano, Puerto Rican, Cuban,
or other Hispanic, Latin, or Spanish origins)
04.0% 03.0%
Asian (includes Asian Indian, Chinese, Filipino,
Japanese, Korean, Vietnamese, or other Asian
origins)
03.0% 01.0%
Two or more races 00.7% 01.0%
American Indian or Alaska Native 01.0%
Native Hawaiian or Pacific Islander 00.2%
In 2010, for the first time the Index asked chief executives and board members whether they are satisfied with the racial/ethnic diversity on their boards and whether they feel expanding racial/ethnic diversity would increase the organization’s ability to advance its mission. Only one-quarter (28 percent) are satisfied with the current racial/ethnic diversity and nearly three-quarters (71 percent) feel expanding racial/ethnic diversity will increase effectiveness. These findings are at odds with the percentages above. Boards are, at best, only moderately satisfied with their racial/ethnic composition and believe diversity is important in serving the mission, but change has not been forthcoming. Against this backdrop, Vital Voices tested some stereotypes and longstanding hypotheses regarding the experiences of people of color on boards to learn what is impeding change. The survey asked about individual board members’ experiences, board culture and dynamics, and ways to effect change. Each survey participant also had an opportunity to respond to three open-ended questions: (1) What had the greatest influence on positively shaping your nonprofit board experiences? (2) What had the greatest influence on negatively affecting your nonprofit
3 The 1993 Nonprofit Governance Index was based on a random sampling from 501(c)(3)s, (c)(4)s, and (c)(6)s. The
results are based on responses from 398 chief executives and 399 board members. The 2007 Governance Index results are based on a respondent pool of 1,126 chief executives and 1,026 board members from predominantly 501(c)(3) organizations; the 2010 Governance Index, 978 chief executives and 780 board members from predominantly 501(c)(3) organizations.

Page 6 of 18
board experience? (3) What are the three most important things a nonprofit board can do to be more inclusive? Focus groups were also structured to dig a little deeper into these same topics and provide qualitative information and insights to supplement the survey data. These conversations focused more intently, though, on change — who should lead change, how should change be accomplished, and what is the role of leadership?
I. Individual Board Member Experiences The Decision to Serve on the Board of a Nonprofit Organization Survey respondents were given the option of selecting among seven common factors that typically influence an individual’s decision to serve on a nonprofit board. The scale ranged from “not at all important,” to “very important,” and only one factor could be selected as very important.
Sixty-four percent selected “passion for the mission” as very important, followed closely by “opportunity to give back to the community” with 61 percent. The third and fourth highest responses were “opportunity for professional growth” and “the organization’s need for my professional skills,” with 24 percent and 23 percent respectively.

Page 7 of 18
The 2007 Governance Index also asked about board members’ top considerations when deciding to join a nonprofit board. When comparing those results, there is nothing that manifestly distinguishes people of color from the larger audience sampled in the 2007 Index. Although the questions were framed differently in the two surveys, mission was clearly the leading consideration, with 80 percent selecting it as their top consideration in the Index.
Perception of Acceptance Survey and focus group participants had an opportunity to respond to questions that allowed them to reflect on their experiences post-recruitment. This produced the first evidence that board members of color perceived their experience as being different from other board members. As a follow up to why individuals joined the board, we probed about the extent to which they felt comfortable within their boards and able to contribute or participate.
Over half (55 percent) of the survey respondents almost always felt comfortable voicing their ideas and opinions. Half said they were never treated differently because of race/ethnicity and 47 percent said they were encouraged to be themselves with fellow board members. Additionally, 40 percent of respondents indicated they felt their ideas and opinions were valued, 41 percent felt they had the same opportunities as others for leadership or officer positions, and 37 percent felt comfortable discussing issues of diversity with board members. This is encouraging until you consider that almost 26 percent only “sometimes” or “never” feel encouraged to be themselves or feel they have the same opportunities for leadership within the board.
2007 Board Members’ Top Considerations
When Deciding to Join a Board
Fit of the mission with personal interests 80% Personal connection to the organization 38% Invitation from a friend or colleague 36% Need for your professional skills 36% Personal/professional development 28% Reputation/prestige of the organization 24% Expertise in the organization’s field 18%

Page 8 of 18
Interestingly, the longer individuals served on the board, the more they felt they were treated
differently.
To what extent did you feel you were treated differently than other board members because of your race/ethnicity?
Fewer than 3 years 69% Never
3-6 years 51% Never
More than 6 years 41% Never
Also, there appears to be a gap between how comfortable board members of color feel voicing their
opinions (55 percent almost always) and whether they felt their opinions were valued (40 percent
almost always).
We asked focus group participants whether they felt their organizations valued diversity and inclusion on their boards. Again, the responses represented a range of personal experiences. However, several participants said they felt it was part of their role to create change. The responses listed below, which have been paraphrased, are representative of what we heard.
After participating for some time, that’s when I heard my own voice. People of color do have a lot to offer from our particular backgrounds. If that’s not what they are looking for, that’s okay; we still have a voice on the board. It’s an evolution in some ways.
There’s authenticity in seeking diversity to help with donor recruitment and seeking racial and ethnic diversity in grant making. Consciously or unconsciously the skills — attorney, CPA, etc. — are the first tier of needs for donor development, then the racial/diversity lens for access to and representation from communities.
Our job is to make sure the conversation about equity and minority needs is addressed. If we don’t speak up, we’re not doing our job.
The foundation values my presence. When I became chair, there was a message that the foundation would not accomplish its goals without white leadership. I faced challenges, built support, and exceeded expectations. We all know when we’ve hit a pulse and hidden values are challenged; interesting behaviors and reactions surface.
If we don’t open the door enough to have an open dialogue from every perspective, we’re not doing our job. We need equity accountability.
Coming together without changing attitudes doesn’t mean anything. Until we get to the attitude that we have shared community interests, it’s just a pleasant experience but nothing’s changed.
There’s still a perception or misunderstanding that diverse boards cannot perform as well as non-diverse boards, and that is what’s driving board interactions.
We need CEOs with different priorities. We won’t get more diverse trustees and staff without more CEOs who value inclusion.
I’ve served on three heavy-hitting boards. On these boards, the board members are strictly about wealth and influence, not other skills. The conversations do not always include you, if you are not a part of their “group.”
When we looked at expanding our diversity to include non-white vendors, there was some tension. We wanted to do this because as board members we can say one thing,

Page 9 of 18
but we also have to show that we value diversity throughout every level of the organization.
There are sometimes fake conversations between meetings. Sometimes people are trying to connect with me, but it comes off cheesy. They like to claim that they have people of color on the board, but they don’t want me to challenge the status quo and really add diversity. It makes them feel good that they can sit next to someone like me.
Experiences that Positively Shaped the Board
Experience We asked survey respondents to share the experiences that most positively shaped their nonprofit board experience. The 366 responses to this open-ended question were organized into categories based on recurring themes: board culture, recruitment, orientation, leadership, policies, and mission.
In some instances, comments were counted under two or more categories, for example:
Being able to speak openly while on the board about the issues and having the opportunity to chair the board or a significant committee.
This comment was counted both under the categories of culture and leadership opportunity.
Of the 366 responses, 40 percent attributed their positive experiences to board culture. This was almost twice as many as the next leading category, leadership opportunities, with 21 percent. The organization’s mission was mentioned by 9 percent, followed by orientation (7 percent), recruitment (4 percent), and policies (1 percent).
What positively influenced your
experience?
“I had the pleasure when I first served
on a board…to work with an individual
who truly did not see or recognize color.
She was passionate about the mission
but always diplomatic regarding the
differences among board members. She
actively recruited a diverse board. I felt
comfortable expressing differing points
of view, which was an excellent way to
begin. She also ensured that I received a
board orientation so that I would know
the expectations and requirements of a
board member.”
“Key for me has been the fact that my
boards truly value the diversity of
opinions and recognize that diversity
adds richness to the decision-making
process.”

Page 10 of 18
Experiences that Negatively Shaped the Board Experience 331 individuals responded to our question about negative influences on their nonprofit board experience. Of that group, 57 indicated that they had no negative experiences to relay. The 274 responses about negative influences were categorized as follows:
1. Board culture 2. Tokenism 3. Financial Expectations/Fundraising 4. Leadership (more specifically, negative experiences
associated with the tone set by the board leaders or chief executive)
5. Access to power (remarks that power was held by a close inner circle and/or perception that people of color could not hold certain leadership positions)
6. Voice for all (expectation that one individual was the “voice” for entire community or racial/ethnic group)
7. Lack of genuine commitment to diversity and inclusion 8. Too few people of color (feeling of isolation but not
tokenism)
As with the positive influences, many of the responses applied to two or more categories such as the following:
Being totally ignored following my year as board president. I was blatantly left out of group pictures, received no invitations to events, and could count on one hand the number of actual friends gained through my 10 years of service. Despite my having far more education and experience than many who previously served, my having been promoted merely because of my race appeared evident.
We counted the above comment under board culture and tokenism. Although we separated board culture and tokenism, we recognize that there is a strong argument that tokenism is a subcategory of board culture.
Additionally, we distinguished between tokenism and “too few people of color.” We utilized tokenism when the respondent’s perception of other’s actions or attitudes resulted in the individual feeling marginalized. Examples include:
Being ignored or being the lone minority voice that is constantly outvoted and not taken seriously; however looks good in the photo ops.
Being treated as the ‘diversity member’ instead of simply a member of the board.
Being treated like a token. Having decisions made by a small group of ‘insiders.’ Not being heard. Being treated with condescension or as though I am invisible.
By contrast, individuals who commented that there were too few people of color, or that they were the only person of color, offered this information:
I remain the only one and feeling alone.
The greatest negative influence is serving on a board for too long with too few POC.
What negatively influenced your
experience?
“Being reminded, most often in
subtle ways, that I was not a
‘heavy-hitter’…that is, what I
brought to the table was ‘diversity,’
not prestige, skills, resources, or
connections of substance.”
“Being treated as ‘window dressing’
and not having my thoughts taken
into account.”
“Having my role on the board
singled out as simply fulfilling a
funder’s diversity quota.”
Page 11 of 18
We found that the most frequently cited negative influence was board culture, with 36 percent, meaning board culture is the single greatest influence — positive and negative — on board member experience. The next most frequently mentioned response was tokenism (11 percent), followed by too few people of color and lack of commitment to diversity and inclusion (8 percent each), financial expectations and access to power (6 percent each), voice for all (6 percent), and leadership (4 percent).
II. Board Culture and Dynamics
Nonprofit leaders have different perceptions about what the board’s norms should be. These norms also will differ from board to board, but one thing is clear: Culture determines who makes the decisions, who speaks to whom and in what manner, how individuals relate to each other, and even where board members sit at the board table.4 Culture can be hard to pin down, but we attempted to do just that starting with the tone set by the chief executive and board.
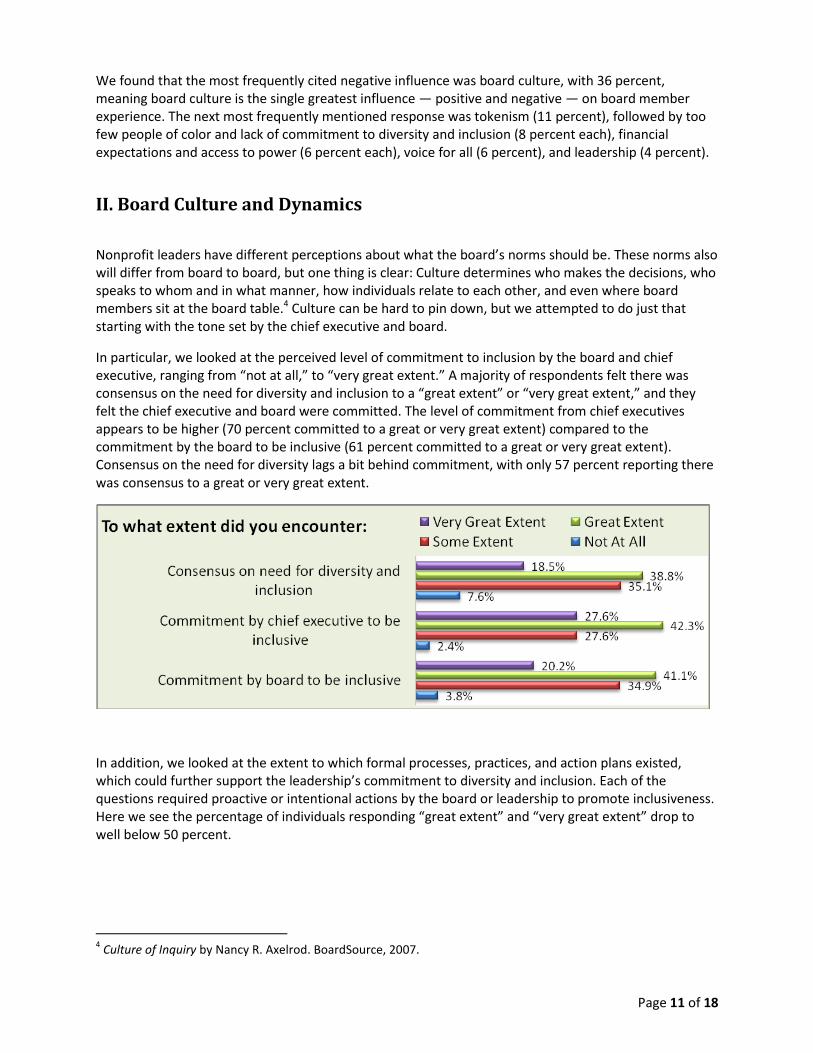
In particular, we looked at the perceived level of commitment to inclusion by the board and chief executive, ranging from “not at all,” to “very great extent.” A majority of respondents felt there was consensus on the need for diversity and inclusion to a “great extent” or “very great extent,” and they felt the chief executive and board were committed. The level of commitment from chief executives appears to be higher (70 percent committed to a great or very great extent) compared to the commitment by the board to be inclusive (61 percent committed to a great or very great extent). Consensus on the need for diversity lags a bit behind commitment, with only 57 percent reporting there was consensus to a great or very great extent.
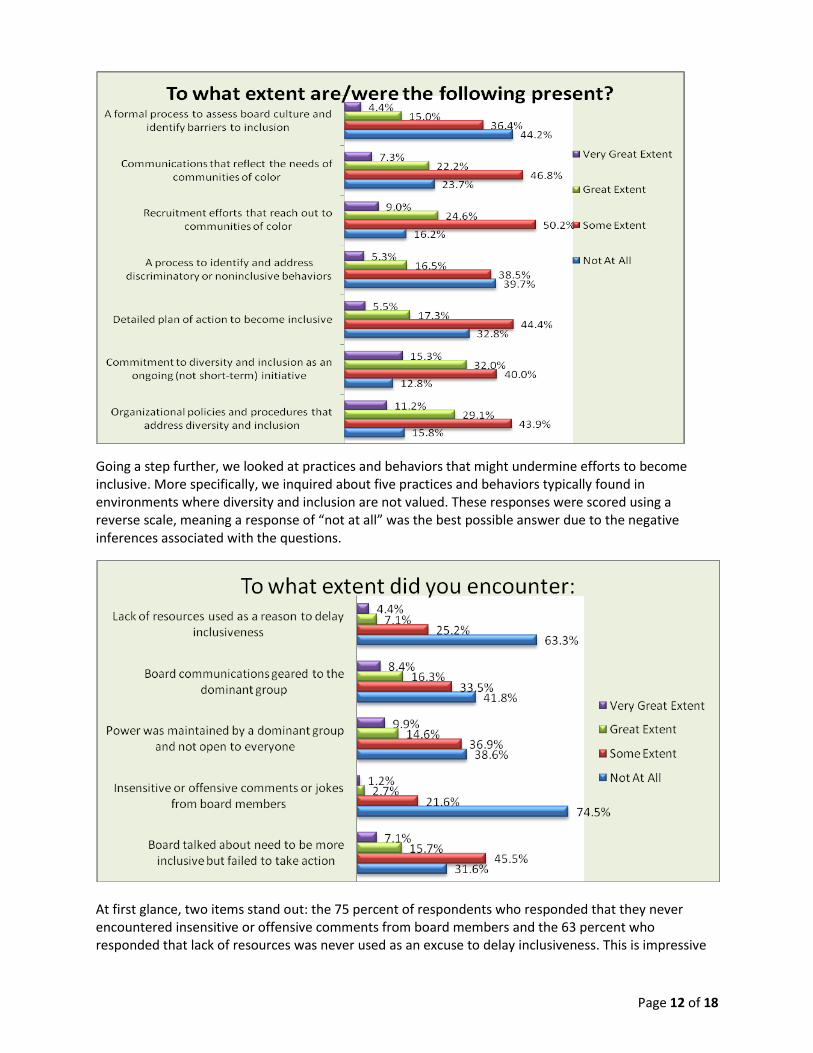
In addition, we looked at the extent to which formal processes, practices, and action plans existed, which could further support the leadership’s commitment to diversity and inclusion. Each of the questions required proactive or intentional actions by the board or leadership to promote inclusiveness. Here we see the percentage of individuals responding “great extent” and “very great extent” drop to well below 50 percent.
4 Culture of Inquiry by Nancy R. Axelrod. BoardSource, 2007.
Page 12 of 18
Going a step further, we looked at practices and behaviors that might undermine efforts to become inclusive. More specifically, we inquired about five practices and behaviors typically found in environments where diversity and inclusion are not valued. These responses were scored using a reverse scale, meaning a response of “not at all” was the best possible answer due to the negative inferences associated with the questions.
At first glance, two items stand out: the 75 percent of respondents who responded that they never encountered insensitive or offensive comments from board members and the 63 percent who responded that lack of resources was never used as an excuse to delay inclusiveness. This is impressive
Page 13 of 18
until you consider that 25 percent had encountered insensitive comments, at least to some extent, and 36 percent of respondents were confronted with lack of resources as an excuse to delay inclusion. Responses to the other categories (communications geared to the dominant group, power was maintained by a dominant group, and the board failed to act on its verbal commitment) were more evenly spread among the four answer choices.
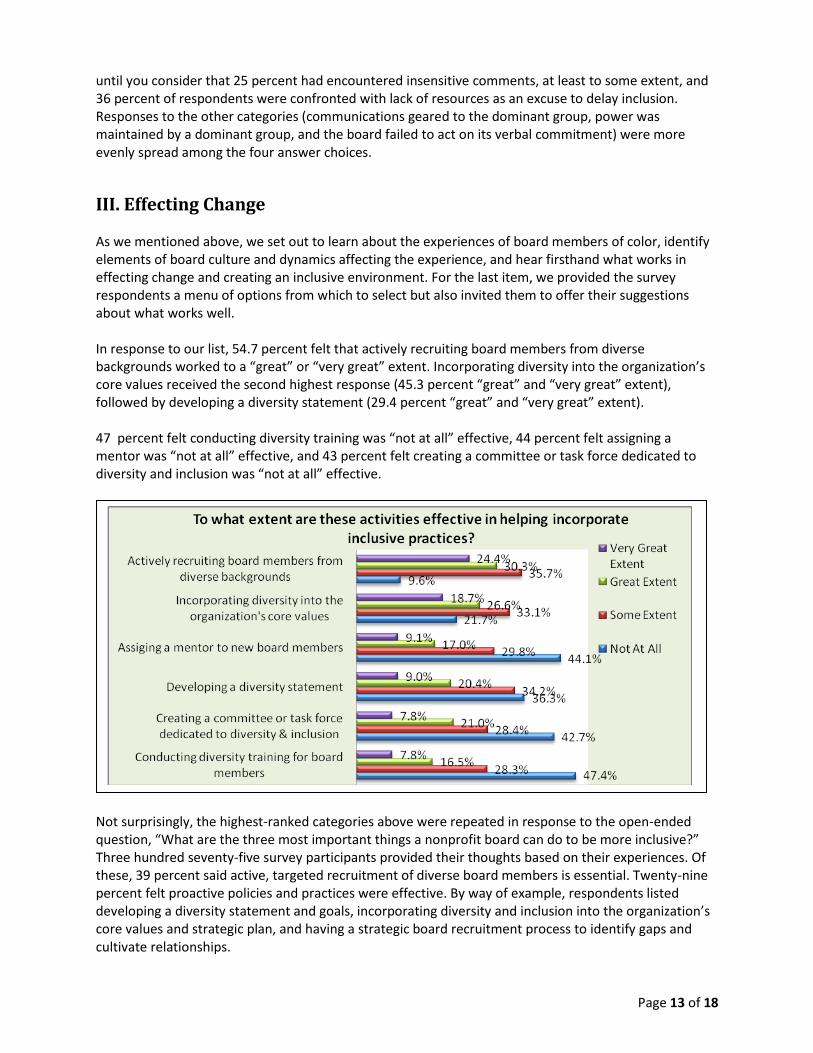
III. Effecting Change As we mentioned above, we set out to learn about the experiences of board members of color, identify elements of board culture and dynamics affecting the experience, and hear firsthand what works in effecting change and creating an inclusive environment. For the last item, we provided the survey respondents a menu of options from which to select but also invited them to offer their suggestions about what works well. In response to our list, 54.7 percent felt that actively recruiting board members from diverse backgrounds worked to a “great” or “very great” extent. Incorporating diversity into the organization’s core values received the second highest response (45.3 percent “great” and “very great” extent), followed by developing a diversity statement (29.4 percent “great” and “very great” extent). 47 percent felt conducting diversity training was “not at all” effective, 44 percent felt assigning a mentor was “not at all” effective, and 43 percent felt creating a committee or task force dedicated to diversity and inclusion was “not at all” effective.
Not surprisingly, the highest-ranked categories above were repeated in response to the open-ended question, “What are the three most important things a nonprofit board can do to be more inclusive?” Three hundred seventy-five survey participants provided their thoughts based on their experiences. Of these, 39 percent said active, targeted recruitment of diverse board members is essential. Twenty-nine percent felt proactive policies and practices were effective. By way of example, respondents listed developing a diversity statement and goals, incorporating diversity and inclusion into the organization’s core values and strategic plan, and having a strategic board recruitment process to identify gaps and cultivate relationships.

Page 14 of 18
Twenty-three percent mentioned the need to understand the value of diversity and embrace diverse perspectives, and 23 percent also mentioned the need to openly discuss diversity and inclusion issues, including potential barriers and whether their efforts are working.
Other steps deemed effective included:
Providing education/training on diversity and cultural competence (12 percent)
Involving diverse board members in board work and decisions (12 percent)
Ensuring the board reflects the community served (6 percent)
Providing mentors (6 percent)
Encouraging and supporting leadership opportunities for board members of color (5 percent)
Getting the leadership (board chair and chief executive) to commit and demonstrate commitment to diversity and inclusion (4 percent)
Several respondents included commentary that organizations should take steps to be visible and establish relationships in communities of color through outreach and programs. Related to this, some noted their concern that communications reflect the organization’s commitment to diversity and inclusion.
The items mentioned are a mixture of policies, practices, and ways to integrate inclusion into the culture of the board and organization. Starting with the 2010 Governance Index, BoardSource began collecting baseline data about diversity and inclusion practices. As a result, we do not currently have data to indicate how long practices have been in place, whether there’s been an increase in activity, or what the boards would rate as the most effective practices. The two tables below do reflect, however, a significant amount of intentional activity aimed at increasing diversity and inclusion in nonprofit boardrooms. We will need additional research to determine if these efforts are having the desired impact — creating a culture that encourages and nurtures diverse expression, involvement, and acceptance of board members of color.
Create an environment where everyone feels comfortable expressing views, even if the views are unpopular. Value and embrace the diversity of opinions and perspectives that people of color can bring to the board. Examine motivation for being inclusive and determine if inclusion will help the board to become more effective at its mission.

Page 15 of 18
2010 Governance Index:
Relative to diversity on the board, to what extent has the board done the following?
Not done
Small extent
Some extent
Great extent
1. Evaluated and modified its recruitment efforts specifically to reach members with more diverse backgrounds
24.6% 25.5% 37.8% 12.1%
2. Actively recruited board members from diverse backgrounds 18.7% 25.0% 37.3% 19.1%
3. Reached consensus about the value and benefits of expanding diversity of the board
26.3% 21.0% 32.2% 20.4%
4. Discussed ways to identify and address discriminatory or non-inclusive behaviors
51.9% 25.6% 17.3% 5.2%
5. Developed an inclusive culture and inclusive board dynamics 26.1% 24.5% 34.3% 15.0%
Has your organization or board done the following? Yes No
Incorporated diversity into the organization’s core values 62.9% 37.1%
Modified organizational policies and procedures to be more inclusive 55.8% 44.2%
Conducted diversity training for board members 12.1% 87.9%
Developed a detailed plan of action for the board to become inclusive 14.8% 85.2%
Talked to you about non-inclusive practices or offensive behaviors that
occurred during board events 6.4% 93.6%

Page 16 of 18
Conclusions and Recommendations People of color join nonprofit boards for the same reasons all people do, regardless of race and ethnicity — because they care about the mission of the organization. While our review of the literature found minorities underrepresented on nonprofit boards, the numbers only tell a small part of the story. Once people of color begin to serve on boards, whether that board service becomes a positive or negative experience depends to a great extent upon what we call board culture — the atmosphere of acceptance and comfort or lack thereof — that distinguishes the particular board. This finding held on both the positive and the negative sides; 40 percent of respondents who had a positive board experience attributed it to the influence of board culture, double the next-highest category. Conversely, those who had a negative board experience also attributed that to the influence of board culture, three times the next-highest category.
As we examined the perception of acceptance by board members of color, we found that, while the overall pattern was quite encouraging, the weakest responses were to the statement, “You had the same opportunities as others for leadership positions,” with more than a third indicating only “sometimes” or “never.” We see this as an area where boards most need improvement; in a truly inclusive environment, all board members would perceive their leadership opportunities as equal. Since we believe culture begins at the top of an organization, it is even more crucial that people of color be afforded opportunities to assume leadership roles. This is not to imply that only individuals of color can set an organizational tone of inclusivity, but both inside and outside stakeholders should be made aware that the organization takes diversity and inclusion seriously; one of the best ways to do that is to show it, not tell it, through the consistent presence of leadership by people of color — as board and committee chairs and as senior management. Much of the current thinking on diversity and inclusion addresses the need for the leadership of organizations — chief executive and board — to make a commitment to diversity and inclusion, which is often demonstrated as being open to change and sharing power.
We heard loud and clear that board members of color want their boards to demonstrate a commitment to diversity and inclusion on multiple levels, not only through leadership but also through recruitment, policies, power-sharing, and social activities. Once again, it begins at the top: The board and chief executive must make the commitment to developing a culture of inclusivity in all these matters. We recommend that all boards evaluate themselves in this regard and develop policies and procedures that demonstrate their commitment to diversity and inclusion. Here is BoardSource’s policy, which could be adapted by boards to suit the mission of their organizations:
BoardSource’s work in the area of diversity and inclusion is based upon our fundamental belief that the best boards are composed of individuals who bring a variety of skills, perspectives, backgrounds, and resources to tackle the complex and strategic challenges confronting their organizations. The variety of viewpoints that comes from different life experiences and cultures enhances the discussions and decisions of boards and often adds a much needed layer of accountability to foundations and nonprofits for their constituents.
In fact, the chart on page 12 (“To what extent are/were the following present?”) comprises a series of marching orders for boards. While the boards represented in our sample did not distinguish themselves

Page 17 of 18
on these measures, we present them as recommendations. As an important part of their efforts toward increasing inclusivity, boards should have
a formal process to assess board culture and identify barriers to inclusion
communications that reflect the needs of communities of color
recruitment efforts that reach out to communities of color
a process to identify and address discriminatory or non-inclusive behaviors
a detailed plan of action to become inclusive
a commitment to diversity and inclusion as an ongoing (not short-term) initiative
organizational policies and procedures that address diversity and inclusion
We believe our survey results validated our belief that there are specific board practices that are effective in helping to foster inclusivity and recommend that boards begin by incorporating the two that our sample found most effective: actively recruiting board members from diverse backgrounds and incorporating diversity into the organization’s core values. While four other practices were found not to be effective in fostering inclusivity, we believe the results may be the fault of the way in which we asked the question, not that those practices would not be helpful. We asked the questions in such a way that we believe that the respondent couldn’t distinguish between having these practices (assigning a mentor to new board members, developing a diversity statement, creating a committee or task force dedicated to diversity and inclusion, and conducting diversity training for board members) and rating their effectiveness. If their board did not have the practices but they believed it would be effective if it did, respondents could not express that. Future research will correct this deficiency.
Finally, reflecting on this project, we believe our somewhat unorthodox approach — surveying only board members of color — was successful because we were able to ask questions that would be difficult for members of the dominant culture to answer (e.g., “To what extent was power…maintained by a dominant group and not open to everyone?” or “To what extent were insensitive or offensive comments or jokes from board members present?” We believe that asking only people of color these questions allowed the respondents to answer more freely than might otherwise have been the case; 10 percent answered the power question in the affirmative and, sadly, 25 percent said offensive comments were present to at least some extent. Clearly, there is more work to be done.

Page 18 of 18
Bibliography Axelrod, N. (2007) Culture of Inquiry. Washington, DC: BoardSource.
BoardSource Governance Index, 1993, 2007, and 2010. Washington, DC: BoardSource, 2007 and 2010.
Bradshaw, P., Fredette, C., and Sukornyk, L. (2009) “A Call to Action: Diversity on Canadian Not-for-Profit
Boards.” Schulich School of Business.
Brown, W. (2002) “Racial Diversity and Performance of Nonprofit Boards of Directors.” Center for
Nonprofit Leadership and Management.
Chao, J., Parshall, J., Amador, D., Shah, M., and Yanez, A. (April 2008) “Philanthropy in a Changing
Society: Achieving Effectiveness through Diversity.” Rockefeller Philanthropy Advisors.
Constance-Huggins, M. and Bangs, R. (October 2003) “Diversity Within and Among Boards in Allegheny
County.” University Center for Social and Urban Research, University of Pittsburgh.
Daley, J.M. and Marsiglia, F. (2001) “Social Diversity Within Nonprofit Boards: Members’ Views on Status
and Issues.” The Community Development Society.
DeVita, C. and Roeger, K. (March 2010) “Measuring Racial-Ethnic Diversity in the Baltimore-Washington
Region’s Nonprofit Sector.” The Urban Institute.
DeVita, C. and Roeger, K. (November 2009) “Measuring Racial-Ethnic Diversity in California’s Nonprofit
Sector.” The Urban Institute. Fredette, C., Bradshaw, P., and Inglis, S. (2006) “Creating Diverse Non-
Profit Boards: Engaging Multiple Dimensions of Power.” ASAC.
McGill, L., Bryan, B., and Miller, E. (2009) “Benchmarking Diversity: A First Look at New York City
Foundations and Nonprofits.” Foundation Center.
Miller, W. (2009) “Nonprofit Diversity and Inclusion.” Michigan Nonprofit Association. Ostrower, F.
(2007) “Nonprofit Governance in the United States.”
Percy, S., Kovari, J., and Davis, G.S. (2008) “Leadership Diversity in Milwaukee-Area Nonprofits.” Helen
Bade Institute for Nonprofit Management, University of Wisconsin-Milwaukee.
Siciliano, J. (December 1996) “The Relationship of Board Member Diversity to Organizational
Performance.” Journal of Business Ethics, V.15, no.12.
Thomas, D., and Ely, R. (September-October 1996) “Making Differences Matter: A New Paradigm for
Managing Diversity.” Harvard Business Review.
Weisinger, J. (2005) “Understanding the Meaning of Diversity.” Paper presented at the ARNOVA
conference in 2005.


![BBC VOICES RECORDINGS€¦ · BBC Voices Recordings) ) ) ) ‘’ -”) ” (‘)) ) ) *) , , , , ] , ,](https://img.dokumen.tips/doc/110x75/5f8978dc43c248099e03dd05/bbc-voices-recordings-bbc-voices-recordings-aa-a-a-a-.jpg)