Embed Size (px)
Citation preview

Vital Statistics -Country-wise – Compiled
Institute of Objective Studies162, Jogabai Main Road,
Jamia Nagar, New Delhi - 110025 1

Index - Vital Statistics - Country-wise
1. Population of Selected Countries – 2011 (p 3)2. Top Ten Most Populous Countries and World Population (p 4)3. Fifty Countries with Muslim Population more than 50% of Total Population (p 5-6)4. Human Development Index, Life Expectancy at Birth, Mean Years of Schooling and Expected
Years of Schooling - Selected 40 Countries (p 7-9)5. Hunger Index of Selected 30 Countries (p 10-12)6. HIV/AIDS Prevalence Estimates of Selected 92 Countries - January 5, 2011 (p 13-17)7. Carbon Dioxide Emissions - 2008 of Selected 50 Countries (p 18-19)8. List of South East Asia Regional (SEAR) Countries (p 20)9. World Top 10 Billionaires (US $) – 2011 (p 21)9. World Top 10 Billionaires (US $) – 2011 (p 21)10. Country-wise Nurses and Midwives (Per 10,000 Population) 2005-2010 (p 22 -24)11. Country and Regional Data on Diabetes, 2010 and 2030 (p 25-27)12. UNODC Murder Rates Most Recent Year 2012 (28-30)13. Percentage of Births to Unmarried Women in Selected Countries - 1990 and 2007 (p 31)14. Country-wise Number of and Per Capita Cases of Recorded Rape - UN Statistics (p 32-33)15. Divorce Rate by Country (p 34)16. Sex and Human Trafficking: Facts and Figures (p 35-38)17. Countries with Nuclear Weapons (p 39)18. Top World Oil Producers, Exporters, Consumers, and Importers, 2006 (p 40)19. Top Ten Oil Exporting Countries & Top Ten Oil Importing Countries in the World (p 41)20. Greatest Oil Reserves by Country – 2010 (p 42)
2

Population of Selected Countries - 2011
S. No. Country Population (in millions) Decadal change (in %)
1 China 1,341.0 5.43
2 India 1,210.2 17.64
3 U.S.A. 308.7 7.26
4 Indonesia 237.6 15.05
5 Brazil 190.7 9.39
http://www.winentrance.com/general_knowledge/economy/census-india.html
5 Brazil 190.7 9.39
6 Pakistan 184.8 24.78
7 Bangladesh 164.4 16.76
8 Nigeria 158.3 26.84
9 Russian Fed 140.4 4.29
10 Japan 128.1 1.1
World 6908.7 12.97
3

Top Ten Most Populous Countries and World Population - (in millions)
S. No. Countries 1990 2008 2010* 2025
1 China 1,141 1,333 1,338 1,458
2 India 849 1,140 1,189 1,398
3 USA 250 304 310 352
4 Indonesia 178 228 235 273
5 Brazil 150 192 193 223
6 Pakistan 108 166 185 2266 Pakistan 108 166 185 226
7 Bangladesh 116 160 164 198
8 Nigeria 94 151 158 208
9 Russia 148 142 142 137
10 Japan 124 128 127 126
World Total 5,265 6,688 - 8,004
http://en.wikipedia.org/wiki/World_population*Source: Carl Haub, 2010 World Population Data Sheet.*http://www.prb.org/Publications/PopulationBulletins/2010/worldpopulationhighlights2010*Note: In most of the world, falling fertility has led to changes in the age structure of the population.
4

Fifty Countries of the World with Muslim Population more than 50% of Total Population(Based on the Demographic Study by the Pew Research Center Report of Mapping the Global
Muslim Population, as of 8 October 2009). Contd. on next slide
S. No. CountryMuslim Population
(in millions)Muslim as Percentage of
Total Population1 Afghanistan 28.07 99.72 Albania 2.52 79.93 Algeria 34.20 98.04 Azerbaijan 8.77 99.25 Bahrain 0.64 81.26 Bangladesh 145.31 89.67 Brunei 0.27 67.28 Burkina Faso 9.29 59.09 Chad 6.26 55.810 Comoros 0.66 98.311 Djibouti 0.84 96.911 Djibouti 0.84 96.912 Egypt 78.51 94.613 Gambia 1.63 95.014 Guinea 8.50 84.415 Guinea-Bissau 0.68 42.216 Indonesia 202.87 88.217 Iran 73.78 99.418 Iraq 30.43 99.019 Jordan 6.20 98.220 Kazakhstan 8.82 56.421 Kosovo 2.00 89.622 Kuwait 2.82 95.023 Kyrgyzstan 4.73 86.324 Lebanon 2.50 59.325 Libya 6.20 96.6 5

Fifty Countries of the World with Muslim Population more than 50% of Total Population(Based on the Demographic Study by the Pew Research Center Report of Mapping the Global
Muslim Population, as of 8 October 2009).
S. No. CountryMuslim Population
(in millions)Muslim Percentage of
Total Population
26 Malaysia 16.58 60.427 Maldives 0.30 98.428 Mali 12.04 92.529 Mauritania 3.26 99.130 Morocco 31.99 99.031 Niger 15.08 98.632 Nigeria 78.06 50.433 Oman 2.49 87.734 Pakistan 174.08 96.335 Palestinian territories 4.17 98.035 Palestinian territories 4.17 98.036 Qatar 1.09 77.537 Saudi Arabia 24.95 97.038 Senegal 12.03 96.039 Sierra Leone 4.06 71.340 Somalia 9.00 98.541 Sudan 30.12 71.342 Syria 20.20 92.243 Tajikistan 5.85 84.144 Tunisia 10.22 99.545 Turkey 73.62 98.046 Turkmenistan 4.76 93.147 United Arab Emirates 3.50 76.248 Uzbekistan 26.47 96.349 Western Sahara 0.51 99.450 Yemen 23.36 99.1 6

Human Development Index (HDI), Life Expectancy at Birth, Mean Years ofSchooling and Expected Years of Schooling - Selected 40 Countries
S. No.Rank (New 2011
Estimates for 2011)Country
HDI (New 2011Estimates for 2011)
Life Expectancyat Birth(Years)
Mean Years ofSchooling
(Years)
Expected Yearsof Schooling
(Years)
Gross National Income(GNI) per capita
(constant 2005 PPP $)
1 2 Australia 0.929 81.9 12.0 18.0 34431.0
2 42 Bahrain 0.806 75.1 9.4 13.4 28169.0
3 146 Bangladesh 0.500 68.9 4.8 8.1 1529.0
4 84 Brazil 0.718 73.5 7.2 13.8 10162.0
5 101 China 0.687 73.5 7.5 11.6 7476.0
6 187 Congo Dem. Rep. (Lowest) 0.286 48.4 3.5 8.2 280.0
7 113 Egypt 0.644 73.2 6.4 11.0 5269.0
8 20 France 0.884 81.5 10.6 b 16.1 30462.0
9 9 Germany 0.905 80.4 12.2 b 15.9 34854.0
Human Development Report 2011 Contd. on next slide
9 9 Germany 0.905 80.4 12.2 b 15.9 34854.0
10 134 India 0.547 65.4 4.4 10.3 3468.0
11 124 Indonesia 0.617 69.4 5.8 13.2 3716.0
12 88 Iran 0.707 73.0 7.3 12.7 10164.0
13 132 Iraq 0.573 69.0 5.6 9.8 3177.0
14 17 Israel 0.888 81.6 11.9 15.5 25849.0
15 24 Italy 0.874 81.9 10.1 b 16.3 26484.0
16 12 Japan 0.901 83.4 11.6 b 15.1 32295.0
17 95 Jordan 0.698 73.4 8.6 13.1 5300.0
18 68 Kazakhstan 0.745 67.0 10.4 15.1 10585.0
19 63 Kuwait 0.760 74.6 6.1 12.3 47926.0
20 64 Libya 0.760 74.8 7.3 16.6 12,637 q
7

S. No.Rank (New 2011
Estimates for 2011)Country
HDI (New 2011Estimates for 2011)
Life Expectancyat Birth(Years)
Mean Years ofSchooling
(Years)
Expected Yearsof Schooling
(Years)
Gross National Income(GNI) per capita
(constant 2005 PPP $)
21 61 Malaysia 0.761 74.2 9.5 12.6 13685.0
22 109 Maldives 0.661 76.8 5.8 b 12.4 5276.0
23 157 Nepal 0.458 68.8 3.2 8.8 1160.0
24 89 Oman 0.705 73.0 5.5 m 11.8 22841.0
25 145 Pakistan 0.504 65.4 4.9 6.9 2550.0
26 112 Philippines 0.644 68.7 8.9 b 11.9 3478.0
27 37 Qatar 0.831 78.4 7.3 12.0 107721.0
28 66 Russia 0.755 68.8 9.8 14.1 14561.0
29 56 Saudi Arabia 0.770 73.9 7.8 13.7 23274.0
Human Development Index (HDI), Life Expectancy at Birth, Mean Years ofSchooling and Expected Years of Schooling - Selected 40 Countries
29 56 Saudi Arabia 0.770 73.9 7.8 13.7 23274.0
30 26 Singapore 0.866 81.1 8.8 b 14.4 e 52569.0
31 123 South Africa 0.619 52.8 8.5 b 13.1 9469.0
32 15 South Korea 0.897 80.6 11.6 b 16.9 28230.0
33 97 Sri Lanka 0.691 74.9 8.2 12.7 4943.0
34 119 Syrian Arab Republic 0.632 75.9 5.7 b 11.3 4243.0
35 92 Turkey 0.699 74.0 6.5 11.8 12246.0
36 30 United Arab Emirates 0.846 76.5 9.3 13.3 59993.0
37 28 United Kingdom 0.863 80.2 9.3 16.1 33296.0
38 4 United States 0.910 78.5 12.4 16.0 43017.0
39 115 Uzbekistan 0.641 68.3 10.0 r 11.4 2967.0
40 1 Norway (Highest) 0.943 81.1 12.6 17.3 47557.0
8
Human Development Report 2011 Contd. on next slide

Definitions:
Human Development Index (HDI): A composite index measuring average achievement in three basic
dimensions of human development—a long and healthy life, knowledge and a decent standard of living.
See Technical note 1 for details on how the HDI is calculated.
Life expectancy at birth: Number of years a newborn infant could expect to live if prevailing patterns of
age-specific mortality rates at the time of birth stay the same throughout the infant’s life.
Mean years of schooling: Average number of years of education received by people ages 25 and older,
converted from education attainment levels using official durations of each level.
Expected Years of Schooling: Number of years of schooling that a child of school entrance age can
expect to receive if prevailing patterns of age-specific enrolment rates persist throughout the child’s life.
Gross National Income (GNI) per capita: Aggregate income of an economy generated by its production
and its ownership of factors of production, less the incomes paid for the use of factors of production
owned by the rest of the world, converted to international dollars using purchasing power parity (PPP)
Human Development Index (HDI), Life Expectancy at Birth, Mean Years ofSchooling and Expected Years of Schooling - Selected 40 Countries
owned by the rest of the world, converted to international dollars using purchasing power parity (PPP)
rates, divided by midyear population.
GNI per capita rank minus HDI rank: Difference in rankings by GNI per capita and by the HDI. A negative
value means that the country is better ranked by GNI than by the HDI.
Non-income HDI: Value of the HDI computed from the life expectancy and education indicators only.
Main Data Sources:
Column 1: HDRO calculations based on data from UNDESA (2011), Barro and Lee (2010b), UNESCO
Institute for Statistics (2011), World Bank (2011a), UNSD (2011) and IMF (2011).
Column 2: UNDESA (2011).
Column 3: HDRO updates of Barro and Lee (2010b) estimates based on UNESCO Institute for Statistics
data on education attainment (2011) and Barro and Lee (2010a) methodology.
Column 4: UNESCO Institute for Statistics (2011).
Column 5: HDRO calculations based on data from World Bank (2011a), IMF (2011) and UNSD (2011).
Column 6: Calculated based on data in columns 1 and 5.
Column 7: Calculated based on data in columns 2, 3 and 4.
Human Development Report 2011
9

Hunger Index - Countries with Extremely Alarming (GHI ≥ 30), Alarming(GHI between 20.0 and 29.9) or Serious (GHI between 10.0 and 19.9)
S. No. Rank CountryGlobal Hunger Index[7]
1990 1996 2001 20111 1 Dominican Republic 14.2 11.7 10.9 10.2
2 3 Vietnam 25.7 21.4 15.5 11.2
3 4 Mongolia 16.3 17.7 14.8 11.4
4 5 Philippines 19.9 17.5 14.1 11.5
5 8 Indonesia 18.5 15.5 14.3 12.2
6 13 Namibia 20.3 18.7 16.3 13.8
7 15 Sri Lanka 20.2 17.8 14.9 14.0
http://en.wikipedia.org/wiki/Global_Hunger_Index Contd. on next Slide
8 18 Nigeria 24.1 21.2 18.2 15.5
9 19 Myanmar 29.2 25.4 22.5 16.3
10 20 Uganda 19.0 20.4 17.7 16.7
11 21 Tadschikistan — 24.4 24.5 17.0
12 24 Cameroon 21.9 22.4 19.4 17.7
13 25 Zimbabwe 18.7 22.3 21.3 17.7
14 28 Kenya 20.6 20.3 19.9 18.6
15 29 North Korea 16.1 20.3 20.1 19.0
16 33 Nepal 27.1 24.6 23.0 19.9
10

S. No. Rank CountryGlobal Hunger Index[7]
1990 1996 2001 2011
17 36 Tanzania 23.1 27.4 26.0 20.5
18 37 Pakistan 25.7 22.0 21.9 20.7
19 40 Sudan 29.2 24.7 25.9 21.5
20 43 Mozambique 35.7 31.4 28.4 22.7
21 44 Niger 36.2 36.2 30.8 23.0
22 67 India 30.4 22.9 24.1 23.7
Hunger Index - Countries with Extremely Alarming (GHI ≥ 30), Alarming(GHI between 20.0 and 29.9) or Serious (GHI between 10.0 and 19.9)
http://en.wikipedia.org/wiki/Global_Hunger_Index
23 47 Angola 43.0 40.7 33.4 24.2
24 48 Bangladesh 38.1 36.3 27.6 24.5
25 50 Yemen 30.4 27.8 27.9 25.4
26 52 Central African Republic 27.6 28.6 27.7 27.0
27 55 Ethiopia 43.2 39.1 34.7 28.7
28 79 Eritrea — 37.7 37.6 33.9
29 80 Burundi 31.4 36.3 38.5 37.9
30 81 DR Congo 24.0 35.2 41.2 39.0
11

12
http://en.wikipedia.org/wiki/Global_Hunger_Index

S. NO. CountryAdult (15-49)
prevalence (%)Date of
DataPeople withHIV/AIDS
Date ofData
AnnualDeaths
Date ofData
1 Afghanistan 0.01 2001 est. NA NA NA
2 Australia 0.1 2007 est. 18,000 2007 est. 100 2007 est.
3 Azerbaijan 0.2 2007 est. 7,800 2007 est. 100 2007 est.
4 Bahrain 0.3 2001 est. 600 2007 est. 200 2003 est.
5 Bangladesh 0.1 2001 est. 12,000 2007 est. 500 2007 est.
6 Belgium 0.2 2007 est. 15,000 2007 est. 100 2007 est.
7 Benin 1.2 2007 est. 64,000 2007 est. 3,300 2007 est.
8 Bermuda 0.3 2005 163 2005 392 2005
9 Bosnia and Herzegovina 0.1 2007 est. 900 2007 est. 100 2001 est.
As of January 5, 2011, all of the data in the following table comes from three tables in the CIA WorldFactbook. Updates to data in this table should be reflected with a reference to a different source.
HIV/AIDS Prevalence Estimates
9 Bosnia and Herzegovina 0.1 2007 est. 900 2007 est. 100 2001 est.
10 Botswana 23.9 2007 est. 300,000 2007 est. 11,000 2007 est.
11 Brazil 0.4 2008 est. 600,000 2007 est. 15,000 2007 est.
12 Brunei 0.1 2003 est. 200 2003 est. 200 2003 est.
13 Bulgaria 0.1 2001 est. 346 2001 est. 100 2001 est.
14 Burkina Faso 1.6 2007 est. 130,000 2007 est. 9,200 2007 est.
15 Burma 0.7 2007 est. 240,000 2007 est. 25,000 2007 est.
16 Burundi 2.0 2007 est. 110,000 2007 est. 11,000 2007 est.
17 Cambodia 0.8 2007 est. 75,000 2007 est. 6,900 2007 est.
18 Cameroon 5.1 2007 est. 540,000 2007 est. 39,000 2007 est.
19 Canada 0.3 2009 est. 73,000 2009 est. 500 2007 est.
20 Central African Republic 6.3 2007 est. 160,000 2007 est. 11,000 2007 est.
An asterisk * indicates that the CIA World Factbook lists this piece of data as not having an available source.
http://en.wikipedia.org/wiki/List_of_countries_by_HIV/AIDS_adult_prevalence_rate
This article incorporates public domain material from websites or documents of the CIA World Factbook. Contd. On next slide13

As of January 5, 2011, all of the data in the following table comes from three tables in the CIA WorldFactbook. Updates to data in this table should be reflected with a reference to a different source.
HIV/AIDS Prevalence Estimates
S. NO. CountryAdult (15-49)
prevalence (%)Date of
DataPeople withHIV/AIDS
Date ofData
AnnualDeaths
Date ofData
21 China 0.1 2007 est. 700,000 2007 est. 39,000 2007 est.
22 Colombia 0.6 2007 est. 170,000 2007 est. 9,800 2007 est.
23 Democratic Republic of the Congo 4.2 2003 est. 1,100,000 2003 est. 100,000 2003 est.
24 Republic of the Congo 3.5 2007 est. 79,000 2007 est. 6,400 2007 est.
25 Cote d'Ivoire 3.9 2007 est. 480,000 2007 est. 38,000 2007 est.
26 Dominican Republic 1.1 2007 est. 62,000 2007 est. 4,100 2007 est.
27 Egypt 0.1 2001 est. 9,200 2007 est. 500 2007 est.
28 Ethiopia 2.1 2007 est. 980,000 2007 est. 67,000 2007 est.
An asterisk * indicates that the CIA World Factbook lists this piece of data as not having an available source.
http://en.wikipedia.org/wiki/List_of_countries_by_HIV/AIDS_adult_prevalence_rate
This article incorporates public domain material from websites or documents of the CIA World Factbook. Contd. On next slide
28 Ethiopia 2.1 2007 est. 980,000 2007 est. 67,000 2007 est.
29 France 0.4 2007 est. 140,000 2007 est. 1,600 2007 est.
30 Germany 0.1 2007 est. 53,000 2007 est. 500 2007 est.
31 Ghana 1.9 2007 est. 260,000 2007 est. 21,000 2007 est.
32 Guatemala 0.8 2007 est. 59,000 2007 est. 3,900 2007 est.
33 Guinea 1.6 2007 est. 87,000 2007 est. 4,500 2007 est.
34 Haiti 2.2 2007 est. 120,000 2007 est. 7,200 2007 est.
35 India 0.3 2007 est. 2,400,000 2007 est. 310,000 2001 est.
36 Indonesia 0.2 2007 est. 270,000 2007 est. 8,700 2007 est.
37 Iran 0.2 2007 est. 86,000 2007 est. 4,300 2007 est.
38 Iraq 0.1 2001 est. 500 2003 est. NA
39 Israel 3.33 2007 est. 5,100 2007 est. 200 2007 est.
40 Italy 0.4 2007 est. 150,000 2007 est. 1,900 2007 est.
14

As of January 5, 2011, all of the data in the following table comes from three tables in the CIA WorldFactbook. Updates to data in this table should be reflected with a reference to a different source.
HIV/AIDS Prevalence Estimates
S. NO. CountryAdult (15-49)
prevalence (%)Date of
DataPeople withHIV/AIDS
Date ofData
AnnualDeaths
Date ofData
41 Jamaica 1.6 2007 est. 27,000 2007 est. 1,500 2007 est.
42 Japan 0.1 2003 est. 9,600 2007 est. 100 2007 est.
43 Jordan 0.1 2001 est. 600 2007 est. 500 2003 est.
44 Kazakhstan 0.1 2007 est. 12,000 2007 est. 500 2007 est.
45 Kenya 6.7 2003 est. 1,200,000 2003 est. 150,000 2003 est.
46 Kuwait 0.1 2001 est. NA NA NA
47 Kyrgyzstan 0.1 2007 est. 4,200 2007 est. 200 2007 est.
48 Lesotho 23.2 2007 est. 270,000 2007 est. 18,000 2007 est.
An asterisk * indicates that the CIA World Factbook lists this piece of data as not having an available source.
http://en.wikipedia.org/wiki/List_of_countries_by_HIV/AIDS_adult_prevalence_rate
This article incorporates public domain material from websites or documents of the CIA World Factbook. Contd. On next slide
49 Liberia 1.7 2007 est. 35,000 2007 est. 2,300 2007 est.
50 Libya 0.3 2001 est. 10,000 2001 est. NA
51 Malawi 11.9 2007 est. 930,000 2007 est. 68,000 2007 est.
52 Malaysia 0.5 2007 est. 80,000 2007 est. 3,900 2007 est.
53 Maldives 0.1 2001 est. 100 2001 est. NA
54 Mali 1.5 2007 est. 100,000 2007 est. 5,800 2007 est.
55 Mexico 0.3 2007 est. 200,000 2007 est. 11,000 2007 est.
56 Morocco 0.1 2007 est. 21,000 2007 est. 1,000 2007 est.
57 Mozambique 12.5 2007 est. 1,500,000 2007 est. 81,000 2007 est.
58 Namibia 15.3 2007 est. 200,000 2007 est. 5,100 2007 est.
59 Nepal 0.5 2007 est. 70,000 2007 est. 5,000 2007 est.
60 New Zealand 0.1 2007 est. 1,400 2007 est. 100 2009 est.
15

As of January 5, 2011, all of the data in the following table comes from three tables in the CIA WorldFactbook. Updates to data in this table should be reflected with a reference to a different source.
HIV/AIDS Prevalence Estimates
S. NO. CountryAdult (15-49)
prevalence (%)Date of
DataPeople withHIV/AIDS
Date ofData
AnnualDeaths
Date ofData
61 Niger 0.8 2007 est. 60,000 2007 est. 4,000 2007 est.
62 Nigeria 3.1 2007 est. 2,600,000 2007 est. 170,000 2007 est.
63 Oman 0.1 2001 est. 1,300 2001 est. 200 2003 est.
64 Pakistan 0.1 2007 est. 96,000 2007 est. 5,100 2007 est.
65 Qatar 0.1 2001 est. NA NA NA
66 Russia 0.3 2007 est. 154,000 2007 est. 13,000 2007 est.
67 Rwanda 2.8 2007 est. 150,000 2007 est. 7,800 2007 est.
68 Saudi Arabia 0.04 2007 est. 10,000 2007 est. 300 2007 est.
69 Somalia 0.09 2007 est. 24,000 2007 est. 1,600 2007 est.
70 South Africa 18.1 2007 est. 5,700,000 2007 est. 350,000 2007 est.
71 Spain 0.5 2007 est. 140,000 2007 est. 2,300 2007 est.
72 Sri Lanka 0.1 2001 est. 3,800 2007 est. 200 2003 est.
73 Sudan 1.4 2007 est. 320,000 2007 est. 25,000 2007 est.
74 Switzerland 0.6 2007 est. 25,000 2007 est. 500 2007 est.
75 Syria 0.001 2012 est. 432 2012 est. 10 2012 est.
76 Tajikistan 0.3 2007 est. 10,000 2007 est. 500 2007 est.
77 Tanzania 6.2 2007 est. 1,400,000 2007 est. 96,000 2007 est.
78 Thailand 1.4 2007 est. 610,000 2007 est. 30,000 2007 est.
79 Togo 3.3 2007 est. 130,000 2007 est. 9,100 2007 est.
80 Turkey 0.1 2001 est. NA NA NA
An asterisk * indicates that the CIA World Factbook lists this piece of data as not having an available source.
http://en.wikipedia.org/wiki/List_of_countries_by_HIV/AIDS_adult_prevalence_rate
This article incorporates public domain material from websites or documents of the CIA World Factbook. Contd. On next slide16

As of January 5, 2011, all of the data in the following table comes from three tables in the CIA WorldFactbook. Updates to data in this table should be reflected with a reference to a different source.
HIV/AIDS Prevalence Estimates
S. NO. CountryAdult (15-49)
prevalence (%)Date of
DataPeople withHIV/AIDS
Date ofData
AnnualDeaths
Date ofData
81 Turkmenistan 0.1 2007 est. 200 2007 est. 100 2004 est.
82 Uganda 5.4 2007 est. 940,000 2007 est. 77,000 2007 est.
83 Ukraine 1.6 2007 est. 440,000 2007 est. 19,000 2007 est.
84 United Arab Emirates 0.2 2001 est. NA NA NA
85 United Kingdom 0.2 2007 est. 77,000 2007 est. 500 2007 est.
An asterisk * indicates that the CIA World Factbook lists this piece of data as not having an available source.
http://en.wikipedia.org/wiki/List_of_countries_by_HIV/AIDS_adult_prevalence_rate
This article incorporates public domain material from websites or documents of the CIA World Factbook.
86 United States 0.6 2007 est. 1,200,000 2007 est. 22,000 2007 est.
87 Uzbekistan 0.1 2007 est. 16,000 2007 est. 500 2007 est.
88 Venezuela 0.7 2001 est. 110,000 1999 est. 4,100 2003 est.
89 Vietnam 0.5 2007 est. 290,000 2007 est. 24,000 2007 est.
90 Yemen 0.1 2001 est. 12,000 2001 est. NA
91 Zambia 15.2 2007 est. NA 2007 est. 56,000 2007 est.
92 Zimbabwe 15.3 2007 est. 1,300,000 2007 est. 140,000 2007 est.
17

List of Countries by 2008 Carbon Dioxide Emissions
S. No. CountryAnnual CO2 Emissions
(in thousands of metric tonnes)% of worldEmissions
Total
Annual CO2 Emissions(in thousands of metric tonnes)
% of world Emissions
1 China (exl. Taiwan, Macau, Hong Kong) 7,031,916 23.53%
2 United States 5,461,014 18.27%
3 European Union (27) 4,177,817 13.98%
4 India 1,742,698 5.83%
5 Russia 1,708,653 5.72%
6 Japan 1,208,163 4.04% 21,330,261 71.37Total = (S.No.
2 to 7)
7 Germany 786,660 2.63%
8 Canada 544,091 1.82%
9 Iran 538,404 1.80% 23,199,416 77.62Total = (S.No.
2 to 10)
10 United Kingdom 522,856 1.75% 23,722,272 79.37Total = (S.No.
2 to 11)
Source: UN Estimates (6); http://en.wikipedia.org/wiki/List_of_countries_by_carbon_dioxide_emissions; Contd. on next slide
11 South Korea 509,170 1.70%
12 Mexico 475,834 1.59%
13 Italy (including San Marino) 445,119 1.49%
14 South Africa 435,878 1.46%
15 Saudi Arabia 433,557 1.45%
16 Indonesia 406,029 1.36%
17 Australia 399,219 1.34%
18 Brazil 393,220 1.32%
19 France (including Monaco) 376,986 1.26%
20 Thailand 285,733 0.96%
21 Turkey 283,980 0.95%
22 Egypt 210,321 0.70%
23 Malaysia 208,267 0.70%
24 Pakistan 163,178 0.55%
25 United Arab Emirates 155,066 0.52%
18

List of Countries by 2008 Carbon Dioxide Emissions
S. No. CountryAnnual CO2 Emissions
(in thousands of metric tonnes)% of worldEmissions
Total
Annual CO2 Emissions(in thousands of metric tonnes)
% of worldEmissions
26 Iraq 102,936 0.34%
27 Nigeria 95,756 0.32%
28 Philippines 83,157 0.28%
29 North Korea 78,371 0.26%
30 Kuwait 76,743 0.26%
31 Syria 71,598 0.24%
32 Qatar 68,478 0.23%
33 Libya 58,331 0.20%
34 Morocco 47,906 0.16%
35 Bangladesh 46,527 0.16%
36 Oman 45,749 0.15%
37 Switzerland 40,392 0.14%
Source: UN Estimates (6); http://en.wikipedia.org/wiki/List_of_countries_by_carbon_dioxide_emissions;
37 Switzerland 40,392 0.14%
38 Hong Kong 38,573 0.13%
39 Israel 37,664 0.13%
40 New Zealand 33,095 0.11%
41 Singapore 32,295 0.11%
42 Yemen 23,384 0.08%
43 Bahrain 22,479 0.08%
44 Jordan 21,382 0.07%
45 Sudan 14,052 0.05%
46 Sri Lanka 11,764 0.04%
47 Kenya 10,392 0.03%
48 Tanzania 6,465 0.02%
49 Mauritius 3,953 0.01%
50 Nepal 3,542 0.01%
World 29,888,121 100%
19

South East Asia Regional (SEAR) Countries
The WHO South East Asia Region has eleven Member States: Bangladesh,Bhutan, Democratic People's Rep. of Korea, India, Indonesia, Maldives,
Myanmar, Nepal, Sri Lanka, Thailand, and Timor-Leste.
S. No. Country Date of joining WHO
1. Bangladesh 19 May 1972
2. Bhutan 08 March 1982
3. Democratic People’s Rep. of Korea 19 May 1973
4. India 12 January 19484. India 12 January 1948
5. Indonesia 23 May 1950
6. Maldives 05 November 1965
7. Myanmar 01 July 1948
8. Nepal 02 September 1953
9. Sri Lanka 07 July 1948
10. Thailand 26 September 1947
11. Timor-Leste 27 September 2002
http://www.searo.who.int/EN/Section864/Section1007/Section1012.htm
20

World Top 10 US $ Billionaires (2011)
Rank Country/RegionNumber of
Billionaires[1]Share of World
Total (%)Billionaires
per 10M
— World Total 1210 100 1.7
1 USA 412 34 13.2
2 China 95 10.6 0.9
3 Russia 101 8.3 7.1
4 India 55 4.5 0.5
5 Germany 52 4.3 6.4
1. ^ a b c d e f g h Interactive Map: The World's Billionaires Forbes Magazine2. http://en.wikipedia.org/wiki/List_of_countries_by_the_number_of_US_dollar_billionaires
5 Germany 52 4.3 6.4
6 Brazil 40 2.5 1.6
7 Turkey 38 3.1 5.2
8 Hong Kong 36 3 51
9 UK 33 2.7 5.3
10 (tied) Japan 26 2.1 2
10 (tied) Indonesia 26 2.1 1.08
Total 914 77.2 94.28
21

Country-wise Nurses and Midwives (Per 10,000 Population) 2005-2010
S. No. World Rank Country Rate per 10,000
1 1 Norway 319
2 2 Finland 240
3 3 Switzerland 165
4 4 Denmark 161
5 9 Sweden 119
6 10 Uzbekistan 111
7 11 Germany 111
8 12 New Zealand 109
9 13 Canada 104
10 14 United Kingdom 101
11 15 USA 98
22
11 15 USA 98
12 16 Australia 96
13 19 Ukraine 86
14 20 Russian Federation 85
15 22 Azerbaijan 83
16 23 Kazakhstan 83
17 25 Qatar 74
18 29 Libyan Arab Jamahiriya 68
19 32 Italy 65
20 34 Brazil 64
21 35 Hungary 64
22 36 Singapore 59
Contd. on next slide

Country-wise Nurses and Midwives (Per 10,000 Population) 2005-2010
S. No. World Rank Country Rate per 10,000
23 46 Tajikistan 53
24 47 Korea (Republic of) 53
25 48 Israel 52
26 49 Spain 51
27 50 Bosnia and Herzegovina 50
28 51 Brunei Darussalam 49
29 57 Kuwait 46
30 59 Maldives 45
31 60 Turkmenistan 44
32 62 Japan 41
23
33 63 Oman 41
34 64 UAE 41
35 65 Jordan 40
36 68 Bahrain 37
37 71 Egypt 35
38 78 Malaysia 27
39 81 Saudi Arabia 21
40 83 Indonesia 20
41 86 Algeria 20
42 87 Sri Lanka 19
43 88 Syrian Arab Republic 19
44 92 Nigeria 16
Contd. on next slide

Country-wise Nurses and Midwives (Per 10,000 Population) 2005-2010
S. No. World Rank Country Rate per 10,000
45 93 Iran (Islamic Republic of) 16
46 94 China 14
47 94 Iraq 14
48 100 India 10
49 102 Morocco 9
50 103 Sudan 8
51 105 Myanmar 8
52 111 Turkey 6
53 115 Pakistan 6
24
54 117 Belgium 5
55 119 Afghanistan 5
56 128 France 3
57 131 Bangladesh 3
58 132 Tanzania (United Rep. of) 2
59 137 Niger 1
Global 28
Definitions: Nurses: Includes professional nurses, auxiliary nurses, enrolled nurses and other nurses, such as dentalnurses and primary care nurses. Midwives: includes professional midwives, auxiliary midwives and enrolled midwives.Traditional birth attendants are not included in this category and are counted as community health workers by WHO.
Sources: WHO, World Health Statistics 2012, available at:http://www.who.int/gho/publications/world_health_statistics/2012/en/index.html. See also, WHO, Global HealthObservatory, available at: http://www.who.int/gho/database/en/.

Country and Regional Data on Diabetes
WHO African Region
1 Algeria 426,000 1,203,000 0.25 0.33
2 Kenya 183,000 498,000 0.11 0.14
3 Nigeria 1,707,000 4,835,000 1.00 1.32
4 South Africa 814,000 1,286,000 0.48 0.35
5 Uganda 98,000 328,000 0.06 0.09
6 United Republic of Tanzania 201,000 605,000 0.12 0.17
Total 7,020,000 18,234,000 4.11 4.98
WHO Eastern Mediterranean Region
7 Afghanistan 468,000 1,403,000 0.27 0.38
8 Bahrain 37,000 99,000 0.02 0.03
9 Egypt 2,623,000 6,726,000 1.53 1.84
10 Islamic Republic of Iran 2,103,000 6,421,000 1.23 1.75
S. No. CountryNumbers Percentage of World
2000 2030 2000 2030
25
10 Islamic Republic of Iran 2,103,000 6,421,000 1.23 1.75
11 Iraq 668,000 2,009,000 0.39 0.55
12 Jordan 195,000 680,000 0.11 0.19
13 Kuwait 104,000 319,000 0.06 0.09
14 Lebanon 146,000 378,000 0.09 0.10
15 Libya 88,000 245,000 0.05 0.07
16 Morocco 427,000 1,138,000 0.25 0.31
17 Oman 113,000 343,000 0.07 0.09
18 Pakistan 5,217,000 13,853,000 3.05 3.78
19 Qatar 38,000 88,000 0.02 0.02
20 Saudi Arabia 890,000 2,523,000 0.52 0.69
21 Sudan 447,000 1,277,000 0.26 0.35
22 Syria 627,000 2,313,000 0.37 0.63
23 United Arab Emirates 350,000 684,000 0.20 0.19
24 Yemen 327,000 1,286,000 0.19 0.35
Total 15,188,000 42,600,000 8.88 11.64
http://www.who.int/diabetes/facts/world_figures/en/index1.html Contd. on next slide

Country and Regional Data on Diabetes
S. No. CountryNumbers Percentage of World
2000 2030 2000 2030
WHO Region of the Americas
25 Argentina 1,426,000 2,457,000 0.83 0.67
26 Brazil 4,553,000 11,305,000 2.66 3.09
27 Canada 2,006,000 3,543,000 1.17 0.97
28 Mexico 2,179,000 6,130,000 1.27 1.67
29 USA 17,702,000 30,312,000 10.35 8.28
Total 33,016,000 66,812,000 19.31 18.25
WHO European Region
30 Austria 239,000 366,000 0.14 0.10
31 Azerbaijan 337,000 733,000 0.20 0.20
26
31 Azerbaijan 337,000 733,000 0.20 0.20
32 France 1,710,000 2,645,000 1.00 0.72
33 Germany 2,627,000 3,771,000 1.54 1.03
34 Israel 257,000 500,000 0.15 0.14
35 Italy 4,252,000 5,374,000 2.49 1.47
36 Kazakstan 452,000 668,000 0.26 0.18
37 Russian Federation 4,576,000 5,320,000 2.68 1.45
38 Spain 2,717,000 3,752,000 1.59 1.03
39 Sweden 292,000 404,000 0.17 0.11
40 Switzerland 219,000 336,000 0.13 0.09
41 Turkey 2,920,000 6,422,000 1.71 1.75
42 U K of Great Britain and Northern Ireland 1,765,000 2,668,000 1.03 0.73
Total 33,332,000 47,973,000 19.49 13.11
http://www.who.int/diabetes/facts/world_figures/en/index1.html Contd. on next slide

Country and Regional Data on Diabetes
WHO South-East Asia Region
43 Bangladesh 3,196,000 11,140,000 1.87 3.04
44 Bhutan 35,000 109,000 0.02 0.03
45 Dem. People's Rep. of Korea 367,000 635,000 0.21 0.17
46 India 31,705,000 79,441,000 18.54 21.71
47 Indonesia 8,426,000 21,257,000 4.93 5.81
48 Maldives 6,000 25,000 0.00 0.01
49 Myanmar 543,000 1,330,000 0.32 0.36
50 Nepal 436,000 1,328,000 0.25 0.36
51 Sri Lanka 653,000 1,537,000 0.38 0.42
52 Thailand 1,536,000 2,739,000 0.90 0.75
S. No. CountryNumbers Percentage of World
2000 2030 2000 2030
27
http://www.who.int/diabetes/facts/world_figures/en/index1.html
52 Thailand 1,536,000 2,739,000 0.90 0.75
Total 46,903,000 119,541,000 27.43 32.66
WHO Western Pacific Region
53 Australia 941,000 1,673,000 0.55 0.46
54 Brunei Darussalam 18,000 49,000 0.01 0.01
55 China 20,757,000 42,321,000 12.14 11.56
56 Japan 6,765,000 8,914,000 3.96 2.44
57 Malaysia 942,000 2,479,000 0.55 0.68
58 New Zealand 179,000 307,000 0.10 0.08
59 Philippines 2,770,000 7,798,000 1.62 2.13
60 Republic of Korea 1,859,000 3,378,000 1.09 0.92
61 Singapore 328,000 695,000 0.19 0.19
Total 35,771,000 71,050,100 20.92 19.41
World 171,000,000 366,000,000 100.00 100.00

UNODC Murder Rates Most Recent Year 2012
Rank Country Count Rate1 Brazil 40,974 21.0
2 India 40,752 3.4
3 Mexico 25,757 22.7
4 Ethiopia 20,239 22.5
5 Indonesia 18,963 8.1
6 South Africa 15,940 31.8
7 Russia 14,574 10.2
8 Pakistan 13,860 7.8
9 China 13,410 1.0
10 United States 12,996 4.2
11 Uganda 11,373 36.3
12 Tanzania 10,357 24.5
28
Contd. on next slide
12 Tanzania 10,357 24.5
13 Sudan 10,028 24.2
14 Kenya 7,733 20.1
15 Philippines 4,947 5.4
16 Myanmar 4,800 10.2
17 Zambia 4,710 38.0
18 Bangladesh 3,988 2.7
19 North Korea 3,658 15.2
20 Thailand 3,307 4.8
21 Ukraine 2,356 5.2
22 Turkey 2,320 3.3
23 Iran 2,215 3.0
24 Zimbabwe 1,775 14.3

UNODC Murder Rates Most Recent Year 2012
Rank Country Count Rate25 Burundi 1,726 21.7
26 Kazakhstan 1,418 8.8
27 South Korea 1,251 2.6
28 Kyrgyzstan 1,072 20.1
29 Egypt 992 1.2
30 Yemen 990 4.2
31 Uzbekistan 831 3.1
32 Nepal 818 2.8
33 Sri Lanka 745 3.6
34 Taiwan 743 3.2
35 United Kingdom 722 1.2
36 Afghanistan 712 2.4
29
Contd. on next slide
36 Afghanistan 712 2.4
37 Germany 690 0.8
38 France 682 1.1
39 Iraq 608 2.0
40 Malaysia 604 2.3
41 Canada 554 1.6
42 Italy 529 0.9
43 Algeria 516 1.5
44 Japan 506 0.4
45 Syria 463 2.3
46 Morocco 447 1.4
47 Spain 390 0.8
48 Saudi Arabia 265 1.0

UNODC Murder Rates Most Recent Year 2012
Rank Country Count Rate
49 Australia 229 1.0
50 Azerbaijan 206 2.2
51 Turkmenistan 203 4.2
52 Libya 176 2.9
53 Israel 159 2.1
54 Palestine 145 4.1
55 Tajikistan 143 2.1
56 Jordan 100 1.8
57 Lebanon 95 2.2
58 Sweden 91 1.0
59 Kuwait 59 2.2
30
UNODC: United Nations Office on Drugs and Crime
59 Kuwait 59 2.2
60 Armenia 44 1.4
61 New Zealand 39 0.9
62 United Arab Emirates 39 0.8
63 Cyprus 19 1.7
64 Oman 18 0.7
65 Hong Kong 17 0.2
66 Singapore 16 0.3
67 Qatar 13 0.9
68 Bhutan 7 1.0
69 Bahrain 6 0.6
70 Maldives 5 1.6
71 Brunei 2 0.5
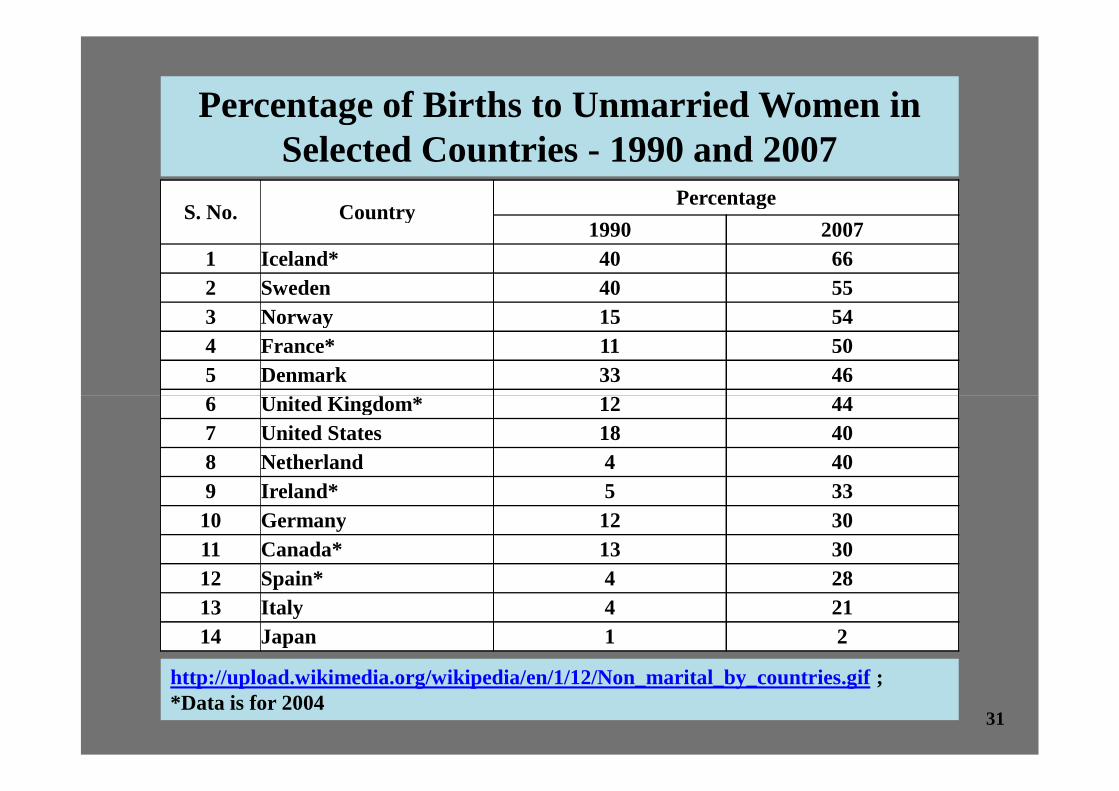
S. No. CountryPercentage
1990 2007
1 Iceland* 40 66
2 Sweden 40 55
3 Norway 15 54
4 France* 11 50
5 Denmark 33 46
6 United Kingdom* 12 44
Percentage of Births to Unmarried Women inSelected Countries - 1990 and 2007
6 United Kingdom* 12 44
7 United States 18 40
8 Netherland 4 40
9 Ireland* 5 33
10 Germany 12 30
11 Canada* 13 30
12 Spain* 4 28
13 Italy 4 21
14 Japan 1 2
http://upload.wikimedia.org/wikipedia/en/1/12/Non_marital_by_countries.gif ;*Data is for 2004
31

Country 2008 Count 2009 Count2008 Rate /
100,0002009 Rate /
100,000United States of America 90,427 89,000 29.3 28.6
U K (England and Wales) 12,637 13,093 23.4 24.1
France 10,132 10,277 16.4 16.6
Germany 7,511 7,292 9.1 8.9
Russian Federation 7,038 6,208 5.0 4.4
Sweden 4,269 4,901 46.6 53.2
Zimbabwe 4,762 3,186 38.3 25.6
Belgium 3,111 2,786 29.5 26.3
This list indicates the number of and per capita cases of recorded rape. It does not include cases of rape which gounreported, or which are not recorded. Nor does it specify whether recorded means reported, brought to trial, or convicted.
Nor does it take the different definition of rape around the world into account.
Country-wise Number of and Per Capita Cases of Recorded Rape - UN Statistics
http://en.wikipedia.org/wiki/Rape_statistics Contd. on next slide
Belgium 3,111 2,786 29.5 26.3
Philippines 2,409 2,585 2.7 2.9
Spain 2,530 2,437 5.7 5.5
Chile 1,980 2,233 11.9 13.3
Lesotho 1,797 1,878 88.4 91.6
Japan 1,766 1,582 1.4 1.2
New Zealand 1,314 1,308 31.3 30.9
Kazakhstan 1,518 1,298 9.9 8.4
Israel 1,270 1,243 18.3 17.6
Sudan - 1,189 - 2.9
Morocco 1,215 1,130 3.9 3.6
Turkey 1,148 1,071 1.6 1.4
Romania 1,047 1,016 4.9 4.8
Norway 945 944 20.0 19.8
32

Country 2008 Count 2009 Count 2008 Rate / 100,000 2009 Rate / 100,000
Finland 739 915 14.0 17.2
Switzerland 648 612 8.6 8.1
Canada 528 491 1.6 1.5
Hungary 468 489 4.7 4.9
Denmark 492 396 9.0 7.3
U K (Northern Ireland) 422 396 24.0 22.3
Mongolia 355 354 13.6 13.4
Kyrgyzstan 300 303 5.6 5.6
This list indicates the number of and per capita cases of recorded rape. It does not include cases of rape which gounreported, or which are not recorded. Nor does it specify whether recorded means reported, brought to trial, or
convicted. Nor does it take the different definition of rape around the world into account.
Country-wise Number of and Per Capita Cases of Recorded Rape - UN Statistics
http://en.wikipedia.org/wiki/Rape_statistics
Kyrgyzstan 300 303 5.6 5.6
Oman 132 183 4.8 6.6
Estonia 122 160 9.1 11.9
Syrian Arab Republic 125 156 0.6 0.7
Slovakia 182 152 3.4 2.8
Egypt 63 87 0.1 0.1
Iceland 87 68 28.2 21.6
Luxembourg 44 57 9.3 11.9
Solomon Islands 61 56 12.2 11.0
Bahrain 21 36 2.8 4.6
Cyprus 19 34 2.2 3.9
Azerbaijan 34 25 0.4 0.3
Maldives 5 9 1.7 3.0
33

Divorce Rate by CountryRank Country Divorce per 1000
1 United States 4.95
3 Russia 3.36
4 United Kingdom 3.08
6 New Zealand 2.63
7 Australia 2.52
8 Canada 2.46
12 Qatar 0.97
16 Singapore 0.80
17 China 0.79
19 Brunei 0.72
21 Syria 0.65
22 Thailand 0.58
23 Mauritius 0.47
30 Turkey 0.37
31 Mexico 0.33
32 Italy 0.27
33 Brazil 0.26
34 Sri Lanka 0.15
35 Weighted Average 1.30
http://www.nationmaster.com/graph/peo_div_rat-people-divorce-rate
34

S. No. Year
Trafficking
Country / Place
Purpose /Reason
AgencyNumbers
Amount ($)generated
Girls /Boys
Women MenWomen
andChildren
AllAnnual
BusinessFrom To
Sex and Human Trafficking: Facts and Figures
1Everyyear
- - -700,000 -4million
- 7 billion - WorldForced
prostitutionand labour
UN
2 1991 -1000
prostitutes - - -500 million
- Combodia15000 UN
-
35
2 1991 - prostitutesin capital
- - -500 million
/year- Combodia
15000 UNtroops
-
32001
(August)Ten yearold girls
- - - - - - Eritreafor sex forSoldierswith UN
-
4 - - - - Over 5000 - -
Philippines,Russia and
EasternEurope
South Korea US Military -
Contd. on next slide

S. No. Year
Trafficking
Country / PlacePurpose /Reason
AgencyNumbers
Amount ($)generated
Girls /Boys
Women MenWomen and
ChildrenAll
AnnualBusiness
From To
Sex and Human Trafficking: Facts and Figures
An estimated 2.5 million people with majority of trafficking victims arebetween 18 and 24 years of age (^5) and an estimated 1.2 million childrentrafficked each year (^6) are in forced labour (including sexual exploitation)with an estimated global annual profits made are US$ 31.6 billion (^14) atany given time as a result of trafficking (^1), of these:
127 (^4) 137 (^4) - -
5 - - - - -1.4 million
(56%)US$ 9.7 billion
(30.6%)- Asia and Pacific - -
36
6 - - - - -250,000(10%)
US$ 1.3 billion(4.1%)
-Latin and the
Caribbean- -
7 - - - - -230,000(9.2%)
US$ 1.5 billion(4.7%)
-the Middle Eastand Northern
Africa- -
8 - - - - -130,000(5.2%)
US$ 1.6 billion(5%)
-Sub-Saharan
Countries- -
9 - - - - -270,000(10.8%) US$ 15.5 billion
(49%)
-Industrialiazed
Countries- -
10 - - - - -200,000
(8%)- -
in countries intransition (^2)
- -
Contd. on next slide

Human Trafficking: The Facts
The Headline Facts:
• An estimated 2.5 million people are in forced labour (including sexual exploitation) at anygiven time as a result of trafficking (^1) Of these:
•1.4 million – 56% - are in Asia and the Pacific
•250,000 – 10% - are in Latin America and the Caribbean
•230,000 – 9.2% - are in the Middle East and Northern Africa
•130,000 – 5.2% - are in sub-Saharan countries
37
•130,000 – 5.2% - are in sub-Saharan countries
•270,000 – 10.8% - are in industrialized countries
•200,000 – 8% - are in countries in transition (^2)
• 161 countries are reported to be affected by human trafficking by being a source, transitor destination count (^3)
• People are reported to be trafficked from 127 countries to be exploited in 137 countries,affecting every continent and every type of economy (^4)
http://www.unglobalcompact.org/docs/issues_doc/labour/Forced_labour/HUMAN_TRAFFICKING_-
_THE_FACTS_-_final.pdf Contd. on next slide

References:
^1. International Labour Organization, Forced Labour Statistics Factsheet (2007)
^2. International Labour Organization, Forced Labour Statistics Factsheet (2007)
^3. United Nations Office on Drugs and Crime, Trafficking in Persons: Global Patterns (Vienna, 2006)
^4. United Nations Office on Drugs and Crime, Trafficking in Persons: Global Patterns (Vienna, 2006)
^5. International Organization for Migration, Counter-Trafficking Database, 78 Countries, 1999-2006
Sex and Human Trafficking: Facts and Figures
38
^5. International Organization for Migration, Counter-Trafficking Database, 78 Countries, 1999-2006(1999)
^6. UNICEF, UK Child Trafficking Information Sheet (January 2003)
^14. Patrick Besler, Forced Labour and Human Trafficking: Estimating the Profits, working paper(Geneva, International Labour Office, 2005)
^15. Patrick Besler, Forced Labour and Human Trafficking: Estimating the Profits, working paper(Geneva, International Labour Office, 2005)
http://www.unglobalcompact.org/docs/issues_doc/labour/Forced_labour/HUMAN_TRAFFICKING_-_THE_FACTS_-_final.pdf
www.teamwmi.org/educational-information/human-trafficking-facts-figures/

Country Warheads Active/Total Year of First Test CTBT status
The Five Nuclear-Weapon States under the NPT
United States 1,950 / 8,500 1945 ("Trinity") Signatory
Russia 2,430 / 11,000 1949 ("RDS-1") Ratifier
United Kingdom 160 / 225 1952 ("Hurricane") Ratifier
France 290 / 300 1960 ("Gerboise Bleue") Ratifier
China ~180 / 240 1964 ("596") Signatory
Countries with Nuclear Weapons
China ~180 / 240 1964 ("596") Signatory
Non-NPT Nuclear Powers
India n.a. / 80–100 1974 ("Smiling Buddha") Non-signatory
Pakistan n.a. / 90–110 1998 ("Chagai-I") Non-signatory
North Korea n.a. / <10 2006 (2006 test) Non-signatory
Undeclared Nuclear Powers
Israel n.a. / 80-200 possibly 1979 Signatory
http://en.wikipedia.org/wiki/List_of_states_with_nuclear_weapons
39

Producers1 Total OilProduction
Exporters2 Net OilExports
Consumers3 Total OilConsumption
Importers4 Net OilImports
1. Saudi Arabia 10.72 1. Saudi Arabia 8.65 1. United States 20.59 1. United States 12.22
2. Russia 9.67 2. Russia 6.57 2. China 7.27 2. Japan 5.1
3. United States 8.37 3. Norway 2.54 3. Japan 5.22 3. China 3.44
4. Iran 4.12 4. Iran 2.52 4. Russia 3.1 4. Germany 2.48
5. Mexico 3.71 5. U A E 2.52 5. Germany 2.63 5. South Korea 2.15
6. China 3.84 6. Venezuela 2.2 6. India 2.53 6. France 1.89
7. Canada 3.23 7. Kuwait 2.15 7. Canada 2.22 7. India 1.69
8. U A E 2.94 8. Nigeria 2.15 8. Brazil 2.12 8. Italy 1.56
Top World Oil Producers, Exporters, Consumers, and Importers, 2006(millions of barrels per day)
8. U A E 2.94 8. Nigeria 2.15 8. Brazil 2.12 8. Italy 1.56
9. Venezuela 2.81 9. Algeria 1.85 9. South Korea 2.12 9. Spain 1.56
10. Norway 2.79 10. Mexico 1.68 10. Saudi Arabia 2.07 10. Taiwan 0.94
11. Kuwait 2.67 11. Libya 1.52 11. Mexico 2.03 - -
12. Nigeria 2.44 12. Iraq 1.43 12. France 1.97 - -
13. Brazil 2.16 13. Angola 1.36 13. U K 1.82 - -
14. Iraq 2.01 14. Kazakhstan 1.11 14. Italy 1.71 - -
NOTE: OPEC members in italics.1. Table includes all countries with total oil production exceeding 2 million barrels per day in 2006. Includes crude oil, natural gas liquids, condensate,refinery gain, and other liquids.
2. Includes all countries with net exports exceeding 1 million barrels per day in 2006.
3. Includes all countries that consumed more than 2 million barrels per day in 2006.
4. Includes all countries that imported more than 1 million barrels per day in 2006.
Source: Energy Information Administration (EIA). www.eia.doe.gov/emeu/cabs/
40

Oil exporting countries are in a unique position to benefit from world demand forpetroleum products. On the following list, only Russia, Norway and Mexico are notmembers of OPEC and therefore have limited say in setting oil prices.
Top Ten Oil Exporting Countries(million barrels per day)
* Saudi Arabia (8.73)
Top Ten Oil Exporting Countries & Top Ten OilImporting Countries in the World
Top Ten Oil Importing Countries(million barrels per day)
* United States (11.8)* Saudi Arabia (8.73)* Russia (6.67)* Norway (2.91)* Iran (2.55)* Venezuela (2.36)* U A E (2.33)* Kuwait (2.20)* Nigeria (2.19)* Mexico (1.80)* Algeria (1.68)
http://expertscolumn.com/content/top-ten-oil-exporting-countries-top-ten-oil-importing-countries-world
* United States (11.8)* Japan (5.3)* China (2.9)* Germany (2.5)* South Korea (2.1)* France (2.0)* Italy (1.7)* Spain (1.6)* India (1.5)* Taiwan (1.0)
41

CountryOil Reserves
From Source 1* From Source 2**
Saudi Arabia 262 267
Canada 179 179
Iran 126 138
Iraq 115 115
Greatest Oil Reserves by Country - 2010(billion barrels)
Kuwait 102 104
U A E 98 98
Venezuela 77 87
Russia 60 79
Libya 39 41
Nigeria 35 36
*1. http://expertscolumn.com/content/top-ten-oil-exporting-countries-top-ten-oil-importing-countries-world
**2. http://www.aneki.com/oil.html
42

43