Embed Size (px)
Citation preview
10
Visually and Phonologically Similar Characters in Incorrect ChineseWords: Analyses, Identification, and Applications
C.-L. LIU, M.-H. LAI, K.-W. TIEN, and Y.-H. CHUANG, National Chengchi UniversityS.-H. WU, Chaoyang University of TechnologyC.-Y. LEE, Academia Sinica
Information about students’ mistakes opens a window to an understanding of their learning processes, andhelps us design effective course work to help students avoid replication of the same errors. Learning frommistakes is important not just in human learning activities; it is also a crucial ingredient in techniquesfor the developments of student models. In this article, we report findings of our study on 4,100 erroneousChinese words. Seventy-six percent of these errors were related to the phonological similarity between thecorrect and the incorrect characters, 46% were due to visual similarity, and 29% involved both factors. Wepropose a computing algorithm that aims at replication of incorrect Chinese words. The algorithm extendsthe principles of decomposing Chinese characters with the Cangjie codes to judge the visual similarity be-tween Chinese characters. The algorithm also employs empirical rules to determine the degree of similaritybetween Chinese phonemes. To show its effectiveness, we ran the algorithm to select and rank a list of about100 candidate characters, from more than 5,100 characters, for the incorrectly written character in each ofthe 4,100 errors. We inspected whether the incorrect character was indeed included in the candidate list andanalyzed whether the incorrect character was ranked at the top of the candidate list. Experimental resultsshow that our algorithm captured 97% of incorrect characters for the 4,100 errors, when the average lengthof the candidate lists was 104. Further analyses showed that the incorrect characters ranked among the top10 candidates in 89% of the phonologically similar errors and in 80% of the visually similar errors.
Categories and Subject Descriptors: I.2.7 [Computing Methodologies]: Artificial Intelligence—Naturallanguage processing; J.5 [Computer Applications]: Arts and Humanities—Linguistics; K.3.1 [Comput-ing Milieux]: Computers and Education—Computer uses in education; Computer-assisted instruction (CAI);H.3.5 [Information Systems]: Information Storage and Retrieval—Online information services; Web-basedservices; J.4 [Computer Applications]: Social and Behavioral Sciences—Psychology
General Terms: Design, Languages
Additional Key Words and Phrases: Error analysis of written Chinese text, student modeling, traditionalChinese, simplified Chinese, computer-assisted language learning, psycholinguistics
ACM Reference Format:Liu, C.-L., Lai, M.-H., Tien, K.-W., Chuang, Y.-H., Wu, S.-H., and Lee, C.-Y. 2010. Visually and phonologicallysimilar characters in incorrect Chinese words: Analyses, identification, and applications. ACM Trans. AsianLang. Inform. Process. 10, 2, Article 10 (June 2011), 39 pages.DOI = 10.1145/1967293.1967297 http://doi.acm.org/10.1145/1967293.1967297
This article was completed while C.-L. Liu visited the Department of Electrical Engineering and ComputerScience of the University of Michigan as a visiting scholar.This research was supported in part by the research contracts 97-2221-E-004-007, 99-2221-E-004-007, and99-2918-I-004-008 from the National Science Council of Taiwan.Authors’ addresses: C.-L. Liu, M.-H. Lai, K.-W. Tien, and Y.-H. Chuang, Department of Computer Sci-ence, College of Science, National Chengchi University, Taipei, Taiwan; email: {chaolin, g9523, g9627,g9804}@cs.nccu.edu.tw; S.-H. Wu, Department of Computer Science and Information Engineering, Collegeof Informatics, Chaoyang University of Technology, Taichung, Taiwan; email: [email protected]; C.-Y. Lee,Institute of Linguistics, Academia Sinica, Taipei, Taiwan; email: [email protected] to make digital or hard copies of part or all of this work for personal or classroom use is grantedwithout fee provided that copies are not made or distributed for profit or commercial advantage and thatcopies show this notice on the first page or initial screen of a display along with the full citation. Copyrightsfor components of this work owned by others than ACM must be honored. Abstracting with credit is permit-ted. To copy otherwise, to republish, to post on servers, to redistribute to lists, or to use any component ofthis work in other works requires prior specific permission and/or a fee. Permissions may be requested fromthe Publications Dept., ACM, Inc., 2 Penn Plaza, Suite 701, New York, NY 10121-0701 USA, fax +1 (212)869-0481, or [email protected]© 2011 ACM 1530-0226/2011/06-ART10 $10.00
DOI 10.1145/1967293.1967297 http://doi.acm.org/10.1145/1967293.1967297
ACM Transactions on Asian Language Information Processing, Vol. 10, No. 2, Article 10, Publication date: June 2011.
10:2 C.-L. Liu et al.
1. INTRODUCTION1
The studies about people using incorrect characters in Chinese words are related tothe education, perception, recognition, and applications of the Chinese language2.Some Chinese words contain just one character, but most words comprise two or morecharacters. For instance, “ ” (hao3)3 is a word that has just one character and means“good” in English. “ ” (yu3 yan2) is a word that is formed by two characters andmeans “language” in English. Experience indicates that the two most common causesfor writing or typing incorrect Chinese words are due to phonological and visualsimilarity between the correct and the incorrect characters [Liu et al. 2009a, 2009b,2009c]. For instance, one might use “ ” (su4) in the place of “ ” (su4) in “ ” (yan2su4) because of the phonological similarity; one might use “ ” (shi1) for “ ” (lu3) in“ ” (lu3 tu2) due to the visual similarity.
Manipulating the similarity between characters has served as an instrumental tech-nique in psycholinguistic studies into how people read and recognize Chinese charac-ters. Researchers in psycholinguistics investigate the cognition processes of Chinesereaders [Kuo et al. 2004; Lee et al. 2006; Tsai et al. 2006], by measuring readers’ re-sponse times to words that have various numbers of “neighbor” words. The neighborsof a Chinese word include phonologically and visually similar characters.
Phonologically and visually similar characters are also useful for computer assistedlanguage learning (CALL). In elementary schools in Taiwan, students may be re-quested to identify and correct “erroneous words” in test items, where, typically, an“erroneous word” contains an incorrect character that was introduced intentionallywhen teachers prepared the test items. Such tests are Incorrect Character Correctiontests (ICC tests). It takes effort and time to provide incorrect characters that are ap-propriate for different assessment purposes, and to make sure that the test items donot repeatedly use the same incorrect characters at the same time. We have built anenvironment for assisting the preparation of such test items [Liu et al. 2009a] by find-ing a way to offer phonologically and visually similar Chinese characters as candidatesto serve as the incorrect characters [Liu and Lin 2008].
In addition, phonologically and visually similar characters can be applied to studentmodeling, optical character recognition (OCR), and information retrieval (IR) in Chi-nese. Bug libraries contain students’ records of previous errors [Sison and Shimura1998; Virvou et al. 2000], and are useful for modeling student behavior. Some algo-rithms for optical character recognition for printed Chinese and for written Chinesetry to guess the input images based on confusion sets [Fan et al. 1995; Liu et al. 2004].Characters in a confusion set are similar to each other visually, and they help the OCRprograms to confine the search space for a given image. It would be possible to re-duce the computational costs and to increase recognition rates if we can pinpoint theconfusion set of a character that is being recognized. The current confusion sets arehand-crafted clusters of visually similar characters. In recent years, it has become a
1This article is a significantly extended version, in terms of the depth of discussion and the scale of ex-periments, of the material reported in Liu and Lin [2008], Liu et al. [2009a, 2009b, 2009c], and Liu et al.[2010].2In this article, we use “Chinese” to refer to Mandarin Chinese.3We show traditional and simplified Chinese characters followed by their Hanyu pinyin(http://en.wikipedia.org/wiki/Pinyin). The Hanyu pinyin of a Chinese character shows the sound of thecharacter by a string of English letters, and the digit that follows the letters is the tone for the character.To simplify our presentation, we will show Chinese text only in either the traditional or the simplified form,but not both. If presented in simplified Chinese, the errors listed in the first paragraph in the Introductionwill replace “ ” (su4) in “ ” (yan2 su4) by “ ” (su4) for phonological similarity and “ ” (lu3) in “ ”(lu3 tu2) by “ ” (shi1) for visual similarity. The traditional and simplified forms of a Chinese charactermight not differ from each other.
ACM Transactions on Asian Language Information Processing, Vol. 10, No. 2, Article 10, Publication date: June 2011.
Similar Characters in Incorrect Chinese Words 10:3
common practice for IR service providers, such as Yahoo! and Google, to offer correc-tions when users enter queries that contain incorrect words. For English queries, onemay apply the Levenshtein distance to compute the edit distance between the spellingsand employ the Soundex system to determine the degree of similarity between the pro-nunciations of words [cf., Croft et al. 2010; Manning et al. 2008]. These methods arenot perfect but can catch similar English words in practice. The work reported in thisarticle can be applied to find possible corrections for Chinese queries.
Some researchers state that there are more than 50,000 Chinese characters[HanDict 2010], although only thousands of characters are used in daily lives. Inthe People’s Republic of China, a government agency selected 7,000 popular Chinesecharacters and highlighted 3,500 characters among these 7,000 characters as the mostfrequently used characters in 19884. In Taiwan, 5,401 characters were selected to bethe most commonly used in daily lives in 1984 when the BIG5 code was formulated[Dict 2010].
Given that Chinese is used in different areas and in different countries in the world,it should not be surprising that not all people speak the “standard” Mandarin. We willfocus on the standards that are stated in specific lexicons in this research. Given aspecific lexicon, it is relatively easy to judge whether two characters have the same orsimilar pronunciations based on their records, when we do not consider the phenomenaof co-articulation. Although there are thousands of Chinese characters, these charac-ters are pronounced in only 420 different ways (cf., Lee [2009]). Interestingly, thereare many fewer Chinese words that are pronounced exactly the same way than thenumber of Chinese characters that are pronounced exactly the same way. The problemof determining the pronunciation of Chinese characters becomes more complex if weconsider tone sandhi [Chen 2000] in Chinese and if we consider the influences of sub-languages in the Chinese language family. We will discuss related issues in Section 2.
In contrast, there were no obvious ways to determine algorithmically whether twoChinese characters are visually similar yet. For instance, “ ” (yuan2), “ ” (yuan2),and “ ” (xun1) are similar to each other in some ways, due to the presence of “ ”(yuan2). Image processing techniques may be useful but are not perfectly practical,given the size of Chinese characters. A more important factor that affects the applica-bility of image processing methods is that many of the Chinese characters are similarto each other in subtle ways. “ ” (yuan2) is contained in “ ” (yuan2), “ ” (yuan2),and “ ” (xun1) in different sizes and at different positions.
We apply an extended version of the Cangjie codes [Cangjie 2010; Chu et al. 2010]to encode the layouts and details of traditional Chinese characters for computing vi-sually similar characters [Liu and Lin 2008; Liu et al. 2009a, 2009b, 2009c], and ex-tend the work to compare similar characters in simplified Chinese characters [Liu2010]. Evidence observed in psycholinguistic studies [Feldman and Siok 1999; Lee etal. 2006; Yeh and Li 2002] offers a cognition-based support for the design of our ap-proach; namely, the use of shared components to define the visual similarity betweenChinese characters.
The proposed method proves to be effective in capturing incorrect words for bothtraditional [Liu et al. 2009a, 2009b, 2009c] and simplified Chinese [Liu 2010]. We col-
4The statistics are available on the following two Wikipedia pages: http://zh.wikipedia.org/zh-tw/%E7%8E%B0%E4%BB%A3%E6%B1%89%E8%AF%AD%E9%80%9A%E7%94%A8%E5%AD%97%E8%A1%A8 (if Chi-nese is available on your computers: http://zh.wikipedia.org/zh/ ) and http://en.wikipedia.org/wiki/Xi%C3%A0nd%C3%A0i H%C3%A0ny%C7%94 Ch%C3%A1ngy%C3%B2ng Z%C3%ACbi%C7%8Eo (if Chinese is available on your computers: http://zh.wikipedia.org/zh/ ). The firstpage is written in Chinese, and the second one is in English. The translations of “ ” (xian4 dai4han4 yu3) and “ ” (zi4 biao3) are “Modern Chinese” and “character list”, respectively. We use “popular”for “ ” (tong1 yong4) and “most frequently used” for “ ” (chang2 yong4).
ACM Transactions on Asian Language Information Processing, Vol. 10, No. 2, Article 10, Publication date: June 2011.
10:4 C.-L. Liu et al.
lected and analyzed approximately 4,100 errors that were reported in published books,found in students’ compositions, or posted on the Internet. Each reported error is of aword which will be understood as appearing in its correct form as “ ”; but whichin the error may appear as “ ”, where “ ” is used instead of “ ”. Namely, writing“ ” as “ ” is a reported error. We found that 76% of the errors were relatedto phonological similarity and that 46% of the errors were related to visual similar-ity. More significantly, the dominance of the phonological factor was also observedin hand-written text, not just in electronic documents that were directly prepared oncomputers.
In experiments that aimed at reproducing the collected errors, we ran our programsto select and recommend a list of candidates from more than 5,100 Chinese charactersfor the correct character, that is, “ ”, and we recorded the likelihood that the can-didate list actually included the incorrect character. Experimental results show thatif the length of the candidate list is about 100, we achieved inclusion rates of about97% for both traditional and simplified Chinese. If the length of the candidate list wasshortened to 10, the average inclusion rates were 89% for the phonologically similarerrors and 80% for the visually similar errors. We have also applied our algorithms forreproducing the reported errors to build an environment to assist teachers to preparetest items for ICC tests.
In this article, we integrate and extend the previous reports on the phonologicallyand visually similar characters in both traditional and simplified Chinese to captureerrors in Chinese words. We go over some issues about phonological similarity inChinese in Section 2, elaborate how we extend and apply the Cangjie codes to judge thevisual similarity between Chinese characters in Section 3, explain how we acquired thereported errors and how we analyzed the phonological and visual influences on theseerrors in Section 4, present details about our experiments and discuss the observationsin Section 5, show a real-world application of the proposed techniques to the authoringof test items for the ICC tests in Section 6, and review some of the design issues andexperience in Section 7 before we summarize our work in Section 8.
Compared with the previous conference articles [Liu and Lin 2008; Liu et al. 2009a,2009b, 2009c; Liu et al. 2010], we expanded the scale of experiments and discussionsin terms of both depth and coverage. More specifically, we validated the reliabilityof the Web-based statistics by examining the data that we collected in 2009 and in2010, compared the contribution of different sources of similar characters, exploredthe applications of alternative ranking methods, and exhibited the robustness of ourapproach by running our systems over new data sets.
2. PHONOLOGICALLY SIMILAR CHARACTERS
Chinese characters are single syllable. The pronunciation of a Chinese character in-volves the nucleus and a tone, where the nucleus contains a vowel that follows anoptional consonant. In this article, we use the Hanyu pinyin method to denote thesound of Chinese characters, and show the tone with a digit that follows the symbolstring for the sound. In Mandarin Chinese, there are four tones. (Some researchersinclude the fifth tone.)
Although Chinese is not an alphabetical language, it is shown that the pronun-ciations of characters affect how people write Chinese [Ziegler et al. 2000]]. Thepronunciation of a Chinese character has two parts: sound and tone. Therefore, thephonological similarity between two characters may consider these two aspects, andwe consider four categories of phonological similarity between two characters: samesound and same tone (SS), same sound and different tone (SD), similar sound andsame tone (MS), and similar sound and different tone (MD).
ACM Transactions on Asian Language Information Processing, Vol. 10, No. 2, Article 10, Publication date: June 2011.
Similar Characters in Incorrect Chinese Words 10:5
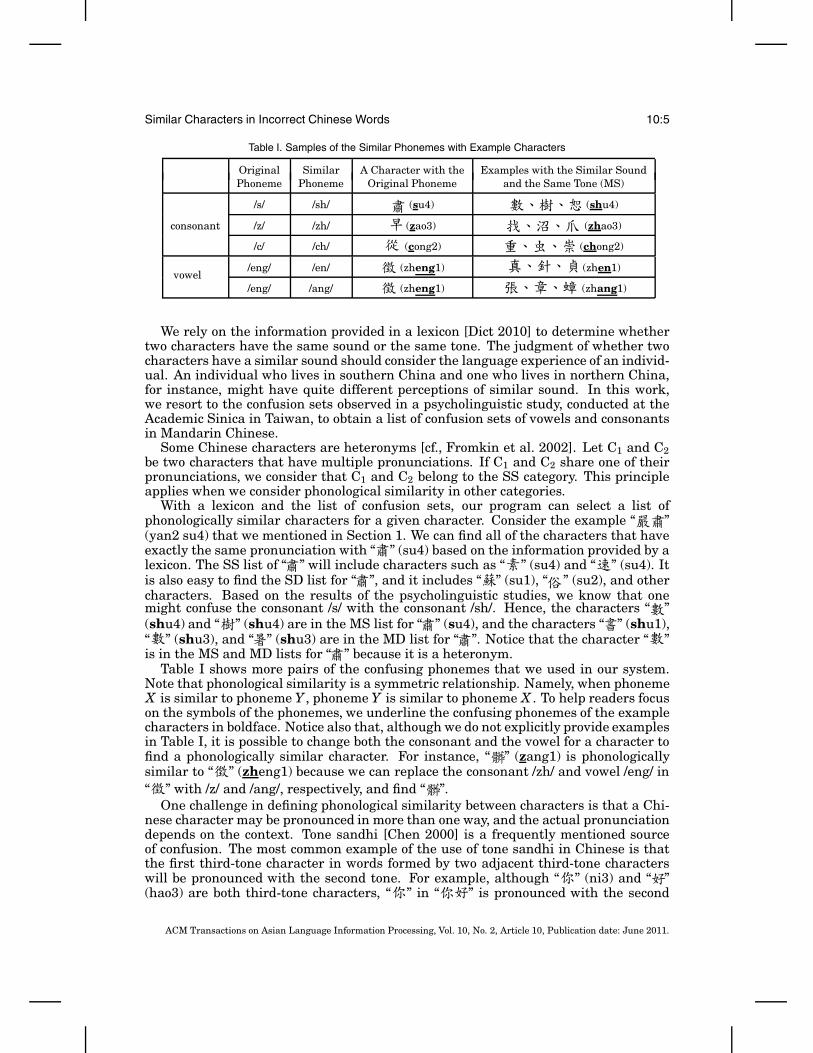
Table I. Samples of the Similar Phonemes with Example Characters
Original Similar A Character with the Examples with the Similar SoundPhoneme Phoneme Original Phoneme and the Same Tone (MS)
/s/ /sh/ (su4) (shu4)
consonant /z/ /zh/ (zao3) (zhao3)
/c/ /ch/ (cong2) (chong2)
vowel/eng/ /en/ (zheng1) (zhen1)
/eng/ /ang/ (zheng1) (zhang1)
We rely on the information provided in a lexicon [Dict 2010] to determine whethertwo characters have the same sound or the same tone. The judgment of whether twocharacters have a similar sound should consider the language experience of an individ-ual. An individual who lives in southern China and one who lives in northern China,for instance, might have quite different perceptions of similar sound. In this work,we resort to the confusion sets observed in a psycholinguistic study, conducted at theAcademic Sinica in Taiwan, to obtain a list of confusion sets of vowels and consonantsin Mandarin Chinese.
Some Chinese characters are heteronyms [cf., Fromkin et al. 2002]. Let C1 and C2be two characters that have multiple pronunciations. If C1 and C2 share one of theirpronunciations, we consider that C1 and C2 belong to the SS category. This principleapplies when we consider phonological similarity in other categories.
With a lexicon and the list of confusion sets, our program can select a list ofphonologically similar characters for a given character. Consider the example “ ”(yan2 su4) that we mentioned in Section 1. We can find all of the characters that haveexactly the same pronunciation with “ ” (su4) based on the information provided by alexicon. The SS list of “ ” will include characters such as “ ” (su4) and “ ” (su4). Itis also easy to find the SD list for “ ”, and it includes “ ” (su1), “ ” (su2), and othercharacters. Based on the results of the psycholinguistic studies, we know that onemight confuse the consonant /s/ with the consonant /sh/. Hence, the characters “ ”(shu4) and “ ” (shu4) are in the MS list for “ ” (su4), and the characters “ ” (shu1),“ ” (shu3), and “ ” (shu3) are in the MD list for “ ”. Notice that the character “ ”is in the MS and MD lists for “ ” because it is a heteronym.
Table I shows more pairs of the confusing phonemes that we used in our system.Note that phonological similarity is a symmetric relationship. Namely, when phonemeX is similar to phoneme Y , phoneme Y is similar to phoneme X . To help readers focuson the symbols of the phonemes, we underline the confusing phonemes of the examplecharacters in boldface. Notice also that, although we do not explicitly provide examplesin Table I, it is possible to change both the consonant and the vowel for a character tofind a phonologically similar character. For instance, “ ” (zang1) is phonologicallysimilar to “ ” (zheng1) because we can replace the consonant /zh/ and vowel /eng/ in“ ” with /z/ and /ang/, respectively, and find “ ”.
One challenge in defining phonological similarity between characters is that a Chi-nese character may be pronounced in more than one way, and the actual pronunciationdepends on the context. Tone sandhi [Chen 2000] is a frequently mentioned sourceof confusion. The most common example of the use of tone sandhi in Chinese is thatthe first third-tone character in words formed by two adjacent third-tone characterswill be pronounced with the second tone. For example, although “ ” (ni3) and “ ”(hao3) are both third-tone characters, “ ” in “ ” is pronounced with the second
ACM Transactions on Asian Language Information Processing, Vol. 10, No. 2, Article 10, Publication date: June 2011.
10:6 C.-L. Liu et al.
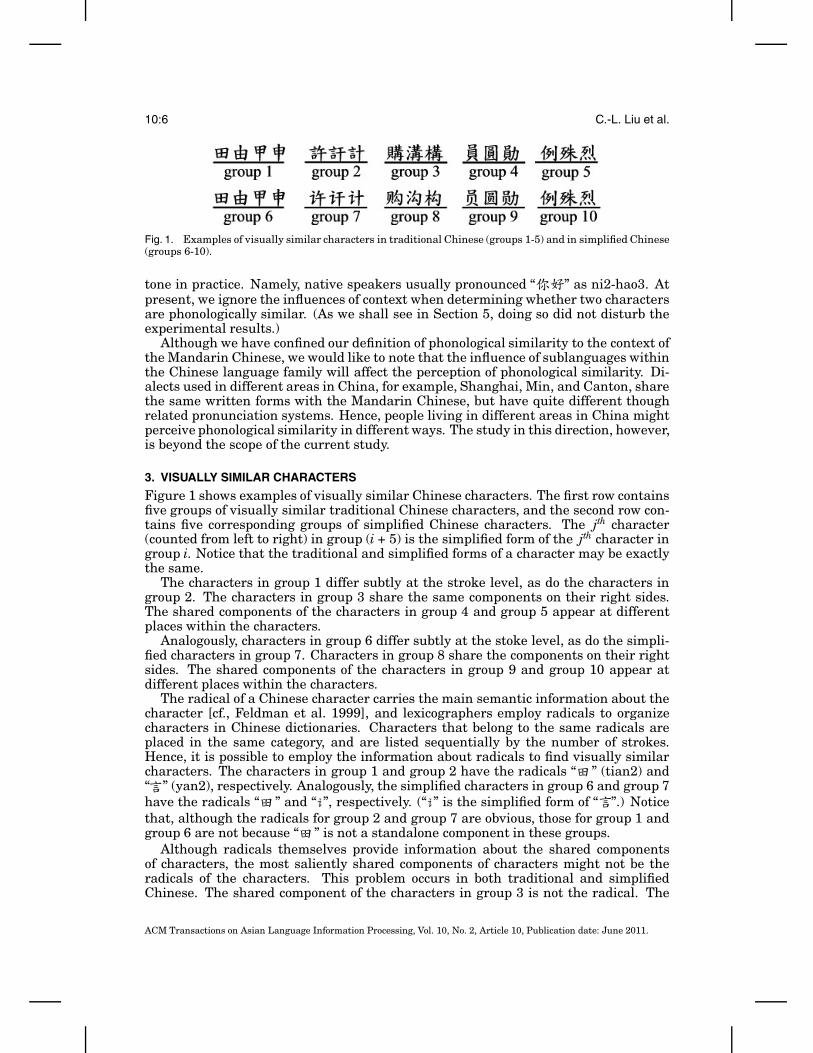
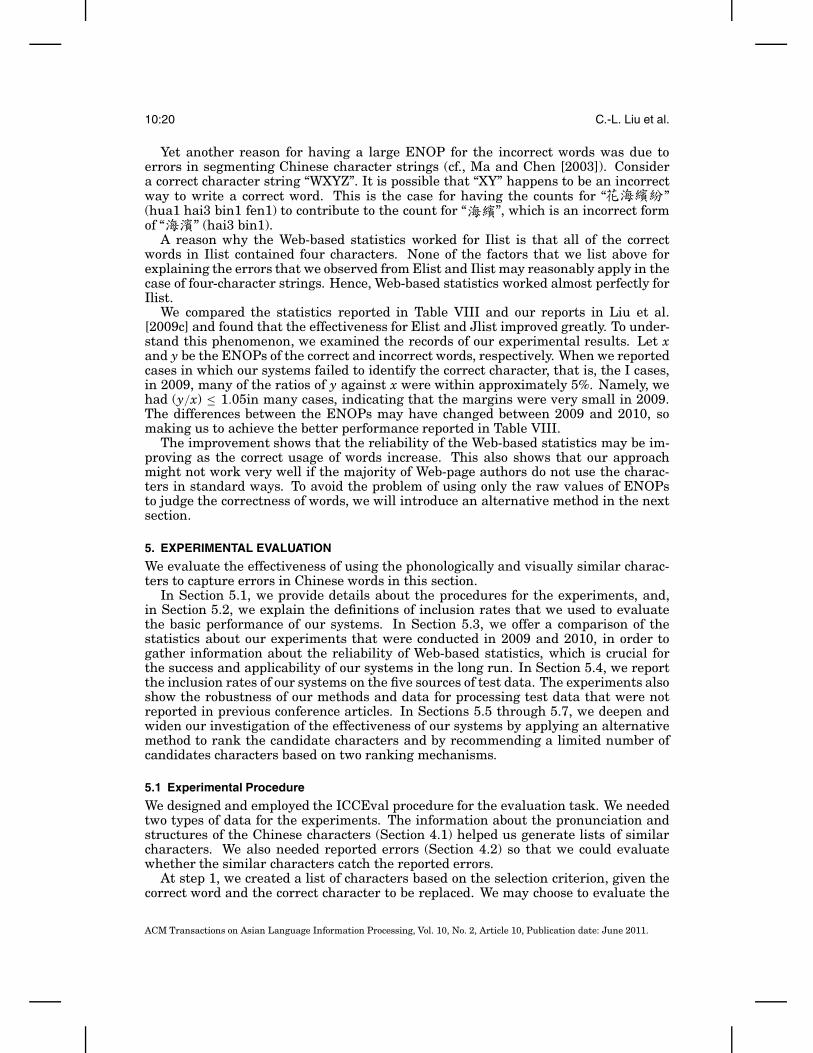
Fig. 1. Examples of visually similar characters in traditional Chinese (groups 1-5) and in simplified Chinese(groups 6-10).
tone in practice. Namely, native speakers usually pronounced “ ” as ni2-hao3. Atpresent, we ignore the influences of context when determining whether two charactersare phonologically similar. (As we shall see in Section 5, doing so did not disturb theexperimental results.)
Although we have confined our definition of phonological similarity to the context ofthe Mandarin Chinese, we would like to note that the influence of sublanguages withinthe Chinese language family will affect the perception of phonological similarity. Di-alects used in different areas in China, for example, Shanghai, Min, and Canton, sharethe same written forms with the Mandarin Chinese, but have quite different thoughrelated pronunciation systems. Hence, people living in different areas in China mightperceive phonological similarity in different ways. The study in this direction, however,is beyond the scope of the current study.
3. VISUALLY SIMILAR CHARACTERS
Figure 1 shows examples of visually similar Chinese characters. The first row containsfive groups of visually similar traditional Chinese characters, and the second row con-tains five corresponding groups of simplified Chinese characters. The jth character(counted from left to right) in group (i + 5) is the simplified form of the jth character ingroup i. Notice that the traditional and simplified forms of a character may be exactlythe same.
The characters in group 1 differ subtly at the stroke level, as do the characters ingroup 2. The characters in group 3 share the same components on their right sides.The shared components of the characters in group 4 and group 5 appear at differentplaces within the characters.
Analogously, characters in group 6 differ subtly at the stoke level, as do the simpli-fied characters in group 7. Characters in group 8 share the components on their rightsides. The shared components of the characters in group 9 and group 10 appear atdifferent places within the characters.
The radical of a Chinese character carries the main semantic information about thecharacter [cf., Feldman et al. 1999], and lexicographers employ radicals to organizecharacters in Chinese dictionaries. Characters that belong to the same radicals areplaced in the same category, and are listed sequentially by the number of strokes.Hence, it is possible to employ the information about radicals to find visually similarcharacters. The characters in group 1 and group 2 have the radicals “ ” (tian2) and“ ” (yan2), respectively. Analogously, the simplified characters in group 6 and group 7have the radicals “ ” and “ ”, respectively. (“ ” is the simplified form of “ ”.) Noticethat, although the radicals for group 2 and group 7 are obvious, those for group 1 andgroup 6 are not because “ ” is not a standalone component in these groups.
Although radicals themselves provide information about the shared componentsof characters, the most saliently shared components of characters might not be theradicals of the characters. This problem occurs in both traditional and simplifiedChinese. The shared component of the characters in group 3 is not the radical. The
ACM Transactions on Asian Language Information Processing, Vol. 10, No. 2, Article 10, Publication date: June 2011.
Similar Characters in Incorrect Chinese Words 10:7
shared components of the characters in groups 4, 8, and 9 are not the radicals forthe characters in the groups either. In these cases, the shared components carryinformation about the pronunciations of the characters. Hence, those characters arelisted under different radicals, though they do look similar in some ways.
In some cases, one may be interested in characters that share small elements inthe characters, such as “ ” (dai3) in group 5 and group 10. The shared elements inthese two groups do not carry semantic or phonological information, and they are notthe radicals either. It is also possible that a radical is written in different ways in thecharacters that have the same radical in a dictionary, for example, “ ” (quan2) and“ ” (bo2). These two characters are listed under the radical “ ” (shui3). The radicalappears literally in “ ”, but is written as “ ” in “ ”.
Therefore, we cannot rely only on the information about radicals of charactersin typical lexicons to find visually similar characters, and we will use the extendedCangjie codes as the basis to judge the degree of similarity between Chinesecharacters.
3.1 Cangjie Codes for Traditional Chinese
The Cangjie input method is one of the most popular methods used for entering Chi-nese characters into computers. The designer of the Cangjie method selected a set of24 basic elements occurring in characters, and proposed a set of rules to decomposeChinese characters according to these elements [Chu et al. 2010]. Because the Cangjiesystem is designed to help people enter Chinese characters into computers, the designof the Cangjie codes had aimed at allowing its users to recall the codes for Chinesecharacters as easy as possible. Namely, users must be able to easily figure out theCangjie codes for the characters that they want to enter. Given the popularity of theCangjije input method in a wide range of Chinese speaking communities, the Cangjiecodes of Chinese characters have practically shown their strong links with the forma-tion of Chinese characters. This was an important motivation for us to try to define thesimilarity between two Chinese characters based on the degree of similarity betweentheir Cangjie codes.
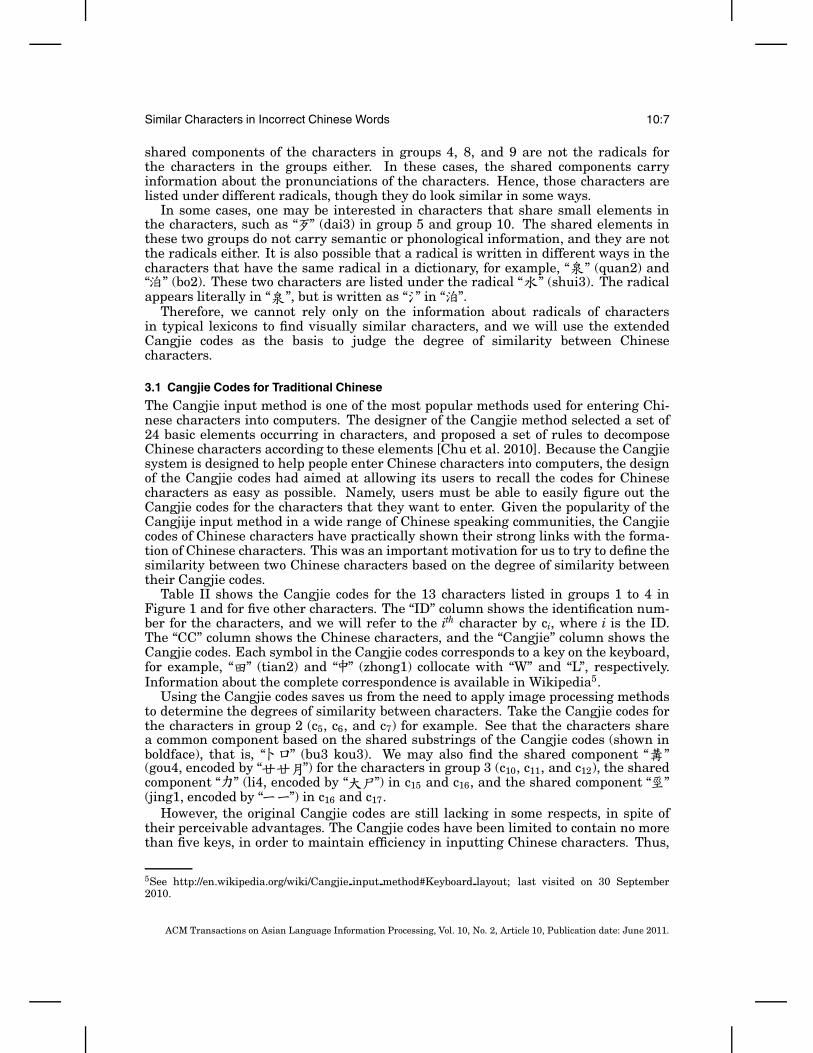
Table II shows the Cangjie codes for the 13 characters listed in groups 1 to 4 inFigure 1 and for five other characters. The “ID” column shows the identification num-ber for the characters, and we will refer to the ith character by ci, where i is the ID.The “CC” column shows the Chinese characters, and the “Cangjie” column shows theCangjie codes. Each symbol in the Cangjie codes corresponds to a key on the keyboard,for example, “ ” (tian2) and “ ” (zhong1) collocate with “W” and “L”, respectively.Information about the complete correspondence is available in Wikipedia5.
Using the Cangjie codes saves us from the need to apply image processing methodsto determine the degrees of similarity between characters. Take the Cangjie codes forthe characters in group 2 (c5, c6, and c7) for example. See that the characters sharea common component based on the shared substrings of the Cangjie codes (shown inboldface), that is, “ ” (bu3 kou3). We may also find the shared component “ ”(gou4, encoded by “ ”) for the characters in group 3 (c10, c11, and c12), the sharedcomponent “ ” (li4, encoded by “ ”) in c15 and c16, and the shared component “ ”(jing1, encoded by “ ”) in c16 and c17.
However, the original Cangjie codes are still lacking in some respects, in spite oftheir perceivable advantages. The Cangjie codes have been limited to contain no morethan five keys, in order to maintain efficiency in inputting Chinese characters. Thus,
5See http://en.wikipedia.org/wiki/Cangjie input method#Keyboard layout; last visited on 30 September2010.
ACM Transactions on Asian Language Information Processing, Vol. 10, No. 2, Article 10, Publication date: June 2011.
10:8 C.-L. Liu et al.
Table II. Examples of Cangjie Codes for Traditional Chinese
ID CC Cangjie ID CC Cangjie
1 10
2 11
3 12
4 13
5 14
6 15
7 16
8 17
9 18
Table III. Examples of Cangjie Codes for Simplified Chinese
ID CC Cangjie ID CC Cangjie
19 28
20 29
21 30
22 31
23 32
24 33
25 34
26 35
27 36
users of the Cangjie input method must familiarize themselves with the principles forsimplifying the Cangjie codes. While the simplified codes help to enhance the input ef-ficiency, they also introduce difficulties and ambiguities when we compare the originalCangjie codes for computing similar characters. The shared component “ ” (yuan2) isencoded in three different ways in c13, c14, and c15, i.e., “ ” (kao2 yue4 shan1jin1), “ ”, and “ ”. The prefix “ ” in c16 and c17 can represent “ ” (jing1),“ ” (zheng4; e.g., in c8), and “ ” (er4; e.g., in c9). Consequently, characters whoseCangjie codes include “ ” may contain any of these three components, but c8, c9,and c16do not really look alike.
3.2 Cangjie Codes for Simplified Chinese
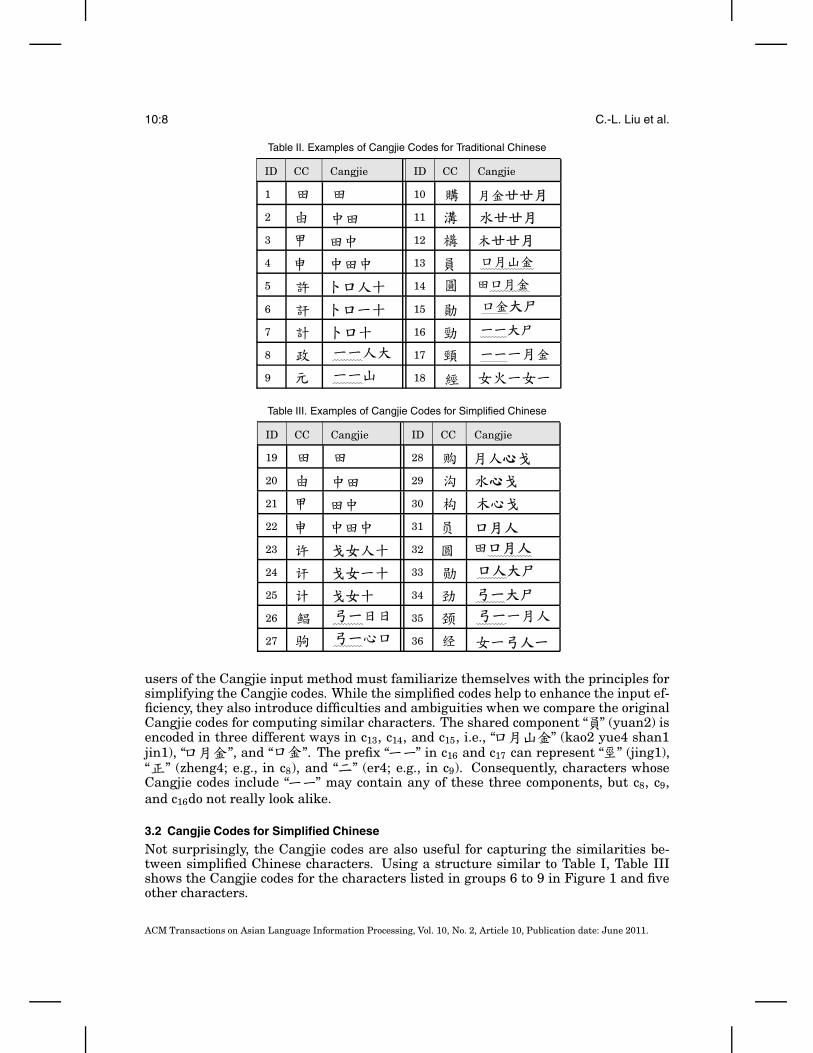
Not surprisingly, the Cangjie codes are also useful for capturing the similarities be-tween simplified Chinese characters. Using a structure similar to Table I, Table IIIshows the Cangjie codes for the characters listed in groups 6 to 9 in Figure 1 and fiveother characters.
ACM Transactions on Asian Language Information Processing, Vol. 10, No. 2, Article 10, Publication date: June 2011.
Similar Characters in Incorrect Chinese Words 10:9
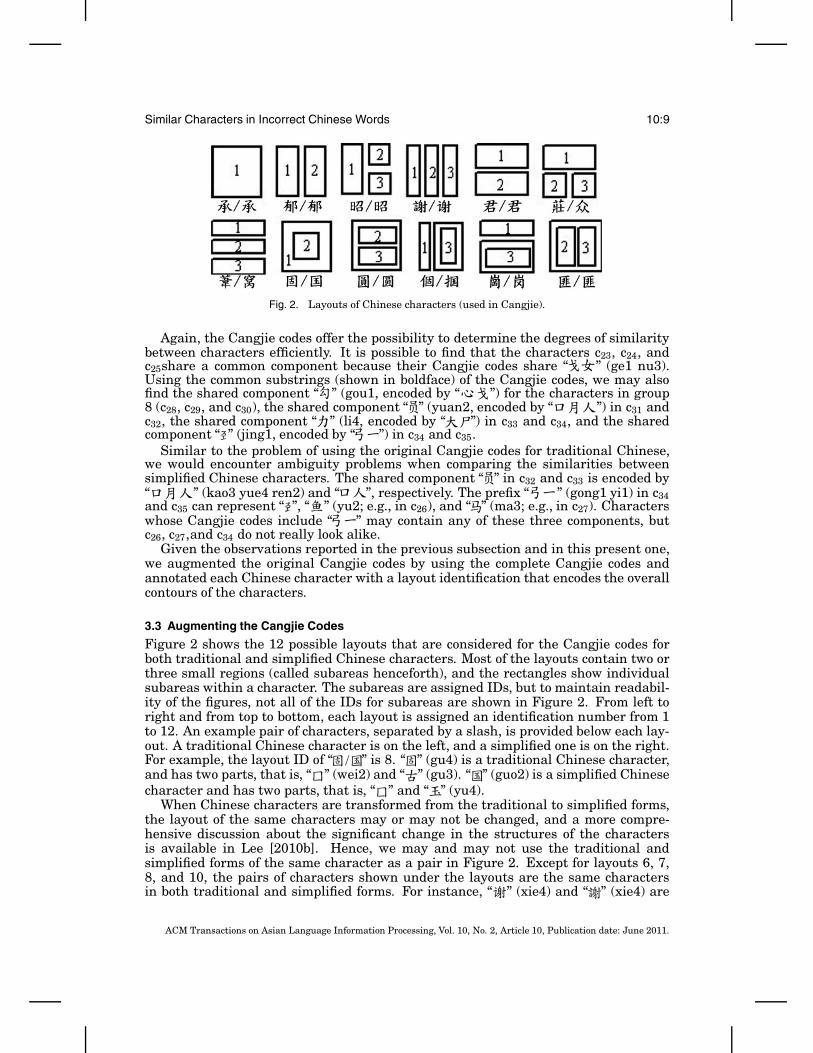
Fig. 2. Layouts of Chinese characters (used in Cangjie).
Again, the Cangjie codes offer the possibility to determine the degrees of similaritybetween characters efficiently. It is possible to find that the characters c23, c24, andc25share a common component because their Cangjie codes share “ ” (ge1 nu3).Using the common substrings (shown in boldface) of the Cangjie codes, we may alsofind the shared component “ ” (gou1, encoded by “ ”) for the characters in group8 (c28, c29, and c30), the shared component “ ” (yuan2, encoded by “ ”) in c31 andc32, the shared component “ ” (li4, encoded by “ ”) in c33 and c34, and the sharedcomponent “ ” (jing1, encoded by “ ”) in c34 and c35.
Similar to the problem of using the original Cangjie codes for traditional Chinese,we would encounter ambiguity problems when comparing the similarities betweensimplified Chinese characters. The shared component “ ” in c32 and c33 is encoded by“ ” (kao3 yue4 ren2) and “ ”, respectively. The prefix “ ” (gong1 yi1) in c34and c35 can represent “ ”, “ ” (yu2; e.g., in c26), and “ ” (ma3; e.g., in c27). Characterswhose Cangjie codes include “ ” may contain any of these three components, butc26, c27,and c34 do not really look alike.
Given the observations reported in the previous subsection and in this present one,we augmented the original Cangjie codes by using the complete Cangjie codes andannotated each Chinese character with a layout identification that encodes the overallcontours of the characters.
3.3 Augmenting the Cangjie Codes
Figure 2 shows the 12 possible layouts that are considered for the Cangjie codes forboth traditional and simplified Chinese characters. Most of the layouts contain two orthree small regions (called subareas henceforth), and the rectangles show individualsubareas within a character. The subareas are assigned IDs, but to maintain readabil-ity of the figures, not all of the IDs for subareas are shown in Figure 2. From left toright and from top to bottom, each layout is assigned an identification number from 1to 12. An example pair of characters, separated by a slash, is provided below each lay-out. A traditional Chinese character is on the left, and a simplified one is on the right.For example, the layout ID of “ / ” is 8. “ ” (gu4) is a traditional Chinese character,and has two parts, that is, “ ” (wei2) and “ ” (gu3). “ ” (guo2) is a simplified Chinesecharacter and has two parts, that is, “ ” and “ ” (yu4).
When Chinese characters are transformed from the traditional to simplified forms,the layout of the same characters may or may not be changed, and a more compre-hensive discussion about the significant change in the structures of the charactersis available in Lee [2010b]. Hence, we may and may not use the traditional andsimplified forms of the same character as a pair in Figure 2. Except for layouts 6, 7,8, and 10, the pairs of characters shown under the layouts are the same charactersin both traditional and simplified forms. For instance, “ ” (xie4) and “ ” (xie4) are
ACM Transactions on Asian Language Information Processing, Vol. 10, No. 2, Article 10, Publication date: June 2011.
10:10 C.-L. Liu et al.
examples of layout 4, and “ ” is the simplified form of “ ”. In contrast, “ ” and “ ”are two different characters, but both are examples of layout 8. The traditional formof “ ” is “ ”, which belongs to layout 9.
Researchers have come up with other ways to decompose individual Chinese char-acters. A team at the Shanghai Jiao-Tong University (SJTU) report an early attempt,and they consider five major ways to decompose Chinese characters [p. 1071, SJ-TUD 1988]. In this study, the SJTU team report detailed analysis of the compositionsof Chinese characters. Based on their analysis, “ ” (kou3) and “ ” (mu4) are themost frequent components in Chinese characters [p. 1027, SJTUD 1988]. Juang etal. [2005] employ four relationships for components of Chinese characters, and Sunet al. [2002] six relationships. The Chinese Document Laboratory at the AcademiaSinica in Taiwan considers 13 possible ways to decompose Chinese characters [CDL2010]. Lee [2010b] proposes more than 30 possible layouts. In Unicode standard 4.0.1,12 operators are considered to build Chinese characters from a set of building blocks[UNICODE 2010].
The layout of a character affects how people perceive the visual similarity betweencharacters [Yeh and Li 2002]. For instance, c16 (“ ”, jing4) in Table II is more similarto c17 (“ ”, jing3) than to c18 (“ ”, jing1), because the shared component of c16 andc17 is on the same side of the words. Overall, c16, c17, and c18 are more similar to eachother than to “ ” (jing1), although they share “ ” (jing1). We follow the style by whichChinese characters are decomposed in the Cangjie system, and rely on the expertisein Cangjie codes reported in Lee [2010a] to divide a Chinese character into subareas,which we showed in Figure 2.
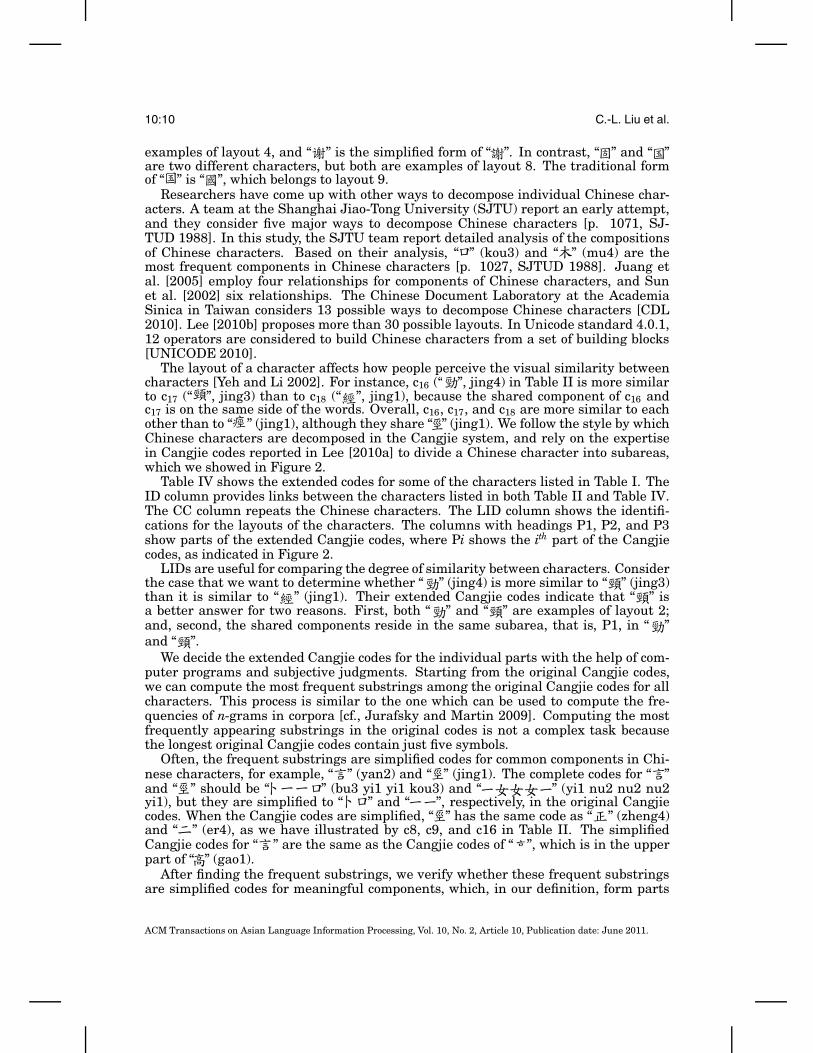
Table IV shows the extended codes for some of the characters listed in Table I. TheID column provides links between the characters listed in both Table II and Table IV.The CC column repeats the Chinese characters. The LID column shows the identifi-cations for the layouts of the characters. The columns with headings P1, P2, and P3show parts of the extended Cangjie codes, where Pi shows the ith part of the Cangjiecodes, as indicated in Figure 2.
LIDs are useful for comparing the degree of similarity between characters. Considerthe case that we want to determine whether “ ” (jing4) is more similar to “ ” (jing3)than it is similar to “ ” (jing1). Their extended Cangjie codes indicate that “ ” isa better answer for two reasons. First, both “ ” and “ ” are examples of layout 2;and, second, the shared components reside in the same subarea, that is, P1, in “ ”and “ ”.
We decide the extended Cangjie codes for the individual parts with the help of com-puter programs and subjective judgments. Starting from the original Cangjie codes,we can compute the most frequent substrings among the original Cangjie codes for allcharacters. This process is similar to the one which can be used to compute the fre-quencies of n-grams in corpora [cf., Jurafsky and Martin 2009]. Computing the mostfrequently appearing substrings in the original codes is not a complex task becausethe longest original Cangjie codes contain just five symbols.
Often, the frequent substrings are simplified codes for common components in Chi-nese characters, for example, “ ” (yan2) and “ ” (jing1). The complete codes for “ ”and “ ” should be “ ” (bu3 yi1 yi1 kou3) and “ ” (yi1 nu2 nu2 nu2yi1), but they are simplified to “ ” and “ ”, respectively, in the original Cangjiecodes. When the Cangjie codes are simplified, “ ” has the same code as “ ” (zheng4)and “ ” (er4), as we have illustrated by c8, c9, and c16 in Table II. The simplifiedCangjie codes for “ ” are the same as the Cangjie codes of “ ”, which is in the upperpart of “ ” (gao1).
After finding the frequent substrings, we verify whether these frequent substringsare simplified codes for meaningful components, which, in our definition, form parts
ACM Transactions on Asian Language Information Processing, Vol. 10, No. 2, Article 10, Publication date: June 2011.
Similar Characters in Incorrect Chinese Words 10:11
Table IV. Examples of Extended Cangjie Codes for Traditional Chinese
ID CC LID P1 P2 P3
5 2
6 2
7 2
10 10
11 10
12 10
13 5
14 9
15 2
16 2
17 2
18 3
of one or more Chinese characters. For meaningful components, we replace the sim-plified codes with their complete codes. For instance, the Cangjie codes for “ ” (xu3)and “ ” (jie2) are extended to contain “ ” in Table IV, where we indicate theextended keys that did not belong to the original Cangjie codes in boldface and with asurrounding box. After recovering the dropped codes for “ ”, our programs will havethe information necessary to be able to tell “ ” and “ ” apart.
Although we have tried to employ computer programs to help us find the frequentsubstrings in as many instances as we can, the work to recover the simplified codesremained labor-intensive, and we had to devote particular attention to certain anom-alous cases at times. Fortunately, the process to implement the extended Cangjie codesproved to be worthwhile as we will show in the experimental studies.
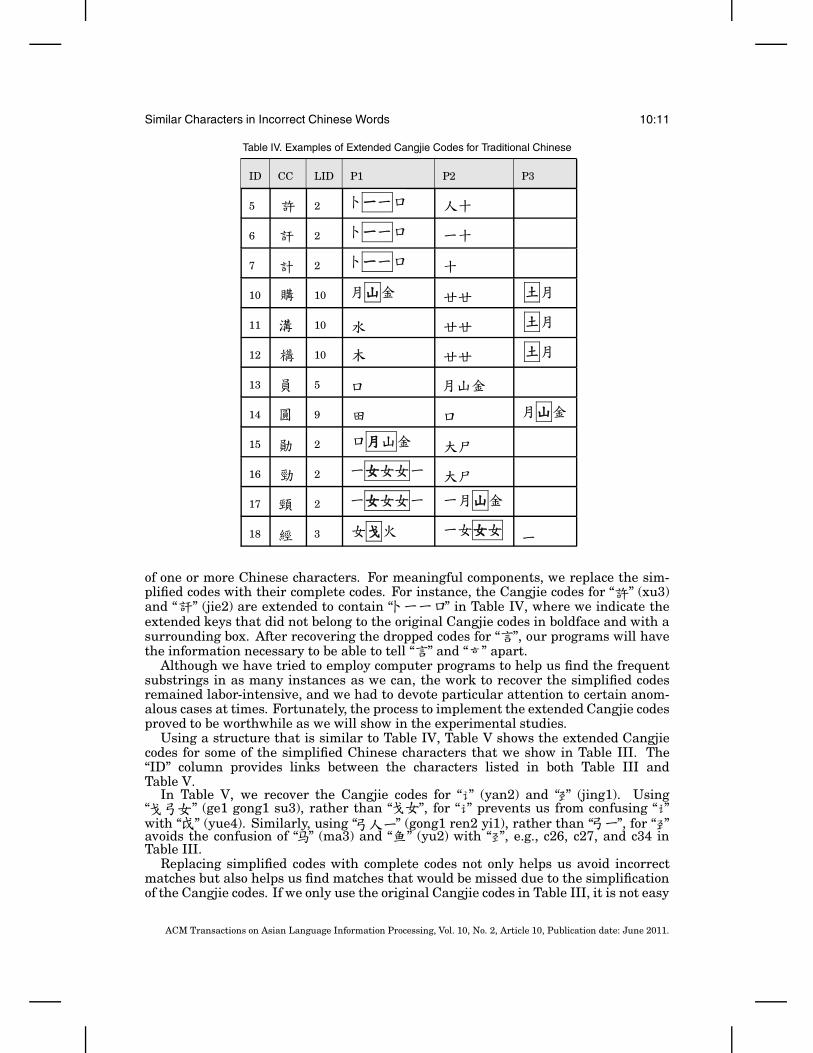
Using a structure that is similar to Table IV, Table V shows the extended Cangjiecodes for some of the simplified Chinese characters that we show in Table III. The“ID” column provides links between the characters listed in both Table III andTable V.
In Table V, we recover the Cangjie codes for “ ” (yan2) and “ ” (jing1). Using“ ” (ge1 gong1 su3), rather than “ ”, for “ ” prevents us from confusing “ ”with “ ” (yue4). Similarly, using “ ” (gong1 ren2 yi1), rather than “ ”, for “ ”avoids the confusion of “ ” (ma3) and “ ” (yu2) with “ ”, e.g., c26, c27, and c34 inTable III.
Replacing simplified codes with complete codes not only helps us avoid incorrectmatches but also helps us find matches that would be missed due to the simplificationof the Cangjie codes. If we only use the original Cangjie codes in Table III, it is not easy
ACM Transactions on Asian Language Information Processing, Vol. 10, No. 2, Article 10, Publication date: June 2011.
10:12 C.-L. Liu et al.
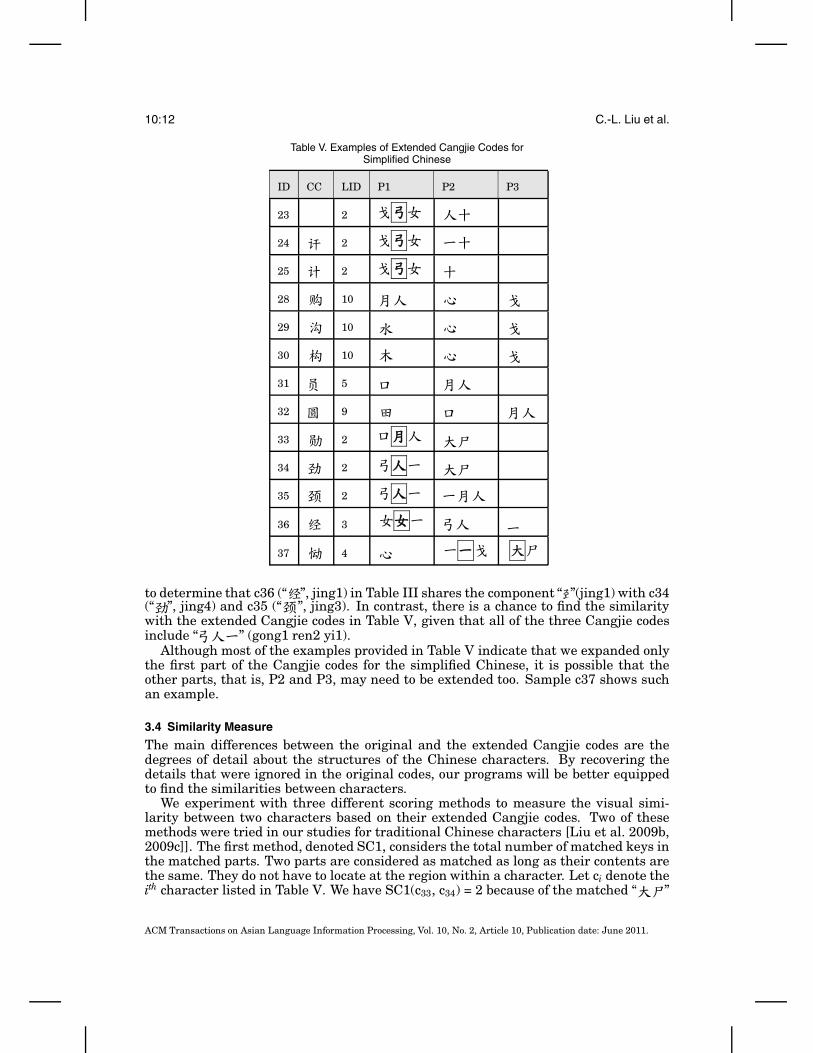
Table V. Examples of Extended Cangjie Codes forSimplified Chinese
ID CC LID P1 P2 P3
23 2
24 2
25 2
28 10
29 10
30 10
31 5
32 9
33 2
34 2
35 2
36 3
37 4
to determine that c36 (“ ”, jing1) in Table III shares the component “ ”(jing1) with c34(“ ”, jing4) and c35 (“ ”, jing3). In contrast, there is a chance to find the similaritywith the extended Cangjie codes in Table V, given that all of the three Cangjie codesinclude “ ” (gong1 ren2 yi1).
Although most of the examples provided in Table V indicate that we expanded onlythe first part of the Cangjie codes for the simplified Chinese, it is possible that theother parts, that is, P2 and P3, may need to be extended too. Sample c37 shows suchan example.
3.4 Similarity Measure
The main differences between the original and the extended Cangjie codes are thedegrees of detail about the structures of the Chinese characters. By recovering thedetails that were ignored in the original codes, our programs will be better equippedto find the similarities between characters.
We experiment with three different scoring methods to measure the visual simi-larity between two characters based on their extended Cangjie codes. Two of thesemethods were tried in our studies for traditional Chinese characters [Liu et al. 2009b,2009c]]. The first method, denoted SC1, considers the total number of matched keys inthe matched parts. Two parts are considered as matched as long as their contents arethe same. They do not have to locate at the region within a character. Let ci denote theith character listed in Table V. We have SC1(c33, c34) = 2 because of the matched “ ”
ACM Transactions on Asian Language Information Processing, Vol. 10, No. 2, Article 10, Publication date: June 2011.
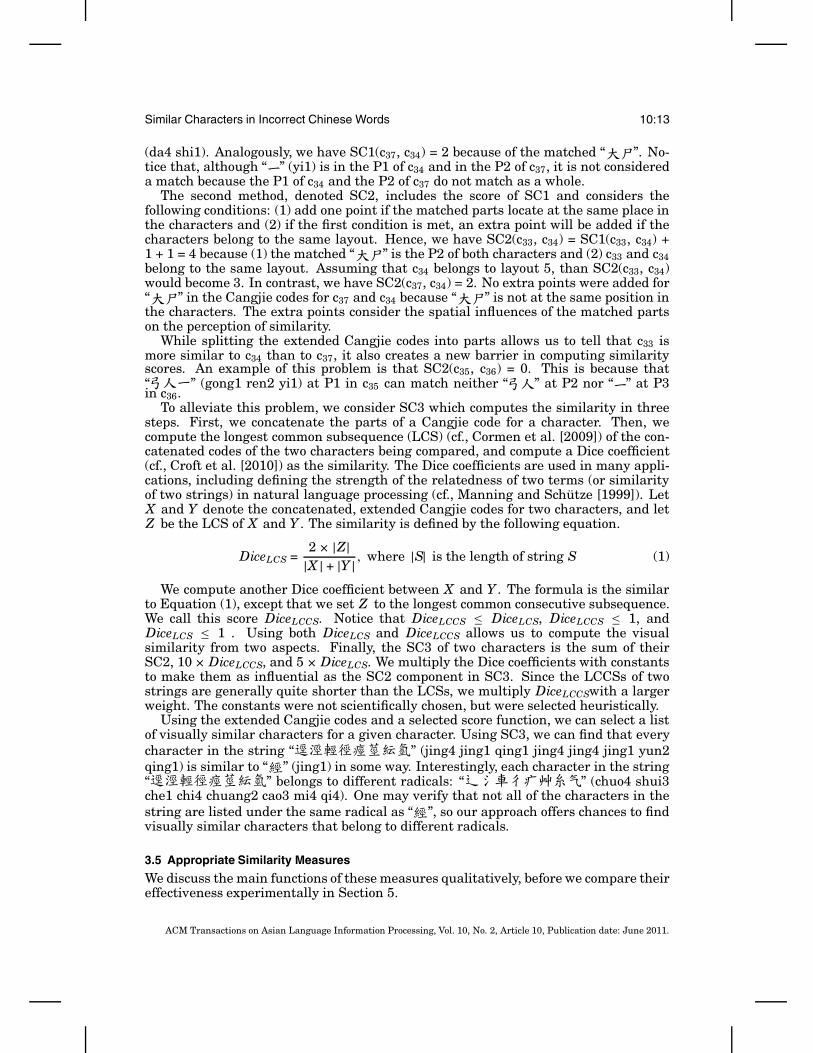
Similar Characters in Incorrect Chinese Words 10:13
(da4 shi1). Analogously, we have SC1(c37, c34) = 2 because of the matched “ ”. No-tice that, although “ ” (yi1) is in the P1 of c34 and in the P2 of c37, it is not considereda match because the P1 of c34 and the P2 of c37 do not match as a whole.
The second method, denoted SC2, includes the score of SC1 and considers thefollowing conditions: (1) add one point if the matched parts locate at the same place inthe characters and (2) if the first condition is met, an extra point will be added if thecharacters belong to the same layout. Hence, we have SC2(c33, c34) = SC1(c33, c34) +1 + 1 = 4 because (1) the matched “ ” is the P2 of both characters and (2) c33 and c34belong to the same layout. Assuming that c34 belongs to layout 5, than SC2(c33, c34)would become 3. In contrast, we have SC2(c37, c34) = 2. No extra points were added for“ ” in the Cangjie codes for c37 and c34 because “ ” is not at the same position inthe characters. The extra points consider the spatial influences of the matched partson the perception of similarity.
While splitting the extended Cangjie codes into parts allows us to tell that c33 ismore similar to c34 than to c37, it also creates a new barrier in computing similarityscores. An example of this problem is that SC2(c35, c36) = 0. This is because that“ ” (gong1 ren2 yi1) at P1 in c35 can match neither “ ” at P2 nor “ ” at P3in c36.
To alleviate this problem, we consider SC3 which computes the similarity in threesteps. First, we concatenate the parts of a Cangjie code for a character. Then, wecompute the longest common subsequence (LCS) (cf., Cormen et al. [2009]) of the con-catenated codes of the two characters being compared, and compute a Dice coefficient(cf., Croft et al. [2010]) as the similarity. The Dice coefficients are used in many appli-cations, including defining the strength of the relatedness of two terms (or similarityof two strings) in natural language processing (cf., Manning and Schutze [1999]). LetX and Y denote the concatenated, extended Cangjie codes for two characters, and letZ be the LCS of X and Y . The similarity is defined by the following equation.
DiceLCS =2 × |Z|
|X | + |Y | , where |S| is the length of string S (1)
We compute another Dice coefficient between X and Y . The formula is the similarto Equation (1), except that we set Z to the longest common consecutive subsequence.We call this score DiceLCCS. Notice that DiceLCCS ≤ DiceLCS, DiceLCCS ≤ 1, andDiceLCS ≤ 1 . Using both DiceLCS and DiceLCCS allows us to compute the visualsimilarity from two aspects. Finally, the SC3 of two characters is the sum of theirSC2, 10 × DiceLCCS, and 5 × DiceLCS. We multiply the Dice coefficients with constantsto make them as influential as the SC2 component in SC3. Since the LCCSs of twostrings are generally quite shorter than the LCSs, we multiply DiceLCCSwith a largerweight. The constants were not scientifically chosen, but were selected heuristically.
Using the extended Cangjie codes and a selected score function, we can select a listof visually similar characters for a given character. Using SC3, we can find that everycharacter in the string “ ” (jing4 jing1 qing1 jing4 jing4 jing1 yun2qing1) is similar to “ ” (jing1) in some way. Interestingly, each character in the string“ ” belongs to different radicals: “ ” (chuo4 shui3che1 chi4 chuang2 cao3 mi4 qi4). One may verify that not all of the characters in thestring are listed under the same radical as “ ”, so our approach offers chances to findvisually similar characters that belong to different radicals.
3.5 Appropriate Similarity Measures
We discuss the main functions of these measures qualitatively, before we compare theireffectiveness experimentally in Section 5.
ACM Transactions on Asian Language Information Processing, Vol. 10, No. 2, Article 10, Publication date: June 2011.
10:14 C.-L. Liu et al.
Consider the problem of finding a set of “visually similar characters” for a givencharacter within a Chinese word. Except resorting to the remembrance of humanexperts, how can we find similar characters from thousands of characters? A moreimportant question may be what we mean by “similar” characters. Certainly, somecharacters can look similar individually. However, when putting into the contextsof words, some words can become more attractive than others. For instance, “ ”(hao4), “ ” (hao4), and “ ” (zhi4) are almost equally similar to each other in someways. Each pair differs in only in one of their components. Replacing the radical“ ” (shui3) in “ ” with the radical “ ” (bai2) will create “ ”, and replacing thecomponent “ ” (gao4) in “ ” with the component “ ” (tai2) will create “ ”. However,“ ” (hao4 da4), and “ ” (zhi4 da4) are not equally attractive for the writingof “ ” (hao4 da4). Psycholinguistic evidence has shown that humans do not readtext letter by letter for alphabetic languages or character by character for languagessuch as Chinese (e.g., Jackendoff [1995]). The contexts matter in determining thesimilarities.
As a result, the “best” similarity measure for computer software depend on the goalsof the applications. Do we want to build a model for how humans judge visually-similarcharacters? Do we want to build a model for how human process confusing words inwhich some characters are visually similar?
In this article, the target application is more closely related to the latter question.In another application that we are building for learning Chinese characters [Liu et al.2011], we are more concerned with similarity between individual characters. Hence,the similarity measures that we presented in the previous section were just to find“good candidates”, and we will have another measure to compare these first-roundcandidates.
This is the main reason that we did not report experiments in which we carefullytuned the weights for SC3. The main function of SC3 in the current study was to findgood first-round candidates.
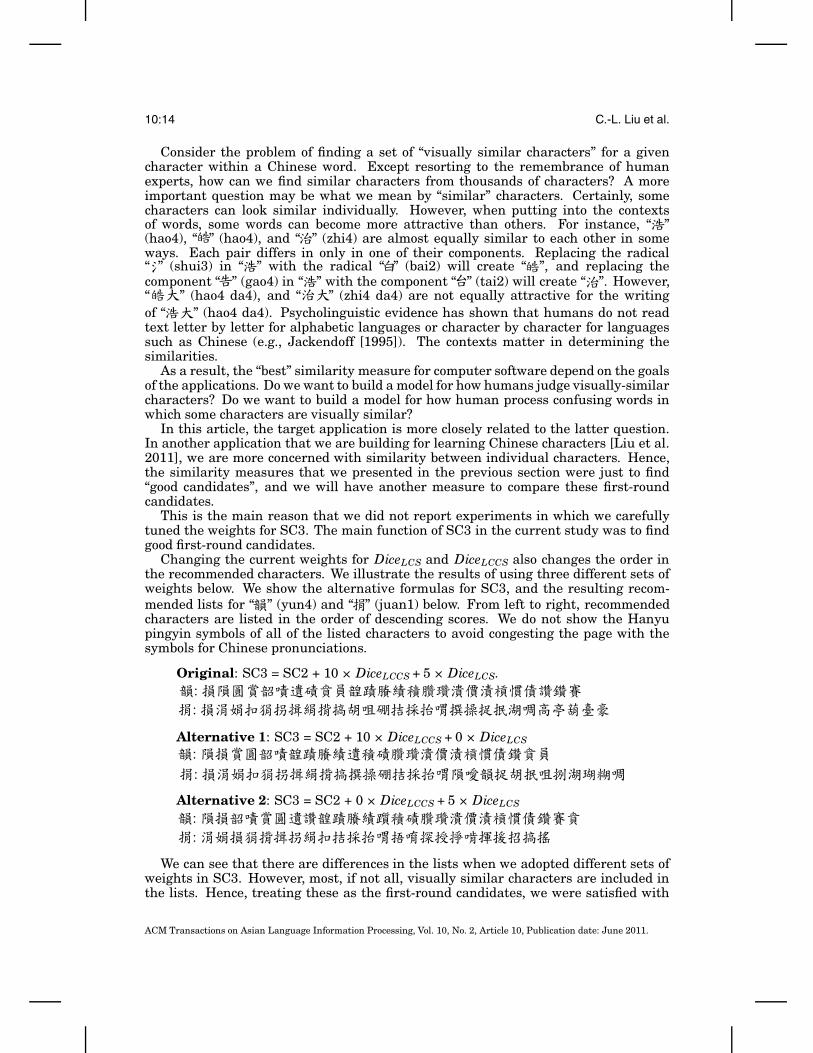
Changing the current weights for DiceLCS and DiceLCCS also changes the order inthe recommended characters. We illustrate the results of using three different sets ofweights below. We show the alternative formulas for SC3, and the resulting recom-mended lists for “ ” (yun4) and “ ” (juan1) below. From left to right, recommendedcharacters are listed in the order of descending scores. We do not show the Hanyupingyin symbols of all of the listed characters to avoid congesting the page with thesymbols for Chinese pronunciations.
Original: SC3 = SC2 + 10 × DiceLCCS + 5 × DiceLCS.::
Alternative 1: SC3 = SC2 + 10 × DiceLCCS + 0 × DiceLCS
: :
Alternative 2: SC3 = SC2 + 0 × DiceLCCS + 5 × DiceLCS
: :
We can see that there are differences in the lists when we adopted different sets ofweights in SC3. However, most, if not all, visually similar characters are included inthe lists. Hence, treating these as the first-round candidates, we were satisfied with
ACM Transactions on Asian Language Information Processing, Vol. 10, No. 2, Article 10, Publication date: June 2011.
Similar Characters in Incorrect Chinese Words 10:15
the weights that we selected. A more practical mechanism to rank these candidatecharacters in the context of words will be introduced in Section 4.4. Due to thatranking mechanism, the resulting performances of different weights will not differsignificantly for the current application, as long as we have chosen a satisfactory setof weights.
When we focus on just finding just visually similar characters, there will be nocontextual information, that is, the words, available to rank the characters. In suchcases, the weights certainly matter. Song et al. [2008] discuss related issues when theybuild a system for Chinese spelling checker. We [Liu et al. 2011] also face a similarproblem when we need software to find characters that find Chinese characters thatcontain specific components.
4. DATA SOURCES AND PRELIMINARY ANALYSES
We provide information about our lexicons, the sources from which we obtained thereported errors in Chinese text, and our analyses of these reported errors in thissection.
4.1 Lexicons
For both traditional and simplified Chinese, we prepare a lexicon that provides infor-mation on the pronunciation and a database that contains the extended Cangjie codesfor the characters. Our programs rely on these databases to generate lists of charactersthat are phonologically and visually similar to a given character.
It is not difficult to acquire lexicons that contain information about standard pro-nunciations for Chinese characters. As we stated in Section 2, the main problem isthat it is not easy to predict how people in different areas in China and Taiwan actu-ally pronounce the characters. In the current study we employ the standards for Man-darin Chinese that are recorded in the lexicons and published by the official agency inTaiwan6. Experimental results reported in Section 5 will show that the ethnic back-ground and mother tones did not influence the performance of our methods very much(at most 1%).
With the procedure reported in Section 3.3, we built databases of extended Cangjiecodes for both the traditional and the simplified Chinese. Our database for the tradi-tional Chinese was designed to contain 5,401 common characters in the BIG5 encodingsystem (between 0xa440 and 0xc67e), which was originally designed for the traditionalChinese. We will call this list of characters TCdict. We converted the traditional Chi-nese characters to their simplified counterparts and built the database of Cangjie codesfor the simplified Chinese. Because two different traditional Chinese characters maybe transformed to a common simplified form, this simplified list contains only 5,170different characters, and we call this list of characters SCdict.
Count from the very first day of the conception of the main ideas, it took us a longtime to develop the current TCdict and SCdict. The original idea was published in Liuand Lin [2008], but we continued to try different ideas since then. With the help ofthe software, that we explained in Section 3.3, to analyze the frequent substrings ofthe original Cangjie codes, two graduate students (the third and the fourth authors)were able to come up with a good version of the extended Cangjie code for the 5,401traditional Chinese characters in a couple of weeks. That initial version was modifiedonce in a while afterward. The modification operations were motivated by results ofsporadic tests we ran with some data (Elist and Jlist, to be explained in Section 4.2), so
6See http://www.cns11643.gov.tw/AIDB/welcome en.do.
ACM Transactions on Asian Language Information Processing, Vol. 10, No. 2, Article 10, Publication date: June 2011.
10:16 C.-L. Liu et al.
we used some new data (Wlist and Blist, also to be explained in Section 4.2) to examinethe performance of our system.
We employed our experience with the traditional Chinese to build the first and onlyversion of the extended Cangjie codes for the simplified Chinese characters in fewweeks. Most of the work was conducted only by the second author. We did not run ex-periments for the simplified Chinese while we are building the extended codes. There-fore, the experimental results that we report in Section 5.6 were not already based onnew data.
4.2 Sources of Incorrect Words and Their Roles in Experiments
We acquired five lists of reported errors in Chinese at different stages of our study.By 2009, we collected two lists of errors for traditional Chinese, and in 2010, weadded two lists of errors for traditional Chinese and a list of errors for simplifiedChinese.
All of these lists contained information about the observed errors. In order tofacilitate our experiments, we saved the reported errors in a simple format. An itemof a reported error contains three parts: the correct word, the correct character thatwill be replaced, and the actual incorrect character. For instance, the correct way towrite a type of banana is “ ” (ba1 jiao1) and sometimes people use “ ” (ba1) for “ ”(ba1). In this case, we will maintain a data item “ , , ” for this error.
At the beginning of our study, we acquired two lists of reported errors for traditionalChinese. The first list was obtained from a book published by the Ministry of Education(MOE) in Taiwan [MOE 1996]. The second list was collected in 2008 from the writtenessays of students of the seventh and the eighth grades in a middle school in Taipei.The errors were entered into computers based on students’ writings, not includingthose characters that did not actually exist and could not be entered. We call the firstlist of errors the Elist, and the second the Jlist. Elist and Jlist contain, respectively,1,490 and 1,718 items of errors.
Two or more different ways to write the same words incorrectly were listed in dif-ferent items and considered as two items. When the same character of a word can bewritten incorrectly in multiple ways, for example, writing “ ” (ying4 fu4) as “ ”(ying4 fu4) or “ ” (ying4 fu4) in Jlist, we considered them different errors. Caseslike these make a program difficult to find the best actual incorrect character, as wewill see in Sections 5.5 and 5.6.
Repeated or semantically related errors were treated as many times as the er-rors were committed by writers. Writing “ ” (bian4 de2 geng4 hao3) as“ ” (bian4 de1 geng4 hao3) and writing “ ” (bian4 de2 geng4 qiang2)as “ ” (bian4 de1 geng4 qiang2) can be considered repeated errors. Writing“ ” as “ ” and writing “ ” (zuo4 de2 bu2 cuo4) as “ ”(zuo4 de1 bu2 cuo4) can be considered related errors in lexical semantics. (These errorswere observed in Jlist.)
These decisions helped us preserve the original distribution of the reported errors.That is, we took the test data as they were and did not try to manipulate or change thereported incorrect Chinese words. However, this also allowed a larger influence of therepeated errors on the reported experiment results.
In order to conduct further experiments, we collected two more lists of errors fortraditional Chinese in 2010. The main reason for obtaining these lists was to use themas extra test data for our Cangjie codes that were improved during 2008 and 2009.Since we had access to both Elist and Jlist while we were improving the extendedCangjie codes for TCList, we thought it would be necessary to have new test data thatwe had never seen before to examine the effectiveness of the improved codes.
ACM Transactions on Asian Language Information Processing, Vol. 10, No. 2, Article 10, Publication date: June 2011.
Similar Characters in Incorrect Chinese Words 10:17
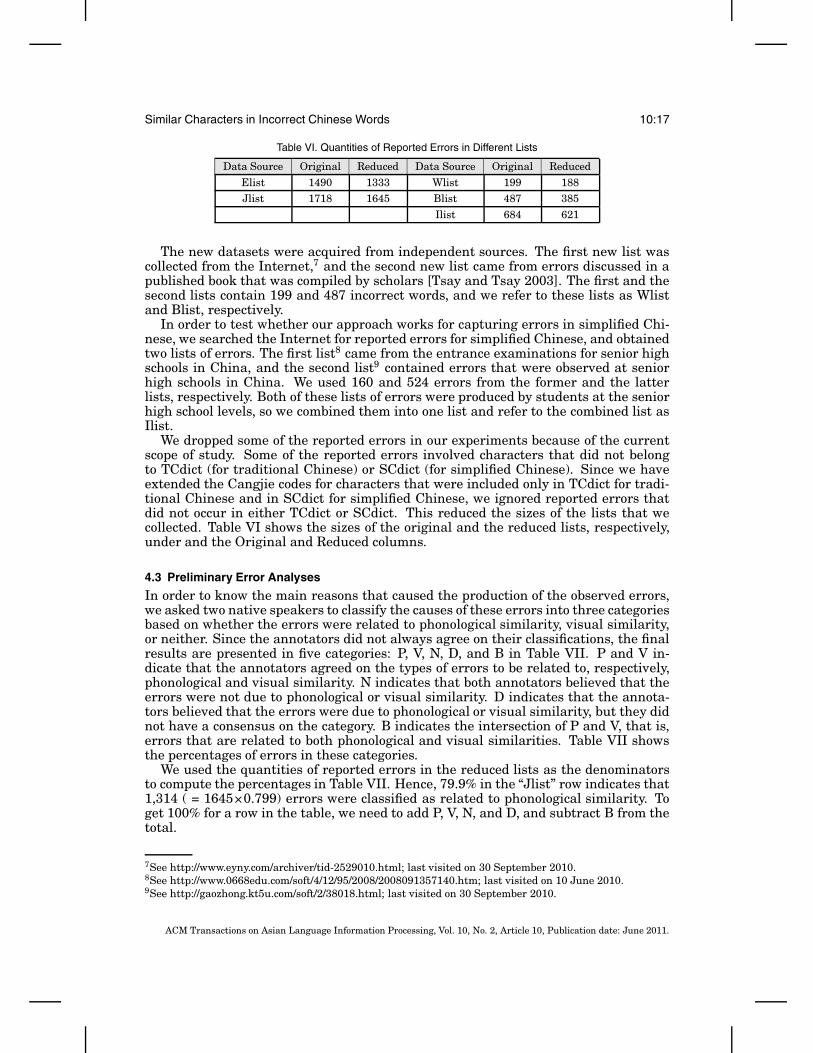
Table VI. Quantities of Reported Errors in Different Lists
Data Source Original Reduced Data Source Original Reduced
Elist 1490 1333 Wlist 199 188Jlist 1718 1645 Blist 487 385
Ilist 684 621
The new datasets were acquired from independent sources. The first new list wascollected from the Internet,7 and the second new list came from errors discussed in apublished book that was compiled by scholars [Tsay and Tsay 2003]. The first and thesecond lists contain 199 and 487 incorrect words, and we refer to these lists as Wlistand Blist, respectively.
In order to test whether our approach works for capturing errors in simplified Chi-nese, we searched the Internet for reported errors for simplified Chinese, and obtainedtwo lists of errors. The first list8 came from the entrance examinations for senior highschools in China, and the second list9 contained errors that were observed at seniorhigh schools in China. We used 160 and 524 errors from the former and the latterlists, respectively. Both of these lists of errors were produced by students at the seniorhigh school levels, so we combined them into one list and refer to the combined list asIlist.
We dropped some of the reported errors in our experiments because of the currentscope of study. Some of the reported errors involved characters that did not belongto TCdict (for traditional Chinese) or SCdict (for simplified Chinese). Since we haveextended the Cangjie codes for characters that were included only in TCdict for tradi-tional Chinese and in SCdict for simplified Chinese, we ignored reported errors thatdid not occur in either TCdict or SCdict. This reduced the sizes of the lists that wecollected. Table VI shows the sizes of the original and the reduced lists, respectively,under and the Original and Reduced columns.
4.3 Preliminary Error Analyses
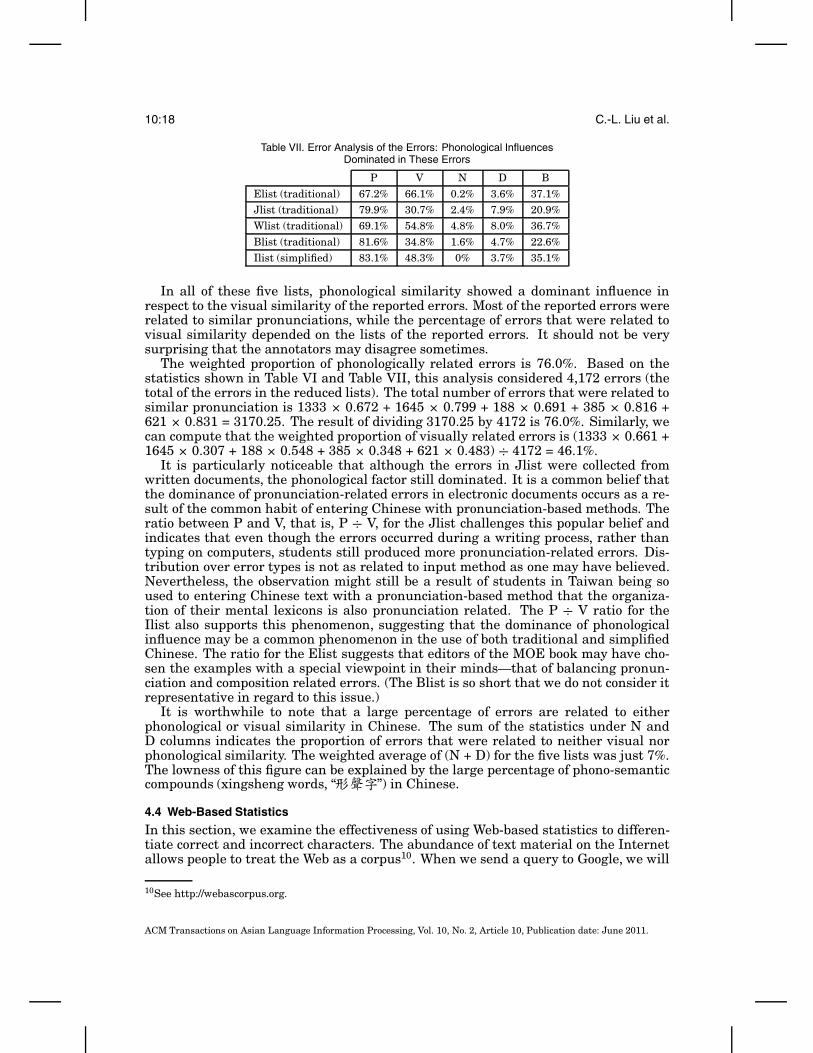
In order to know the main reasons that caused the production of the observed errors,we asked two native speakers to classify the causes of these errors into three categoriesbased on whether the errors were related to phonological similarity, visual similarity,or neither. Since the annotators did not always agree on their classifications, the finalresults are presented in five categories: P, V, N, D, and B in Table VII. P and V in-dicate that the annotators agreed on the types of errors to be related to, respectively,phonological and visual similarity. N indicates that both annotators believed that theerrors were not due to phonological or visual similarity. D indicates that the annota-tors believed that the errors were due to phonological or visual similarity, but they didnot have a consensus on the category. B indicates the intersection of P and V, that is,errors that are related to both phonological and visual similarities. Table VII showsthe percentages of errors in these categories.
We used the quantities of reported errors in the reduced lists as the denominatorsto compute the percentages in Table VII. Hence, 79.9% in the “Jlist” row indicates that1,314 ( = 1645×0.799) errors were classified as related to phonological similarity. Toget 100% for a row in the table, we need to add P, V, N, and D, and subtract B from thetotal.
7See http://www.eyny.com/archiver/tid-2529010.html; last visited on 30 September 2010.8See http://www.0668edu.com/soft/4/12/95/2008/2008091357140.htm; last visited on 10 June 2010.9See http://gaozhong.kt5u.com/soft/2/38018.html; last visited on 30 September 2010.
ACM Transactions on Asian Language Information Processing, Vol. 10, No. 2, Article 10, Publication date: June 2011.
10:18 C.-L. Liu et al.
Table VII. Error Analysis of the Errors: Phonological InfluencesDominated in These Errors
P V N D B
Elist (traditional) 67.2% 66.1% 0.2% 3.6% 37.1%Jlist (traditional) 79.9% 30.7% 2.4% 7.9% 20.9%Wlist (traditional) 69.1% 54.8% 4.8% 8.0% 36.7%
Blist (traditional) 81.6% 34.8% 1.6% 4.7% 22.6%Ilist (simplified) 83.1% 48.3% 0% 3.7% 35.1%
In all of these five lists, phonological similarity showed a dominant influence inrespect to the visual similarity of the reported errors. Most of the reported errors wererelated to similar pronunciations, while the percentage of errors that were related tovisual similarity depended on the lists of the reported errors. It should not be verysurprising that the annotators may disagree sometimes.
The weighted proportion of phonologically related errors is 76.0%. Based on thestatistics shown in Table VI and Table VII, this analysis considered 4,172 errors (thetotal of the errors in the reduced lists). The total number of errors that were related tosimilar pronunciation is 1333 × 0.672 + 1645 × 0.799 + 188 × 0.691 + 385 × 0.816 +621 × 0.831 = 3170.25. The result of dividing 3170.25 by 4172 is 76.0%. Similarly, wecan compute that the weighted proportion of visually related errors is (1333 × 0.661 +1645 × 0.307 + 188 × 0.548 + 385 × 0.348 + 621 × 0.483) ÷ 4172 = 46.1%.
It is particularly noticeable that although the errors in Jlist were collected fromwritten documents, the phonological factor still dominated. It is a common belief thatthe dominance of pronunciation-related errors in electronic documents occurs as a re-sult of the common habit of entering Chinese with pronunciation-based methods. Theratio between P and V, that is, P ÷ V, for the Jlist challenges this popular belief andindicates that even though the errors occurred during a writing process, rather thantyping on computers, students still produced more pronunciation-related errors. Dis-tribution over error types is not as related to input method as one may have believed.Nevertheless, the observation might still be a result of students in Taiwan being soused to entering Chinese text with a pronunciation-based method that the organiza-tion of their mental lexicons is also pronunciation related. The P ÷ V ratio for theIlist also supports this phenomenon, suggesting that the dominance of phonologicalinfluence may be a common phenomenon in the use of both traditional and simplifiedChinese. The ratio for the Elist suggests that editors of the MOE book may have cho-sen the examples with a special viewpoint in their minds—that of balancing pronun-ciation and composition related errors. (The Blist is so short that we do not consider itrepresentative in regard to this issue.)
It is worthwhile to note that a large percentage of errors are related to eitherphonological or visual similarity in Chinese. The sum of the statistics under N andD columns indicates the proportion of errors that were related to neither visual norphonological similarity. The weighted average of (N + D) for the five lists was just 7%.The lowness of this figure can be explained by the large percentage of phono-semanticcompounds (xingsheng words, “ ”) in Chinese.
4.4 Web-Based Statistics
In this section, we examine the effectiveness of using Web-based statistics to differen-tiate correct and incorrect characters. The abundance of text material on the Internetallows people to treat the Web as a corpus10. When we send a query to Google, we will
10See http://webascorpus.org.
ACM Transactions on Asian Language Information Processing, Vol. 10, No. 2, Article 10, Publication date: June 2011.
Similar Characters in Incorrect Chinese Words 10:19
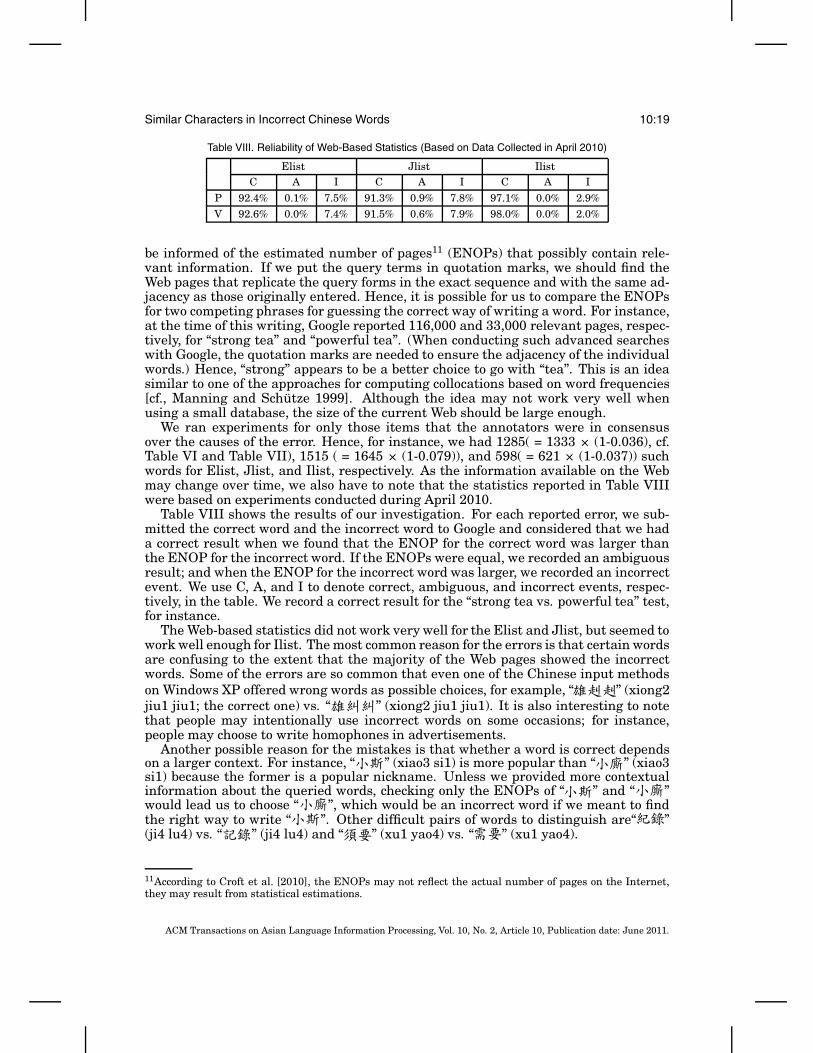
Table VIII. Reliability of Web-Based Statistics (Based on Data Collected in April 2010)
Elist Jlist IlistC A I C A I C A I
P 92.4% 0.1% 7.5% 91.3% 0.9% 7.8% 97.1% 0.0% 2.9%V 92.6% 0.0% 7.4% 91.5% 0.6% 7.9% 98.0% 0.0% 2.0%
be informed of the estimated number of pages11 (ENOPs) that possibly contain rele-vant information. If we put the query terms in quotation marks, we should find theWeb pages that replicate the query forms in the exact sequence and with the same ad-jacency as those originally entered. Hence, it is possible for us to compare the ENOPsfor two competing phrases for guessing the correct way of writing a word. For instance,at the time of this writing, Google reported 116,000 and 33,000 relevant pages, respec-tively, for “strong tea” and “powerful tea”. (When conducting such advanced searcheswith Google, the quotation marks are needed to ensure the adjacency of the individualwords.) Hence, “strong” appears to be a better choice to go with “tea”. This is an ideasimilar to one of the approaches for computing collocations based on word frequencies[cf., Manning and Schutze 1999]. Although the idea may not work very well whenusing a small database, the size of the current Web should be large enough.
We ran experiments for only those items that the annotators were in consensusover the causes of the error. Hence, for instance, we had 1285( = 1333 × (1-0.036), cf.Table VI and Table VII), 1515 ( = 1645 × (1-0.079)), and 598( = 621 × (1-0.037)) suchwords for Elist, Jlist, and Ilist, respectively. As the information available on the Webmay change over time, we also have to note that the statistics reported in Table VIIIwere based on experiments conducted during April 2010.
Table VIII shows the results of our investigation. For each reported error, we sub-mitted the correct word and the incorrect word to Google and considered that we hada correct result when we found that the ENOP for the correct word was larger thanthe ENOP for the incorrect word. If the ENOPs were equal, we recorded an ambiguousresult; and when the ENOP for the incorrect word was larger, we recorded an incorrectevent. We use C, A, and I to denote correct, ambiguous, and incorrect events, respec-tively, in the table. We record a correct result for the “strong tea vs. powerful tea” test,for instance.
The Web-based statistics did not work very well for the Elist and Jlist, but seemed towork well enough for Ilist. The most common reason for the errors is that certain wordsare confusing to the extent that the majority of the Web pages showed the incorrectwords. Some of the errors are so common that even one of the Chinese input methodson Windows XP offered wrong words as possible choices, for example, “ ” (xiong2jiu1 jiu1; the correct one) vs. “ ” (xiong2 jiu1 jiu1). It is also interesting to notethat people may intentionally use incorrect words on some occasions; for instance,people may choose to write homophones in advertisements.
Another possible reason for the mistakes is that whether a word is correct dependson a larger context. For instance, “ ” (xiao3 si1) is more popular than “ ” (xiao3si1) because the former is a popular nickname. Unless we provided more contextualinformation about the queried words, checking only the ENOPs of “ ” and “ ”would lead us to choose “ ”, which would be an incorrect word if we meant to findthe right way to write “ ”. Other difficult pairs of words to distinguish are“ ”(ji4 lu4) vs. “ ” (ji4 lu4) and “ ” (xu1 yao4) vs. “ ” (xu1 yao4).
11According to Croft et al. [2010], the ENOPs may not reflect the actual number of pages on the Internet,they may result from statistical estimations.
ACM Transactions on Asian Language Information Processing, Vol. 10, No. 2, Article 10, Publication date: June 2011.
10:20 C.-L. Liu et al.
Yet another reason for having a large ENOP for the incorrect words was due toerrors in segmenting Chinese character strings (cf., Ma and Chen [2003]). Considera correct character string “WXYZ”. It is possible that “XY” happens to be an incorrectway to write a correct word. This is the case for having the counts for “ ”(hua1 hai3 bin1 fen1) to contribute to the count for “ ”, which is an incorrect formof “ ” (hai3 bin1).
A reason why the Web-based statistics worked for Ilist is that all of the correctwords in Ilist contained four characters. None of the factors that we list above forexplaining the errors that we observed from Elist and Ilist may reasonably apply in thecase of four-character strings. Hence, Web-based statistics worked almost perfectly forIlist.
We compared the statistics reported in Table VIII and our reports in Liu et al.[2009c] and found that the effectiveness for Elist and Jlist improved greatly. To under-stand this phenomenon, we examined the records of our experimental results. Let xand y be the ENOPs of the correct and incorrect words, respectively. When we reportedcases in which our systems failed to identify the correct character, that is, the I cases,in 2009, many of the ratios of y against x were within approximately 5%. Namely, wehad (y/x) ≤ 1.05in many cases, indicating that the margins were very small in 2009.The differences between the ENOPs may have changed between 2009 and 2010, somaking us to achieve the better performance reported in Table VIII.
The improvement shows that the reliability of the Web-based statistics may be im-proving as the correct usage of words increase. This also shows that our approachmight not work very well if the majority of Web-page authors do not use the charac-ters in standard ways. To avoid the problem of using only the raw values of ENOPsto judge the correctness of words, we will introduce an alternative method in the nextsection.
5. EXPERIMENTAL EVALUATION
We evaluate the effectiveness of using the phonologically and visually similar charac-ters to capture errors in Chinese words in this section.
In Section 5.1, we provide details about the procedures for the experiments, and,in Section 5.2, we explain the definitions of inclusion rates that we used to evaluatethe basic performance of our systems. In Section 5.3, we offer a comparison of thestatistics about our experiments that were conducted in 2009 and 2010, in order togather information about the reliability of Web-based statistics, which is crucial forthe success and applicability of our systems in the long run. In Section 5.4, we reportthe inclusion rates of our systems on the five sources of test data. The experiments alsoshow the robustness of our methods and data for processing test data that were notreported in previous conference articles. In Sections 5.5 through 5.7, we deepen andwiden our investigation of the effectiveness of our systems by applying an alternativemethod to rank the candidate characters and by recommending a limited number ofcandidates characters based on two ranking mechanisms.
5.1 Experimental Procedure
We designed and employed the ICCEval procedure for the evaluation task. We neededtwo types of data for the experiments. The information about the pronunciation andstructures of the Chinese characters (Section 4.1) helped us generate lists of similarcharacters. We also needed reported errors (Section 4.2) so that we could evaluatewhether the similar characters catch the reported errors.
At step 1, we created a list of characters based on the selection criterion, given thecorrect word and the correct character to be replaced. We may choose to evaluate the
ACM Transactions on Asian Language Information Processing, Vol. 10, No. 2, Article 10, Publication date: June 2011.

Similar Characters in Incorrect Chinese Words 10:21
Procedure ICCEvalInput:A test item that includes the following information:(Section 4.2)
cwd: the correct word,ccr: the correct character,aic: the actual incorrect character;
crit: the selection criterion;num: number of requested characters;rnk: the criterion to rank the incorrect words;Output: a list of ranked candidates for ccrSteps:1. Select a candidate list, L, of characters, from TCdict or SCdict,
for ccr with the specified criterion, crit. When using SC1, SC2, orSC3 to select visually similar characters, at most num characters willbe selected.
2. Check whether aic belongs to L (the inclusion test). if yes,continue; else, return nil.
3. For each x in L, replace ccr in cwd with x, submit the resulting xand incorrect word to Google, and record the ENOPs for x andthe incorrect word.
4. Rank the characters in L with the criterion specified by rnk.5. Return the ranked list.
effectiveness of phonologically or visually similar characters. For a given correct char-acter, ICCEval can generate characters that are in the SS, SD, MS, and MD categoriesfor phonologically similar characters (Section 2). For visually similar characters, IC-CEval can select characters based on different score functions, i.e., SC1, SC2, and SC3(Section 3.4). In addition, ICCEval can generate a list of characters that belong to thesame radical and have the same number of strokes with the correct character. In theexperimental results, we refer to this type of similar characters as RS.
At step 2, we checked whether the selected list of characters indeed contained theactual incorrect character.
At step 3, for a correct word that people should write, we replaced the correct char-acter with a character from the candidate list that was generated at step 1, submittedthe incorrect word to Google AJAX Search API (or directly to the Google interface12,and extracted the ENOP of pages that contained the incorrect words. In an ordinaryinteraction with Google, an ENOP can be retrieved from the search results, and ittypically follows the string “Results 1-10 of about” in the browser window. Using theGoogle AJAX Search API, we have only to parse the returned results using a simplemethod.
Larger ENOPs for incorrect words suggest that these words are incorrect wordsthat people frequently used on their Web pages. Hence, we could rank the similarcharacters based on their ENOPs at step 4 and return the list.
Since the reported errors contained information about the actual incorrect waysto write the correct words (Section 4.2), we could check whether the actual incorrectcharacters were among the similar characters that our programs generated at step 2(inclusion tests). We could also check whether the actual incorrect characters wereranked higher in the ranked lists (ranking tests).
Take the word “ ” (he2 ai3 ke3 qin1) as an example. In the collected data, itwas reported that people wrote this word as “ ” (he2 ai3 ke3 qin1), that is, thesecond character was incorrect. Hence the test item (correct word, correct character,actual incorrect character) is (“ ”, “ ”, “ ”). Hoping to capture the error,ICCEval generated a list of possible substitutions for “ ” at step 1. Depending on the
12See http://www.google.com.
ACM Transactions on Asian Language Information Processing, Vol. 10, No. 2, Article 10, Publication date: June 2011.
10:22 C.-L. Liu et al.
categories of sources of errors, ICCEval generated a list of characters. When aimingto test the effectiveness of visually similar characters, we could ask ICCEval to applySC3 to selected a list of alternatives for “ ” from SCdict, and the results may include“ ” (ai3), “ ” (ye4), “ ” (ge3), and other candidates. At step 2, we found that theactual incorrect character was included in the candidate list. At step 3, we createdand submitted the query strings “ ”, “ ”, and “ ” to obtain theENOPs for the candidates. If the ENOPs were, respectively, 571,000, 445,000, and8,580, these candidates would be returned in the order of “ ”, “ ”, and “ ”. As aresult, the returned list contained the actual incorrect character “ ”, and placed “ ”at the top of the ranked list.
Notice that we considered the contexts in which the incorrect characters appearedto rank the candidate characters. We did not rank the incorrect characters with theunigrams such as “ ”, “ ”, and “ ” alone. Instead, the candidates were ranked withthe ENOPs of “ ”, “ ”, and “ ”.
In addition, although this running example shows that we ranked the characters di-rectly with the ENOPs, we also tried to rank the list of alternatives with the pointwisemutual information [PMI; cf., Jurafsky and Martin 2009]:
PMI (C, X ) =Pr(C ∧ X )
Pr(C) × Pr(X ), (2)
where X is the candidate character to replace the correct character and C is the correctword excluding the correct character to be replaced. To compute the score for thereplacement of “ ” with “ ” in “ ”, X = “ ”, C=“ ”, and (C ∧ X ) is“ ”. (� denotes a character to be replaced.) We chose to try the frequency-based method and PMI-based method because both are used to compute the strengthof collocation in natural language processing [Manning and Schutze 1999].
It would demand a considerable amount of computation effort to find Pr(C) in gen-eral, if this is a required task. Fortunately, we do not have to consider the effect ofPr(C) because it is a common denominator for all possible incorrect characters for agiven incorrect word. Let X1 and X2 be two competing incorrect characters for thecorrect character. We can ignore Pr(C) because of the following relationship.
PMI (C, X1) ≥ PMI (C, X2) ⇔ Pr(C ∧ X1)Pr(X1)
≥ Pr(C ∧ X2)Pr(X2)
(3)
Hence, X1 prevails if score (C, X1) is larger, where score (C, X ) for anyX is listed inEquation (4).
score (C, X ) =Pr(C ∧ X )
Pr(X )(4)
In our work, we approximate the probabilities used in Equation (4) by the correspond-ing frequencies. Namely, we replace Pr(C ∧ X ) with the Web-based counts for (C ∧ X ),for example, “ ”; and substitute Pr(X ) with the Web-based counts for X , forexample, “ ”. The counts were obtained with exactly the same mechanism that weused to obtain the ENOPs that we explained at the beginning of this section.
5.2 Performance Measures
Recall that we used only those errors for which the annotators had reached consensuson the causes of the errors. The errors that involved characters that were not in TCdictand not SCdict were not considered in the current study either.
Given the errors in the lists in Table VI, we ran ICCEval, and measured the perfor-mance in two ways. First, we would like to have the candidate list (step 1 in ICCEval)
ACM Transactions on Asian Language Information Processing, Vol. 10, No. 2, Article 10, Publication date: June 2011.
Similar Characters in Incorrect Chinese Words 10:23
include the actual incorrect character in the inclusion test. Second, we would preferthat the actual incorrect character be placed at the top of the ranked list (step 4 inICCEval).
Assume that there weren items of errors in a given list and that the candidate listsfor these n errors contained m of thenactual incorrect character. Then, we compute theinclusion rates in the following manner.
inclusion rate =mn
(5)
In order to compare whether it is easier to capture either the phonologicallysimilar or the visually similar errors, we separate the test instances according tothe annotators’ consensuses. Hence, we will provide separate inclusion rates for twotypes of error. When reporting the inclusion rates for phonologically similar errors,we use the number of phonologically-similar errors in place of n, and when reportingthe inclusion rates for visually-similar errors, we use the number of visually-similarerrors in place of n.
The inclusion rates are similar to the recall rates that are commonly-used in thefield of information retrieval (e.g., Croft et al. [2010]). Yet, they are different. The recallrates measure how well a search engine retrieves the correct answers for a query. Inour experiments, each test has only one answer, that is, the actual incorrect character.Hence, we measure the probability whereby we would capture the actual incorrectcharacter across the reported errors.
In addition, we prefer to put the actual incorrect character higher in the ranked list.Hence, we analyzed the accumulative inclusion rates of the top k characters in the can-didate list. Assume that there weren items of errors in a given list. Also assume thatICCEval placed the actual incorrect characters at the jth position tj times in the nexperiments, where the first position is the best position. The ratio (tj÷n) is the proba-bility that the actual incorrect character was ranked at the jth position in an individualtest. Then, we compute the accumulative inclusion rate (AIR) in the following way.
Rk =
∑kj=1 tj
n(6)
If ICCEval returns the candidate list completely, then it will achieve the inclusionrate. If ICCEval returns only the top k candidates, it will achieve the accumulativeinclusion rates, which are upper-bounded by the inclusion rate.
5.3 Temporal Comparison
In April 2010, we repeated the experiments that we conducted in March 2009. Themain purpose was to inspect whether we would achieve performance of similar qualitywith Web-based statistics in 2009 and 2010. The experiments had two goals: (1) tohave the candidate lists (step 1 in ICCEval) include the incorrect characters in thereported errors, and (2) to put the actual incorrect characters at top of the rankedresults (step 4). We used Elist and Jlist in the experiments.
Because we kept the lists of candidate characters that we generated at step 1 in IC-CEval in 2009, we were able to resubmit the incorrect words at step 3 and collected theENOPs to rank the incorrect characters in 2010. In 2009, we submitted our queriesdirectly through the Google interface13 and we repeated the same procedure in theexperiments in 2010 again. (Submitting a large amount of queries directly to the stan-dard Google interface resulted in Google considering our programs to be a malicious
13See http://www.google.com.
ACM Transactions on Asian Language Information Processing, Vol. 10, No. 2, Article 10, Publication date: June 2011.
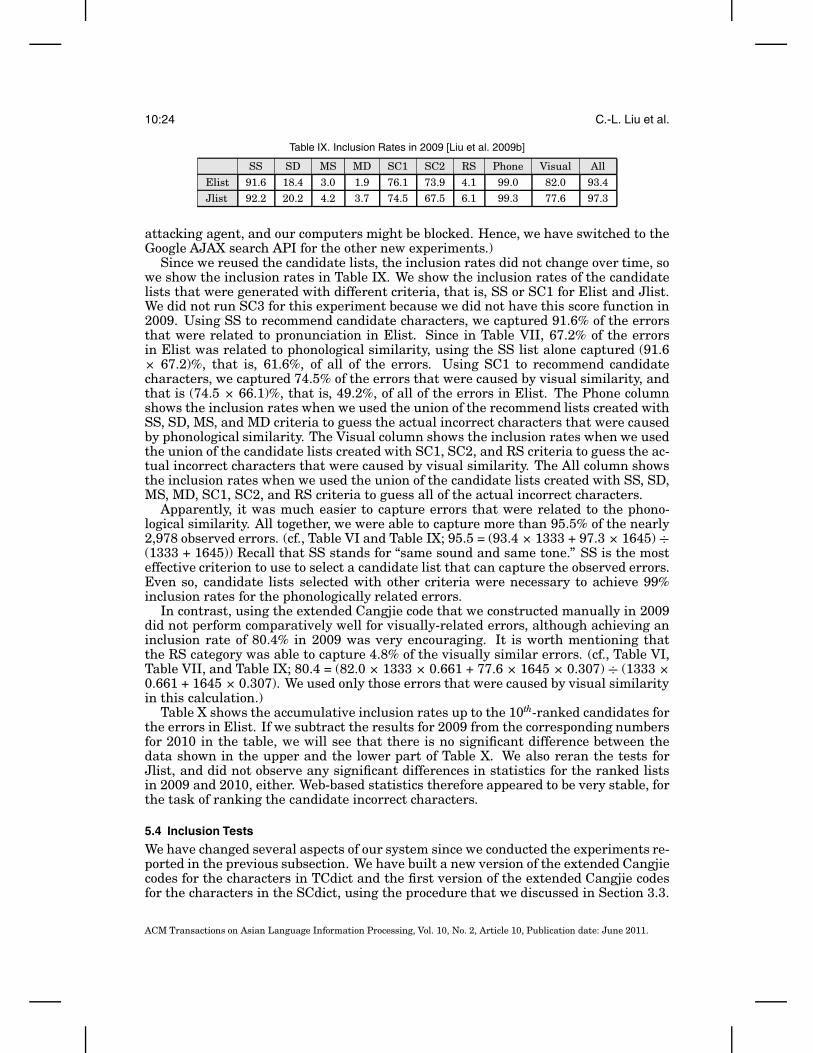
10:24 C.-L. Liu et al.
Table IX. Inclusion Rates in 2009 [Liu et al. 2009b]
SS SD MS MD SC1 SC2 RS Phone Visual All
Elist 91.6 18.4 3.0 1.9 76.1 73.9 4.1 99.0 82.0 93.4Jlist 92.2 20.2 4.2 3.7 74.5 67.5 6.1 99.3 77.6 97.3
attacking agent, and our computers might be blocked. Hence, we have switched to theGoogle AJAX search API for the other new experiments.)
Since we reused the candidate lists, the inclusion rates did not change over time, sowe show the inclusion rates in Table IX. We show the inclusion rates of the candidatelists that were generated with different criteria, that is, SS or SC1 for Elist and Jlist.We did not run SC3 for this experiment because we did not have this score function in2009. Using SS to recommend candidate characters, we captured 91.6% of the errorsthat were related to pronunciation in Elist. Since in Table VII, 67.2% of the errorsin Elist was related to phonological similarity, using the SS list alone captured (91.6× 67.2)%, that is, 61.6%, of all of the errors. Using SC1 to recommend candidatecharacters, we captured 74.5% of the errors that were caused by visual similarity, andthat is (74.5 × 66.1)%, that is, 49.2%, of all of the errors in Elist. The Phone columnshows the inclusion rates when we used the union of the recommend lists created withSS, SD, MS, and MD criteria to guess the actual incorrect characters that were causedby phonological similarity. The Visual column shows the inclusion rates when we usedthe union of the candidate lists created with SC1, SC2, and RS criteria to guess the ac-tual incorrect characters that were caused by visual similarity. The All column showsthe inclusion rates when we used the union of the candidate lists created with SS, SD,MS, MD, SC1, SC2, and RS criteria to guess all of the actual incorrect characters.
Apparently, it was much easier to capture errors that were related to the phono-logical similarity. All together, we were able to capture more than 95.5% of the nearly2,978 observed errors. (cf., Table VI and Table IX; 95.5 = (93.4 × 1333 + 97.3 × 1645) ÷(1333 + 1645)) Recall that SS stands for “same sound and same tone.” SS is the mosteffective criterion to use to select a candidate list that can capture the observed errors.Even so, candidate lists selected with other criteria were necessary to achieve 99%inclusion rates for the phonologically related errors.
In contrast, using the extended Cangjie code that we constructed manually in 2009did not perform comparatively well for visually-related errors, although achieving aninclusion rate of 80.4% in 2009 was very encouraging. It is worth mentioning thatthe RS category was able to capture 4.8% of the visually similar errors. (cf., Table VI,Table VII, and Table IX; 80.4 = (82.0 × 1333 × 0.661 + 77.6 × 1645 × 0.307) ÷ (1333 ×0.661 + 1645 × 0.307). We used only those errors that were caused by visual similarityin this calculation.)
Table X shows the accumulative inclusion rates up to the 10th-ranked candidates forthe errors in Elist. If we subtract the results for 2009 from the corresponding numbersfor 2010 in the table, we will see that there is no significant difference between thedata shown in the upper and the lower part of Table X. We also reran the tests forJlist, and did not observe any significant differences in statistics for the ranked listsin 2009 and 2010, either. Web-based statistics therefore appeared to be very stable, forthe task of ranking the candidate incorrect characters.
5.4 Inclusion Tests
We have changed several aspects of our system since we conducted the experiments re-ported in the previous subsection. We have built a new version of the extended Cangjiecodes for the characters in TCdict and the first version of the extended Cangjie codesfor the characters in the SCdict, using the procedure that we discussed in Section 3.3.
ACM Transactions on Asian Language Information Processing, Vol. 10, No. 2, Article 10, Publication date: June 2011.
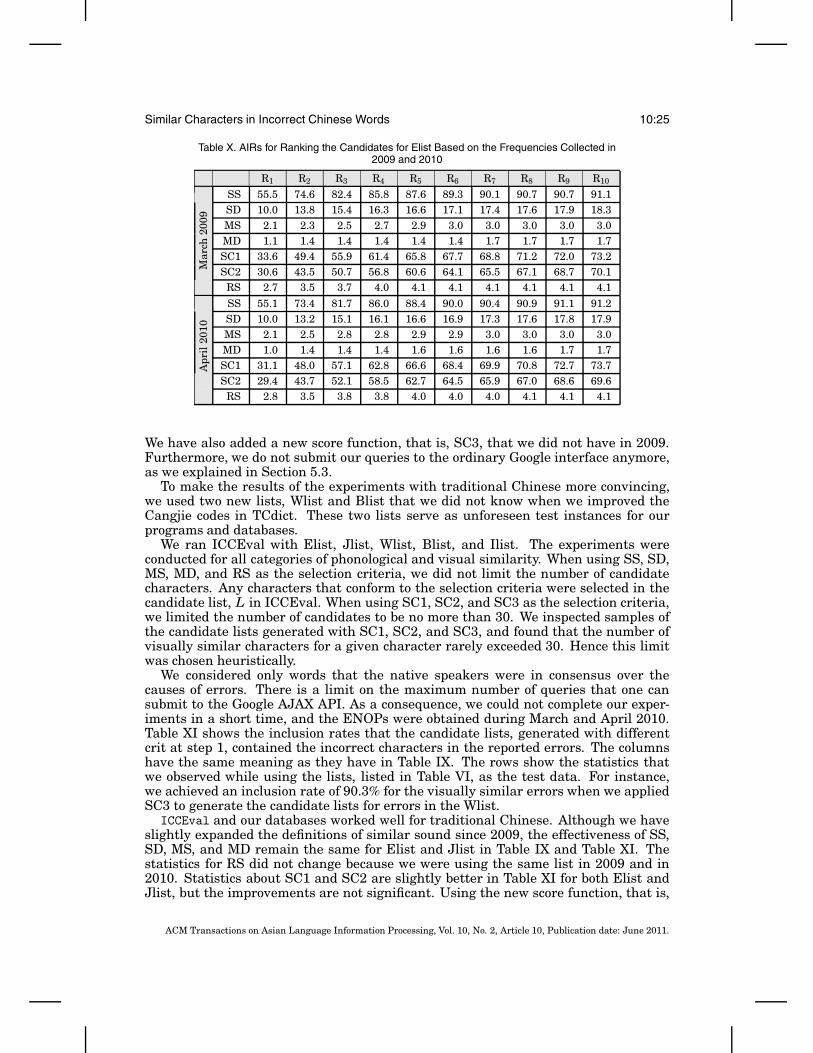
Similar Characters in Incorrect Chinese Words 10:25
Table X. AIRs for Ranking the Candidates for Elist Based on the Frequencies Collected in2009 and 2010
R1 R2 R3 R4 R5 R6 R7 R8 R9 R10
FM
arch
2009
FF SS 55.5 74.6 82.4 85.8 87.6 89.3 90.1 90.7 90.7 91.1
SD 10.0 13.8 15.4 16.3 16.6 17.1 17.4 17.6 17.9 18.3MS 2.1 2.3 2.5 2.7 2.9 3.0 3.0 3.0 3.0 3.0MD 1.1 1.4 1.4 1.4 1.4 1.4 1.7 1.7 1.7 1.7SC1 33.6 49.4 55.9 61.4 65.8 67.7 68.8 71.2 72.0 73.2SC2 30.6 43.5 50.7 56.8 60.6 64.1 65.5 67.1 68.7 70.1
RS 2.7 3.5 3.7 4.0 4.1 4.1 4.1 4.1 4.1 4.1
FA
pril
2010
F
SS 55.1 73.4 81.7 86.0 88.4 90.0 90.4 90.9 91.1 91.2SD 10.0 13.2 15.1 16.1 16.6 16.9 17.3 17.6 17.8 17.9MS 2.1 2.5 2.8 2.8 2.9 2.9 3.0 3.0 3.0 3.0MD 1.0 1.4 1.4 1.4 1.6 1.6 1.6 1.6 1.7 1.7SC1 31.1 48.0 57.1 62.8 66.6 68.4 69.9 70.8 72.7 73.7SC2 29.4 43.7 52.1 58.5 62.7 64.5 65.9 67.0 68.6 69.6
RS 2.8 3.5 3.8 3.8 4.0 4.0 4.0 4.1 4.1 4.1
We have also added a new score function, that is, SC3, that we did not have in 2009.Furthermore, we do not submit our queries to the ordinary Google interface anymore,as we explained in Section 5.3.
To make the results of the experiments with traditional Chinese more convincing,we used two new lists, Wlist and Blist that we did not know when we improved theCangjie codes in TCdict. These two lists serve as unforeseen test instances for ourprograms and databases.
We ran ICCEval with Elist, Jlist, Wlist, Blist, and Ilist. The experiments wereconducted for all categories of phonological and visual similarity. When using SS, SD,MS, MD, and RS as the selection criteria, we did not limit the number of candidatecharacters. Any characters that conform to the selection criteria were selected in thecandidate list, L in ICCEval. When using SC1, SC2, and SC3 as the selection criteria,we limited the number of candidates to be no more than 30. We inspected samples ofthe candidate lists generated with SC1, SC2, and SC3, and found that the number ofvisually similar characters for a given character rarely exceeded 30. Hence this limitwas chosen heuristically.
We considered only words that the native speakers were in consensus over thecauses of errors. There is a limit on the maximum number of queries that one cansubmit to the Google AJAX API. As a consequence, we could not complete our exper-iments in a short time, and the ENOPs were obtained during March and April 2010.Table XI shows the inclusion rates that the candidate lists, generated with differentcrit at step 1, contained the incorrect characters in the reported errors. The columnshave the same meaning as they have in Table IX. The rows show the statistics thatwe observed while using the lists, listed in Table VI, as the test data. For instance,we achieved an inclusion rate of 90.3% for the visually similar errors when we appliedSC3 to generate the candidate lists for errors in the Wlist.
ICCEval and our databases worked well for traditional Chinese. Although we haveslightly expanded the definitions of similar sound since 2009, the effectiveness of SS,SD, MS, and MD remain the same for Elist and Jlist in Table IX and Table XI. Thestatistics for RS did not change because we were using the same list in 2009 and in2010. Statistics about SC1 and SC2 are slightly better in Table XI for both Elist andJlist, but the improvements are not significant. Using the new score function, that is,
ACM Transactions on Asian Language Information Processing, Vol. 10, No. 2, Article 10, Publication date: June 2011.
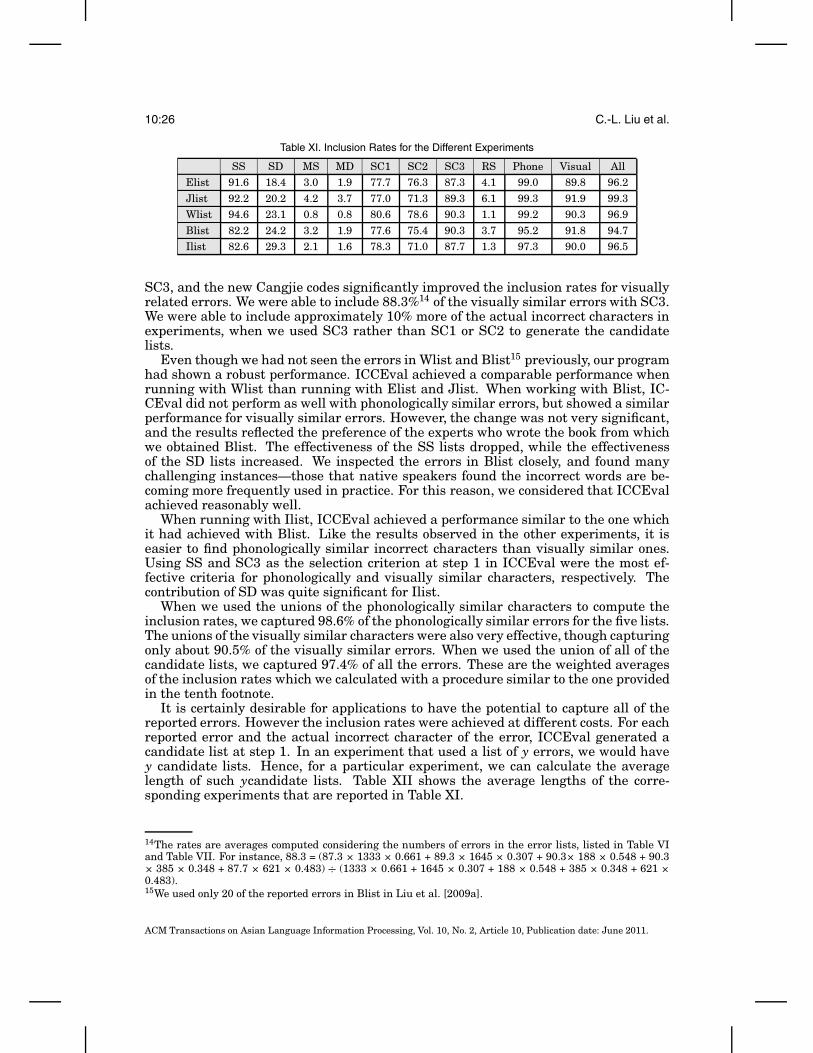
10:26 C.-L. Liu et al.
Table XI. Inclusion Rates for the Different Experiments
SS SD MS MD SC1 SC2 SC3 RS Phone Visual AllElist 91.6 18.4 3.0 1.9 77.7 76.3 87.3 4.1 99.0 89.8 96.2
Jlist 92.2 20.2 4.2 3.7 77.0 71.3 89.3 6.1 99.3 91.9 99.3Wlist 94.6 23.1 0.8 0.8 80.6 78.6 90.3 1.1 99.2 90.3 96.9
Blist 82.2 24.2 3.2 1.9 77.6 75.4 90.3 3.7 95.2 91.8 94.7Ilist 82.6 29.3 2.1 1.6 78.3 71.0 87.7 1.3 97.3 90.0 96.5
SC3, and the new Cangjie codes significantly improved the inclusion rates for visuallyrelated errors. We were able to include 88.3%14 of the visually similar errors with SC3.We were able to include approximately 10% more of the actual incorrect characters inexperiments, when we used SC3 rather than SC1 or SC2 to generate the candidatelists.
Even though we had not seen the errors in Wlist and Blist15 previously, our programhad shown a robust performance. ICCEval achieved a comparable performance whenrunning with Wlist than running with Elist and Jlist. When working with Blist, IC-CEval did not perform as well with phonologically similar errors, but showed a similarperformance for visually similar errors. However, the change was not very significant,and the results reflected the preference of the experts who wrote the book from whichwe obtained Blist. The effectiveness of the SS lists dropped, while the effectivenessof the SD lists increased. We inspected the errors in Blist closely, and found manychallenging instances—those that native speakers found the incorrect words are be-coming more frequently used in practice. For this reason, we considered that ICCEvalachieved reasonably well.
When running with Ilist, ICCEval achieved a performance similar to the one whichit had achieved with Blist. Like the results observed in the other experiments, it iseasier to find phonologically similar incorrect characters than visually similar ones.Using SS and SC3 as the selection criterion at step 1 in ICCEval were the most ef-fective criteria for phonologically and visually similar characters, respectively. Thecontribution of SD was quite significant for Ilist.
When we used the unions of the phonologically similar characters to compute theinclusion rates, we captured 98.6% of the phonologically similar errors for the five lists.The unions of the visually similar characters were also very effective, though capturingonly about 90.5% of the visually similar errors. When we used the union of all of thecandidate lists, we captured 97.4% of all the errors. These are the weighted averagesof the inclusion rates which we calculated with a procedure similar to the one providedin the tenth footnote.
It is certainly desirable for applications to have the potential to capture all of thereported errors. However the inclusion rates were achieved at different costs. For eachreported error and the actual incorrect character of the error, ICCEval generated acandidate list at step 1. In an experiment that used a list of y errors, we would havey candidate lists. Hence, for a particular experiment, we can calculate the averagelength of such ycandidate lists. Table XII shows the average lengths of the corre-sponding experiments that are reported in Table XI.
14The rates are averages computed considering the numbers of errors in the error lists, listed in Table VIand Table VII. For instance, 88.3 = (87.3 × 1333 × 0.661 + 89.3 × 1645 × 0.307 + 90.3× 188 × 0.548 + 90.3× 385 × 0.348 + 87.7 × 621 × 0.483) ÷ (1333 × 0.661 + 1645 × 0.307 + 188 × 0.548 + 385 × 0.348 + 621 ×0.483).15We used only 20 of the reported errors in Blist in Liu et al. [2009a].
ACM Transactions on Asian Language Information Processing, Vol. 10, No. 2, Article 10, Publication date: June 2011.
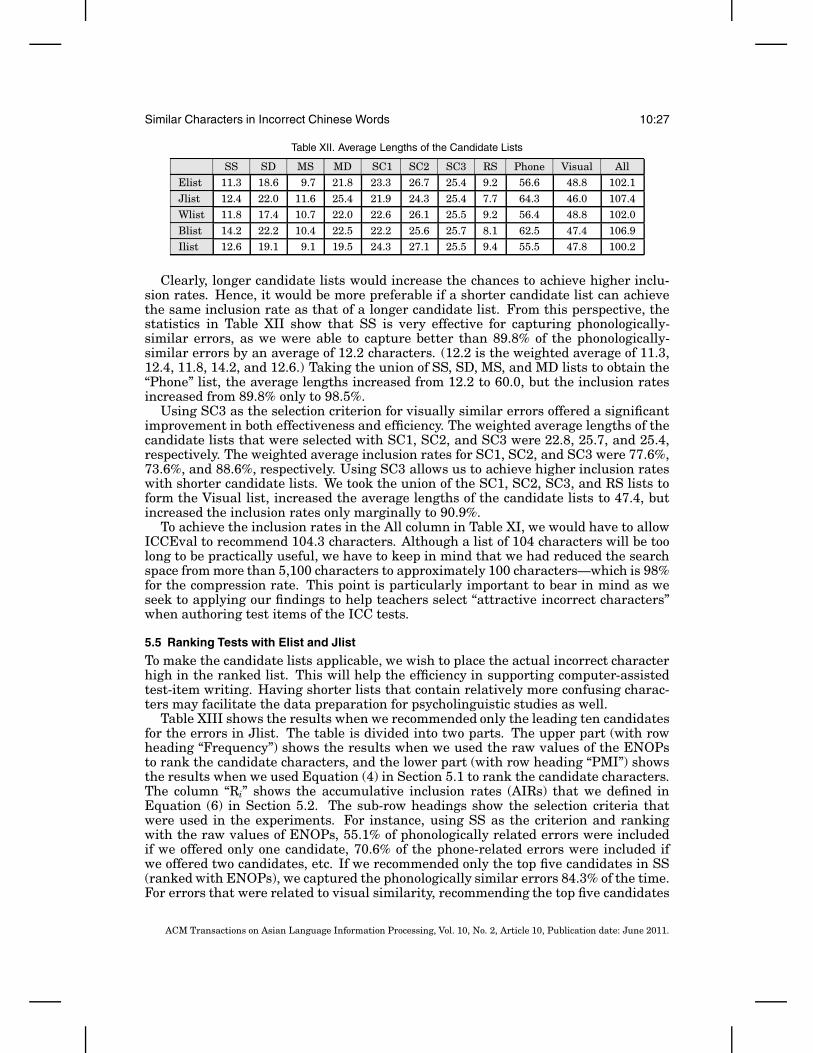
Similar Characters in Incorrect Chinese Words 10:27
Table XII. Average Lengths of the Candidate Lists
SS SD MS MD SC1 SC2 SC3 RS Phone Visual AllElist 11.3 18.6 9.7 21.8 23.3 26.7 25.4 9.2 56.6 48.8 102.1
Jlist 12.4 22.0 11.6 25.4 21.9 24.3 25.4 7.7 64.3 46.0 107.4Wlist 11.8 17.4 10.7 22.0 22.6 26.1 25.5 9.2 56.4 48.8 102.0
Blist 14.2 22.2 10.4 22.5 22.2 25.6 25.7 8.1 62.5 47.4 106.9Ilist 12.6 19.1 9.1 19.5 24.3 27.1 25.5 9.4 55.5 47.8 100.2
Clearly, longer candidate lists would increase the chances to achieve higher inclu-sion rates. Hence, it would be more preferable if a shorter candidate list can achievethe same inclusion rate as that of a longer candidate list. From this perspective, thestatistics in Table XII show that SS is very effective for capturing phonologically-similar errors, as we were able to capture better than 89.8% of the phonologically-similar errors by an average of 12.2 characters. (12.2 is the weighted average of 11.3,12.4, 11.8, 14.2, and 12.6.) Taking the union of SS, SD, MS, and MD lists to obtain the“Phone” list, the average lengths increased from 12.2 to 60.0, but the inclusion ratesincreased from 89.8% only to 98.5%.
Using SC3 as the selection criterion for visually similar errors offered a significantimprovement in both effectiveness and efficiency. The weighted average lengths of thecandidate lists that were selected with SC1, SC2, and SC3 were 22.8, 25.7, and 25.4,respectively. The weighted average inclusion rates for SC1, SC2, and SC3 were 77.6%,73.6%, and 88.6%, respectively. Using SC3 allows us to achieve higher inclusion rateswith shorter candidate lists. We took the union of the SC1, SC2, SC3, and RS lists toform the Visual list, increased the average lengths of the candidate lists to 47.4, butincreased the inclusion rates only marginally to 90.9%.
To achieve the inclusion rates in the All column in Table XI, we would have to allowICCEval to recommend 104.3 characters. Although a list of 104 characters will be toolong to be practically useful, we have to keep in mind that we had reduced the searchspace from more than 5,100 characters to approximately 100 characters—which is 98%for the compression rate. This point is particularly important to bear in mind as weseek to applying our findings to help teachers select “attractive incorrect characters”when authoring test items of the ICC tests.
5.5 Ranking Tests with Elist and Jlist
To make the candidate lists applicable, we wish to place the actual incorrect characterhigh in the ranked list. This will help the efficiency in supporting computer-assistedtest-item writing. Having shorter lists that contain relatively more confusing charac-ters may facilitate the data preparation for psycholinguistic studies as well.
Table XIII shows the results when we recommended only the leading ten candidatesfor the errors in Jlist. The table is divided into two parts. The upper part (with rowheading “Frequency”) shows the results when we used the raw values of the ENOPsto rank the candidate characters, and the lower part (with row heading “PMI”) showsthe results when we used Equation (4) in Section 5.1 to rank the candidate characters.The column “Ri” shows the accumulative inclusion rates (AIRs) that we defined inEquation (6) in Section 5.2. The sub-row headings show the selection criteria thatwere used in the experiments. For instance, using SS as the criterion and rankingwith the raw values of ENOPs, 55.1% of phonologically related errors were includedif we offered only one candidate, 70.6% of the phone-related errors were included ifwe offered two candidates, etc. If we recommended only the top five candidates in SS(ranked with ENOPs), we captured the phonologically similar errors 84.3% of the time.For errors that were related to visual similarity, recommending the top five candidates
ACM Transactions on Asian Language Information Processing, Vol. 10, No. 2, Article 10, Publication date: June 2011.
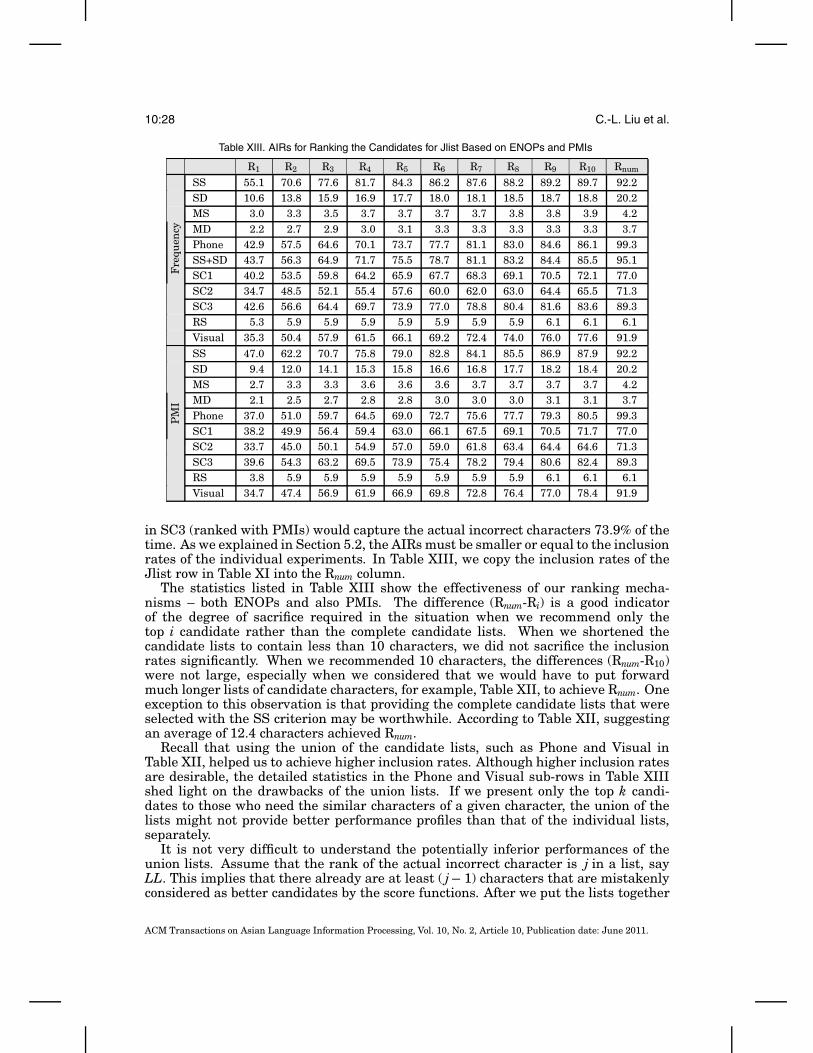
10:28 C.-L. Liu et al.
Table XIII. AIRs for Ranking the Candidates for Jlist Based on ENOPs and PMIs
R1 R2 R3 R4 R5 R6 R7 R8 R9 R10 RnumF
Fre
quen
cyF
SS 55.1 70.6 77.6 81.7 84.3 86.2 87.6 88.2 89.2 89.7 92.2SD 10.6 13.8 15.9 16.9 17.7 18.0 18.1 18.5 18.7 18.8 20.2MS 3.0 3.3 3.5 3.7 3.7 3.7 3.7 3.8 3.8 3.9 4.2MD 2.2 2.7 2.9 3.0 3.1 3.3 3.3 3.3 3.3 3.3 3.7Phone 42.9 57.5 64.6 70.1 73.7 77.7 81.1 83.0 84.6 86.1 99.3SS+SD 43.7 56.3 64.9 71.7 75.5 78.7 81.1 83.2 84.4 85.5 95.1SC1 40.2 53.5 59.8 64.2 65.9 67.7 68.3 69.1 70.5 72.1 77.0SC2 34.7 48.5 52.1 55.4 57.6 60.0 62.0 63.0 64.4 65.5 71.3SC3 42.6 56.6 64.4 69.7 73.9 77.0 78.8 80.4 81.6 83.6 89.3RS 5.3 5.9 5.9 5.9 5.9 5.9 5.9 5.9 6.1 6.1 6.1Visual 35.3 50.4 57.9 61.5 66.1 69.2 72.4 74.0 76.0 77.6 91.9
yyyP
MIy
SS 47.0 62.2 70.7 75.8 79.0 82.8 84.1 85.5 86.9 87.9 92.2SD 9.4 12.0 14.1 15.3 15.8 16.6 16.8 17.7 18.2 18.4 20.2MS 2.7 3.3 3.3 3.6 3.6 3.6 3.7 3.7 3.7 3.7 4.2MD 2.1 2.5 2.7 2.8 2.8 3.0 3.0 3.0 3.1 3.1 3.7Phone 37.0 51.0 59.7 64.5 69.0 72.7 75.6 77.7 79.3 80.5 99.3SC1 38.2 49.9 56.4 59.4 63.0 66.1 67.5 69.1 70.5 71.7 77.0SC2 33.7 45.0 50.1 54.9 57.0 59.0 61.8 63.4 64.4 64.6 71.3SC3 39.6 54.3 63.2 69.5 73.9 75.4 78.2 79.4 80.6 82.4 89.3RS 3.8 5.9 5.9 5.9 5.9 5.9 5.9 5.9 6.1 6.1 6.1Visual 34.7 47.4 56.9 61.9 66.9 69.8 72.8 76.4 77.0 78.4 91.9
in SC3 (ranked with PMIs) would capture the actual incorrect characters 73.9% of thetime. As we explained in Section 5.2, the AIRs must be smaller or equal to the inclusionrates of the individual experiments. In Table XIII, we copy the inclusion rates of theJlist row in Table XI into the Rnum column.
The statistics listed in Table XIII show the effectiveness of our ranking mecha-nisms – both ENOPs and also PMIs. The difference (Rnum-Ri) is a good indicatorof the degree of sacrifice required in the situation when we recommend only thetop i candidate rather than the complete candidate lists. When we shortened thecandidate lists to contain less than 10 characters, we did not sacrifice the inclusionrates significantly. When we recommended 10 characters, the differences (Rnum-R10)were not large, especially when we considered that we would have to put forwardmuch longer lists of candidate characters, for example, Table XII, to achieve Rnum. Oneexception to this observation is that providing the complete candidate lists that wereselected with the SS criterion may be worthwhile. According to Table XII, suggestingan average of 12.4 characters achieved Rnum.
Recall that using the union of the candidate lists, such as Phone and Visual inTable XII, helped us to achieve higher inclusion rates. Although higher inclusion ratesare desirable, the detailed statistics in the Phone and Visual sub-rows in Table XIIIshed light on the drawbacks of the union lists. If we present only the top k candi-dates to those who need the similar characters of a given character, the union of thelists might not provide better performance profiles than that of the individual lists,separately.
It is not very difficult to understand the potentially inferior performances of theunion lists. Assume that the rank of the actual incorrect character is j in a list, sayLL. This implies that there already are at least ( j− 1) characters that are mistakenlyconsidered as better candidates by the score functions. After we put the lists together
ACM Transactions on Asian Language Information Processing, Vol. 10, No. 2, Article 10, Publication date: June 2011.
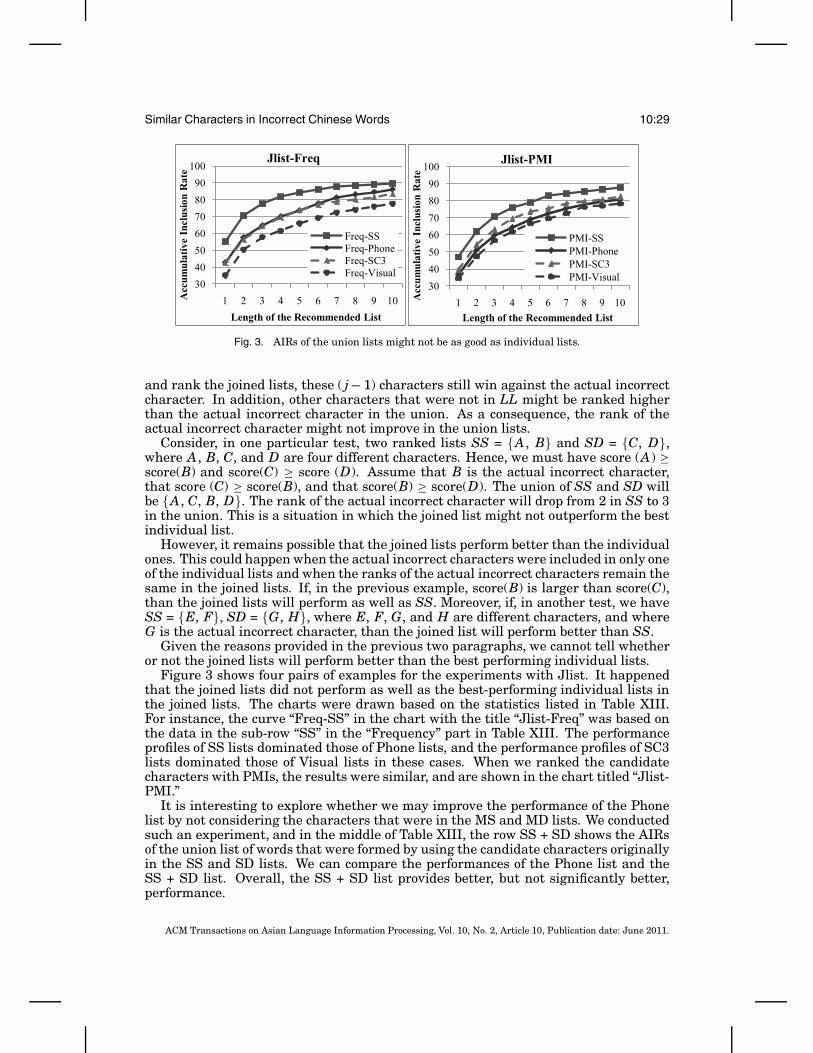
Similar Characters in Incorrect Chinese Words 10:29
Fig. 3. AIRs of the union lists might not be as good as individual lists.
and rank the joined lists, these ( j− 1) characters still win against the actual incorrectcharacter. In addition, other characters that were not in LL might be ranked higherthan the actual incorrect character in the union. As a consequence, the rank of theactual incorrect character might not improve in the union lists.
Consider, in one particular test, two ranked lists SS = {A, B} and SD = {C, D},where A, B, C, and D are four different characters. Hence, we must have score (A) ≥score(B) and score(C) ≥ score (D). Assume that B is the actual incorrect character,that score (C) ≥ score(B), and that score(B) ≥ score(D). The union of SS and SD willbe {A, C, B, D}. The rank of the actual incorrect character will drop from 2 in SS to 3in the union. This is a situation in which the joined list might not outperform the bestindividual list.
However, it remains possible that the joined lists perform better than the individualones. This could happen when the actual incorrect characters were included in only oneof the individual lists and when the ranks of the actual incorrect characters remain thesame in the joined lists. If, in the previous example, score(B) is larger than score(C),than the joined lists will perform as well as SS. Moreover, if, in another test, we haveSS = {E, F}, SD = {G, H}, where E, F, G, and H are different characters, and whereG is the actual incorrect character, than the joined list will perform better than SS.
Given the reasons provided in the previous two paragraphs, we cannot tell whetheror not the joined lists will perform better than the best performing individual lists.
Figure 3 shows four pairs of examples for the experiments with Jlist. It happenedthat the joined lists did not perform as well as the best-performing individual lists inthe joined lists. The charts were drawn based on the statistics listed in Table XIII.For instance, the curve “Freq-SS” in the chart with the title “Jlist-Freq” was based onthe data in the sub-row “SS” in the “Frequency” part in Table XIII. The performanceprofiles of SS lists dominated those of Phone lists, and the performance profiles of SC3lists dominated those of Visual lists in these cases. When we ranked the candidatecharacters with PMIs, the results were similar, and are shown in the chart titled “Jlist-PMI.”
It is interesting to explore whether we may improve the performance of the Phonelist by not considering the characters that were in the MS and MD lists. We conductedsuch an experiment, and in the middle of Table XIII, the row SS + SD shows the AIRsof the union list of words that were formed by using the candidate characters originallyin the SS and SD lists. We can compare the performances of the Phone list and theSS + SD list. Overall, the SS + SD list provides better, but not significantly better,performance.
ACM Transactions on Asian Language Information Processing, Vol. 10, No. 2, Article 10, Publication date: June 2011.
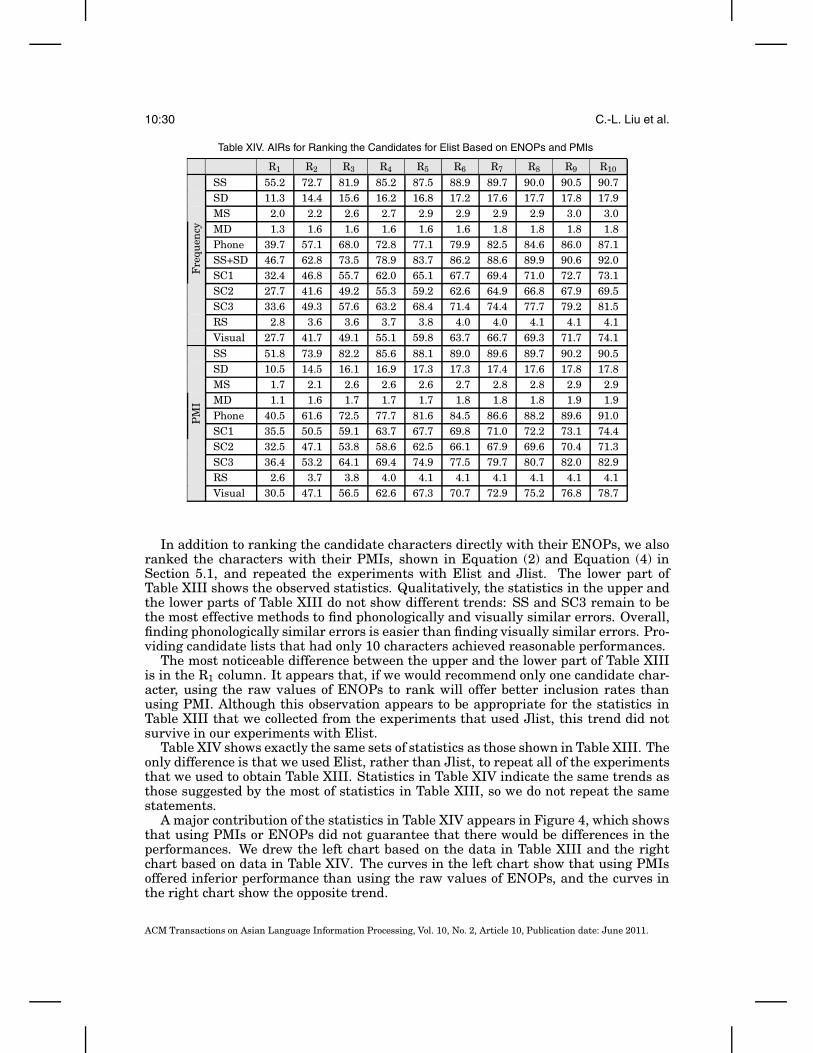
10:30 C.-L. Liu et al.
Table XIV. AIRs for Ranking the Candidates for Elist Based on ENOPs and PMIs
R1 R2 R3 R4 R5 R6 R7 R8 R9 R10
FF
requ
ency
FSS 55.2 72.7 81.9 85.2 87.5 88.9 89.7 90.0 90.5 90.7SD 11.3 14.4 15.6 16.2 16.8 17.2 17.6 17.7 17.8 17.9MS 2.0 2.2 2.6 2.7 2.9 2.9 2.9 2.9 3.0 3.0MD 1.3 1.6 1.6 1.6 1.6 1.6 1.8 1.8 1.8 1.8Phone 39.7 57.1 68.0 72.8 77.1 79.9 82.5 84.6 86.0 87.1SS+SD 46.7 62.8 73.5 78.9 83.7 86.2 88.6 89.9 90.6 92.0SC1 32.4 46.8 55.7 62.0 65.1 67.7 69.4 71.0 72.7 73.1SC2 27.7 41.6 49.2 55.3 59.2 62.6 64.9 66.8 67.9 69.5SC3 33.6 49.3 57.6 63.2 68.4 71.4 74.4 77.7 79.2 81.5RS 2.8 3.6 3.6 3.7 3.8 4.0 4.0 4.1 4.1 4.1Visual 27.7 41.7 49.1 55.1 59.8 63.7 66.7 69.3 71.7 74.1
yyyP
MIy
SS 51.8 73.9 82.2 85.6 88.1 89.0 89.6 89.7 90.2 90.5SD 10.5 14.5 16.1 16.9 17.3 17.3 17.4 17.6 17.8 17.8MS 1.7 2.1 2.6 2.6 2.6 2.7 2.8 2.8 2.9 2.9MD 1.1 1.6 1.7 1.7 1.7 1.8 1.8 1.8 1.9 1.9Phone 40.5 61.6 72.5 77.7 81.6 84.5 86.6 88.2 89.6 91.0SC1 35.5 50.5 59.1 63.7 67.7 69.8 71.0 72.2 73.1 74.4SC2 32.5 47.1 53.8 58.6 62.5 66.1 67.9 69.6 70.4 71.3SC3 36.4 53.2 64.1 69.4 74.9 77.5 79.7 80.7 82.0 82.9RS 2.6 3.7 3.8 4.0 4.1 4.1 4.1 4.1 4.1 4.1Visual 30.5 47.1 56.5 62.6 67.3 70.7 72.9 75.2 76.8 78.7
In addition to ranking the candidate characters directly with their ENOPs, we alsoranked the characters with their PMIs, shown in Equation (2) and Equation (4) inSection 5.1, and repeated the experiments with Elist and Jlist. The lower part ofTable XIII shows the observed statistics. Qualitatively, the statistics in the upper andthe lower parts of Table XIII do not show different trends: SS and SC3 remain to bethe most effective methods to find phonologically and visually similar errors. Overall,finding phonologically similar errors is easier than finding visually similar errors. Pro-viding candidate lists that had only 10 characters achieved reasonable performances.
The most noticeable difference between the upper and the lower part of Table XIIIis in the R1 column. It appears that, if we would recommend only one candidate char-acter, using the raw values of ENOPs to rank will offer better inclusion rates thanusing PMI. Although this observation appears to be appropriate for the statistics inTable XIII that we collected from the experiments that used Jlist, this trend did notsurvive in our experiments with Elist.
Table XIV shows exactly the same sets of statistics as those shown in Table XIII. Theonly difference is that we used Elist, rather than Jlist, to repeat all of the experimentsthat we used to obtain Table XIII. Statistics in Table XIV indicate the same trends asthose suggested by the most of statistics in Table XIII, so we do not repeat the samestatements.
A major contribution of the statistics in Table XIV appears in Figure 4, which showsthat using PMIs or ENOPs did not guarantee that there would be differences in theperformances. We drew the left chart based on the data in Table XIII and the rightchart based on data in Table XIV. The curves in the left chart show that using PMIsoffered inferior performance than using the raw values of ENOPs, and the curves inthe right chart show the opposite trend.
ACM Transactions on Asian Language Information Processing, Vol. 10, No. 2, Article 10, Publication date: June 2011.

Similar Characters in Incorrect Chinese Words 10:31
Fig. 4. Using PMI does not necessarily outperform using ENOPs.
Table XV. Ranking the Candidates Based on ENOPs and PMIs for Ilist
Frequencies PMIsR1 R2 R3 R4 R5 R1 R2 R3 R4 R5
SS 70.3 77.7 80.6 81.0 81.6 66.7 76.0 80.2 81.0 81.6SD 25.6 28.3 28.9 28.9 29.3 24.8 28.1 28.9 29.1 29.3MS 1.4 1.7 1.7 1.7 1.7 1.6 2.1 2.1 2.1 2.1
MD 1.6 1.6 1.6 1.6 1.6 1.2 1.6 1.6 1.6 1.6Phone 76.7 89.1 93.6 94.8 95.5 70.5 86.2 92.1 94.4 95.7
SC1 64.7 72.0 76.0 78.0 78.3 61.7 72.3 75.0 76.7 77.7SC2 58.0 64.7 68.3 70.7 71.0 53.7 66.3 69.3 70.3 70.3
SC3 71.3 80.0 85.0 86.7 87.0 67.0 80.0 84.7 86.0 86.3RS 1.3 1.3 1.3 1.3 1.3 1.3 1.3 1.3 1.3 1.3
Visual 71.0 82.3 86.3 89.3 89.3 65.0 81.7 86.7 88.3 89.0
Although PMIs are frequently used to compute the co-occurrences of two events,including the collocation of words, examining Formula (4) discussed in Section 5.1reveals an intuitive interpretation of the PMIs in our applications. The formula mea-sures the percentages of observing the incorrect words (i.e., C ∧ X ) given that thecandidate characters appeared (i.e., X in the formula; recall that this is the charac-ter that would replace the correct character). Such percentages can be diluted if Xhappens to represent a high frequent character.
Similar to an experiment that we conducted for the Jlist, we also created the unionlist SS + SD for the experiments with Elist, and the results are shown in the middleof Table XIV. This time, the SS + SD list outperformed the Phone list by a marginby about 5%. However, the resulting performance profile of SS + SD is still inferior tothat of SS. Interestingly, when we consider the top 10 candidate characters, the SS +SD outperformed not only the Phone but also the SS list marginally.
5.6 Ranking Tests with Ilist
Table XV shows the accumulative inclusion rates (AIRs) for the experiments for Ilist,which provides reported errors for simplified Chinese. The inclusion rates for the ex-periments for Ilist were presented in Table XI.
ACM Transactions on Asian Language Information Processing, Vol. 10, No. 2, Article 10, Publication date: June 2011.

10:32 C.-L. Liu et al.
Table XVI. AIRs for Ranking Candidates for Wlist Based on Frequencies and PMIs
R1 R2 R3 R4 R5 R6 R7 R8 R9 R10
FF
requ
ency
FSS 73.1 84.6 90.8 92.3 93.1 93.8 93.8 93.8 93.8 93.8SD 18.5 21.5 22.3 23.1 23.1 23.1 23.1 23.1 23.1 23.1MS 0.8 0.8 0.8 0.8 0.8 0.8 0.8 0.8 0.8 0.8MD 0.8 0.8 0.8 0.8 0.8 0.8 0.8 0.8 0.8 0.8Phone 68.5 82.3 88.5 91.5 93.1 93.1 95.4 95.4 96.2 96.2SC1 57.3 70.9 74.8 77.7 78.6 78.6 78.6 79.6 79.6 79.6SC2 54.4 69.9 72.8 73.8 74.8 76.7 76.7 77.7 77.7 78.6SC3 60.2 76.7 82.5 84.5 85.4 86.4 89.3 89.3 89.3 89.3RS 1.0 1.0 1.0 1.0 1.0 1.0 1.0 1.0 1.0 1.0Visual 52.4 67.0 77.7 81.6 85.4 86.4 86.4 86.4 89.3 89.3
yyyP
MIy
SS 63.8 83.1 90.0 91.5 92.3 92.3 92.3 92.3 92.3 92.3SD 18.5 21.5 22.3 22.3 23.1 23.1 23.1 23.1 23.1 23.1MS 0.8 0.8 0.8 0.8 0.8 0.8 0.8 0.8 0.8 0.8MD 0.8 0.8 0.8 0.8 0.8 0.8 0.8 0.8 0.8 0.8Phone 60.8 82.3 90.8 92.3 94.6 96.2 96.2 96.2 96.2 96.9SC1 51.5 64.1 71.8 73.8 77.7 78.6 79.6 79.6 79.6 79.6SC2 49.5 65.0 71.8 72.8 75.7 75.7 77.7 77.7 77.7 77.7SC3 55.3 73.8 80.6 85.4 88.3 89.3 89.3 89.3 89.3 89.3RS 1.0 1.0 1.0 1.0 1.0 1.0 1.0 1.0 1.0 1.0Visual 52.4 67.0 71.8 77.7 84.5 86.4 86.4 87.4 88.3 88.3
We use a format that is similar to the format for Tables XIII and XIV for Table XV,but we list only the AIRs for the top-five candidates. When we used the top-five candi-date characters, the AIRs were almost as good as the inclusion rates, which we listedin Table XI. Statistics in Table XV indicate that our system performed well for thesimplified Chinese. We can find results similar to those that we presented for the ex-perimental results for Elist and Jlist. The candidate lists selected with the SS andSC3 criteria were the most effective in capturing phonologically and visually relatederrors. SD continued to serve as an instrumental complement for SS.
In contrast to what we observed in the experiments for Elist and Jlist, the Phonelists, which are the unions of SS, SD, MS, and MD lists, performed better than thebest performing individual lists, that is, SS lists. The top-five candidate characters inthe Phone lists captured 95.5% of the phonologically related errors on average. Anal-ogously, the Visual list, which is the union of SC1, SC2, SC3, and RS, captured 89.3%of the visually related errors.
5.7 Further Tests with Wlist and Blist
We explained, in Section 4.2, that we used Wlist and Blist as the new datasets to testhow our system will perform with unforeseen data.
Table XVI and Table XVII provided in the Appendix show that the experimentalresults for Wlist and Blist were not different from the results for Elist and Jlist,which we discussed in Section 5.5. The inclusion rates were good, as we discussed inSection 5.4. Using the top 10 candidate characters enabled us to catch most of theerrors that we were able to capture with the complete lists. Using PMI and ENOPsto rank the candidate characters achieved performance profiles of similar quality. SSlists and SC3 lists performed best if we had to use only one of the lists to capturethe phonologically and the visually related errors, respectively. In addition, SD listscomplemented the SS lists to find those phonologically related errors.
ACM Transactions on Asian Language Information Processing, Vol. 10, No. 2, Article 10, Publication date: June 2011.
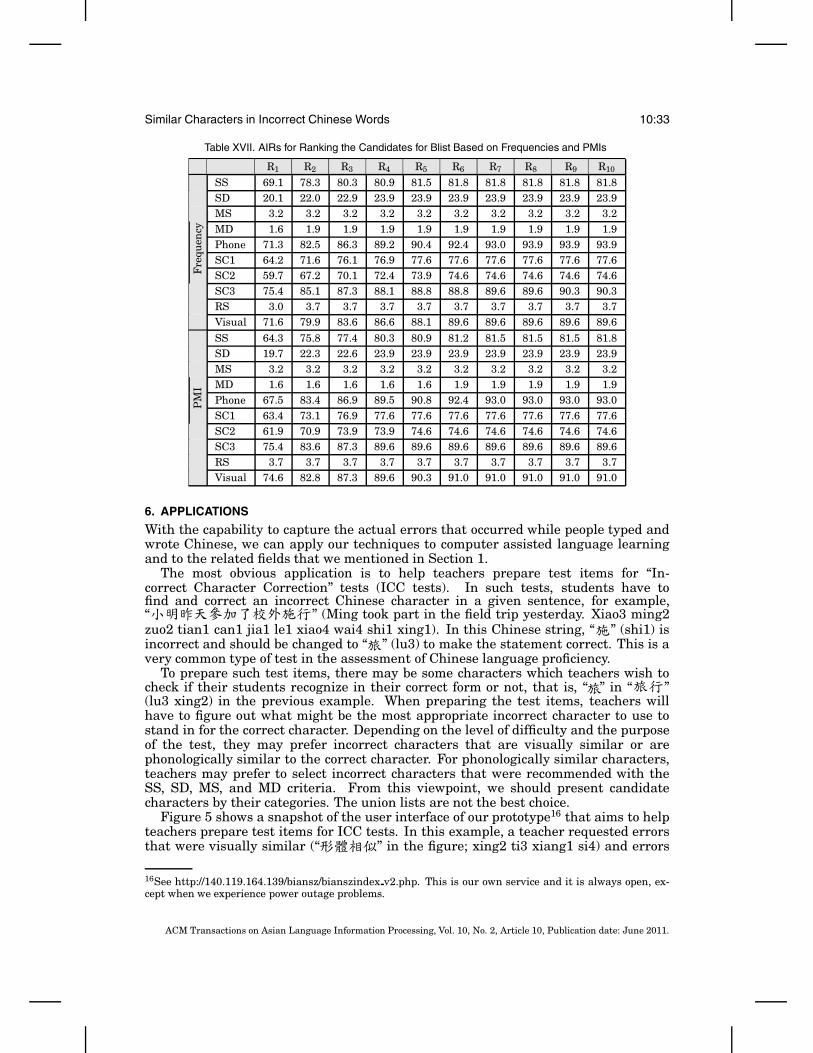
Similar Characters in Incorrect Chinese Words 10:33
Table XVII. AIRs for Ranking the Candidates for Blist Based on Frequencies and PMIs
R1 R2 R3 R4 R5 R6 R7 R8 R9 R10
FF
requ
ency
FSS 69.1 78.3 80.3 80.9 81.5 81.8 81.8 81.8 81.8 81.8SD 20.1 22.0 22.9 23.9 23.9 23.9 23.9 23.9 23.9 23.9MS 3.2 3.2 3.2 3.2 3.2 3.2 3.2 3.2 3.2 3.2MD 1.6 1.9 1.9 1.9 1.9 1.9 1.9 1.9 1.9 1.9Phone 71.3 82.5 86.3 89.2 90.4 92.4 93.0 93.9 93.9 93.9SC1 64.2 71.6 76.1 76.9 77.6 77.6 77.6 77.6 77.6 77.6SC2 59.7 67.2 70.1 72.4 73.9 74.6 74.6 74.6 74.6 74.6SC3 75.4 85.1 87.3 88.1 88.8 88.8 89.6 89.6 90.3 90.3RS 3.0 3.7 3.7 3.7 3.7 3.7 3.7 3.7 3.7 3.7Visual 71.6 79.9 83.6 86.6 88.1 89.6 89.6 89.6 89.6 89.6
yyyP
MIy
SS 64.3 75.8 77.4 80.3 80.9 81.2 81.5 81.5 81.5 81.8SD 19.7 22.3 22.6 23.9 23.9 23.9 23.9 23.9 23.9 23.9MS 3.2 3.2 3.2 3.2 3.2 3.2 3.2 3.2 3.2 3.2MD 1.6 1.6 1.6 1.6 1.6 1.9 1.9 1.9 1.9 1.9Phone 67.5 83.4 86.9 89.5 90.8 92.4 93.0 93.0 93.0 93.0SC1 63.4 73.1 76.9 77.6 77.6 77.6 77.6 77.6 77.6 77.6SC2 61.9 70.9 73.9 73.9 74.6 74.6 74.6 74.6 74.6 74.6SC3 75.4 83.6 87.3 89.6 89.6 89.6 89.6 89.6 89.6 89.6RS 3.7 3.7 3.7 3.7 3.7 3.7 3.7 3.7 3.7 3.7Visual 74.6 82.8 87.3 89.6 90.3 91.0 91.0 91.0 91.0 91.0
6. APPLICATIONS
With the capability to capture the actual errors that occurred while people typed andwrote Chinese, we can apply our techniques to computer assisted language learningand to the related fields that we mentioned in Section 1.
The most obvious application is to help teachers prepare test items for “In-correct Character Correction” tests (ICC tests). In such tests, students have tofind and correct an incorrect Chinese character in a given sentence, for example,“ ” (Ming took part in the field trip yesterday. Xiao3 ming2zuo2 tian1 can1 jia1 le1 xiao4 wai4 shi1 xing1). In this Chinese string, “ ” (shi1) isincorrect and should be changed to “ ” (lu3) to make the statement correct. This is avery common type of test in the assessment of Chinese language proficiency.
To prepare such test items, there may be some characters which teachers wish tocheck if their students recognize in their correct form or not, that is, “ ” in “ ”(lu3 xing2) in the previous example. When preparing the test items, teachers willhave to figure out what might be the most appropriate incorrect character to use tostand in for the correct character. Depending on the level of difficulty and the purposeof the test, they may prefer incorrect characters that are visually similar or arephonologically similar to the correct character. For phonologically similar characters,teachers may prefer to select incorrect characters that were recommended with theSS, SD, MS, and MD criteria. From this viewpoint, we should present candidatecharacters by their categories. The union lists are not the best choice.
Figure 5 shows a snapshot of the user interface of our prototype16 that aims to helpteachers prepare test items for ICC tests. In this example, a teacher requested errorsthat were visually similar (“ ” in the figure; xing2 ti3 xiang1 si4) and errors
16See http://140.119.164.139/biansz/bianszindex v2.php. This is our own service and it is always open, ex-cept when we experience power outage problems.
ACM Transactions on Asian Language Information Processing, Vol. 10, No. 2, Article 10, Publication date: June 2011.
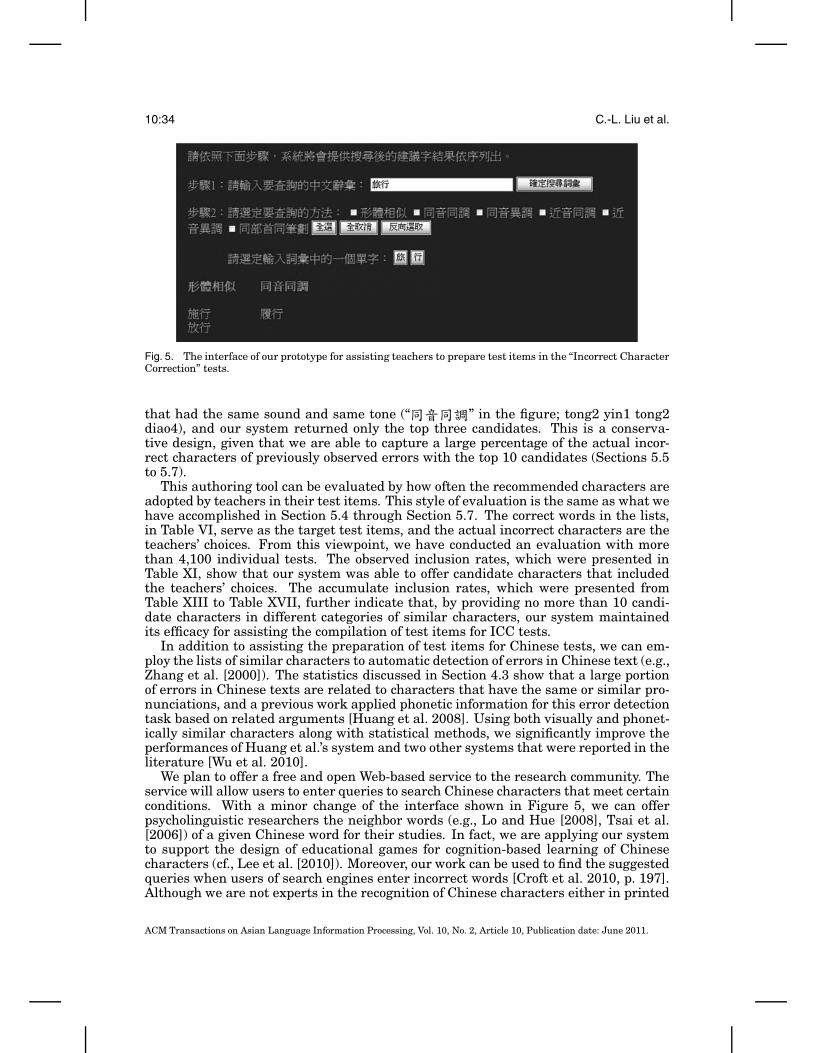
10:34 C.-L. Liu et al.
Fig. 5. The interface of our prototype for assisting teachers to prepare test items in the “Incorrect CharacterCorrection” tests.
that had the same sound and same tone (“ ” in the figure; tong2 yin1 tong2diao4), and our system returned only the top three candidates. This is a conserva-tive design, given that we are able to capture a large percentage of the actual incor-rect characters of previously observed errors with the top 10 candidates (Sections 5.5to 5.7).
This authoring tool can be evaluated by how often the recommended characters areadopted by teachers in their test items. This style of evaluation is the same as what wehave accomplished in Section 5.4 through Section 5.7. The correct words in the lists,in Table VI, serve as the target test items, and the actual incorrect characters are theteachers’ choices. From this viewpoint, we have conducted an evaluation with morethan 4,100 individual tests. The observed inclusion rates, which were presented inTable XI, show that our system was able to offer candidate characters that includedthe teachers’ choices. The accumulate inclusion rates, which were presented fromTable XIII to Table XVII, further indicate that, by providing no more than 10 candi-date characters in different categories of similar characters, our system maintainedits efficacy for assisting the compilation of test items for ICC tests.
In addition to assisting the preparation of test items for Chinese tests, we can em-ploy the lists of similar characters to automatic detection of errors in Chinese text (e.g.,Zhang et al. [2000]). The statistics discussed in Section 4.3 show that a large portionof errors in Chinese texts are related to characters that have the same or similar pro-nunciations, and a previous work applied phonetic information for this error detectiontask based on related arguments [Huang et al. 2008]. Using both visually and phonet-ically similar characters along with statistical methods, we significantly improve theperformances of Huang et al.’s system and two other systems that were reported in theliterature [Wu et al. 2010].
We plan to offer a free and open Web-based service to the research community. Theservice will allow users to enter queries to search Chinese characters that meet certainconditions. With a minor change of the interface shown in Figure 5, we can offerpsycholinguistic researchers the neighbor words (e.g., Lo and Hue [2008], Tsai et al.[2006]) of a given Chinese word for their studies. In fact, we are applying our systemto support the design of educational games for cognition-based learning of Chinesecharacters (cf., Lee et al. [2010]). Moreover, our work can be used to find the suggestedqueries when users of search engines enter incorrect words [Croft et al. 2010, p. 197].Although we are not experts in the recognition of Chinese characters either in printed
ACM Transactions on Asian Language Information Processing, Vol. 10, No. 2, Article 10, Publication date: June 2011.
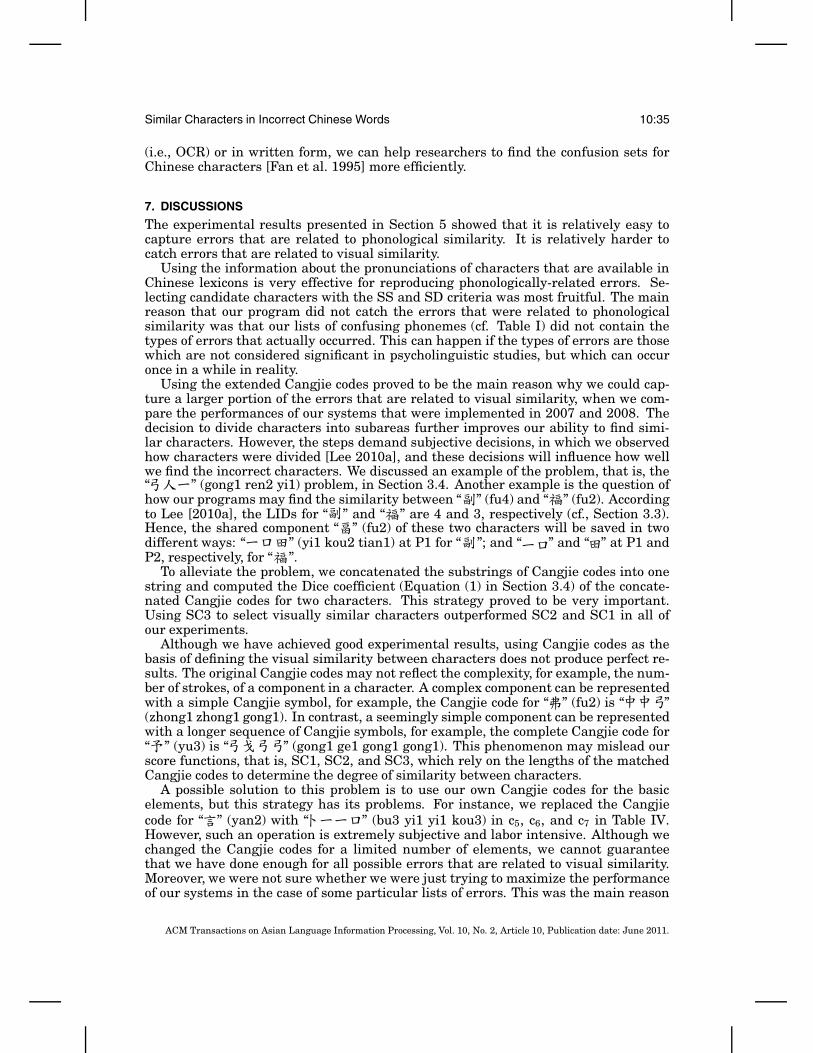
Similar Characters in Incorrect Chinese Words 10:35
(i.e., OCR) or in written form, we can help researchers to find the confusion sets forChinese characters [Fan et al. 1995] more efficiently.
7. DISCUSSIONS
The experimental results presented in Section 5 showed that it is relatively easy tocapture errors that are related to phonological similarity. It is relatively harder tocatch errors that are related to visual similarity.
Using the information about the pronunciations of characters that are available inChinese lexicons is very effective for reproducing phonologically-related errors. Se-lecting candidate characters with the SS and SD criteria was most fruitful. The mainreason that our program did not catch the errors that were related to phonologicalsimilarity was that our lists of confusing phonemes (cf. Table I) did not contain thetypes of errors that actually occurred. This can happen if the types of errors are thosewhich are not considered significant in psycholinguistic studies, but which can occuronce in a while in reality.
Using the extended Cangjie codes proved to be the main reason why we could cap-ture a larger portion of the errors that are related to visual similarity, when we com-pare the performances of our systems that were implemented in 2007 and 2008. Thedecision to divide characters into subareas further improves our ability to find simi-lar characters. However, the steps demand subjective decisions, in which we observedhow characters were divided [Lee 2010a], and these decisions will influence how wellwe find the incorrect characters. We discussed an example of the problem, that is, the“ ” (gong1 ren2 yi1) problem, in Section 3.4. Another example is the question ofhow our programs may find the similarity between “ ” (fu4) and “ ” (fu2). Accordingto Lee [2010a], the LIDs for “ ” and “ ” are 4 and 3, respectively (cf., Section 3.3).Hence, the shared component “ ” (fu2) of these two characters will be saved in twodifferent ways: “ ” (yi1 kou2 tian1) at P1 for “ ”; and “ ” and “ ” at P1 andP2, respectively, for “ ”.
To alleviate the problem, we concatenated the substrings of Cangjie codes into onestring and computed the Dice coefficient (Equation (1) in Section 3.4) of the concate-nated Cangjie codes for two characters. This strategy proved to be very important.Using SC3 to select visually similar characters outperformed SC2 and SC1 in all ofour experiments.
Although we have achieved good experimental results, using Cangjie codes as thebasis of defining the visual similarity between characters does not produce perfect re-sults. The original Cangjie codes may not reflect the complexity, for example, the num-ber of strokes, of a component in a character. A complex component can be representedwith a simple Cangjie symbol, for example, the Cangjie code for “ ” (fu2) is “ ”(zhong1 zhong1 gong1). In contrast, a seemingly simple component can be representedwith a longer sequence of Cangjie symbols, for example, the complete Cangjie code for“ ” (yu3) is “ ” (gong1 ge1 gong1 gong1). This phenomenon may mislead ourscore functions, that is, SC1, SC2, and SC3, which rely on the lengths of the matchedCangjie codes to determine the degree of similarity between characters.
A possible solution to this problem is to use our own Cangjie codes for the basicelements, but this strategy has its problems. For instance, we replaced the Cangjiecode for “ ” (yan2) with “ ” (bu3 yi1 yi1 kou3) in c5, c6, and c7 in Table IV.However, such an operation is extremely subjective and labor intensive. Although wechanged the Cangjie codes for a limited number of elements, we cannot guaranteethat we have done enough for all possible errors that are related to visual similarity.Moreover, we were not sure whether we were just trying to maximize the performanceof our systems in the case of some particular lists of errors. This was the main reason
ACM Transactions on Asian Language Information Processing, Vol. 10, No. 2, Article 10, Publication date: June 2011.
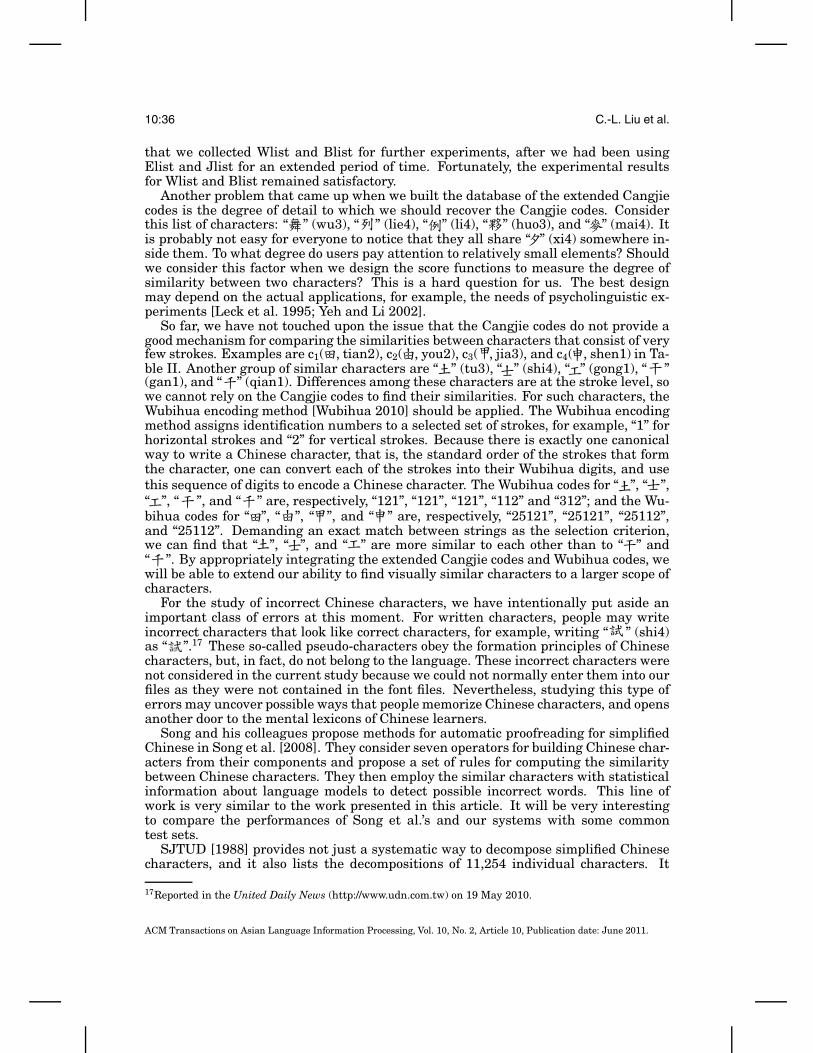
10:36 C.-L. Liu et al.
that we collected Wlist and Blist for further experiments, after we had been usingElist and Jlist for an extended period of time. Fortunately, the experimental resultsfor Wlist and Blist remained satisfactory.
Another problem that came up when we built the database of the extended Cangjiecodes is the degree of detail to which we should recover the Cangjie codes. Considerthis list of characters: “ ” (wu3), “ ” (lie4), “ ” (li4), “ ” (huo3), and “ ” (mai4). Itis probably not easy for everyone to notice that they all share “ ” (xi4) somewhere in-side them. To what degree do users pay attention to relatively small elements? Shouldwe consider this factor when we design the score functions to measure the degree ofsimilarity between two characters? This is a hard question for us. The best designmay depend on the actual applications, for example, the needs of psycholinguistic ex-periments [Leck et al. 1995; Yeh and Li 2002].
So far, we have not touched upon the issue that the Cangjie codes do not provide agood mechanism for comparing the similarities between characters that consist of veryfew strokes. Examples are c1( , tian2), c2( , you2), c3( , jia3), and c4( , shen1) in Ta-ble II. Another group of similar characters are “ ” (tu3), “ ” (shi4), “ ” (gong1), “ ”(gan1), and “ ” (qian1). Differences among these characters are at the stroke level, sowe cannot rely on the Cangjie codes to find their similarities. For such characters, theWubihua encoding method [Wubihua 2010] should be applied. The Wubihua encodingmethod assigns identification numbers to a selected set of strokes, for example, “1” forhorizontal strokes and “2” for vertical strokes. Because there is exactly one canonicalway to write a Chinese character, that is, the standard order of the strokes that formthe character, one can convert each of the strokes into their Wubihua digits, and usethis sequence of digits to encode a Chinese character. The Wubihua codes for “ ”, “ ”,“ ”, “ ”, and “ ” are, respectively, “121”, “121”, “121”, “112” and “312”; and the Wu-bihua codes for “ ”, “ ”, “ ”, and “ ” are, respectively, “25121”, “25121”, “25112”,and “25112”. Demanding an exact match between strings as the selection criterion,we can find that “ ”, “ ”, and “ ” are more similar to each other than to “ ” and“ ”. By appropriately integrating the extended Cangjie codes and Wubihua codes, wewill be able to extend our ability to find visually similar characters to a larger scope ofcharacters.
For the study of incorrect Chinese characters, we have intentionally put aside animportant class of errors at this moment. For written characters, people may writeincorrect characters that look like correct characters, for example, writing “ ” (shi4)as “ ””.17 These so-called pseudo-characters obey the formation principles of Chinesecharacters, but, in fact, do not belong to the language. These incorrect characters werenot considered in the current study because we could not normally enter them into ourfiles as they were not contained in the font files. Nevertheless, studying this type oferrors may uncover possible ways that people memorize Chinese characters, and opensanother door to the mental lexicons of Chinese learners.
Song and his colleagues propose methods for automatic proofreading for simplifiedChinese in Song et al. [2008]. They consider seven operators for building Chinese char-acters from their components and propose a set of rules for computing the similaritybetween Chinese characters. They then employ the similar characters with statisticalinformation about language models to detect possible incorrect words. This line ofwork is very similar to the work presented in this article. It will be very interestingto compare the performances of Song et al.’s and our systems with some commontest sets.
SJTUD [1988] provides not just a systematic way to decompose simplified Chinesecharacters, and it also lists the decompositions of 11,254 individual characters. It
17Reported in the United Daily News (http://www.udn.com.tw) on 19 May 2010.
ACM Transactions on Asian Language Information Processing, Vol. 10, No. 2, Article 10, Publication date: June 2011.
Similar Characters in Incorrect Chinese Words 10:37
will be very interesting to compare the effectiveness for computing visually similarcharacters with the extended Cangjie codes and the decompositions in SJTUD [1988].
8. CONCLUSIONS
We found methods to reproduce the errors found in the writing of Chinese script. Themethods utilized information about the pronunciation of Chinese characters and theheuristics rules that were derived from observations in psycholinguistic studies tojudge the degree of similarity between pronunciations. The methods also employedthe extended Cangjie codes and score functions to determine the degree of visual sim-ilarity between characters.
We evaluated our approach from three aspects. In Section 5.3, we compared theWeb-based statistics to show the reliability of Web-based statistics. In Section 5.4, weshowed that our approach could capture the incorrect character for a diverse scope oftest data at satisfactory rates. In Sections 5.5 through 5.7, we applied and comparedtwo different methods to rank the candidate characters in an attempt to capture theincorrect character with shorter lists of candidate characters. The experiments werecarried out with data that we presented in previous conference articles and some newdata that covered both traditional and simplified Chinese.
In these experiments, it was found that 76% of these errors were related to phono-logical similarity and that 46% were related to visual similarity between characters.We showed that the Web-based statistics were reasonably stable when we comparedthe popularity of word usages by comparing the numbers of Web pages that containedthe target words in both 2009 and 2010. Experimental results show that we were ableto capture 97% of the 4,100 errors, when we recommended 104 candidate characters.When we recommended only 10 candidate characters, we still caught more than 80% ofthe 4100 errors. The reported techniques are useful for applications that are related toChinese, and, in particular, we showed a real-world application that can help teachersto author test items for “incorrect character correction” tests for Chinese.
ACKNOWLEDGMENTS
We thank anonymous reviewers of this journal version and the previous conference articles for their in-valuable comments, which strongly influenced this publication. Experiments were added and improved torespond to reviewers’ comments, though we did not mark each of such experiments to indicate the reviewers’credits. We would also like to thank Professor Song Rou for his sharing his article with us. We would alsolike to thank Miss Moira Breen for her indispensable support for our English.
REFERENCESCANGJIE. 2010. An introduction to the Cangjie input method.
http://en.wikipedia.org/wiki/Cangjie input method.CDL. 2010. Chinese document laboratory, Academia Sinica. http://cdp.sinica.edu.tw/cdphanzi/. (In Chinese)CHEN, M. Y. 2000. Tone Sandhi: Patterns Across Chinese Dialects (Cambridge Studies in Linguistics 92).
Cambridge University Press.CHU, B.-F. 2010. Handbook of the Fifth Generation of the Cangjie Input Method.
http://www.cbflabs.com/book/5cjbook/. (In Chinese)CORMEN, T. H., LEISERSON, C. E., RIVEST, R. L., AND STEIN, C. 2009. Introduction to Algorithms 3rd Ed.
MIT Press.CROFT, W. B., METZLER, D., AND STROHMAN, T. 2010. Search Engines: Information Retrieval in Practice.
Pearson.DICT. 2010. An official source of information about traditional Chinese characters.
http://www.cns11643.gov.tw/AIDB/welcome.do.FAN, K.-C., LIN, C.-K., AND CHOU, K.-S. 1995. Confusion set recognition of online Chinese characters by
artificial intelligence technique. Patt. Recog. 28, 3, 303–313.
ACM Transactions on Asian Language Information Processing, Vol. 10, No. 2, Article 10, Publication date: June 2011.
10:38 C.-L. Liu et al.
FELDMAN, L. B. AND SIOK, W. W. T. 1999. Semantic radicals contribute to the visual identification ofChinese characters. J. Mem. Lang. 40, 4, 559–576.
FROMKIN, V., RODMAN, R., AND HYAMS, N. 2002. An Introduction to Language 7th Ed. Thomson.HANDICT. 2010. A source for traditional and simplified Chinese characters.
http://www.zdic.net/appendix/f19.htm.HUANG, C.-M., WU, M.-C., AND CHANG C.-C. 2008. Error detection and correction based on Chinese phone-
mic alphabet in Chinese text. Int. J. Uncertainty, Fuzziness Knowl.-Base. Syst. 16, suppl. 1, 89–105.JACKENDOFF, R. 1995. Patterns in the Mind: Language and Human Nature. Basic Books.JUANG, D., WANG, J.-H., LAI, C.-Y., HSIEH, C.-C., CHIEN, L.-F., AND HO, J.-M. 2005. Resolving the
unencoded character problem for Chinese digital libraries. In Proceedings of the 5th ACM/IEEE JointConference on Digital Libraries (JCDL’05). 311–319.
JURAFSKY, D. AND MARTIN, J. H. 2009. Speech and Language Processing 2nd Ed. Pearson.KUO, W.-J., YEN, T.-C., LEE, J.-R., CHEN, L.-F., LEE, P.-L., CHEN, S.-S., HO, L.-T., HUNG, D. L., TZENG,
O. J.-L., AND HSIEH, J.-C. 2004. Orthographic and phonological processing of Chinese characters: AnfMRI study. NeuroImage 21, 4, 1721–1731.
LECK, K.-J., WEEKES, B. S., AND CHEN, M.-J. 1995. Visual and phonological pathways to the lexicon:Evidence from Chinese readers. Mem. Cogn. 23, 4, 468–476.
LEE, C.-Y. 2009. The cognitive and neural basis for learning to reading Chinese. J. Basic Educ. 18, 2, 63–85.LEE, C.-Y., HUANG, H.-W., KUO, W.-J., TSAI, J.-L., AND TZENG, O. J.-L. 2010. Cognitive and neural basis
of the consistency and lexicality effects in reading Chinese. J. Neurolinguist. 23, 1, 10–27.LEE, C.-Y., TSAI, J.-L., HUANG, H.-W., HUNG, D. L., AND TZENG, O. J.-L. 2006. The temporal signatures
of semantic and phonological activations for Chinese sublexical processing: An event-related potentialstudy. Brain Res. 1121, 1, 150–159.
LEE, H. 2010a. Cangjie Input Methods in 30 Days 2. Foruto. http://input.foruto.com/cccls/cjzd.html.(In Chinese)
LEE, MU. 2010b. A quantitative study of the formation of Chinese characters.http://chinese.exponode.com/0 1.htm. (In Chinese)
LIU, C.-L., LAI, M.-H., CHUANG, Y.-H., AND LEE, C.-Y. 2010. Visually and phonologically similar char-acters in incorrect simplified Chinese words. In Proceedings of the 23rd International Conference onComputational Linguistics (COLING’10). 739–747.
LIU, C.-L., LEE, C.-Y., TSAI, J.-L., AND LEE, C.-L. 2011. Forthcoming. A cognition-based interactive gameplatform for learning Chinese characters. In Proceedings of the 26th ACM Symposium on Applied Com-puting (SAC’11).
LIU, C.-L. AND LIN, J.-H. 2008. Using structural information for identifying similar Chinese characters.In Proceedings of the 46th Annual Meeting of the Association for Computational Linguistics (ACL’08).93–96.
LIU, C.-L., TIEN, K.-W., CHUANG, Y.-H., HUANG, C.-B., AND WENG, J.-Y. 2009a. Two applications oflexical information to computer-assisted item authoring for elementary Chinese. In Proceedings of the22nd International Conference on Industrial Engineering & Other Applications of Applied IntelligentSystems (IEA/AIE’09). 470–480.
LIU, C.-L., TIEN, K.-W., LAI, M.-H., CHUANG, Y.-H., AND WU, S.-H. 2009b. Capturing errors in writ-ten Chinese words. In Proceedings of the 47th Annual Meeting of the Association for ComputationalLinguistics (ACL’09). 25–28.
LIU, C.-L., TIEN, K.-W., LAI, M.-H., CHUANG, Y.-H., AND WU, S.-H. 2009c. Phonological and logographicinfluences on errors in written Chinese words. In Proceedings of the 7th Workshop on Asian LanguageResources (ALR’09). 84–91.
LIU, C.-L., JAEGER, S., AND NAKAGAWA, M. 2004. Online recognition of Chinese characters: The state-of-the-art. IEEE Trans. Patt. Anal. Mach. Intel. 26, 2, 198–213.
LO, M. AND HUE, C.-W. 2008. C-CAT: A computer software used to analyze and select Chinese charactersand character components for psychological research. Behav. Res. Meth. 40, 4, 1098–1105.
MA, W.-Y. AND CHEN, K.-J. 2003. Introduction to CKIP Chinese word segmentation system for the firstinternational Chinese word segmentation bakeoff. In Proceedings of the 2nd SIGHAN Workshop onChinese Language Processing (SIGHAN’03). 168–171.
MANNING, C. D. AND SCHUTZE, H. 1999. Foundations of Statistical Natural Language Processing. TheMIT Press.
MANNING, C. D., RAGHAVAN, P., AND SCHUTZE, H. 2008. Introduction to Information Retrieval. CambridgeUniversity Press.
ACM Transactions on Asian Language Information Processing, Vol. 10, No. 2, Article 10, Publication date: June 2011.
Similar Characters in Incorrect Chinese Words 10:39
MOE 1996. Common errors in Chinese writings (�������). Ministry of Education, Taiwan.http://140.111.34.54/files/site content/M0001/biansz/c9.htm.
SISON, R. AND SHIMURA, M. 1998. Student modeling and machine learning. Int. J. Artif. Intell. Educ. 9, 1,128–158.
SJTUD. 1988. Chinese character code workgroup of Shanghai Jiao Tong University. In A Dictionary ofChinese Character Information. Beijing Science Press (in Chinese).
SONG, R., LIN, M., AND GE, S.-L. 2008. Similarity calculation of Chinese character glyph and its applica-tion in computer aided proofreading system. J. Chin. Comput. Syst. 29, 10, 1964–1968. In Chinese.
SUN, X., CHEN, H., YANG, L., AND TANG, Y. Y. 2002. Mathematical representation of a Chinese characterand its applications. Int. J. Patt. Recog. Artif. Intell. 16, 6, 735–747.
TSAI, J.-L., LEE, C.-Y., LIN, Y.-C., TZENG, O. J.-L., AND HUNG, D. L. 2006. Neighborhood size effects ofChinese words in lexical decision and reading. Lang. Linguist. 7, 3, 659–675.
TSAY, Y.-C. AND TSAY, C.-C. 2003. Diagnoses of Incorrect Chinese Usage (In Chinese). Firefly Publisher.UNICODE. 2010. Unicode Standard 4.0.1, Chapter 11.
http://www.unicode.org/versions/Unicode4.0.0/ch11.pdf.VIRVOU, M., MARAS, D., AND TSIRIGA, V. 2000. Student modelling in an intelligent tutoring for the passive
voice of English language. Educ. Technol. Soc. 3, 4, 139–150.WU, S.-H., CHEN, Y.-Z., YANG, P.-C., KU, T., AND LIU, C.-L. 2010. Reducing the false alarm rate of Chinese
character error detection and correction. In Proceedings of the 1st Joint Conference on Chinese LanguageProcessing (SIGHAN’10). 54–61.
WUBIHUA. 2010. An input method used in mainland China. http://en.wikipedia.org/wiki/Wubihua method.YEH, S.-L. AND LI, J.-L. 2002. Role of structure and component in judgments of visual similarity of Chinese
characters. J. Experi. Psych. Hum. Percept. Perform. 28, 4, 933–947.ZHANG, L., ZHOU, M., HUANG, C., AND PAN, H. 2000. Automatic detecting/correcting errors in Chinese
text by an approximate word-matching algorithm. In Proceedings of the 38th Annual Meeting of theAssociation for Computational Linguistics (ACL’00). 248–254.
ZIEGLER, J. C., TAN, L. H., PERRY, C., AND MONTANT, M. 2000. Phonology matters: The phonologicalfrequency effect in written Chinese. Psychol. Sci. 11, 3, 234–238.
Received September 2010; revised December 2010; accepted January 2011
ACM Transactions on Asian Language Information Processing, Vol. 10, No. 2, Article 10, Publication date: June 2011.