Embed Size (px)
Citation preview
1
Visualizing the topology of mental disorders using self-
organizing feature maps*
Gal Kazas Michael Margaliot†
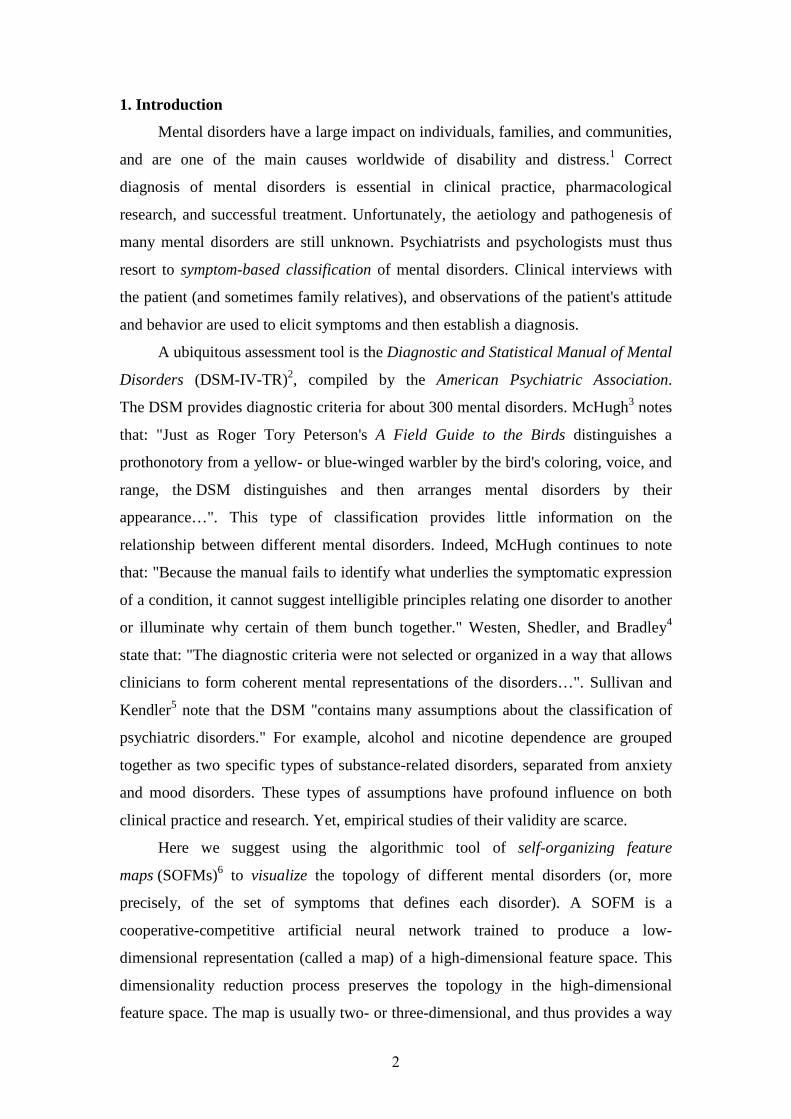
Mental disorders have a large impact on individuals, families, and communities, and are
one of the main causes worldwide of disability and distress. Correct diagnosis of mental
disorders is essential in clinical practice, pharmacological research, and successful
treatment. Unfortunately, the aetiology and pathogenesis of many mental disorders are
still unknown. Psychiatrists must thus resort to classifying disorders according to their
symptoms. This provides little information on the topology of the disorders, that is, how
one disorder relates to another and why certain disorders bunch together. Here we
propose an algorithmic approach for visualizing the topology of mental disorders using
a self organizing feature map (SOFM). A SOFM is a specific type of artificial neural
network that can be trained to produce a low-dimensional representation (called a map)
of a high-dimensional input space. This map preserves the topology of the original input
space. We trained a SOFM to produce a two-dimensional map of 27 relatively well-
known mental disorders. Each disorder is represented by an 82-dimensional input
vector describing the symptoms associated with the disorder, as described in the
Diagnostic and Statistical Manual of Mental Disorders (DSM-IV-TR). The map shows
distinct clusters of mental disorders. Each cluster contains disorders that are similar to
one another, and separate from those in other clusters. This provides a way to clearly
visualize the topology of these mental disorders. We demonstrate three more
applications of the resulting map: automatic classification of disorders based on
apparent symptoms; rigorous estimation of the relative importance of various symptoms
in the diagnostic process; and adding a dimensional component to psychiatric diagnoses.
* Research supported in part by research grants from the Israeli Ministry of Science and the Israeli
Science Foundation (ISF).
† Corresponding author: Dr. Michael Margaliot, School of Elec. Eng.-Systems, Tel Aviv University,
Israel 69978. Tel: +972 3 640 7768; Fax: +972 3 640 5027; Email: [email protected]
2
1. Introduction
Mental disorders have a large impact on individuals, families, and communities,
and are one of the main causes worldwide of disability and distress.1 Correct
diagnosis of mental disorders is essential in clinical practice, pharmacological
research, and successful treatment. Unfortunately, the aetiology and pathogenesis of
many mental disorders are still unknown. Psychiatrists and psychologists must thus
resort to symptom-based classification of mental disorders. Clinical interviews with
the patient (and sometimes family relatives), and observations of the patient's attitude
and behavior are used to elicit symptoms and then establish a diagnosis.
A ubiquitous assessment tool is the Diagnostic and Statistical Manual of Mental
Disorders (DSM-IV-TR)2, compiled by the American Psychiatric Association.
The DSM provides diagnostic criteria for about 300 mental disorders. McHugh3 notes
that: "Just as Roger Tory Peterson's A Field Guide to the Birds distinguishes a
prothonotory from a yellow- or blue-winged warbler by the bird's coloring, voice, and
range, the DSM distinguishes and then arranges mental disorders by their
appearance…". This type of classification provides little information on the
relationship between different mental disorders. Indeed, McHugh continues to note
that: "Because the manual fails to identify what underlies the symptomatic expression
of a condition, it cannot suggest intelligible principles relating one disorder to another
or illuminate why certain of them bunch together." Westen, Shedler, and Bradley4
state that: "The diagnostic criteria were not selected or organized in a way that allows
clinicians to form coherent mental representations of the disorders…". Sullivan and
Kendler5 note that the DSM "contains many assumptions about the classification of
psychiatric disorders." For example, alcohol and nicotine dependence are grouped
together as two specific types of substance-related disorders, separated from anxiety
and mood disorders. These types of assumptions have profound influence on both
clinical practice and research. Yet, empirical studies of their validity are scarce.
Here we suggest using the algorithmic tool of self-organizing feature
maps (SOFMs)6 to visualize the topology of different mental disorders (or, more
precisely, of the set of symptoms that defines each disorder). A SOFM is a
cooperative-competitive artificial neural network trained to produce a low-
dimensional representation (called a map) of a high-dimensional feature space. This
dimensionality reduction process preserves the topology in the high-dimensional
feature space. The map is usually two- or three-dimensional, and thus provides a way
3
to visualize the topology of the high-dimensional space. Our work was motivated by
the idea of semantic maps7 that are SOFMs trained using input sets that represent
abstract data, such as words. Semantic relationships are preserved by the
dimensionality reduction process, so that clusters of points in the low-dimensional
map indicate similarity between the corresponding abstract data points.
To avoid cluttering the results, we selected a small set of 27 relatively well-
known mental disorders listed in the DSM-IV-TR, and trained a SOFM to produce the
corresponding two-dimensional map. Each disorder was represented as a point in
an 82-dimensional input space, corresponding to the symptoms that are/are not
associated with this disorder. The resulting map provides a way to visualize the
relationships between various disorders. Clear clusters of disorders are formed. Each
cluster represents disorders that are similar to one another, and are different from the
disorders in other clusters. This provides a rigorous and algorithmic approach for
studying the topological structure of mental disorders.
We believe that the semantic map may help to address several important
questions in the nosology of mental disorders. To demonstrate this, we describe three
more potential applications of the map. The first is classification of disorders (that
were not necessarily presented during the SOFM training process) based on apparent
symptoms according to their proximity to other disorders on the map. The second is
estimating the relative importance and contribution of a specific symptom in the
diagnostic process. The third is adding a quantitative measure to the diagnosis.
A different yet related field of research is modeling mental disorders using
artificial neural network models. Typically, this is based on building a neural network
model representing a cognitive or neural functioning in a healthy or normal subject,
and then artificially "lesioning" the model or, alternatively, feeding the model with
imbalanced input signals. The goal here is to study various disorders from a
computational point of view. For more details, see the review papers by Levine8 and
Grossberg9, and the volume edited by Reggia, Ruppin, and Berndt.10 Solan and
Ruppin used a SOFM to model confusion in human perception of similar stimuli.11
The remainder of this paper is organized as follows. Section 2 describes the
preliminary step of representing the diagnostic criteria in a form suitable for
algorithmic manipulation. Section 3 reviews the SOFM. Section 4 analyzes the
resulting map. Section 5 describes three more potential applications of the semantic
4
map. Section 6 contains a discussion of the results and some suggestions for further
research.
2. Knowledge representation
Each disorder listed in the DSM-IV-TR is associated with a set of diagnostic
criteria. This set is divided into two subsets: inclusion criteria and exclusion criteria.
The first [second] subset includes symptoms that must [not] be present in order to
qualify for a diagnosis. For example, inclusion criteria for a major depressive episode
include: "depressed mood most of the day nearly every day", and "markedly
diminished interest or pleasure in all, or almost all activities, most of the day nearly
every day...." Exclusion criteria for this disorder include "the symptoms are not due
to the direct physiological effects of a substance (e.g. a drug of abuse, a medication)
or a general medical condition (e.g. hypothyroidism)."‡
To avoid cluttering the results and to make this paper more accessible to people
who are not necessarily mental health professionals, we chose to focus on a small set
of relatively well-known mental disorders. Specifically, we selected 27 disorders
listed in the DSM-IV-TR: (1) Mental retardation; (2) Autistic disorder; (3) Asperger's
disorder; (4) ADHD (combined); (5) Anorexia; (6) Bulimia; (7) Schizophrenia;
(8) Dementia of the Alzheimer's type; (9) Delirium (due to a general medical
condition); (10) Primary insomnia; (11) Primary hypersomnia; (12) Narcolepsy;
(13) Sleepwalking; (14) Alcohol intoxication; (15) Alcohol abuse; (16) Alcohol
withdrawal delirium; (17) Feeding disorder of infancy or early childhood;
(18) Amphetamine induced psychotic disorder; (19) Amphetamine intoxication;
(20) Amphetamine abuse; (21) Amphetamine induced sleep disorder;
(22) Amphetamine induced depressive disorder; (23) Psychotic disorder; (24) Major
depressive disorder; (25) Schizoaffective depressive disorder; (26) Reading disorder;
and (27) Mathematics disorder.
We extracted from the descriptions of the 27 disorders in the DSM-IV-TR a
total of 82 different diagnostic criteria. We represented the criteria for disorder i ,
{1,2,..., 27}i∈ , as a feature vector 82{ 1,0,1}ix ∈ − , where each inclusion criteria is
represented by 1+ , each exclusion criteria by 1− , and irrelevant criteria (i.e. those
‡Hypothyroidism is a disease state caused by insufficient production of thyroid hormone by the thyroid
gland. One possible symptom is depression.

5
that do not appear in the criteria for this disorder at all) by 0 . For example, in our
representation, entry 72 in each feature vector corresponds to "depressed mood most
of the day nearly every day", entry 76 to "drug abuse", and entry 5 to "comma or
stupor". Since inclusion [exclusion] criteria for Major depressive episode include
"depressed mood most of the day nearly every day" ["drug abuse"], the corresponding
feature vector, 23x , satisfies 23(72) 1x = and 23(76) 1x = − . Since "comma or stupor"
is not one of the criteria associated with Major depressive episode, 23(5) 0x = . In this
way, we coded each of the 27 disorders into an 82-dimensional ternary vector.
Roughly speaking, we would like to produce a figure depicting the 27 feature
vectors 1 27,...,x x in order to visualize how they are related to each other. Such a
figure can also be used to classify disorders based on their proximity to the 27 feature
vectors. However, since each of these vectors is of dimension 82, we must first reduce
the dimension of each feature vector to 2 (or 3) in order to plot such a figure. This
dimensionality reduction process should maintain as much as possible of the
topological relations between the original 82-dimensional vectors. We trained
an SOFM to yield such a map in 2R .
3. The SOFM
A SOFM, pioneered by Teuvo Kohonen,12 is a type of artificial neural network
that can be trained to produce a discretized low-dimensional representation of the
input space of the training samples. A SOFM utilizes the idea of a neighborhood
function to preserve the topological properties of the input space. SOFMs are a
flexible tool for visualizing and clustering high-dimensional data based on the low-
dimensional representation.13
3.1 SOFM structure
Our SOFM consists of 225 artificial neurons organized in a planar 15 15× grid.
Neuron i , {1,2,..., 255}i∈ , has a location vector 2ir R∈ describing its position (row
and column) in the planar grid. For example, the neuron on the lower left [upper right]
corner of the grid has (1,1)ir = [ (15,15)ir = ]. The distance between two neurons i
and j is defined as: || ||i jr r− , where || ||⋅ denotes the Euclidean norm. For example,
the distance between the neuron on the lower left corner of the grid and that on the
6
upper right corner is 2 2(1,1) (15,15) ( 14) ( 14) 14 2.− = − + − = We say that two
neurons are close [far] if the distance between them is small [large].
Each neuron also has a weight vector. We use iw to denote the weight vector of
neuron i . The dimension of the weight vectors is equal to that of the feature vectors,
so in our case 82iw R∈ for each {1,2,..., 255}i∈ . The weight vectors (or simply
weights) are adapted during a learning process. The learning procedure we
implemented is rather standard and is described in Appendix A. All the simulations
were performed using the MATLAB software. We refer to the SOFM after training is
completed as the trained SOFM
4. The resulting map
We presented the 27 symptom vectors to the trained SOFM and found the
winning neuron for each vector. For example, neuron 67 is the winning neuron for
Mental retardation. The weight vector 67w (which is an 82-dimensional vector)
cannot be easily visualized. The location of neuron 67 in the planar 15 15× grid
is 67 (7,5)r = . Thus, we associate location (7,5) in the grid with Mental retardation.
When this is done for the winning neuron for each of the 27 disorders, we obtain the
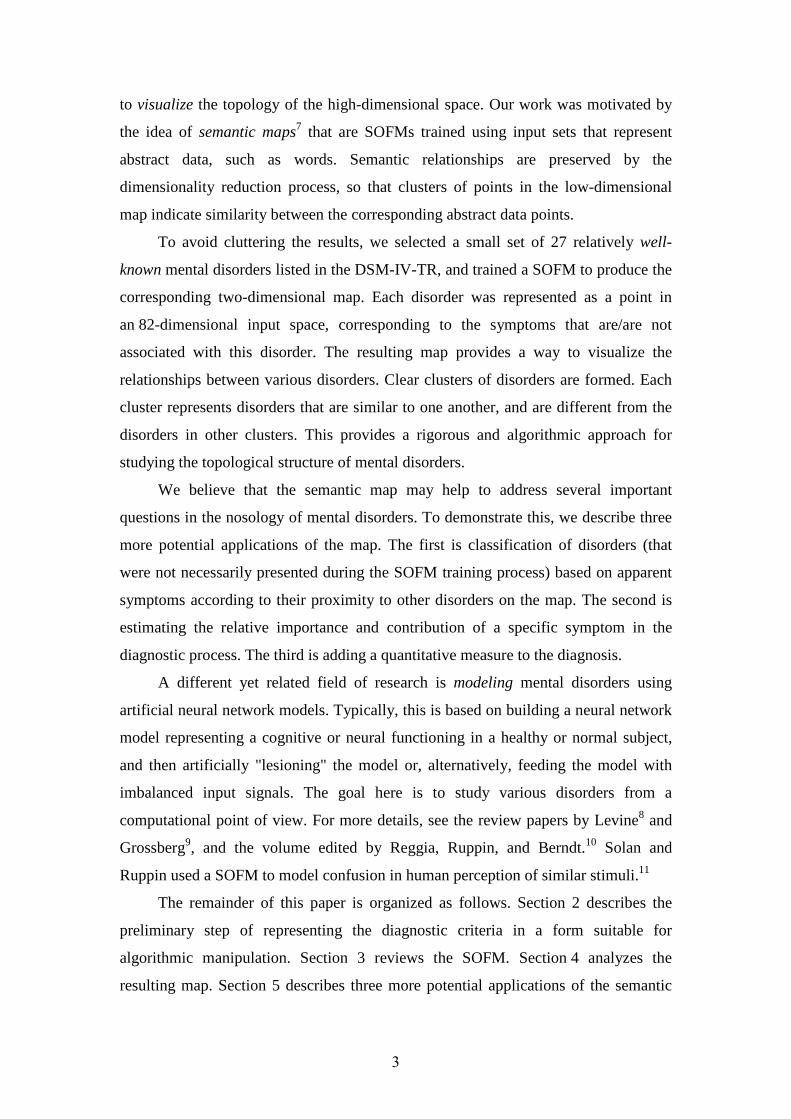
map depicted in Fig. 1.
Fig. 1: SOFM map after training. Only the winning neurons for
the 27 disorders are shown.
16
Feeding disorder of infancy
or early childhood
2 4 6 8 10 12 14 0
2
4
6
8
10
12
14
16
Mental retardation
Autistic disorder
Asperger's disorder
ADHD (combined)
Anorexia
Bulimia Schizophrenia
Dementia of the Alzheimer's type
Delirium
Primary insomnia
Primary hypersomnia
Narcolepsy Sleepwalking
Alcohol
intoxication
Alcohol abuse
Amphetamine induced
psychotic disorder
Amphetamine
intoxication
Amphetamine abuse
Amphetamine induced sleep disorder
Amphetamine induced depressive disorder
Psychotic disorder
Major depressive disorder
Schizoaffective depressive disorder
Reading disorder
Mathematics disorder
Alcohol withdrawal delirium
7
Here the location of each winning neuron is plotted on the 15 15× grid and
labeled with the name of the corresponding disorder.
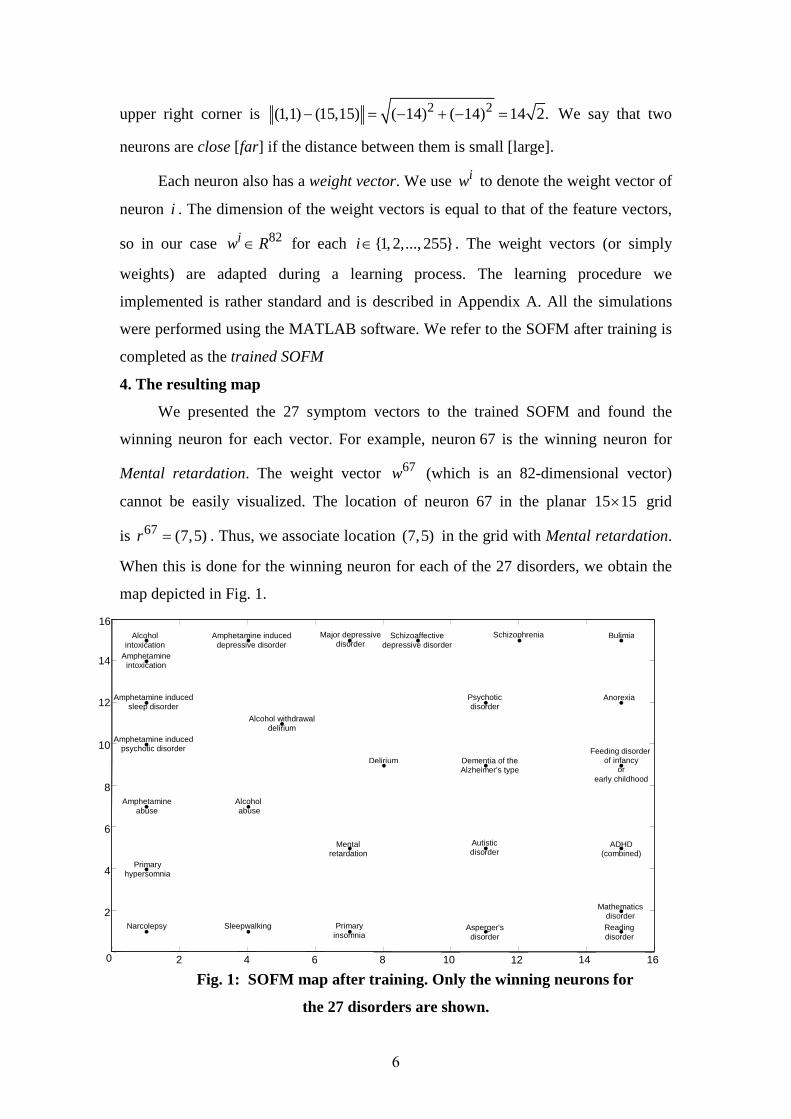
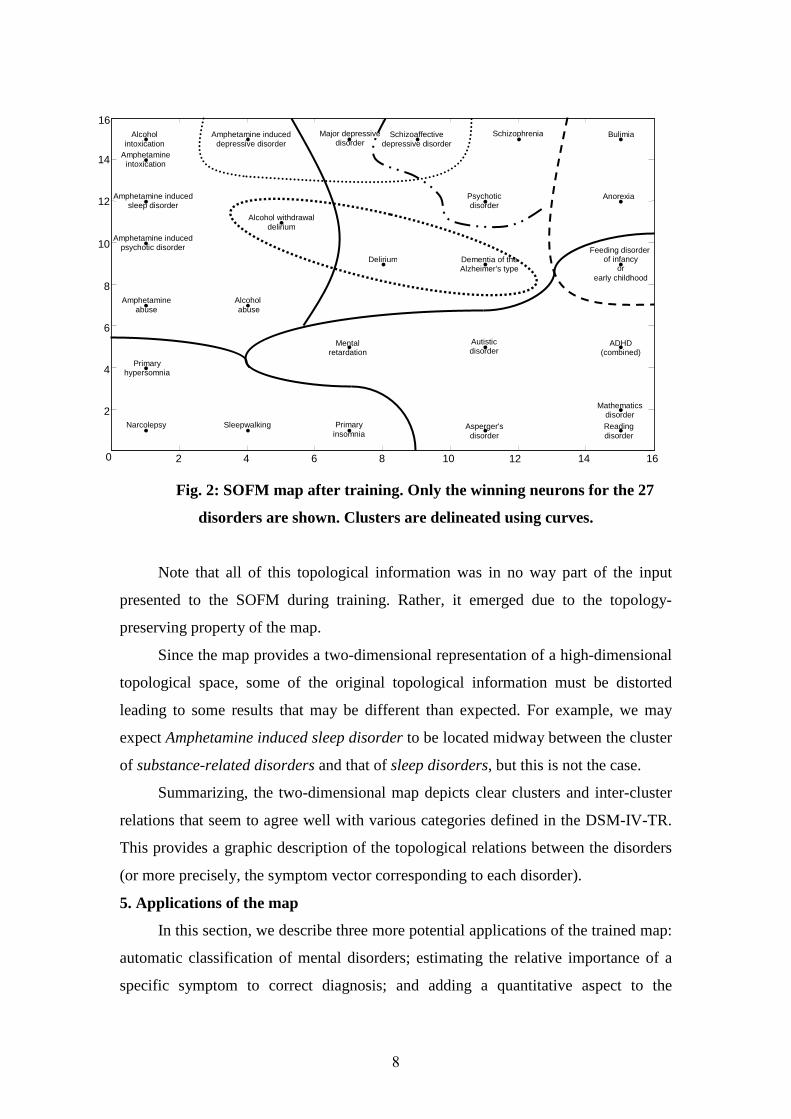
The map allows us to visualize the topological relationships between the
disorders. Distinct clusters of related disorders can be observed. To demonstrate this,
Fig. 2 depicts the map with the different clusters manually delineated using curves.
The lower right part of Fig. 2 shows disorders belonging to the DSM category
"disorders usually first diagnosed in childhood, or adolescence." These include:
Mental retardation; Autistic disorder; Asperger's disorder; ADHD (combined);
Feeding disorder of infancy or early childhood; Reading disorder; and Mathematics
disorder. Within this cluster we see two separate sub-clusters: learning disorders
(including Reading disorder and Mathematics disorder), and pervasive developmental
disorders (Asperger's disorder and Autistic disorder), with the distinct ADHD and
Mental retardation nearby.
In the top right corner, we see a cluster containing eating disorders including
Anorexia, Bulimia, and Feeding disorder of infancy or early childhood. It is
interesting to note that the latter is located at the lower part of this cluster close to the
other childhood disorders.
At the bottom left corner, we see a cluster of sleep disorders including Primary
insomnia; Primary hypersomnia; Narcolepsy and Sleepwalking.
A cluster of substance-related disorders (including Alcohol intoxication;
Alcohol abuse; Alcohol withdrawal delirium; Amphetamine induced psychotic
disorder; Amphetamine intoxication; Amphetamine abuse; Amphetamine induced
sleep disorder; Amphetamine induced depressive disorder) appears at the top left
corner. Note that this includes two distinct pairings: Alcohol abuse and Amphetamine
abuse are close to each other, as are Alcohol intoxication and Amphetamine
intoxication.
At the top of the central portion of Fig. 2, we see the Major depressive disorder;
to its left the Amphetamine induced depressive disorder connects it to the cluster of
substance-related disorders. To its right lies the Schizoaffective depressive disorder
that connects it to two other psychotic disorders: Schizophrenia and Psychotic
disorder. Finally in the center we find a cluster of cognitive disorders including
Dementia of the Alzheimer's type, Delirium, with Alcohol withdrawal delirium
relating them to the cluster of Substance related disorders.
8
Fig. 2: SOFM map after training. Only the winning neurons for the 27
disorders are shown. Clusters are delineated using curves.
Note that all of this topological information was in no way part of the input
presented to the SOFM during training. Rather, it emerged due to the topology-
preserving property of the map.
Since the map provides a two-dimensional representation of a high-dimensional
topological space, some of the original topological information must be distorted
leading to some results that may be different than expected. For example, we may
expect Amphetamine induced sleep disorder to be located midway between the cluster
of substance-related disorders and that of sleep disorders, but this is not the case.
Summarizing, the two-dimensional map depicts clear clusters and inter-cluster
relations that seem to agree well with various categories defined in the DSM-IV-TR.
This provides a graphic description of the topological relations between the disorders
(or more precisely, the symptom vector corresponding to each disorder).
5. Applications of the map
In this section, we describe three more potential applications of the trained map:
automatic classification of mental disorders; estimating the relative importance of a
specific symptom to correct diagnosis; and adding a quantitative aspect to the
16
Feeding disorder of infancy
or early childhood
2 4 6 8 10 12 14 0
2
4
6
8
10
12
14
16
Mental retardation
Autistic disorder
Asperger's disorder
ADHD (combined)
Anorexia
Bulimia Schizophrenia
Dementia of the Alzheimer's type
Delirium
Primary insomnia
Primary hypersomnia
Narcolepsy Sleepwalking
Alcohol intoxication
Alcohol abuse
Amphetamine induced
psychotic disorder
Amphetamine
intoxication
Amphetamine abuse
Amphetamine induced sleep disorder
Amphetamine induced depressive disorder
Psychotic disorder
Major depressive disorder
Schizoaffective depressive disorder
Reading disorder
Mathematics disorder
Alcohol withdrawal delirium
9
diagnostic process. These applications are directly related to important questions in
the nosology of mental disorders and received considerable attention in the literature.
5.1 Automatic classification of mental disorders
Psychiatric diagnoses are derived according to clinical interviews and human
expert opinion rather than biological findings. Recently, this symptom-based
classification approach is attracting considerable criticism. It may take decades of
professional training to develop the required diagnosis expertise. Diagnosis is further
complicated by diagnostic comorbidity (i.e. several disorders occurring together) that
is prevalent in psychiatry.14
Empirical studies of the diagnostic stability of psychiatric disorders suggest a
worrisome proportion of inaccurate diagnoses. Baca-Garcia et al.15 analyzed data on
patients that were diagnosed several times and found that the temporal consistency of
mental disorders diagnosis was poor. Shear et al.16 compared the diagnoses in clinical
charts to those obtained using the Structured Clinical Interview for DSM-IV (SCID)
and found that clinical and SCID diagnoses had poor agreement.
Designing an automatic tool that can assist in the diagnosis of mental disorders
is a desirable goal. One example in this direction is the Mood Assessment
Program (MAP).17 The MAP is a computerized assessment program designed to
assist general physicians with the diagnosis and management of mood disorders.
The MAP uses decision rules based on clinical expertise to analyze information
provided by the patient, and then generates a report that includes a possible diagnosis
and treatment suggestions. Other examples of automatic classification tools include an
algorithm for identification of schizophrenia based on the lexical and syntactical
features of patients' written text,18 and an algorithm for distinguishing between
Alzheimer's disease, mild cognitive impairment, and normal aging based on magnetic
resonance images of the hippocampus.19
The trained SOFM may also be used for assisting in the classification of mental
disorders. The basic idea is to question the patient for a set of symptoms, represent
these as an input vector, present it to the trained SOFM, and plot the location of the
winning neuron on the map. The position of the wining neuron with respect to other
disorders, already marked on the map, provides important information that can assist
in the diagnostic process.
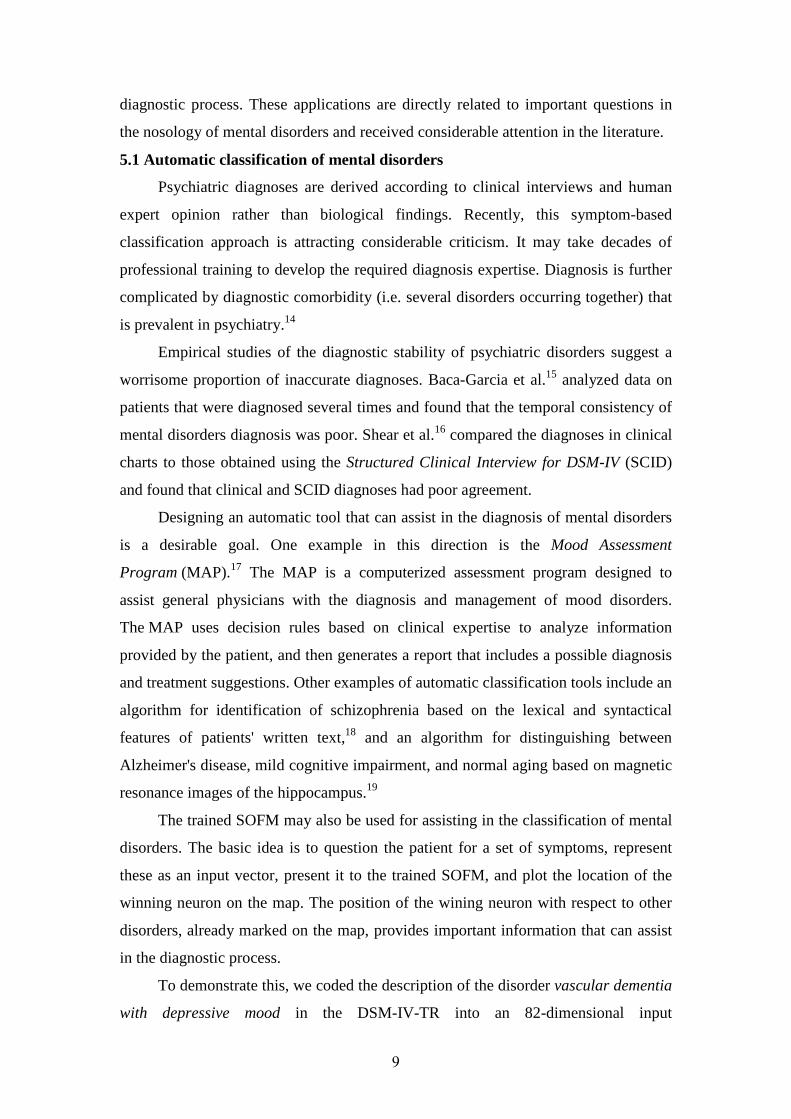
To demonstrate this, we coded the description of the disorder vascular dementia
with depressive mood in the DSM-IV-TR into an 82-dimensional input
10
vector 28 82{ 1,0,1} .x ∈ − Note that this vector was not presented during the training
process of the SOFM. Fig. 3 depicts the location of the winning neuron for this input
vector. It may be seen that the winning neuron is close to the winning neuron for
Dementia of Alzheimer's type, and is not far from the winning neurons for the
depression related disorders. This seems reasonable as vascular dementia is in fact
the second most common form of dementia after Alzheimer's disease. This simple
experiment suggests that the map may indeed provide relevant information for the
diagnostic process.
Fig. 3: SOFM response for the symptom vector of vascular dementia
with depressive mood.
5.2 Estimating the importance and relevance of a symptom for correct diagnosis
Many mental disorders are associated with a functional impairment (or
disability). This refers to decrements in performing daily-life tasks due to the disorder.
Reaching a diagnosis (and determining its level of severity) using the DSM-IV-TR
depends on functional disabilities. For example, severe disability in Major depressive
disorder is defined as "clear-cut, observable disability (e.g., inability to work or care
for children)."
16
Feeding disorder of infancy
or early childhood
2 4 6 8 10 12 14 0
2
4
6
8
10
12
14
16
Mental retardation
Autistic disorder
Asperger's disorder
ADHD (combined)
Anorexia
Bulimia Schizophrenia
Dementia of the Alzheimer's type
Delirium
Primary insomnia
Primary hypersomnia
Narcolepsy Sleepwalking
Alcohol intoxication
Alcohol abuse
Amphetamine induced
psychotic disorder
Amphetamine
intoxication
Amphetamine abuse
Amphetamine induced sleep disorder
Amphetamine induced depressive disorder
Psychotic disorder
Major depressive disorder
Schizoaffective depressive disorder
Reading disorder
Mathematics disorder
Alcohol withdrawal delirium
Vascular dementia with depressed mood

11
There is a considerable on-going debate about whether functional impairment
on its own is a valid diagnostic criterion for a mental disorder. Ustun and Kennedy20
suggest that "no functioning or disability should appear as part of the threshold of the
diagnosis" of any disorder. Reasons for this include: (1) the definition of disability is
rather "fuzzy", it depends on the interaction between a person and the environment,
and varies between different societies and cultures; (2) many disabilities may be due
to normal variations in traits such as intelligence and shyness, and it is not the
disability itself but how it is caused that makes it pathological.21
The SOFM approach provides an algorithmic testbed for evaluating the role of a
specific symptom (or a specific set of symptoms) in determining the topology of the
disorders. This can be done by eliminating the specific symptom from all the feature
vectors, training a SOFM using the modified vectors, and comparing the resulting
map with the original one. By analyzing the topological relationships in the original
and modified maps, it is possible to gain information on the importance of the specific
symptom. If the symptom plays a minor or redundant role, the overall topology of the
disorders should not change much, whereas deleting a symptom that is important
should lead to a severely distorted map. Furthermore, studying which specific clusters
of disorders were affected may shed light on the symptom's capability of
discriminating between similar disorders.
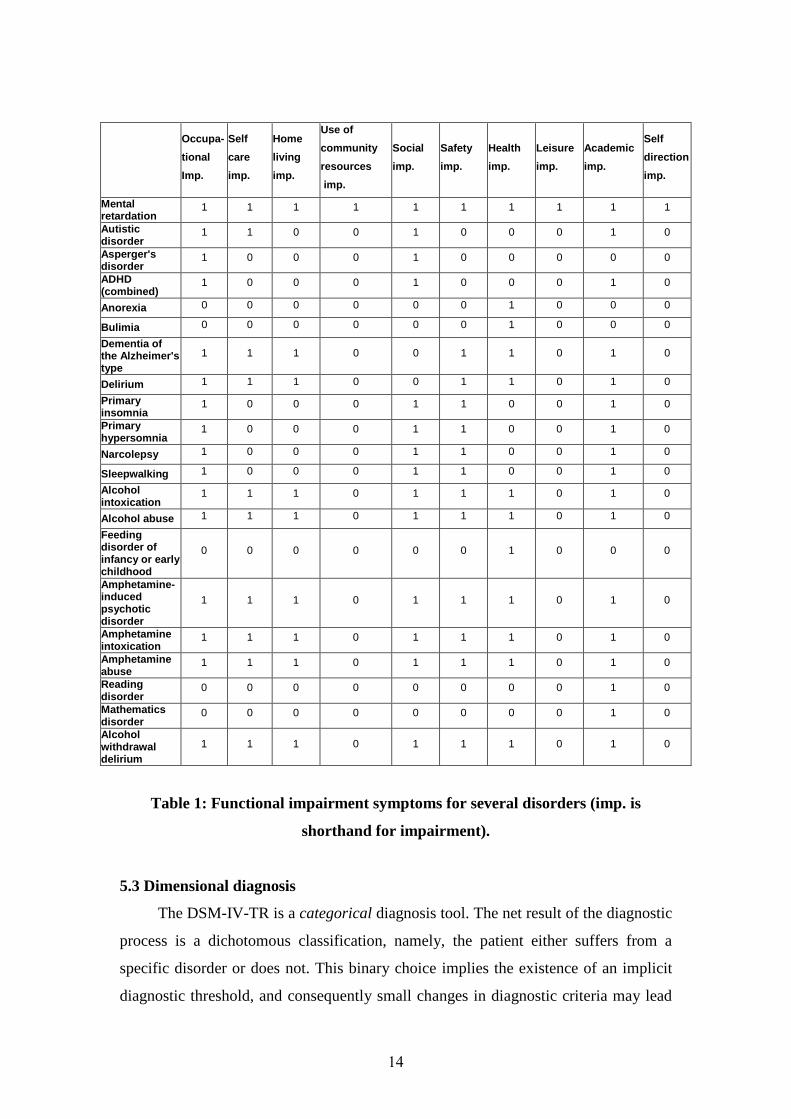
To demonstrate this, we eliminated the 10 features related to functional
impairment from all our 82-dimensional symptom vectors. Theses features are:
occupational impairment, self care impairment, use of community resources
impairment, health impairment, home living impairment, social impairment, safety
impairment, leisure impairment, academic impairment, and self direction impairment.
We trained a new SOFM, using precisely the same training procedure, but with the set
of 72-dimentional vectors. The resulting map is depicted in Fig. 4.
Note that when comparing two maps, the measure of distortion is not the
absolute location of the disorders on the map, but rather the forms of clusters that
appear on the map and their relations.
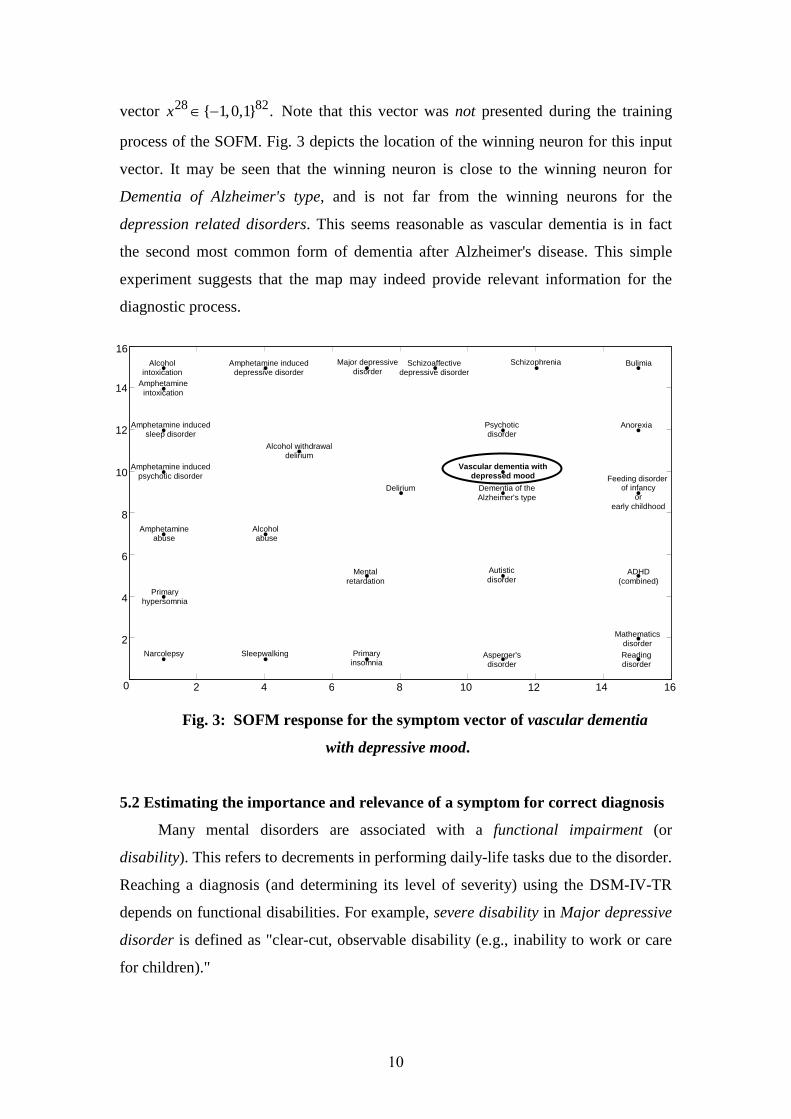
It may be seen that all of the clusters that appeared previously appear on the
new map as well. However, the topological locations of Alcohol abuse, Amphetamine
abuse, Dementia of the Alzheimer's type, and Feeding disorder of infancy or early
childhood have changed. Amphetamine abuse and Alcohol abuse may now be found
in the bottom right corner of the map. This pair now shares a single neuron that is
12
isolated from the other disorders and, surprisingly, is as far as possible from the
cluster of substance-related disorders.
Fig. 4: Map of a SOFM trained without 10 functional impairment features.
Disorders that are no longer placed in the original clusters are marked
in bold.
To explain this, we examined the symptom vectors of the substance-related
disorders, and found that in the DSM-IV-TR there is no generic unifying symptom
such as, say, alcohol- or amphetamine-related. The reason for this is the implicit
assumption that the clinician performing the diagnosis is aware of this information
beforehand. In other words, the fact that a disorder is related to, say, alcohol appears
in the title of the disorder, but not as a specific symptom. The SOFM, that only uses
the symptom vectors as input, cannot recognize the relationship between such
disorders. The reason that these disorders were previously clustered together
successfully is that their impairment symptoms share a common pattern (see Table 1).
Yet, once these impairment symptoms are deleted, the SOFM fails to identify the
topological relationship between these disorders.
The other changes in the map can be explained in a similar manner. For
example, Feeding disorder of infancy or early childhood now appears in the upper
right corner, among the other disorders diagnosed in childhood. It no longer bridges
16 2 4 6 8 10 12 14 0
2
4
6
8
10
12
14
16 Feeding disorder of infancy
or early childhood
Mental retardation
Autistic disorder
Asperger's disorder
ADHD (combined)
Anorexia Bulimia
Schizophrenia Dementia of the Alzheimer's type
Delirium
Primary insomnia
Primary hypersomnia
Narcolepsy
Sleepwalking
Amphetamine induced
psychotic disorder
Amphetamine
intoxication
Amphetamine induced depressive disorder
Psychotic disorder
Major depressive disorder
Reading disorder
Mathematics disorder
Amphetamine induced sleep disorder
Schizoaffective Depressive
disorder
Alcohol
intoxication
Alcohol withdrawal
delirium
Amphetamine abuse
Alcohol
abuse
13
the gap between the cluster of childhood disorders and the two tightly paired eating
disorders. An examination of the feature vectors shows that indeed Feeding disorder
of infancy or early childhood and Anorexia and Bulimia share only one feature other
than their pattern of functional impairments.
It is interesting to note that although we eliminated a substantial share of the
data describing each disorder (10 features out of 82), the topological map was not
substantially distorted. Experiments with deleting other features demonstrate a major
distortion in the resulting map. This may suggest that the functional impairment
criteria do not play a critical role in establishing the topological relationships between
the disorders.
14
Self
direction
imp.
Academic
imp.
Leisure
imp.
Health
imp.
Safety
imp.
Social
imp.
Use of
community
resources
imp.
Home
living
imp.
Self
care
imp.
Occupa-
tional
Imp.
1 1 1 1 1 1 1 1 1 1 Mental retardation
0 1 0 0 0 1 0 0 1 1 Autistic disorder
0 0 0 0 0 1 0 0 0 1 Asperger's disorder
0 1 0 0 0 1 0 0 0 1 ADHD (combined)
0 0 0 1 0 0 0 0 0 0 Anorexia
0 0 0 1 0 0 0 0 0 0 Bulimia
0 1 0 1 1 0 0 1 1 1 Dementia of the Alzheimer's type
0 1 0 1 1 0 0 1 1 1 Delirium
0 1 0 0 1 1 0 0 0 1 Primary insomnia
0 1 0 0 1 1 0 0 0 1 Primary hypersomnia
0 1 0 0 1 1 0 0 0 1 Narcolepsy
0 1 0 0 1 1 0 0 0 1 Sleepwalking
0 1 0 1 1 1 0 1 1 1 Alcohol intoxication
0 1 0 1 1 1 0 1 1 1 Alcohol abuse
0 0 0 1 0 0 0 0 0 0
Feeding disorder of infancy or early childhood
0 1 0 1 1 1 0 1 1 1
Amphetamine-induced psychotic disorder
0 1 0 1 1 1 0 1 1 1 Amphetamine intoxication
0 1 0 1 1 1 0 1 1 1 Amphetamine abuse
0 1 0 0 0 0 0 0 0 0 Reading disorder
0 1 0 0 0 0 0 0 0 0 Mathematics disorder
0 1 0 1 1 1 0 1 1 1 Alcohol withdrawal delirium
Table 1: Functional impairment symptoms for several disorders (imp. is
shorthand for impairment).
5.3 Dimensional diagnosis
The DSM-IV-TR is a categorical diagnosis tool. The net result of the diagnostic
process is a dichotomous classification, namely, the patient either suffers from a
specific disorder or does not. This binary choice implies the existence of an implicit
diagnostic threshold, and consequently small changes in diagnostic criteria may lead
15
to substantially different diagnoses. As noted by Helzer et al.,22 identified cases in the
general population tend to aggregate near the diagnostic threshold. In clinical
applications, this may translate into treating patients with minimal need on the one
hand, and denying treatment from patients who clearly need it on the other hand. A
possible remedy is adding a dimensional component to official taxonomies such as
the DSM-IV-TR, namely, a diagnosis-specific quantitative score.23
The SOFM map can also be used to provide a dimensional and easy to visualize
component to the diagnosis. Consider, for example, a patient diagnosed as suffering
from, say, Schizophrenia. The vector representing this patient's symptoms may be
presented to the trained map. Let i denote the number of the winning neuron for this
input vector, and let j denote the number of the neuron on the map that is the
winning neuron for Schizophrenia. One may view jw as a "prototype" of (the
symptoms associated with) Schizophrenia. The distances || ||i jw w− or || ||i jr r−
then provide a quantitative measure for how far the patient is from this prototype. The
advantage of the second measure of distance is that it allows easy visualization by
plotting the locations of neurons ,i j on the two-dimensional grid.
To demonstrate this, we introduced three synthetic input vectors
denoted ,Ax ,Bx and Cx that are all modifications of the symptom vector
corresponding to Schizophrenia 8x . Ax is closest to 8x . The only difference is
that 8(71) 0x = whereas (71) 1Ax = . In our representation, feature 71 corresponds to
the symptom "recurrent thoughts of death, recurrent suicidal ideation, attempt or
plan". In other words, Ax corresponds to an (imaginary) patient whose symptoms are
identical to the symptoms characterizing Schizophrenia except for the addition of the
symptom "recurrent thoughts of death, recurrent suicidal ideation, attempt or plan".
The vector Bx is identical to Ax except for modifying entries 2 and 3, corresponding
to "psychomotor disturbance" and "anxiety", respectively, from 0 to 1, and changing
entries 25 and 24, corresponding to "grossly disorganized or catatonic behaviour" and
"disorganized speech", respectively, from 1 to 1− . Cx is identical to Bx except for
modifying entries 23, 26, 27, 28, and 33, corresponding to "hallucinations", "affective
flattening", "alogia", "avolition", and "disturbance in executive functioning",
respectively, from 1 to 0.
16
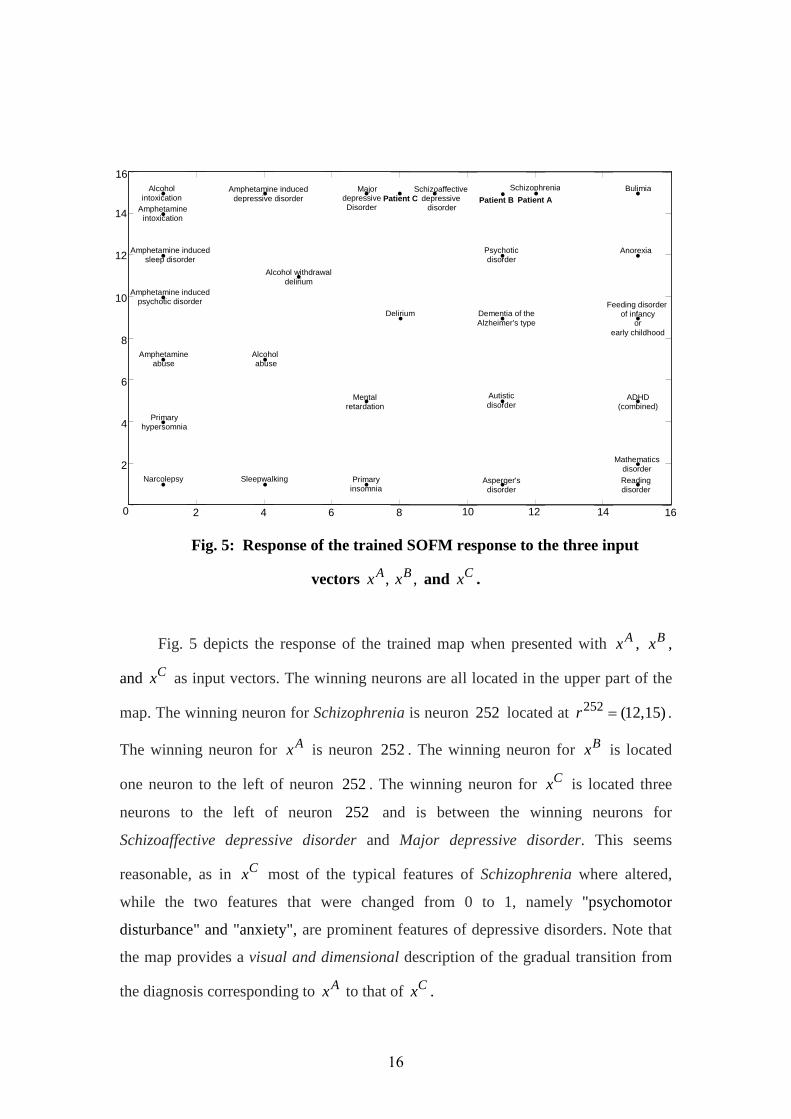
Fig. 5: Response of the trained SOFM response to the three input
vectors ,Ax ,Bx and Cx .
Fig. 5 depicts the response of the trained map when presented with Ax , Bx ,
and Cx as input vectors. The winning neurons are all located in the upper part of the
map. The winning neuron for Schizophrenia is neuron 252 located at 252 (12,15)r = .
The winning neuron for Ax is neuron 252. The winning neuron for Bx is located
one neuron to the left of neuron 252. The winning neuron for Cx is located three
neurons to the left of neuron 252 and is between the winning neurons for
Schizoaffective depressive disorder and Major depressive disorder. This seems
reasonable, as in Cx most of the typical features of Schizophrenia where altered,
while the two features that were changed from 0 to 1, namely "psychomotor
disturbance" and "anxiety", are prominent features of depressive disorders. Note that
the map provides a visual and dimensional description of the gradual transition from
the diagnosis corresponding to Ax to that of Cx .
Patient C
Feeding disorder of infancy
or early childhood
2 4 6 8 0
2
4
6
8
10
12
14
16
Mental retardation
Autistic disorder
Asperger's disorder
ADHD (combined)
Anorexia
Bulimia Schizophrenia
Dementia of the Alzheimer's type
Delirium
Primary insomnia
Primary hypersomnia
Narcolepsy Sleepwalking
Alcohol intoxication
Alcohol abuse
Amphetamine induced
psychotic disorder
Amphetamine
intoxication
Amphetamine abuse
Amphetamine induced
sleep disorder
Amphetamine induced depressive disorder
Psychotic disorder
Major depressive Disorder
Schizoaffective depressive disorder
Reading disorder
Mathematics disorder
Alcohol withdrawal delirium
Patient A Patient B
10 12 14 16
17
6. Discussion
The contemporary symptom-based diagnosis approach in psychiatry leads to
difficult nosological questions.24 For example, which behavioral or psychological
syndromes should be categorized as mental disorders? What is the relationship
between various disorders? Why do some disorders group together? How can one
estimate the importance of a symptom for the correct diagnosis of a disorder?
More specifically, many researches challenged the validity of categories of
mental disorders that appear in the DSM. For example, Langenbucher et al.25 refer to
substance abuse (which is a milder version of substance dependence) as a "category
without content".
Many of these problems could be clarified by developing a better understanding
of the topology of mental disorders. We described here for the first time an
algorithmic approach for visualizing the relationships between mental disorders (or,
more precisely, of the set of symptoms associated with each disorder). We used an
SOFM for the dimensionality reduction process. There are, of course other (and
perhaps more modern) dimensionality reduction algorithms, but our main point here is
the novel application rather than the specific algorithmic tool.
As a proof of concept, we trained a semantic map using 27 relatively well-
known disorders. The resulting map demonstrates clear clusters of disorders that are
separated from other clusters. We also demonstrated how the map can be used to
address other important questions in the nosology of psychiatric disorders, including
automatic classification of mental disorders; estimating the importance of various
symptoms in the diagnostic process; and adding a dimensional component to the
diagnosis.
Directions for further research include: developing a map depicting all the 300
disorders listed in the DSM-IV-TR, incorporating biological symptoms (e.g. EEG
data), and using other dimensionality reduction algorithms (e.g. Laplacian
eigenmaps26). Another intriguing question is how to incorporate into the topological
map a point representing a healthy individual.
We believe that tools from the field of computational intelligence have a huge,
and still largely unexplored, potential in the field of psychiatry.

18
Acknowledgements. We are grateful to Yaniv Assaf, Moshe Koppel, Ron Meir, and Eytan Ruppin for helpful comments. Appendix A: Learning procedure
At each learning step, one of the feature vectors is selected and presented to
the SOFM as an input vector x . A winner neuron *i is determined such that:
*i jw x w x− ≤ − , for all {1,2,...,225}j ∈ .
Intuitively, the neurons "compete" among themselves, and the winning neuron is the
one whose weight vector is most similar to the input vector x .
Each of the weight vectors is then adapted according to:
i i iw w w← +∆ ,
where
*( , )( )i i i iw D r r x wρ∆ = − .
Here 0ρ > is the learning rate, and
2**
2( , ) exp( )
2
i ii i
r rD r r
σ
−= − is a neighborhood
function . Note that *( , )i iD r r monotonically decreases with the distance between the
two vectors ir and *ir . In other words, for the winning neuron and for neurons that
are close to it, the weight is adapted so that it becomes more similar to the input
vectorx , whereas the weight vectors of neurons that are far from the winning neuron
remain almost unchanged. Intuitively, neurons that are close to each other (in terms of
their r values) "cooperate" to form distinct topological neighborhoods based on
mutual similarity of their weight vectors.
We presented the 27 symptom vectors (corresponding to the 27 mental
disorders) to the SOFM in a cyclic manner for a total of 100,000mk = learning steps.
The parameters ρ and σ are updated at each learning step k according to:
/
00
/
00
( ) ,
( ) ,
m
m
k kf
k kf
k
k
ρρ ρ
ρ
σσ σ
σ
=
=

19
with 0 0.8ρ = , 0.01fρ = , 0 10.5σ = , and 0.5fσ = .27 Note that since 0
1fρ
ρ< , ( )kρ
decreases monotonically from 0
0 00
(1)fρρ ρ ρ
ρ
≈ =
to
1
00
( )f
m fkρ
ρ ρ ρρ
= =
.
The parameter ( )kσ behaves similarly with 0(1)σ σ≈ and ( )m fkσ σ= . In other
words, in the initial learning steps the weight updates are large, and encompass a wide
neighborhood of the winning neuron. As learning progresses, the updates become
smaller, and more concentrated near the winning neuron.
Initial weight vector values were drawn randomly from the uniform
distribution [ 0.5,0.5]U − . For the sake of consistency, the same random seed was used
throughout the various simulation conditions described below.
20
References
1 T. B. Ustun, "The global burden of mental disorders", American Journal of Public
Health, 89: 1315-1318, 1999. 2 Diagnostic and Statistical Manual of Mental Disorders, 4th ed., text revision (DSM-
IV-TR). American Psychiatric Association, Washington DC, 2000. 3 P. R. McHugh, "Striving for coherence: Psychiatry's efforts over classification",
Journal of the American Medical Association (JAMA), 293: 2526-2528, 2005. 4 D. Westen, J. Shedler, and R. Bradley, "A prototype approach to personality
disorder diagnosis", American Journal of Psychiatry, 163:846-856, 2006. 5 P. F. Sullivan and K. S. Kendler. "Typology of common psychiatric syndromes",
British Journal of Psychiatry, 173: 312-319, 1998. 6 T. Kohonen. Self-Organizing Maps, 3rd ed. Springer, Berlin, 2001.
7 H. Ritter and T. Kohonen, “Self-organizing semantic maps”, Biological Cybernetics,
61: 241-254, 1989. 8 D. S. Levine, "Neural network modeling of emotion", Physics of Life Reviews, 4: 37-63, 2007. 9 S. Grossberg, "The imbalanced brain: from normal behavior to schizophrenia",
Biological Psychiatry, 48: 81–98, 2000. 10 J. A. Reggia, E. Ruppin, and R. Berndt (editors), Neural Network Modeling of Brain
Disorders. World Scientific, 1996. 11 Z. Solan and E. Ruppin, "Similarity in perception: a window to brain development
and organization", J. Cognitive Neuroscience, 13:18-20, 2001. 12 T. Kohonen, “Self-organized formation of topologically correct feature maps”,
Biological Cybernetics, 43: 59-69, 1982. 13 J. Vesanto and E. Alhoniemi. "Clustering the self-organizing map", IEEE
Transactions on Neural Networks, 11: 586-600, 2000. 14 R. F. Krueger. "Continuity of axes I and II: toward a unified model of personality,
personality disorders, and clinical disorders", Journal of Personality Disorders, 19: 233–261, 2005. 15 E. Baca-Garcia, M. M. Perez-Rodriguez, I. Basurte-Villamor, A. L. Fernandez Del
Moral, M. A. Jimenez-Arriero, J. L. Gonzalez De Rivera, J. Saiz-Ruiz and M. A. Oquendo, "Diagnostic stability of psychiatric disorders in clinical practice", British Journal of Psychiatry, 190: 210-216, 2007. 16 M. K. Shear, C. Greeno, J. Kang, D. Ludewig, E. Frank, H. A. Swartz and M.
Hanekamp, "Diagnosis of nonpsychotic patients in community clinics", American Journal of Psychiatry, 157: 581-587, 2000. 17 G. B. Parker, K. Fletcher and M. P. Hyett, "The mood assessment program: a
computerised diagnostic tool for deriving management plans for mood disorders", The Medical Journal of Australia, 188 (12 Suppl.): S126-S128, 2008. 18 R. D. Strous, M. Koppel, J. Fine, S. Nahaliel, G. Shaked, A. Z. Zivotofsky,
"Automated characterization and identification of schizophrenia in writing", Journal of Nervous and Mental Disease, 197: 585-588, 2009. 19 O. Colliot, G. Chetelat, M. Chupin, B. Desgranges, B. Magnin, H. Benali, B.
Dubois, L. Garnero, F. Eustache, and S. Lehericy, "Discrimination between Alzheimer disease, mild cognitive impairment, and normal aging by using automated segmentation of the hippocampus", Radiology, 248: 194-201, 2008. 20 B. Ustun and C. Kennedy, "What is “functional impairment”? Disentangling disability from clinical significance", World Psychiatry, 8: 82-85, 2009.

21
21 J. C. Wakefield, "Disability and diagnosis: should role impairment be eliminated
from DSM/ICD diagnostic criteria?", World Psychiatry, 8: 87-88, 2009. 22 J. E. Helzer, L. N. Robins, L. T. McEvoy, E. L. Spitznagel, R. K. Stoltzman, A.
Farmer, and I. F. Brockington, "A comparison of clinical and diagnostic interview schedule diagnoses: physician reexamination of lay-interviewed cases in the general population", Archives of General Psychiatry, 42 :657-666, 1985. 23 J. E. Helzer, H. C. Kraemer and R. F. Krueger, "The feasibility and need for
dimensional psychiatric diagnoses", Psychological Medicine, 36: 1671-1680, 2006. 24 R. Kendell and A. Jablensky, "Distinguishing between the validity and utility of
psychiatric diagnoses", American Journal of Psychiatry, 160: 4-12, 2003. 25 J. W. Langenbucher, C. S. Martin, D. S. Hasin and J. E. Helzer, "Alcohol abuse:
Adding content to category", Alcoholism: Clinical and Experimental Research, 20 (8 Suppl.): 270A–275A, 1996. 26 M. Belkin and P. Niyogi, "Laplacian eigenmaps for dimensionality reduction and
data representation", Neural Computation, 15: 1373-1396, 2003. 27 M. H. Hassoun. Fundamentals of Artificial Neural Networks. MIT Press, 1995.