Embed Size (px)
DESCRIPTION
Visualization Tools for Adaptive Mesh Refinement Data. Gunther H. Weber 1 , Vincent E. Beckner 1 , Hank Childs 2 , Terry J. Ligocki 1 , Mark C. Miller 2 , Brian Van Straalen 1 and E. Wes Bethel 1 1 Lawrence Berkeley National Laboratory 2 Lawrence Livermore National Laboratory. Outline. - PowerPoint PPT Presentation
Citation preview

Visualization Tools for Adaptive Mesh Refinement
Data
Gunther H. Weber1, Vincent E. Beckner1, Hank Childs2, Terry J. Ligocki1, Mark C. Miller2, Brian
Van Straalen1 and E. Wes Bethel11Lawrence Berkeley National Laboratory
2Lawrence Livermore National Laboratory

Current State of the Art in Adaptive Mesh Refinement Visualization
Outline
• Introduction to Berger-Colella AMR
• Visualization of Scalar AMR Data
• Specialized AMR Visualization Tools
• Visualization Tools with AMR Support
• Short overview of VisIt
Current State of the Art in Adaptive Mesh Refinement Visualization
Adaptive Mesh Refinement
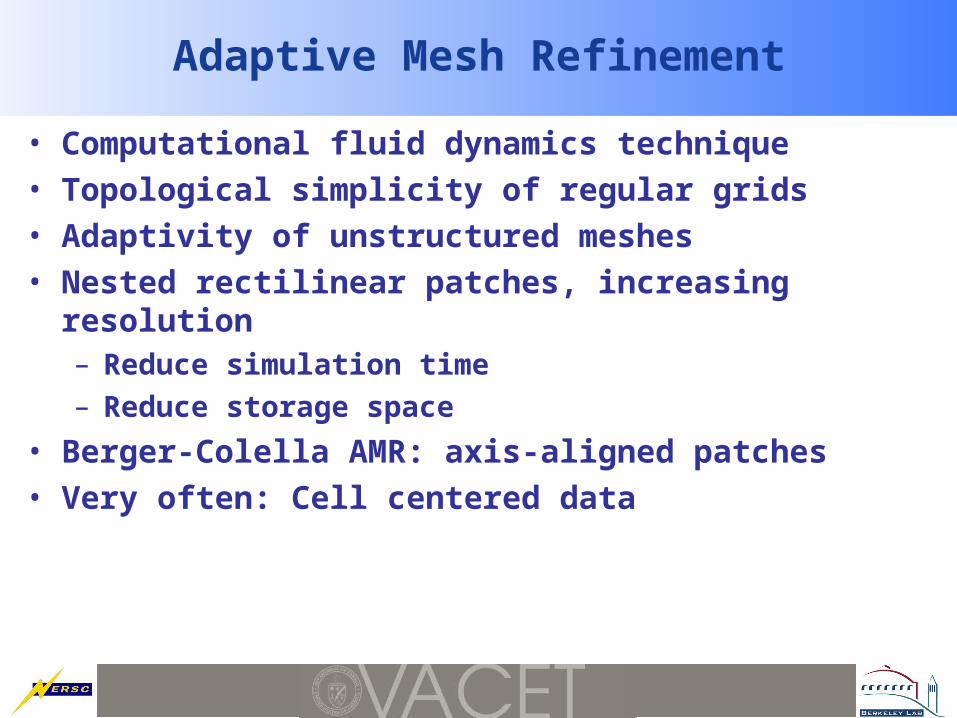
• Computational fluid dynamics technique• Topological simplicity of regular grids• Adaptivity of unstructured meshes• Nested rectilinear patches, increasing resolution
– Reduce simulation time
– Reduce storage space
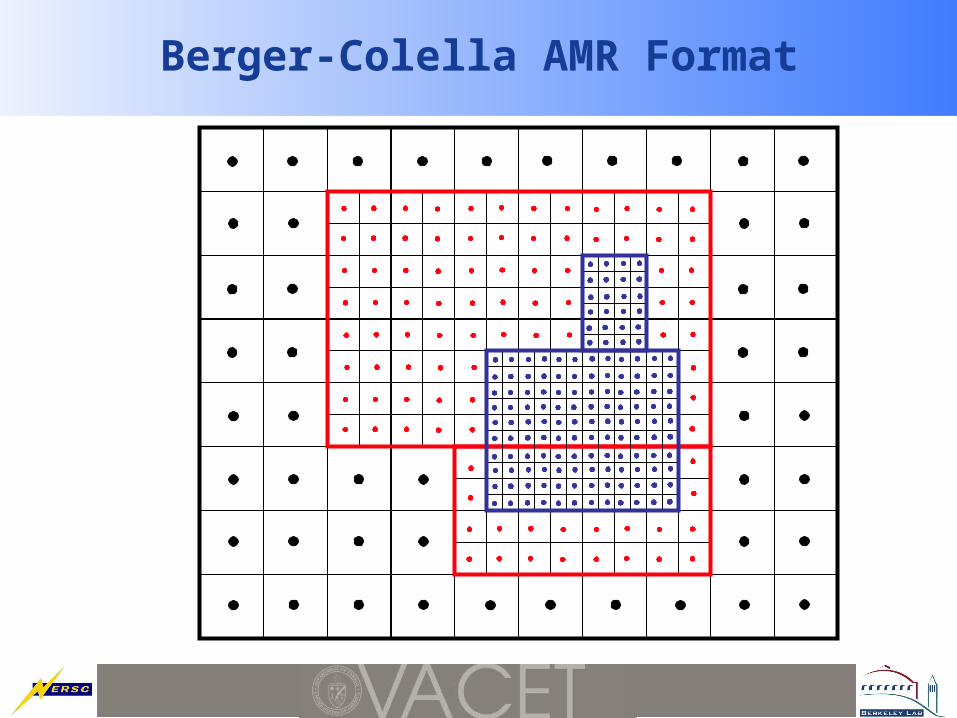
• Berger-Colella AMR: axis-aligned patches• Very often: Cell centered data
Current State of the Art in Adaptive Mesh Refinement Visualization
Berger-Colella AMR Format

Current State of the Art in Adaptive Mesh Refinement Visualization
Effective Visualization of Scalar AMR Data
Hierarchical AMR simulation
Isosurfaces
“Direct Volume Rendering”
Aim: Use inherently hierarchical structure for efficient visualization
Visuali
zatio
n
Visualization
•Extraction of continuous “crack-free” isosurfaces
•Effective utilization of the hierarchy for efficient rendering
•Good interpolation functions
Current State of the Art in Adaptive Mesh Refinement Visualization
AMR Visualization ‒ In the Beginning
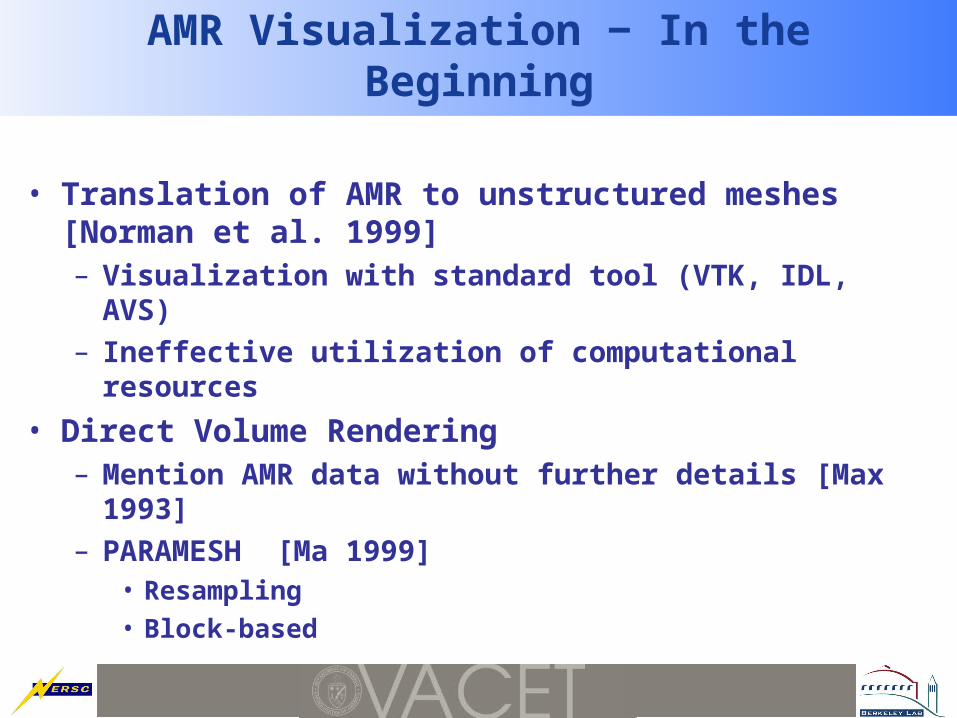
• Translation of AMR to unstructured meshes [Norman et al. 1999]– Visualization with standard tool (VTK, IDL, AVS)
– Ineffective utilization of computational resources
• Direct Volume Rendering– Mention AMR data without further details [Max 1993]
– PARAMESH [Ma 1999]• Resampling• Block-based

Isosurfaces
Current State of the Art in Adaptive Mesh Refinement Visualization
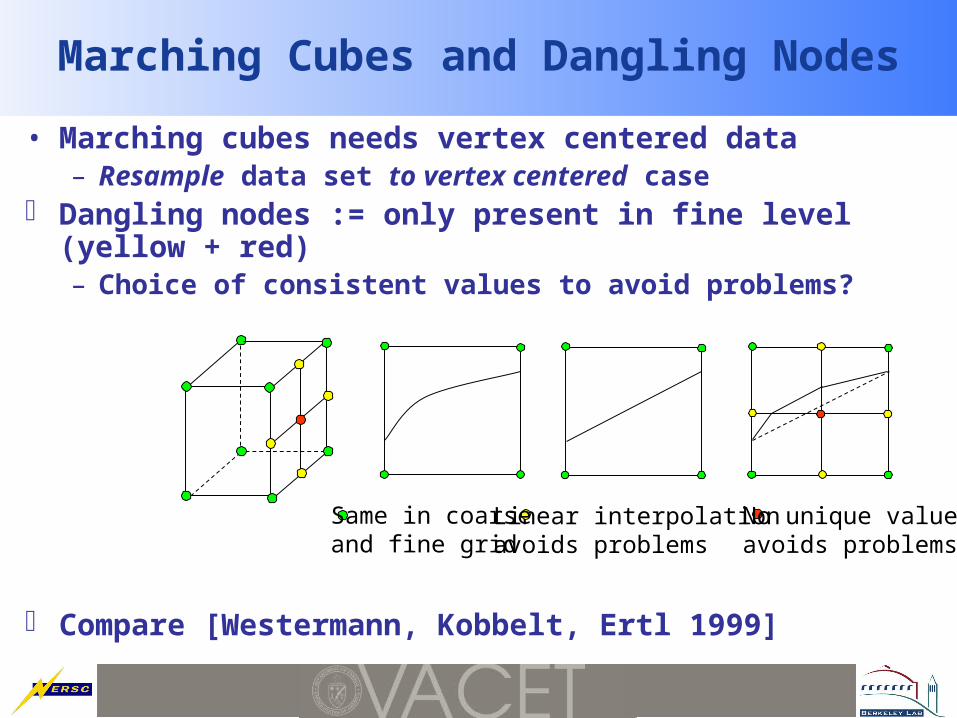
• Marching cubes needs vertex centered data– Resample data set to vertex centered case
Dangling nodes := only present in fine level (yellow + red)– Choice of consistent values to avoid problems?
Compare [Westermann, Kobbelt, Ertl 1999]
Linear interpolationavoids problems
Marching Cubes and Dangling Nodes
Same in coarseand fine grid
No unique valueavoids problems

Current State of the Art in Adaptive Mesh Refinement Visualization
Previous Crack-fixing Solutions
• Mostly in context of Octree-based hierarchies• [Shu et al., 1995]: Create polygon to fit crack• [Shekhar et al., 1996]: Collapse polyline to line• [Westermann et al., 1999]: Create triangle fan
[Shekar et al., 1996] [Westermann et al., 1999]

Current State of the Art in Adaptive Mesh Refinement Visualization
First Approach: Use of Dual Grids
• “Avoid interpolation whenever possible!”
Avoid interpolation apart from linear interpolation along edges, which is part of marching cubes
• Use dual grid := grid formed by connecting cell centers

Current State of the Art in Adaptive Mesh Refinement Visualization
Dual Grid – Original Grid

Current State of the Art in Adaptive Mesh Refinement Visualization
Dual Grids

Current State of the Art in Adaptive Mesh Refinement Visualization
Advantages of Dual Grid Approach
• Use of values original data for marching cubes
• No dangling nodes
• Instead: Gaps between hierarchy levels!
Fill those gaps with stitch cells

Current State of the Art in Adaptive Mesh Refinement Visualization
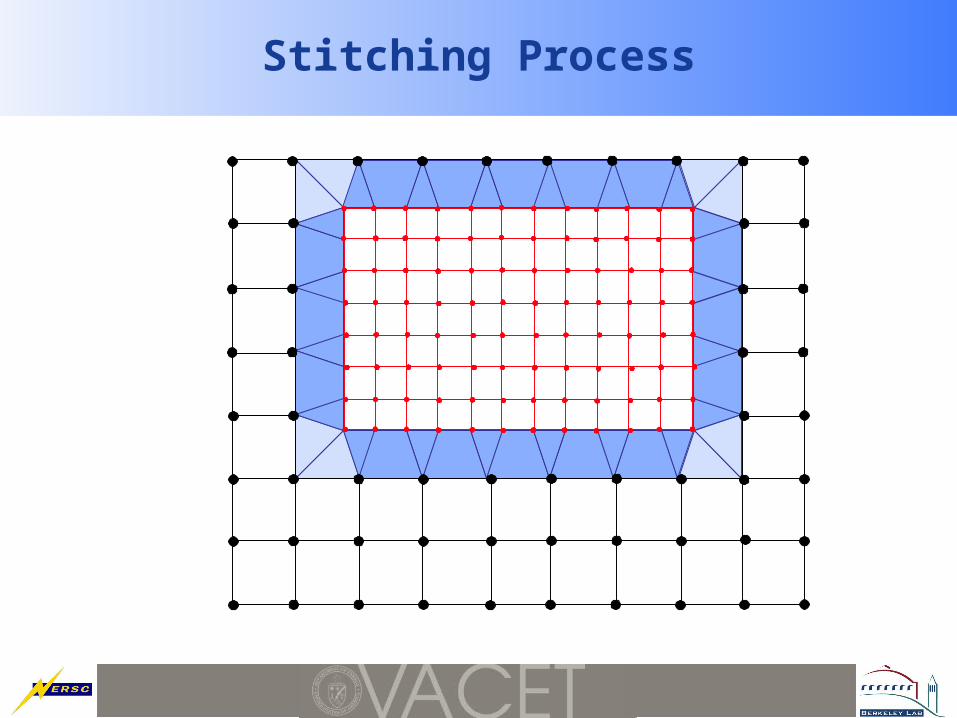
Stitching the Gaps
• Tessellation scheme for filling the gap between two hierarchy levels
• Constraints– Only gap region is tessellated
– The complete gap region is tessellated
– Only vertices, edges and complete faces are shared
In 3D space: Cannot use tetrahedra because cells must share quadrilaterals as faces
Current State of the Art in Adaptive Mesh Refinement Visualization
Stitching Process

Current State of the Art in Adaptive Mesh Refinement Visualization
Stitch Cells – 3D Case
Cell Faces
Cell Edges Cell Vertices
Fine patchCoarse patch

Current State of the Art in Adaptive Mesh Refinement Visualization
First Results
Coarse Patch Stitch Cells Fine Patch
AMR simulation of star cluster formation Root level 32x32x32
[Data set: Greg Bryan, Theoretical Astronomy Group, MIT]

Current State of the Art in Adaptive Mesh Refinement Visualization
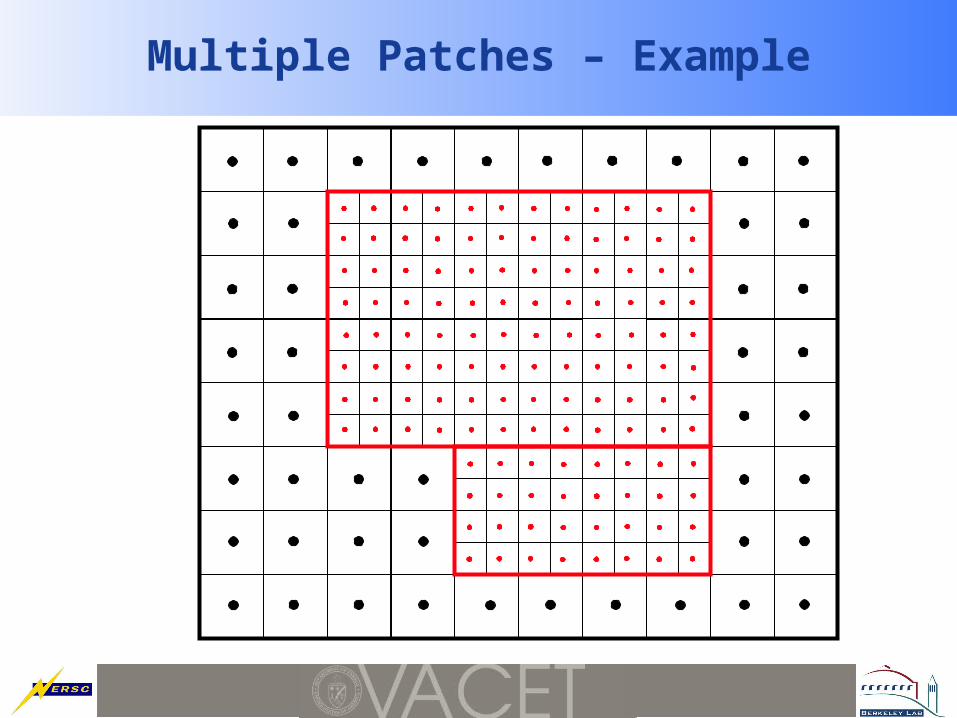
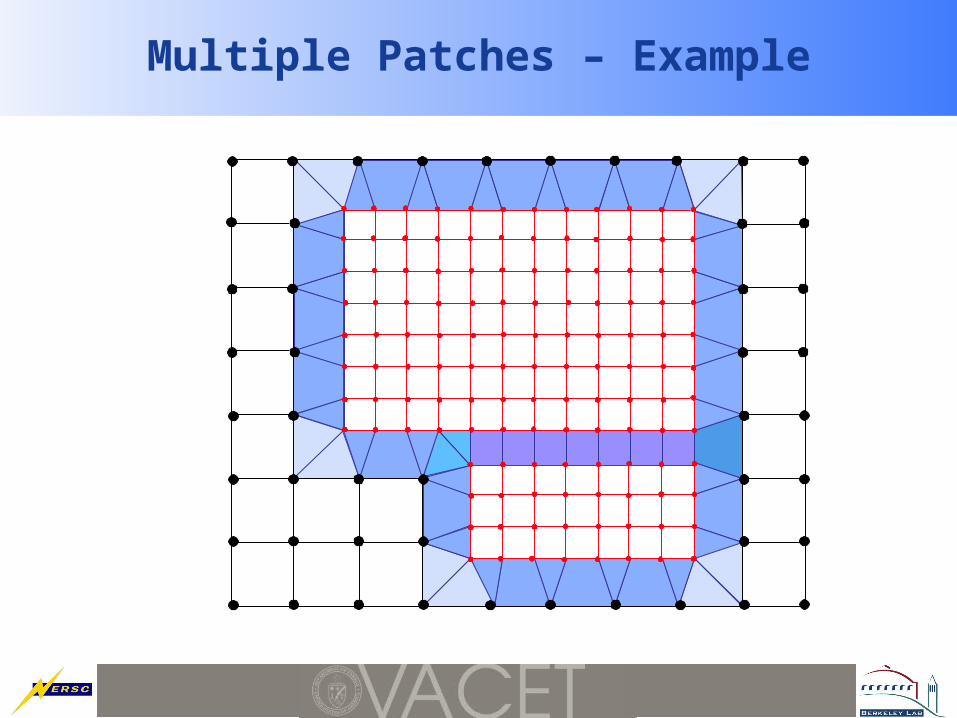
Multiple Patches
• Multiple patches can be connected using the same scheme
• However: Special care must be taken with adjacent fine patches.
• Must “merge” adjacent grids (i. e., “upgrade” edges to quadrilaterals and vertices to edges)
Current State of the Art in Adaptive Mesh Refinement Visualization
Multiple Patches – Example

Current State of the Art in Adaptive Mesh Refinement Visualization
Multiple Patches – Example
Current State of the Art in Adaptive Mesh Refinement Visualization
Multiple Patches – Example

Current State of the Art in Adaptive Mesh Refinement Visualization
Multiple Patches – Fine Edge to Coarse Edges
All coarse grid points unrefined
Two neighboring coarse grid points refined
Two diagonally opposed coarse grid points refined
All coarse grid points refined
Fine patchCoarse patch

Current State of the Art in Adaptive Mesh Refinement Visualization
Isosurface - One Level
AMR simulation of star cluster formation Root level 32x32x32
[Data set: Greg Bryan, Theoretical Astronomy Group, MIT]

Current State of the Art in Adaptive Mesh Refinement Visualization
Isosurface - Two Levels
AMR simulation of star cluster formation First levelStitch cells (1/2)Second level

Current State of the Art in Adaptive Mesh Refinement Visualization
Isosurface - Three Levels
AMR simulation of star cluster formation
First levelStitch cells (1/2)Second levelStitch cells (2/3)Third level

Current State of the Art in Adaptive Mesh Refinement Visualization
Second Approach: Keep Grid
• Vertex/node centered data• Retain “identity” of cells (debugging)• Subdivide boundary cells into pyramids
– Eliminates “non-linear” hanging nodes
– Standard isosurface techniques for pyramids

Current State of the Art in Adaptive Mesh Refinement Visualization
2D Case
• Forms basis of 3D case• Split cell faces to eliminate hanging nodes along edges• Obtain values at newly created hanging by linear
interpolation

Current State of the Art in Adaptive Mesh Refinement Visualization
2D Results
Extracted contour
Cells due to added samples

Current State of the Art in Adaptive Mesh Refinement Visualization
3D Cell Face Subdivision
• Subdivide lower-resolution cell face to match higher resolution face
• Subdivide cell face to eliminate hanging nodes

Current State of the Art in Adaptive Mesh Refinement Visualization
3D Cell Subdivision
• Subdivide cell into pyramids with common apex point
Current State of the Art in Adaptive Mesh Refinement Visualization
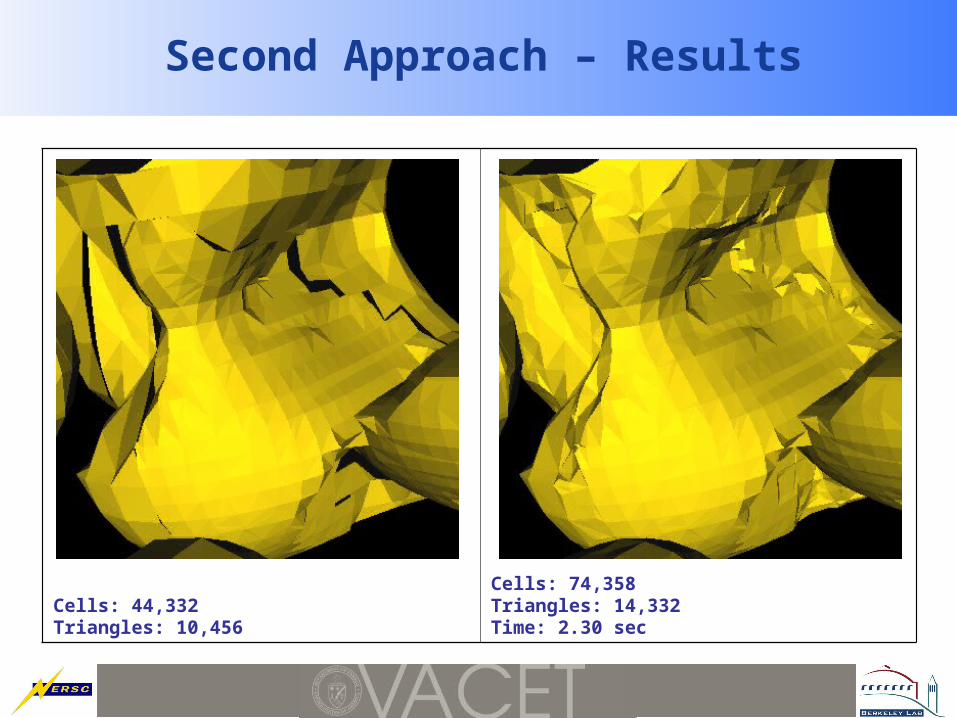
Second Approach – Results
Cells: 44,332Triangles: 10,456
Cells: 74,358Triangles: 14,332 Time: 2.30 sec
Current State of the Art in Adaptive Mesh Refinement Visualization
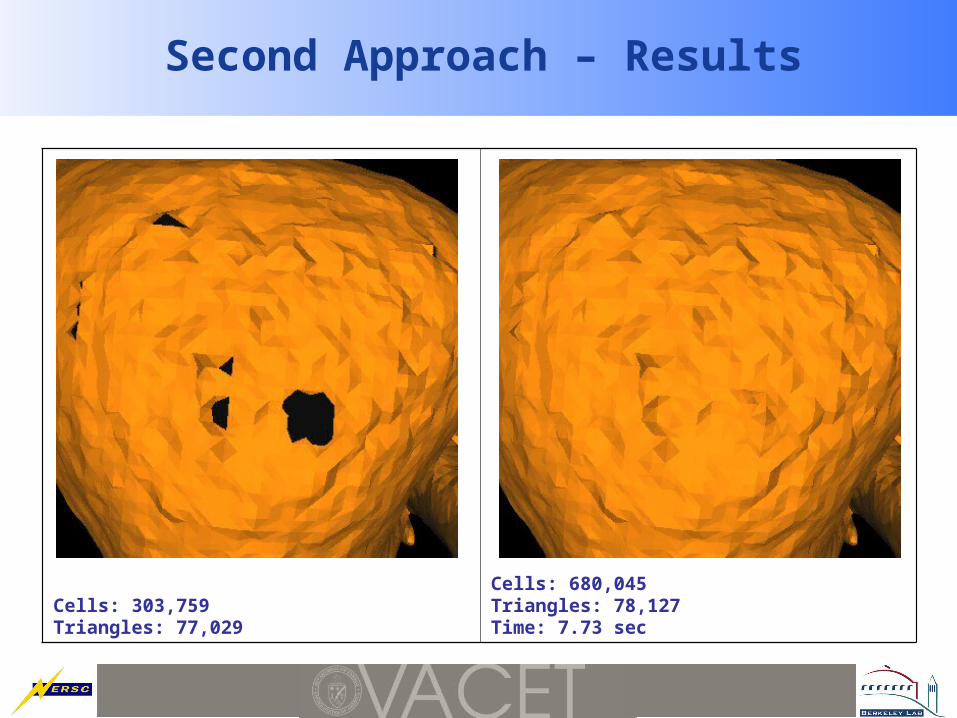
Second Approach – Results
Cells: 303,759Triangles: 77,029
Cells: 680,045Triangles: 78,127 Time: 7.73 sec
Volume Rendering

Current State of the Art in Adaptive Mesh Refinement Visualization
Hardware-accelerated Preview of AMR Data
• Interactive DVR for choosing view point and transfer function
• Subdivide data set in regions of constant resolution
AMR Partition Tree (generalized kD-tree)
• Traverse “AMR Partition tree” and render regions using hardware-accelerated DVR

Current State of the Art in Adaptive Mesh Refinement Visualization
Homogenization

Current State of the Art in Adaptive Mesh Refinement Visualization
Homogenization

Current State of the Art in Adaptive Mesh Refinement Visualization
Homogenization

Current State of the Art in Adaptive Mesh Refinement Visualization
Homogenization

Current State of the Art in Adaptive Mesh Refinement Visualization
Partition Tree – Example
PN
CU PN PN CU
CU CR CU CU CR CR CU
PNCU PN
PN = Partition node along one axisCU = Completely unrefined regionCR = Completely refined region = Transition to next level

Current State of the Art in Adaptive Mesh Refinement Visualization
Hardware-accelerated Rendering – Interactive
AMR simulation of star cluster formation Root level 32x32x32
[Data set: Greg Bryan, Theoretical Astronomy Group, MIT]

Current State of the Art in Adaptive Mesh Refinement Visualization
Hardware-accelerated Rendering – Maximum Quality
AMR simulation of star cluster formation Root level 32x32x32
[Data set: Greg Bryan, Theoretical Astronomy Group, MIT]

Current State of the Art in Adaptive Mesh Refinement Visualization
• Use “cell projection” [Ma & Crockett 1997] to display individual patches
• Traverse patches and construct ray segments [object space based]
• Ma & Crockett: Sort ray segments
High-quality DVR of AMR Data

Current State of the Art in Adaptive Mesh Refinement Visualization
Bilinear Linear
Interpolation
• Nearest neighbor (constant) interpolation ➔ debugging• Piecewise Linear Method (PLM) ➔ Discontinuities• Dual grids (trilinear) and stitch cells
Current State of the Art in Adaptive Mesh Refinement Visualization
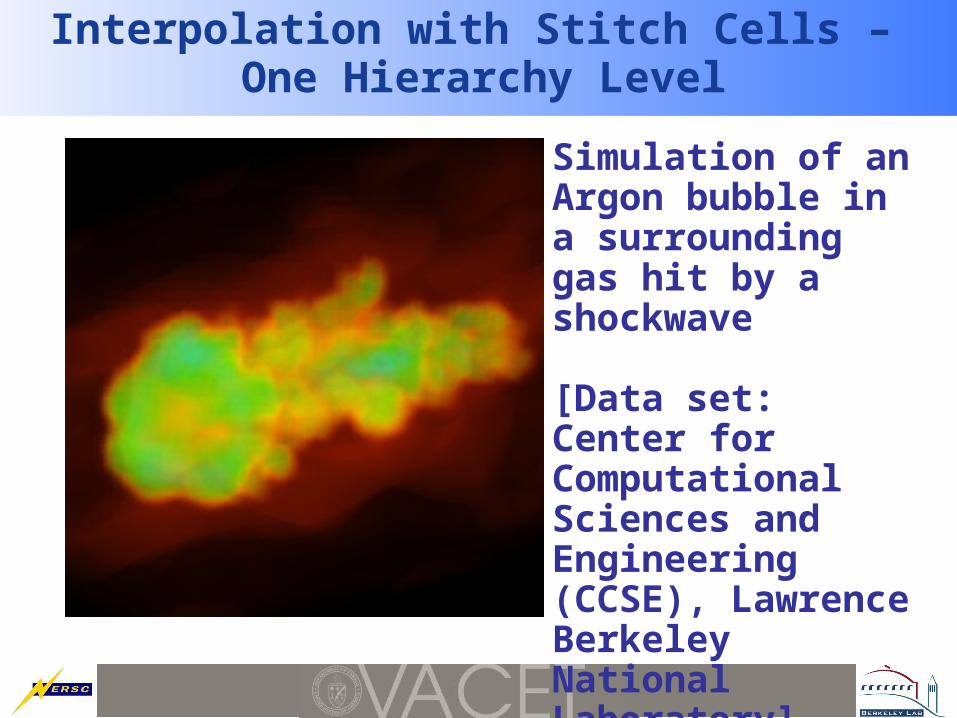
Interpolation with Stitch Cells – One Hierarchy Level
Simulation of an Argon bubble in a surrounding gas hit by a shockwave
[Data set: Center for Computational Sciences and Engineering (CCSE), Lawrence Berkeley National Laboratory]
Current State of the Art in Adaptive Mesh Refinement Visualization
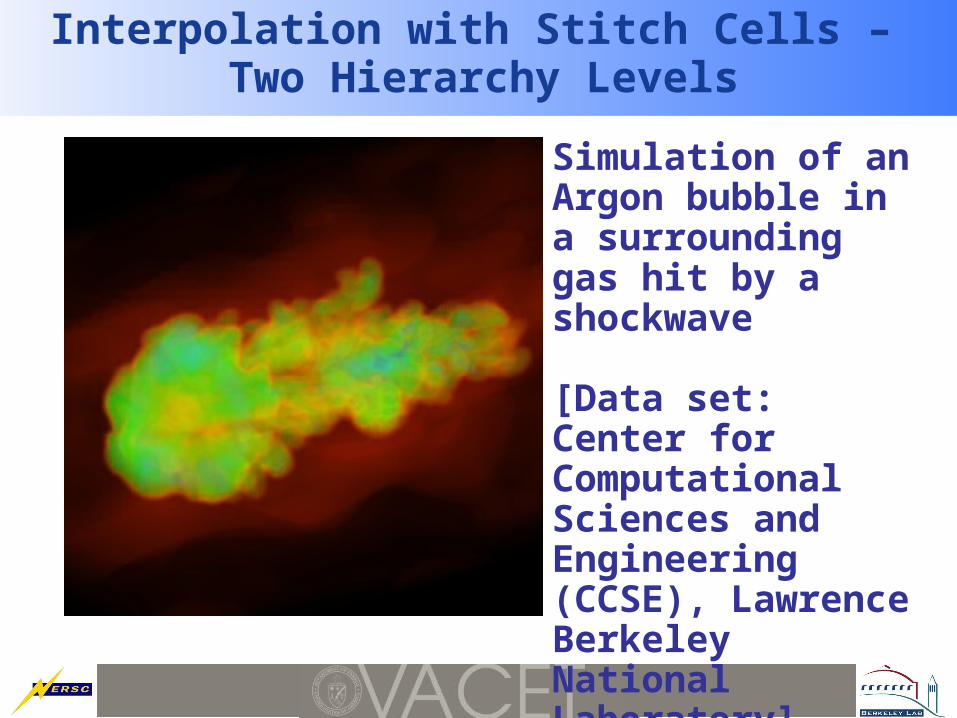
Interpolation with Stitch Cells – Two Hierarchy Levels
Simulation of an Argon bubble in a surrounding gas hit by a shockwave
[Data set: Center for Computational Sciences and Engineering (CCSE), Lawrence Berkeley National Laboratory]

Current State of the Art in Adaptive Mesh Refinement Visualization
Interpolation with Stitch Cells – Three Hierarchy Levels
Simulation of an Argon bubble in a surrounding gas hit by a shockwave
[Data set: Center for Computational Sciences and Engineering (CCSE), Lawrence Berkeley National Laboratory]

Current State of the Art in Adaptive Mesh Refinement Visualization
No Transfer Function Scaling
AMR simulation of star cluster formation Root level 32x32x32
[Data set: Greg Bryan, Theoretical Astronomy Group, MIT]
Current State of the Art in Adaptive Mesh Refinement Visualization
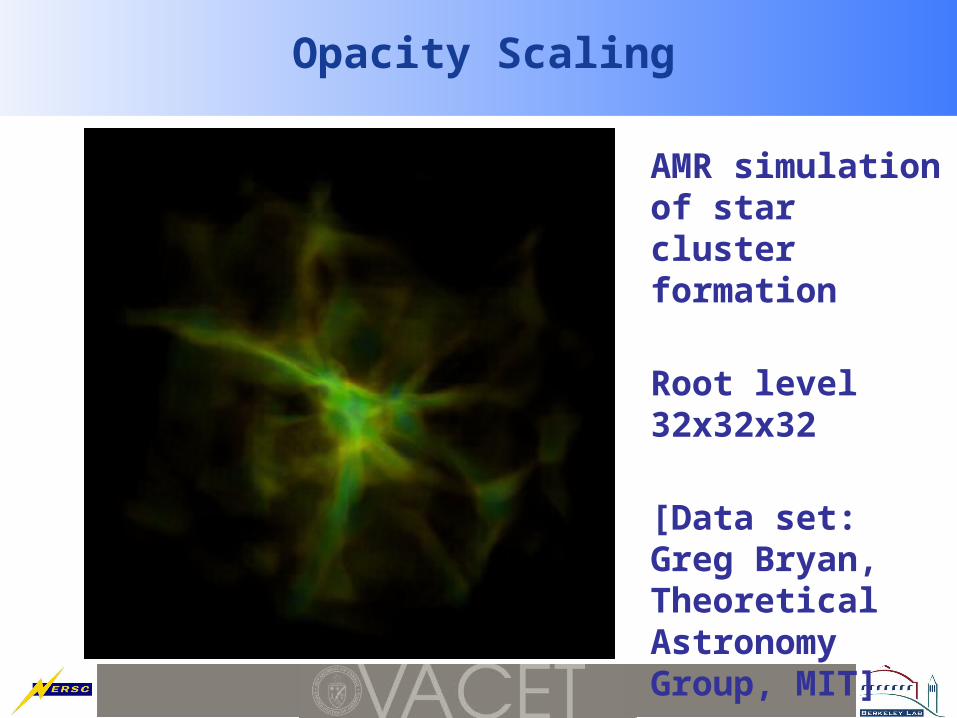
Opacity Scaling
AMR simulation of star cluster formation Root level 32x32x32
[Data set: Greg Bryan, Theoretical Astronomy Group, MIT]

Current State of the Art in Adaptive Mesh Refinement Visualization
Opacity and Saturation Scaling
AMR simulation of star cluster formation Root level 32x32x32
[Data set: Greg Bryan, Theoretical Astronomy Group, MIT]

Current State of the Art in Adaptive Mesh Refinement Visualization
Texture-based AMR Volume Rendering
• [Kähler & Hege, 2001 / 2002]• Resample to node centered• Subdivide in homogenous resolution
regions (kD-tree)• Minimize number of blocks using
information about AMR grid placement algorithm
• Texture/Slicing-based volume rendering• Optimized texture packing• Adapt slice spacing & correct opacity

Current State of the Art in Adaptive Mesh Refinement Visualization
Rendering the First Star of the Universe
• [Kähler et al., 2002]: Application to astrophysical data set– Texture-based volume renderer, Virtual Director, CAVE
• Aired on Discovery Channel
Current State of the Art in Adaptive Mesh Refinement Visualization
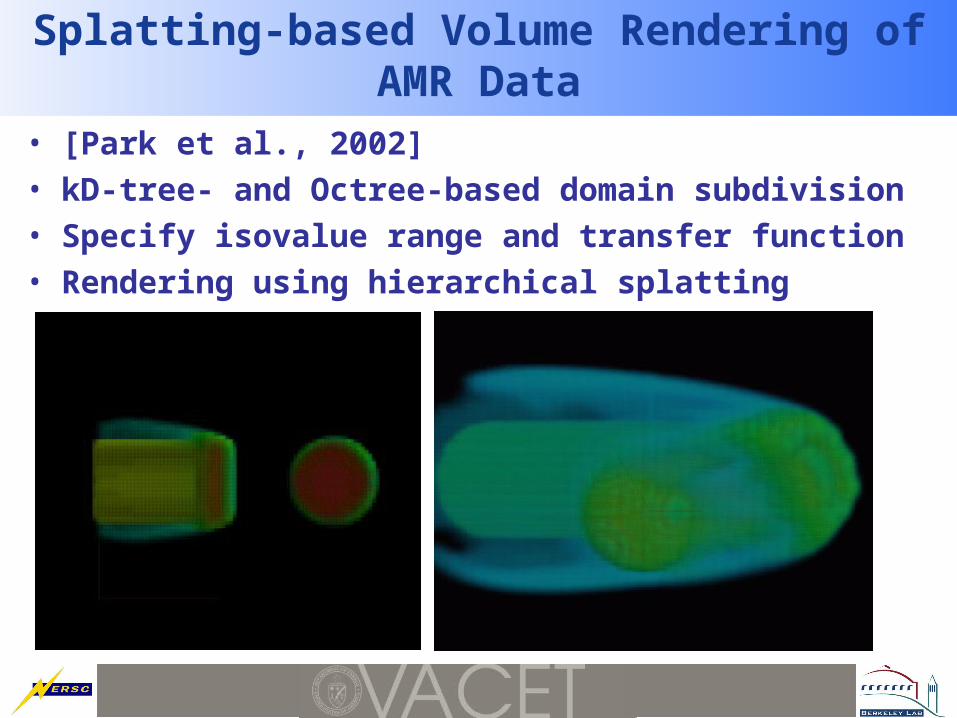
Splatting-based Volume Rendering of AMR Data
• [Park et al., 2002]• kD-tree- and Octree-based domain subdivision• Specify isovalue range and transfer function• Rendering using hierarchical splatting

Current State of the Art in Adaptive Mesh Refinement Visualization
Direct Volume Rendering of AMR Data
• [Kreylos et al., 2002]• Homogenization using kD-tree• Distributed rendering using texture-based slicing• Cost-range decomposition

Current State of the Art in Adaptive Mesh Refinement Visualization
Framework for Parallel AMR Rendering
• Efficient reimplementation of cell projection– Sort cells [Williams, Max & Stein 1998]
• Subdivision in object space with kD-tree• Subdivision of first hierarchy level
– Uniform: Blocks of approximately equal size
– Weighted: Blocks of similar computational effort
• Subdivision in blocks of constant resolution– Unweighted
– Weighted

Current State of the Art in Adaptive Mesh Refinement Visualization
Subdivision Strategies – Subdivision of the First Hierarchy Level
Uniform Weighted
X = Viewpoint; Color = Assigned processor

Current State of the Art in Adaptive Mesh Refinement Visualization
Subdivision Strategies – Homogenization
Unweighted Weighted
X = Viewpoint; Color = Assigned processor
Current State of the Art in Adaptive Mesh Refinement Visualization
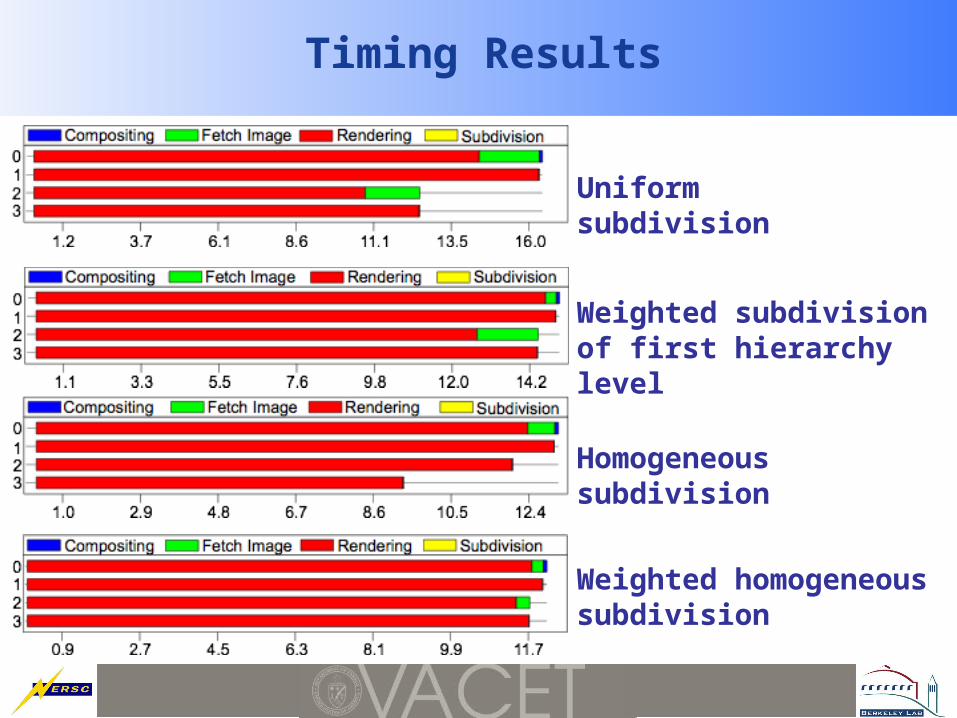
Timing Results
Uniform subdivision
Weighted subdivision of first hierarchy level
Homogeneous subdivision
Weighted homogeneous subdivision

Current State of the Art in Adaptive Mesh Refinement Visualization
• Homogenization most efficient way to render AMR hierarchies– Computationally efficient
– Use of standard methods
• Use of kD-tree currently standard way of describing subdivision
• Reasonable estimate of computational costs for rendering grid parts possible
Observations
Current State of the Art in Adaptive Mesh Refinement Visualization
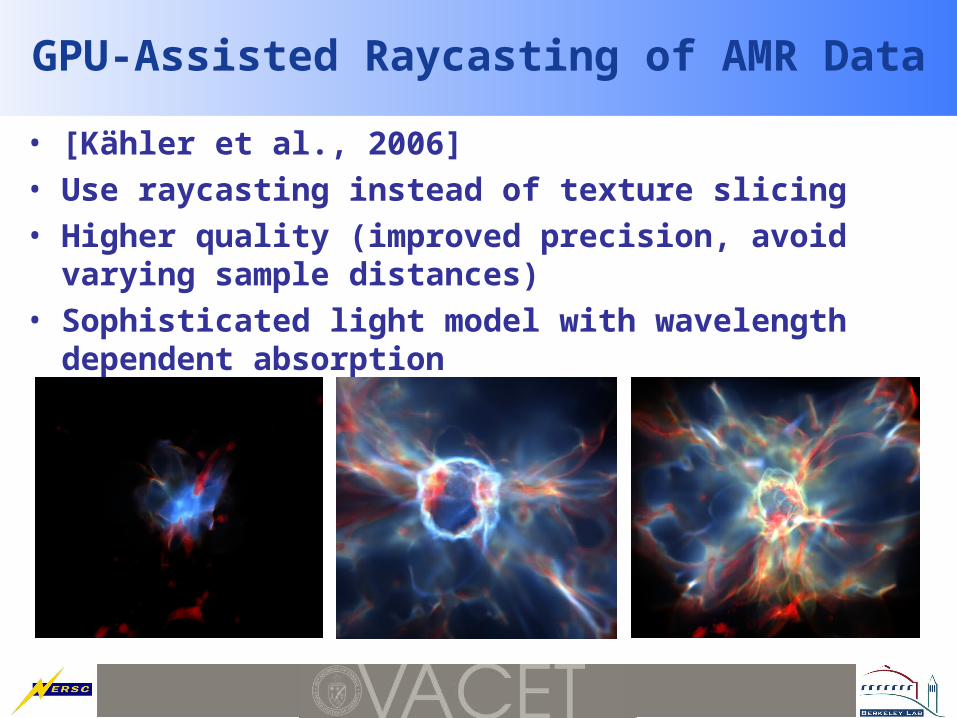
GPU-Assisted Raycasting of AMR Data
• [Kähler et al., 2006]• Use raycasting instead of texture slicing• Higher quality (improved precision, avoid varying sample
distances)• Sophisticated light model with wavelength dependent
absorption

Current State of the Art in Adaptive Mesh Refinement Visualization
Visualization of Time-varying AMR Data
• Feature-tracking– [Chen et al., 2003]
– Isosurface visualization
– Track connected components through time and AMR levels
• Remote visualization of time-dependent AMR data– [Kähler et al., 2005]
– Interpolation scheme for “in-betweening” of hierarchy levels evolving at different simulation rates
– Access remote simulation over network

Current State of the Art in Adaptive Mesh Refinement Visualization
Specialized Tools for AMR Data
• ChomboVis– LBNL Applied Numerical Algorithms Group
– Slicing and spreadsheets
– Isosurfaces (w/ cracks)
– Streamline computation (unpublished)
• AMR Vis– LBNL Center for Computational Sciences and Engineering
– Shear-warp volume rendering (re-sampling)
– Slicing and spreadsheets
– Streamlines

Current State of the Art in Adaptive Mesh Refinement Visualization
Spreadsheets
Current State of the Art in Adaptive Mesh Refinement Visualization
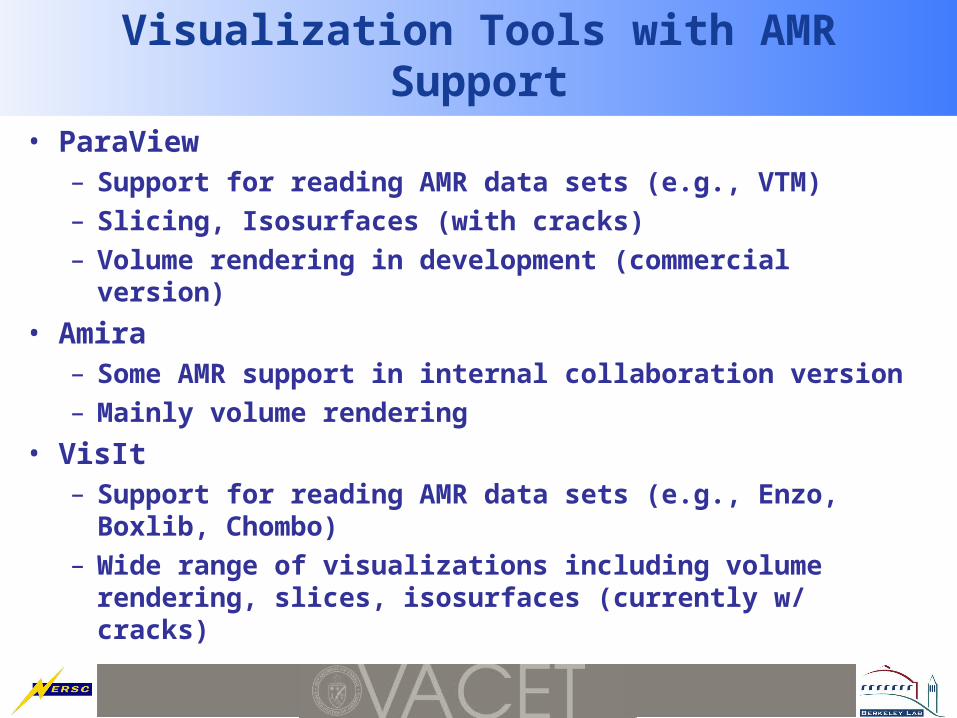
Visualization Tools with AMR Support
• ParaView– Support for reading AMR data sets (e.g., VTM)
– Slicing, Isosurfaces (with cracks)
– Volume rendering in development (commercial version)
• Amira– Some AMR support in internal collaboration version
– Mainly volume rendering
• VisIt– Support for reading AMR data sets (e.g., Enzo, Boxlib,
Chombo)
– Wide range of visualizations including volume rendering, slices, isosurfaces (currently w/ cracks)

Current State of the Art in Adaptive Mesh Refinement Visualization
VisIt
• Richly featured visualization and analysis tool for large data sets
• Data-parallel client server model, distribution on per patch-basis
• Use of meta-data / contracts to reduce amount of processed data
• Built for 5 use cases:– Data exploration
– Visual debugging
– Quantitative analysis
– Presentation graphics
– Comparative analysis
[Argon bubble subjected to shockJeff Greenbough, LLNL]
[Logarithm of gas/dust density in Enzo star/galaxy simulation, Tom Abel & Matthew Turk, Kavli Institute]

Current State of the Art in Adaptive Mesh Refinement Visualization
VisIt and AMR Data
• Supported as “first-class” data type• Handled via “ghost-cells”: Coarse cells that are refined
are marked “ghost” in the lower level• Isocontouring via resampling, cracks possible at level
boundaries• Work on rectilinear grids and skip ghost cells or
“remove” results produced in ghost cells later on
• AMR capabilities currently under rapid development (planned as ChomboVis replacement this FY)
• http://www.llnl.gov/visit

Current State of the Art in Adaptive Mesh Refinement Visualization
Acknowledgements
• Members of the NERSC Visualization Group, the Applied Numerical Algorithms Group (ANAG) and the Center for Computational Sciences and Engineering (CCSE) at LBNL
• Members of the VisIt Development Team• Members of IDAV Visualization Group (UC Davis)• AG Graphische Datenverarbeitung und Computergeometrie• Members of ZIB and AEI
• Department of Energy (LBNL)• National Science Foundation• Office of Naval Research• Army Research Office • NASA Ames Research Center• North Atlantic Treaty Organization • ALSTOM Schilling Robotics, Chevron, General Atomics, Silicon Graphics,
and ST Microelectronics, Inc.• Stiftung für Innovation des Landes Rheinland-Pfalz

Questions?


![Visualization of Octree adaptive mesh refinement (AMR) in ... · libraries like Numpy/Scipy [3], Matplotlib, PIL, HDF5/PyTables... It also does three-dimensional volume rendering](https://img.dokumen.tips/doc/110x75/5facfc3c77026834c409e099/visualization-of-octree-adaptive-mesh-refinement-amr-in-libraries-like-numpyscipy.jpg)

![Visualization Tools for Adaptive Mesh Refinement Data · 2010. 5. 6. · Texture-based AMR Volume Rendering • [Kähler & Hege, 2001 / 2002] • Resample to node centered • Subdivide](https://img.dokumen.tips/doc/110x75/60ff7336f1d93c279e604308/visualization-tools-for-adaptive-mesh-refinement-data-2010-5-6-texture-based.jpg)