Embed Size (px)
Citation preview

Visualization Support for Software Product Line Modeling
Reinhard Stoiber, Tobias Reinhard, Martin Glinz Department of Informatics, University of Zurich, Switzerland
{ stoiber | reinhard | glinz } @ifi.uzh.ch
Abstract
Product derivation from a product line model is a
central activity in product line requirements engineer-ing. A product line framework and/or approach should provide sophisticated visualization and product deriva-tion support, otherwise large product lines become very hard to handle. In this paper we first present how we can benefit from existing single-system visualiza-tion techniques in product lines. Then we introduce new visualization aids and concepts that support the analysis of variability and the derivation of products in software product line engineering. We expect that these new visual support mechanisms will significantly ease the work of stakeholders and requirements engi-neers when negotiating a new product based on a software product line. 1. Introduction
Software product line engineering (SPLE) is a soft-ware engineering paradigm that has gained more and more attention in research and industry over the last years. The main goals and promises of SPLE are to maximize the amount of reuse of existing software artifacts, thus reducing development cost and time as well as increasing product quality [12].
A central activity in SPLE is product derivation, which deals with creating concrete application prod-ucts from the product line. In product derivation, stakeholders (in particular, requirements engineers and customers) usually sit together, discuss the product’s common and variable elements, and decide which vari-able parts shall be included in the concrete product and which ones shall not. Furthermore, new requirements might also be identified in this process. Primarily, such requirements will have to be modeled for completing the concrete product specification. Later, some of them will be added also to the product line domain.
When dealing with large requirements models, the task of understanding and visualizing the relevant in-
formation is essential for supporting stakeholder nego-tiations. Especially when concrete decisions have to be taken in the variability model, the deciding stakeholders need mechanisms for (1) generating views that show the relevant parts of the
model only, (2) visualizing the structure of the variability and the
dependencies between variable items, (3) visualizing the effects and the impact when taking a
decision during product derivation. We are developing a new approach for integrated product line modeling and product derivation [17] which is based on a combination of the aspect model-ing capabilities of the ADORA language and tool [4] [11] [15] and a specialized form of decision tables. The commonality is modeled as a plain vanilla ADORA model (called the core model), while variants are mod-eled as aspects. All information about the variability constraints and decision support is kept in a decision table. When a variant is selected during product deriva-tion, it is added to the core model by weaving the corresponding aspect into the core model. The ADORA tool features sophisticated visualization mechanisms for hierarchical and aspectual graphic models [4] [15] [11], including smart layout adaptation [16] [14], line routing [13] and view generation [15]. In this paper, we focus on specific product line visuali-zation mechanisms for meeting the requirements (1)-(3) stated above which build upon the existing ADORA visualization techniques.
We first describe how we can benefit from the al-ready established visualization mechanisms in ADORA when handling a product line. These include vertical abstractions (fisheye views) and horizontal abstractions (visualizing and/or hiding different views of the inte-grated model). Then we introduce new visualization aids. These include selective visualization of variability constraints, visual tracing of selections between the graphical model and the decision table, partial weaving (which considerably eases the task of product deriva-tion), and visual traceability of the effects of including or omitting variants in the resulting product application
model. Additionally, we introduce impact views, which is a new concept for tracing the effects of bind-ing a variant in large, industrial product lines. Impact views are generated views showing only the model elements directly impacted by a decision plus their surrounding context.
The remainder of the paper is organized as follows: Section 2 describes a running example of a simple product line and how our existing visualization tech-niques can help visualize the model. Section 3 focuses on variability analysis and product derivation, in par-ticular, traceability between decisions and graphical model elements, selective variability constraint visuali-zation, dynamic weaving, and traceability of decision impact in woven product models. Section 4 describes impact views as a visualization aid for large product models. In Section 5 we conclude with a discussion of related work, a summary of our results, the state of our work, and future plans. 2. Visualization of Graphical Product Line Models
For the ADORA language we have developed many advanced visualization techniques to better visualize and handle the integrated models. These techniques provide significant benefit when working with single system models. But we can also benefit from them equally well when modeling product lines. In the fol-lowing subsections we will briefly introduce a running example and then demonstrate how visualization can help to understand these models better.
2.1. Running Example
As a running example we use a simple electronic
home security system. We have already used a pre-liminary version of this in previous work [17].
The electronic home security system consists of an alarm module, a main module, and a door control module. For the alarm module there won’t be any variation. For the main module there are two alterna-tives: an economy system and a high-end system. For the door control module there are three basic mecha-nisms to unlock the door: a magnetic card reader, a fingerprint reader, and a keypad plug-in. Two alterna-tive types of keypads can be connected to the keypad plug-in: a hardware keypad and a touchscreen keypad. An optional logging mechanism can be used to write log entries for selected events.
2.2. Horizontal Abstractions
In an integrated model, the various facets of a system are all described within one modeling language. In the ADORA language [4], these facets, which are called views in ADORA, include: The base view, which represents the hierarchy of
components and objects a system is comprised of (notation: nested rectangles);
The structural view, describing static associations between objects (notation: lines connecting rec-tangles);
The behavior view, modeled by states and state transitions with a simplified statechart semantics (notation: rounded rectangles for states, arrows for transitions);
The user interaction view, which models the interaction between system components and ex-ternal actors with decomposable, type-level sce-narios (notation: ovals for scenarios);
The external view, representing the system con-text (notation: hexagons for external actors);
The aspect view, describing crosscutting concerns separately as aspects and denoting the places where they apply with explicit join relationships (notation: rectangles with two beveled corners represent aspects, dashed arrows stand for join relationships).
Displaying all these facets together in a single dia-gram results in visualizations that contain much more information than a classic, single facet diagram (such as, for example, a UML class diagram). Such compre-hensive diagrams are rather hard to read and under-stand, hence.
To handle this problem, ADORA employs horizontal abstraction: the model is projected to a single facet or to a combination of facets that a modeler is currently interested in. Only the model elements belonging to these facets are displayed; the rest of the model is hid-den. For example, end-users of a system might only be interested in how they can interact with the system: in ADORA, they would select a combination of the user interaction view and the external view. On the other hand, for getting an overview of the component struc-ture of a system, the base view combined with the external view would be appropriate.
Figure 1 shows a visualization of the home security system that consists of the base view, combined with the user view, the aspects and the join relationships. With respect to product line modeling, the commonal-ity of the home security system consists of the object Electronic Home Security System (which is decomposed into the objects Alarm Module, Main Module, and Door Control), the Log object and the external actor House Owner. The variability is modeled with aspects and join

relationships. The scenario unlock door, for example, has three possible sub-scenarios: unlock door by mag-netic card, unlock door by keypad, and unlock door by fin-gerprint reader. This is defined by the join relationships crosscutting the unlock door scenario, and by the weav-ing type “after”. If more than one of these sub-scenar-ios will be realized in the application system, House Owner has to select one of them. This is indicated by the symbol “O” in these scenarios. After connecting a keypad, House Owner can unlock the door multiple times before disconnecting it again, which is indicated by the “*” in the respective scenarios.
Figure 1. The running example: displaying only the external actors, variability as aspects, and user in-teraction view. In this model, the corresponding variability decision items and variability constraints are not visualized. Note that, when hiding or unhiding particular views, the model layout automatically adapts to the new situa-tion. The new layout preserves the user’s mental map of the model and, at the same time, it minimizes free space, in order to display the model efficiently [15].
2.3. Vertical Abstractions
In contrast to horizontal abstraction, vertical ab-
straction is not used to hide particular facets of the whole model, but to hide all the details for some par-ticular concerns or parts of the model, which are cur-rently not in the focus of the user. For our running example, Figure 1 and Figure 2 illustrate the principle of vertical abstraction. In Figure 1, the variants Econ-omy System, High-End System and Logging, as well as the object Log are not in the current focus, hence their de-tails are hidden from this view. An ellipsis after the name marks such abstractions. In Figure 2, the Logging
variant is now in the focus of interest; hence, its details are included in the view.
Figure 2 also illustrates the effect of horizontal ab-straction: the behavior view, which was hidden in Figure 1, is now included.
The behavior of the Logging variant is no complete statechart, but a fragment, a so-called behavior chunk. If the Logging variant is chosen, this behavior chunk is woven, for example, into three transitions of the state-chart that models the Touchscreen Keypad behavior. For details of the weaving semantics, see [10].
Note that precise join relationships can only be dis-played when both the source and the target are dis-played in detail (for example, Logging and Touchscreen Keypad in Figure 2). If the source or target is hidden due to horizontal or vertical abstraction, a so-called abstract join relationship must be drawn from or to the component containing the source or the target (for example, from Economy System to Main Module or from begin logging to Fingerprint Reader).
Figure 2. The running example: displaying all de-tails of the commonality, the keypad plug-in, the touchscreen keypad and the logging, and hiding the details of the other concerns.
As demonstrated in Figure 1 and Figure 2, horizontal and vertical abstraction can be combined when visual-izing a model. This capability allows modelers as well as model readers to focus and to explore specific parts and concerns of the model, without being overloaded by lots of detail that are irrelevant in the current con-text. When working with vertical abstraction, the layout will also be automatically adapted when an abstraction operation is performed [15] [16].
3. Visualization Support for Product Deri-vation
Besides benefiting from the previously developed
visualization mechanisms of ADORA, we have also developed some additional visualization concepts, which aim especially at supporting product lines and product derivation. We describe these in the following subsections.
Before we can proceed, we must briefly introduce the decision table, which is our central concept for handling product line variability in ADORA, besides using aspects to describe the variability. The decision table describes the properties and constraints of the variability and records actual decisions when deriving products. The rows of the decision table represent the decisions to be taken when binding the variability: every row is a decision item, containing all information for making a variability decision and recording the actual decision when it is taken.
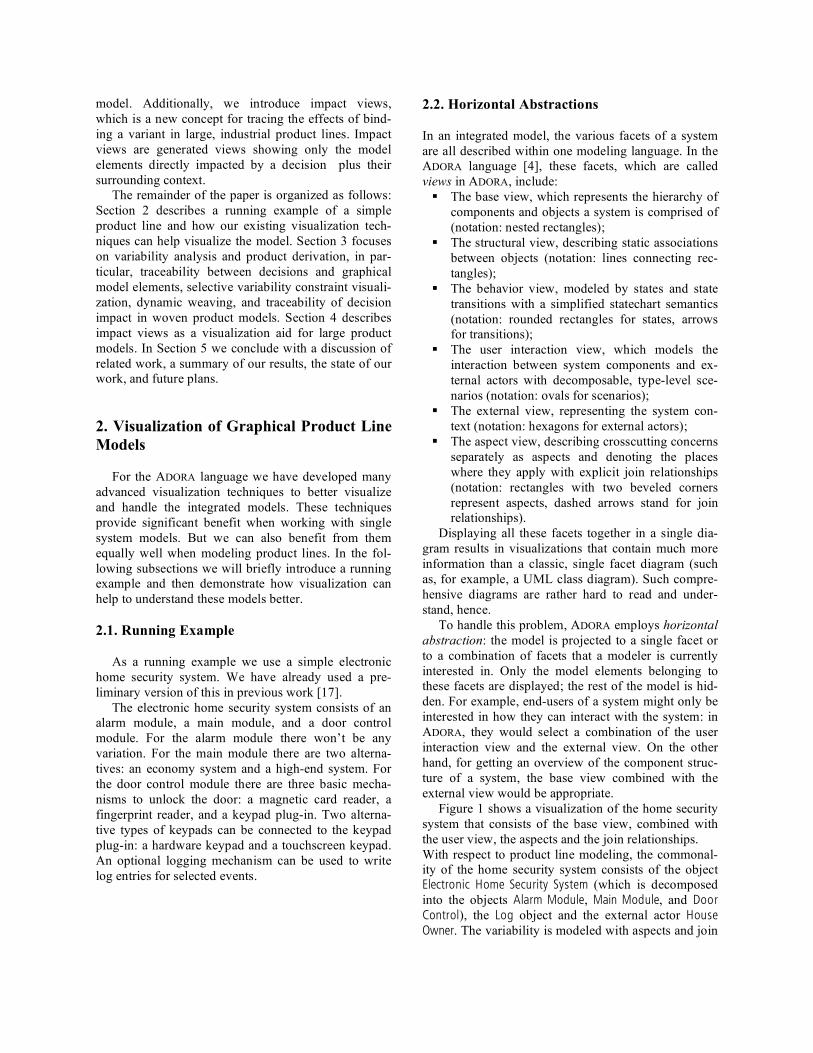
Every decision item in the decision table maps to one join relationship in the graphical product line model, except in cases where different elements of an aspect need to be woven at different places in the core model. Conversely, every single join relationship out-going from a variability1 is annotated with the number of a decision item, in order to handle the details of its variability (see Figure 3). Table 1. The decision table for the running exam-ple, with decision item D4 currently selected.
Table 1 shows an excerpt from the decision table for our running example. The columns describing the variability constraints and decision support are sup-pressed, because this is not in the focus of this paper. For our subsequent visualization examples, we only need the following information about constraints: De-cision items D3, D4, D5 form a variation point VP2(1:2), which means that at least one and at most two of these decision items have to be chosen when deriving a product. In the same way, D6 and D7 form a variation point VP3(1:1). Decision item D5 includes
1 Note that a model can also contain aspects representing crosscutting concerns that have nothing to do with variability. Hence, not every join relationship is annotated with a decision item number, but only those that represent variability.
D2, which means that D5 can only be chosen when D2 has been chosen, too. On the other hand, D5 is ex-cluded by D6, which means that D5 cannot be chosen if D6 is chosen.
3.1. Visual Traceability between Decision Items and Variable Join Relationships
For working efficiently with the graphic model and
the decision table, we need visual traceability between the two. This is easy to provide in a tool: When a deci-sion item is selected in the decision table (for example, D4 in Table 1), the corresponding join relationship in the graphic model is highlighted (Figure 3). Vice-versa, when selecting a join relationship that is labeled with a decision item number, the corresponding row in the decision table is highlighted. Thus, the user has always visual pointers to the corresponding locations in the graphic model and in the decision table where he or she is currently working on.
Figure 3. An abstract view on the variability with decision item D4 currently highlighted.
Because all the details of the variant aspects are hidden in Figure 3, some of the displayed join relation-ships are abstractions of more than one join relation-ship. These are labeled with the numbers of the deci-sion items that the abstracted join relationships are associated with. For example, the label “D8-D10” of the join relationship from Logging to Hardware Keypad means that in a fully expanded view, there are three join relationships from elements in Logging to elements in Hardware Keypad, which correspond to decision items D8, D9, and D10.
3.2. Selective Graphical Visualization of Vari-ability Constraints
An important and usually quite difficult part in
product line engineering is handling the variability constraints. Such constraints are, for example, cardi-

nality constraints over multiple decision items or inter-dependencies between decision items such as include and exclude relationships. As described above, we capture the constraints in the decision table. However, when working with a variability model, particularly during product derivation, it is essential that constraints can also be displayed visually. In traditional feature trees, all constraints for all features are represented visually [7] [1]. As we work with richer models that not only model features as abstract boxes, but also the variants themselves, such a visualization would over-load the view. Instead, we decided to display constraint information selectively, just for those decision items that a user is currently working on.
Figure 4 and Figure 5 illustrate our approach. Figure 4 shows how all the variability constraints for a particular variable join relationship can directly be visualized within the graphical model. This kind of selective displaying of the variability constraints in the graphical model is invoked by selecting the variable join relationship with the mouse pointer. The main benefits from such a selective constraint visualization is to keep the added visual complexity small, while still displaying a complete set of constraints for a particular decision item.
Figure 4. Selective visualization of variability con-straints in the graphic model.
In our example, two constraints are displayed: (a) a
cardinality constraint, stating that D3, D4, and D5 form a variation point VP2 with cardinality (1:2), and (b) an interdependency, stating that choosing a Fingerprint Reader implies configuring a High-End System.
More concretely, the cardinality (1:2) for variation point VP2 states that at least one device for unlocking the door (a keypad, a fingerprint reader, or a magnetic card reader) must be chosen and that not more than two devices are allowed in a valid configuration.
Other than directly visualizing the variability con-straints in the graphical model, we also allow for a selective constraints visualization triggered by a selec-tion in the decision table. When stakeholders negotiate a particular decision item in the decision table, then a selective visualization of all the related variability constraints in the graphical model might be signifi-cantly easier to argue about than the textual constraint representation in the table.
Figure 5, shows an example: when decision item D4 is selected in the decision table, the corresponding join relationship is highlighted and all associated con-straints are displayed. When stakeholders negotiate this variability, they can easily see that decision item D4 is rather independent: there is only a single cardinality constraint to be obeyed when deciding whether or not to include the Keypad Plug-In in a product. The stakeholders can also easily see what would be the alternative choices if they don’t want a keypad.
Figure 5. Tracing the selection and visualization of the variability constraints for decision item D4 se-lected in the decision table.
3.3. Dynamic Weaving at Derivation Time
So far we have described concepts for visualization
support when negotiating variability decisions. In this subsection we discuss the visualization support when actually taking the decisions.
In our approach of product line engineering based on aspects, we are deriving products by adding the chosen variants to the model of the commonality. Technically, the model elements of the chosen aspects are woven into the core model. We do this not only in the underlying repository (i.e. in XML data structures) as done in other aspect-oriented modeling approaches [18] [3] [9] [6], but weave also the actual graphical representation, using the weaving capabilities of the ADORA tool.

Weaving is dynamic, i.e. when a decision to include a variant in a product is made (technically, the value in the Decision column for a decision item is set to “true” in the decision table), the corresponding aspect is woven into the product model. A decision to exclude a variant from the product (technically, setting the value in the Decision column for a decision item to “false”) results in removing the corresponding join relationship from the model. If this removal yields isolated aspects (i.e. aspects that have no outgoing join relationship), the aspect and its incoming join relationships are also removed from the model.
With dynamic weaving, we keep the graphic model and the decision table always consistent during the whole product derivation process. Dynamic weaving also allows users to try a decision and explore what happens in the resulting model. If unwanted effects occur, the decision and the subsequent dynamic weav-ing can be easily undone by re-setting the value in the Decision column for the respective decision item to “not decided”. The visual layout is restored exactly to what it looked before taking the decision.
Figure 6 shows a dynamically woven model during the product derivation process, where nearly all deci-sions have already been taken, except for the finger-print reader (which could still be used as a second un-locking mechanism) and the logging possibilities for the touchscreen keypad and fingerprint reader, respec-tively. Table 2 shows the corresponding state of the decision table.
Suppose that the stakeholders are currently deciding about the necessity of logging for various events, as indicated by the current selection of decision item D17 in Table 2. Figure 6 shows how this decision is also highlighted in the partially woven, graphical model. So it is easy for the stakeholders to discuss this decision item also in context of the integrated requirements model at hand.
Figure 6. A partially woven product model during product derivation, with decision item D17 high-lighted.
Table 2. A partially decided decision table during product derivation, with decision item D17 selected.
3.4. Visual Traceability of Variability Decision Impact to Woven Product Models
The final visualization aid mechanism, other than
the impact views we describe in Section 4, is the visual traceability of the effects of a variability decision in the woven product model.
Especially when dealing with big models, it be-comes hard for the users to keep track of the effects that the previous decisions in the product derivation process had. This is mainly due to the fact that all de-cided variability is immediately woven into the core model and can no longer be viewed separately. When a user wants to reflect about some parts of the product model, he or she might not be able to recall exactly which decision item caused the insertion of some spe-cific model element.
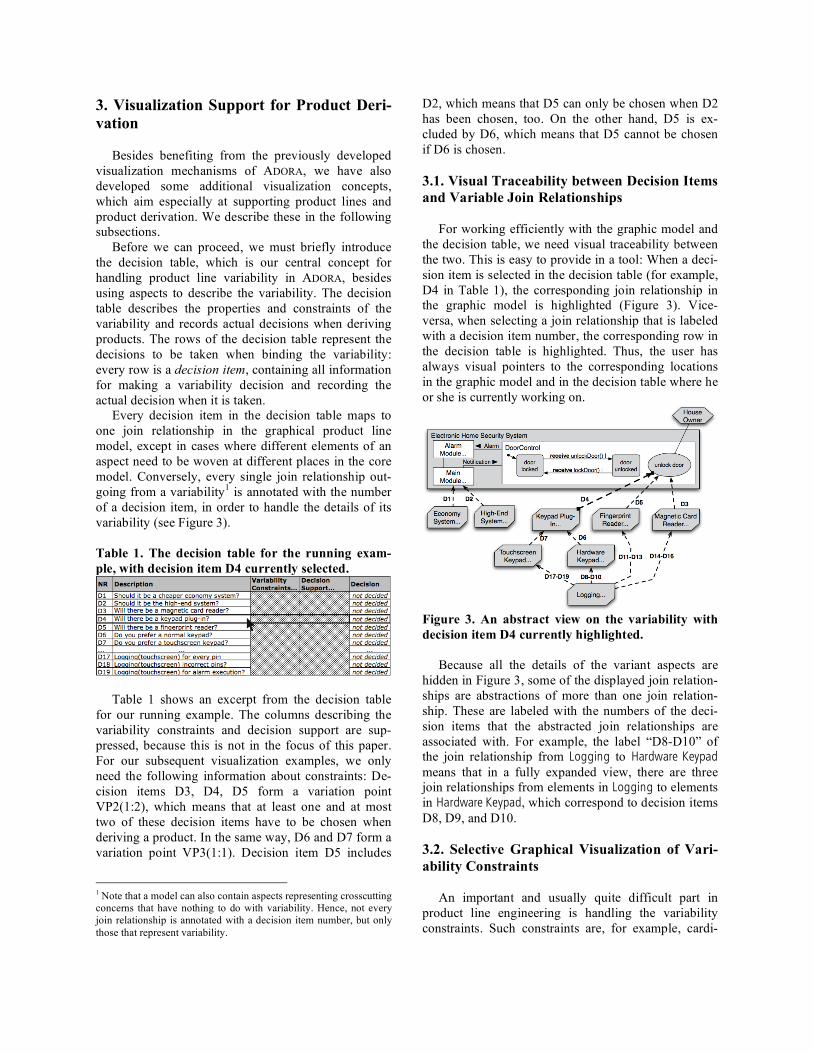
We solve this problem by providing a visual tracing mechanism for decisions that have been taken. SEQ demonstrates our approach. Suppose that a user has decided to include decision item D4 (cf. Table 3) and the corresponding variability has been woven into the product model. If decision item D4 is now selected in the decision table, the model elements that were in-serted into the product model due to this decision can be highlighted as shown in SEQ. So a user can see all the effects of a decision in the product model. Tracing in the opposite direction is also possible: when a user would select the element connect keypad in the graphic representation shown in Figure 8, the corresponding decision item D4 would be highlighted in the decision table.
We expect that this tracing mechanism will be par-ticularly useful when dealing with large models in practice.
Table 3. A decision table with one decision item D4 currently selected and decided with “true”.
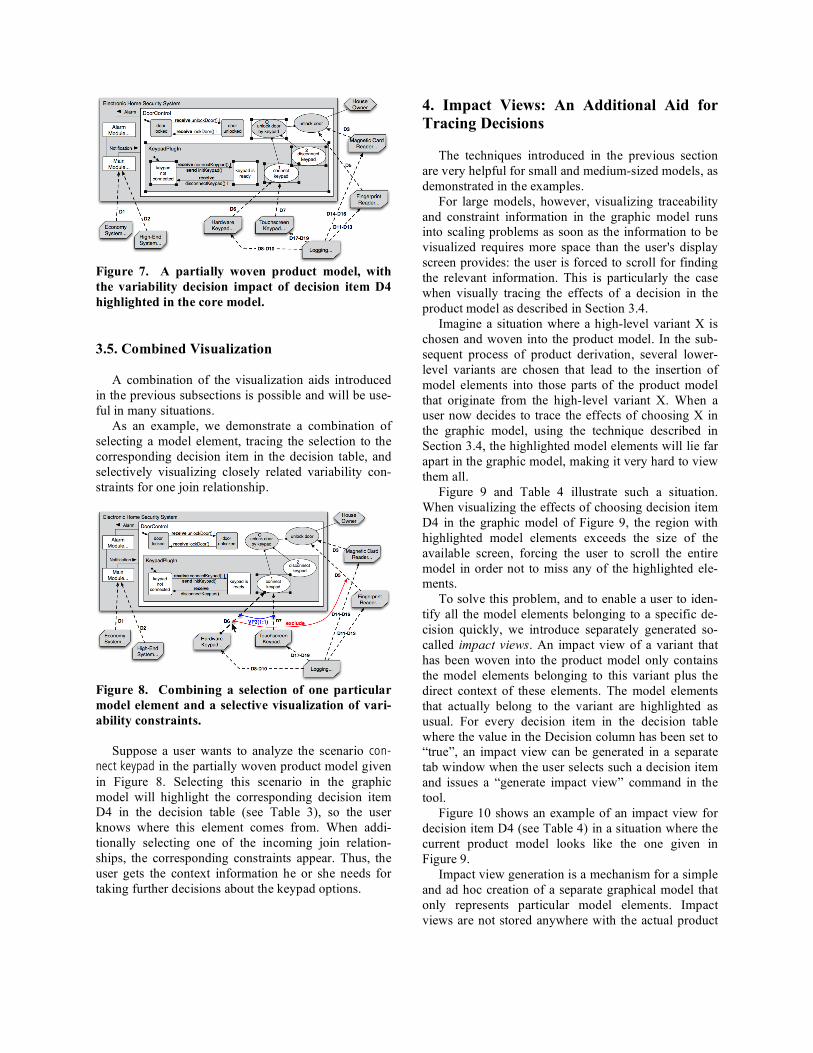
Figure 7. A partially woven product model, with the variability decision impact of decision item D4 highlighted in the core model.
3.5. Combined Visualization
A combination of the visualization aids introduced
in the previous subsections is possible and will be use-ful in many situations.
As an example, we demonstrate a combination of selecting a model element, tracing the selection to the corresponding decision item in the decision table, and selectively visualizing closely related variability con-straints for one join relationship.
Figure 8. Combining a selection of one particular model element and a selective visualization of vari-ability constraints.
Suppose a user wants to analyze the scenario con-
nect keypad in the partially woven product model given in Figure 8. Selecting this scenario in the graphic model will highlight the corresponding decision item D4 in the decision table (see Table 3), so the user knows where this element comes from. When addi-tionally selecting one of the incoming join relation-ships, the corresponding constraints appear. Thus, the user gets the context information he or she needs for taking further decisions about the keypad options.
4. Impact Views: An Additional Aid for Tracing Decisions
The techniques introduced in the previous section
are very helpful for small and medium-sized models, as demonstrated in the examples.
For large models, however, visualizing traceability and constraint information in the graphic model runs into scaling problems as soon as the information to be visualized requires more space than the user's display screen provides: the user is forced to scroll for finding the relevant information. This is particularly the case when visually tracing the effects of a decision in the product model as described in Section 3.4.
Imagine a situation where a high-level variant X is chosen and woven into the product model. In the sub-sequent process of product derivation, several lower-level variants are chosen that lead to the insertion of model elements into those parts of the product model that originate from the high-level variant X. When a user now decides to trace the effects of choosing X in the graphic model, using the technique described in Section 3.4, the highlighted model elements will lie far apart in the graphic model, making it very hard to view them all.
Figure 9 and Table 4 illustrate such a situation. When visualizing the effects of choosing decision item D4 in the graphic model of Figure 9, the region with highlighted model elements exceeds the size of the available screen, forcing the user to scroll the entire model in order not to miss any of the highlighted ele-ments.
To solve this problem, and to enable a user to iden-tify all the model elements belonging to a specific de-cision quickly, we introduce separately generated so-called impact views. An impact view of a variant that has been woven into the product model only contains the model elements belonging to this variant plus the direct context of these elements. The model elements that actually belong to the variant are highlighted as usual. For every decision item in the decision table where the value in the Decision column has been set to “true”, an impact view can be generated in a separate tab window when the user selects such a decision item and issues a “generate impact view” command in the tool.
Figure 10 shows an example of an impact view for decision item D4 (see Table 4) in a situation where the current product model looks like the one given in Figure 9.
Impact view generation is a mechanism for a simple and ad hoc creation of a separate graphical model that only represents particular model elements. Impact views are not stored anywhere with the actual product

or partially woven product line model. They only serve as additional ad hoc visualization aids that are just created for temporary viewing.
Impact views are particularly helpful when the model elements to be traced are scattered all over the model and when users have to work with small-size screens.
Figure 9. A fully woven product model, with im-pact of decision item D4 visually traced, and the currently visible area (e.g. in the editor tool) as a thick dashed line.
Table 4. A decision table with all decisions taken and decision item D4 currently selected.
Figure 10. A generated view, to visualize only the directly relevant model elements of decision item D4, and the directly relevant context less empha-sized.
5. Conclusions
5.1 Related work
Feature trees [7] [1] visualize all variability con-
straints graphically in the feature model. However, they lack abstraction capabilities and don’t provide tracing from the variability description in the feature tree to the actual models describing the variants.
Several approaches extend UML with product line modeling capabilities. For example, the Orthogonal Variability Model (OVM) by Pohl et al. [12] describes variability constraints in a separate model and defines which model elements map to which variants. How-ever, OVM does not provide visual support for tracing variability and product derivation.
Czarnecki et al. [2] propose an approach which has similarities to our one. They combine feature models with UML diagrams and provide traceability from features to model artifacts by so-called superimposed variants. To realize such mappings, they assign all variable model elements to features in a separate fea-ture tree, where they also handle all the variability constraints and the product derivation. In the product derivation process, they provide visual support by dynamically adapting the corresponding UML dia-grams for the product depending on the current state of derivation. This means, whenever a decision is taken, the model is pruned dynamically by removing variable elements that are not chosen. Further, they provide visual traceability of features by coloring. All variable model elements contain so-called presence conditions, which link them to the feature tree. In the graphical model, features are colored according to these presence conditions. Thus, they provide the capability to trace the impact of feature variability directly to require-ments and design models.
The biggest disadvantage of the approach by Czarnecki et al. is information scattering: the relevant information is distributed over several diagrams. For example, it is impossible to see the effects of a vari-ability decision in a single diagram as we do with vis-ual impact tracing and impact views. Furthermore, they do not visualize global constraints. Finally, their para-digm for modeling variability is different from our one: they use a subtractive paradigm, where all variants are included in the domain model. In product derivation, the omitted variants are removed from the model. Our modeling paradigm is additive: the core model contains the commonality only; variability is modeled sepa-rately as aspects. In product derivation, the chosen variants are added to the core model.

Gomaa et al. [5] also propose an approach that com-bines UML and feature trees. They mention the use of coloring to support product derivation, but their vari-ability visualization concept is considerably less so-phisticated that the one by Czarnecki et al. [2].
Kästner et al. [8] introduce a colored integrated de-velopment environment (CIDE) that can visualize fea-tures within source code by adding different back-ground colors. However, they neither use visual mod-els nor have any visual product derivation concepts.
5.2 Summary and Discussion
In this paper we have shown how we can visualize
software product line models that are based on aspects. For the basic visualization features, in particular hori-zontal and vertical abstraction, we rely on the capabili-ties of the ADORA tool. Additionally, we have intro-duced four basic visualization aids that support trace-ability, the visualization of constraints, and model analysis during the process of product derivation: • Visual traceability of particular decision items
between the graphical model and the decision ta-ble; this supports better understanding of the vari-ability;
• Visualizing variability constraints for single vari-able join relations; this helps estimate the impact of a decision on other decisions;
• Dynamic weaving of variability at derivation time; this is a powerful mechanism to explore how variability will be realized in the derived product;
• Visual traceability of decision impact, that means tracing the effects of including or omitting a vari-ant in the woven graphical product model (both in the entire model and in specific impact views); this is a useful aid for users to recall which model elements in the woven model belong to which variability decision.
Impact views are particularly useful for analyzing the effects of a decision in the woven product model: they avoid annoying scrolling activity when the visual model elements belonging to a particular decision item are spread all over a large product model.
In summary, all these visualization aids and con-cepts together provide advanced visualization support for product line models in general and for product derivation in particular.
5.3 State of Tool Implementation
The abstraction mechanisms described in Section 2
have been fully implemented in the ADORA tool. A
basic aspect weaving mechanism has also been imple-mented, but still needs improvement.
For product lines, we have implemented most of the decision model and the traceability of selections be-tween the decision table and the graphic model.
The visualization of variability constraints within the graphical model is currently under implementation. The remaining concepts described in this paper are not yet implemented; see below.
5.4 Future Work
We plan to implement all the concepts described in this paper on a research prototype level.
The implementation of variability constraint visu-alization has to be completed.
Dynamic weaving for product derivation will re-quire considerable improvement of our existing aspect weaving implementation, especially for the graphical layout adaptations when an aspect injects new elements to an existing graphical model. Further we will work on optimizing the usability of the decision table within the editor.
Other conceptual work that we intend to tackle in the future will concern the scoping of the product line model. There, we aim at automatically identifying and adding all the improved and newly added model ele-ments to the product line domain model. The im-provements that are made during application engi-neering would be included directly in the product line domain model, while the new requirements would be added as new aspects, with respective join relation-ships in the domain model. 6. Acknowledgements
We thank Cédric Jeanneret for the lively discus-sions and comments on earlier drafts of the paper. References [1] Czarnecki, K., S. Helsen, and U. Eisenecker (2005). For-malizing Cardinality-based Feature Models and their Spe-cialization. Software Process Improvement and Practice, special issue of best papers from SPLC04, 10(1), pp. 7 - 29 [2] Czarnecki, K., M. Antkiewicz (2005). Mapping Features to Models: A Template Approach Based on Superimposed Variants. In Proceedings of the 4th International Conference on Generative Programming and Component Engineering (GPCE'05). Tallinn, Estonia. [3] France, R., F. Fleurey, R. Reddy, B. Baudry, and S. Ghosh (2007). Providing Support for Model Composition in

Metamodels. In EDOC’07: Proceedings of the 11th IEEE International Enterprise Computing Conference. [4] Glinz, M., S. Berner, S. Joos (2002). Object-oriented modeling with Adora. Information Systems 27, 6. 425-444. [5] Gomaa, H. and M.E. Shin (2007). Automated Software Product Line Engineering and Product Derivation. Proc. Hawaii International Conference on System Sciences, Hawaii. [6] Jayaraman, P. K., J. Whittle, A. M. Elkhodary, and H. Gomaa (2007). Model Composition in Product Lines and Feature Interaction Detection Using Critical Pair Analysis. In Proceedings of MoDELS’07, LNCS, page 15, Nashville TN USA. [7] Kang, K., S. Cohen, J. Hess, W. Novak, A. Peterson (1990). Feature-Oriented Domain Analysis (FODA) Feasi-bility Study. Technical Report CMU/SEI-90-TR-021. Carne-gie Mellon University. [8] Kästner, C., S. Apel, M. Kuhlemann (2008). Granularity in Software Product Lines. In Proceedings of the 30th Inter-national Conference on Software Engineering (ICSE). Leip-zig, Germany, pages 311-320. [9] Lahire, P., B. Morin, G. Vanwormhoudt, A. Gaignard, O. Barais, and J. M. Jézéquel (2007). Introducing Variability into Aspect-Oriented Modeling Approaches. In Proceedings of MoDELS’07, LNCS, pages 498–513, Nashville TN USA. [10] Meier, S., T. Reinhard, C. Seybold, M. Glinz (2006). Aspect-Oriented Modeling with Integrated Object Models. Modellierung 2006. Innsbruck, Austria. GI-Edition - Lecture Notes in Informatics, Vol. P-82. 129-144. [11] Meier, S., T. Reinhard, R. Stoiber, M. Glinz (2007). Modeling and Evolving Crosscutting Concerns in Adora. Proceedings of the 11th Workshop on Early Aspects at ICSE’07, Minneapolis, USA.
[12] Pohl, K., G. Böckle (2005). van der Linden, F.: Software Product Line Engineering – Foundations, Principles, and Techniques. Springer, Heidelberg. [13] Reinhard, T., C. Seybold, S. Meier, M. Glinz, N. Merlo-Schett (2006). Human-Friendly Line Routing for Hierarchi-cal Diagrams. Proceedings of the 21st IEEE International Conference on Automated Software Engineering (ASE'06), Tokyo, Japan. 273-276. [14] Reinhard, T., S. Meier, M. Glinz (2007). An Improved Fisheye Zoom Algorithm for Visualizing and Editing Graphical Models. Proceedings of the 2nd International Workshop on Requirements Engineering Visualization (REV'07) at RE’07. New Delhi, India. [15] Reinhard, T, S. Meier, R. Stoiber, C. Cramer, M. Glinz (2008). Tool Support for the Navigation in Graphical Mod-els. Formal Research Demo at 30th International Conference on Software Engineering (ICSE 2008), Leipzig, Germany. [16] Seybold, C., M. Glinz, S. Meier, N. Merlo-Schett (2003). An Effective Layout Adaptation Technique for a Graphical Modeling Tool. Proceedings of the 2003 Interna-tional Conference on Software Engineering (ICSE 2003), Portland. 826-827. [17] Stoiber, R., S. Meier, M. Glinz (2007). Visualizing Product Line Domain Variability by Aspect-Oriented Mod-eling. Proceedings of the 2nd Int. Workshop on Requirements Engineering Visualization (REV'07) at RE’07. New Delhi, India. [18] Voelter, M., I. Groher (2007). Product Line Implementa-tion using Aspect-Oriented and Mode-Driven Software De-velopment. 11th International Conference of Software Prod-uct Line Conference. Kyoto, Japan.