Embed Size (px)
Citation preview


Overview
Interface
Loading Data
Browsing the Data
Sessions
Exercises

Overview
Interface
Loading Data
Browsing the Data
Sessions
Exercises

Where are we?
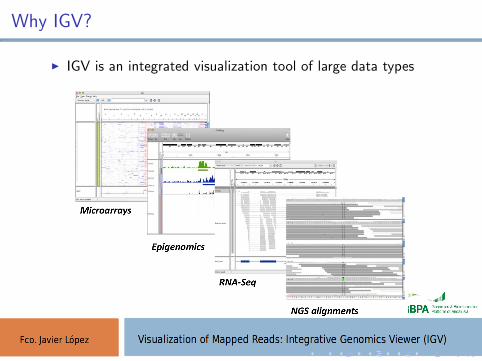
Why IGV?
I IGV is an integrated visualization tool of large data types

Why IGV?
I Integrate different data types simultaneously
I View large datasets easily
I Fast navigation
I Run it locally on desktop
I Easy to use interface

Why IGV?
I Large-Scale projects using IGVI The Cancer Genome Atlas
http://cancergenome.nih.gov/I Multiple Myeloma Research Consortium
http://themmrc.org/I 1000 Genomes Project
http://www.1000genomes.org/

History and Usage
I First release was in August 2008
I Current version: 2.2
I Open source and freely available
Overview
Interface
Loading Data
Browsing the Data
Sessions
Exercises

Main Window

Tool Bar
Genome drop-down box Loads a genome
Chromosome drowp-down box Zooms to a chromosome
Search box Displays a genomic location
Whole genome view Zooms to whole genome view
Moves backward and forward
Refresh Refreshes the display
Define a region Defines a region of interest
Fits all tracks to the window
Toggles on/off pop-up information
Zoom slider Moves to a chromosome

Available Genomes
I Human, Mouse, S. cerevisiae, C. Elegans, D. melanogaster,and others
http://www.broadinstitute.org/software/igv/Genomes

Overview
Interface
Loading Data
Browsing the Data
Sessions
Exercises

Data types
I General characteristicsI Any data related to genome coordinatesI Sample annotation/attributesI Genome annotations

Data types
I IGV supports multiple file formats
Source Data Recommended File Formats
Sequence alignment data SAM (must be sorted/indexed)
BAM format (must be indexed)
Genome annotations GFF or GFF3 format, BED format
ChIP-Seq, RNA-Seq TDF format. Use igvtools to generate
a binary read count. Load the
resulting TDF file into IGV.
Any numeric data IGV format, TAB format
WIG format
Gene expression data GCT format
RES Format

Loading a BAM file
I BAM format: SAM binary. Reduces disk space and accesstime.
I For each read, provides the position(s) where it maps andinformation about the alignment.
I BAM files need to be indexed (samtools). SAM files need tobe sorted by start position and indexed.
Index an example bam file
samtools index /home/biouser/mda13/mqc-igv/igv1.bam
ls -la /home/biouser/mda13/mqc-igv/igv1.*

Loading a BAM file
Open IGV
igv
Load an example bam file
I File → Load from file →/home/biouser/mda13/mqc-igv/igv1.bam

Overview
Interface
Loading Data
Browsing the Data
Sessions
Exercises

Moving around

Moving around
Type genomic coordinates 21:32508271 in the search box
I At low resolution only coverage is shown
I At higher resolution, reads are shown including where basesdiffer
Leave the cursor on a read

Track options
Right click on track

RefSeq track
Type GART in the search box

RefSeq track
Zoom in to focus on an exon
I Reference nucleotide sequence
I Predicted aminoacid sequence

RefSeq track
Right click on the RefSeq track → Expanded
Zoom out to get a general view of the mapping profile
I Reads are grouped around exons. Is that a coincidence?No. This bam is part of an exome sequencing experiment.

Loading a BED file
I Let’s load capture regions
I BED format: to store a list of genomic regions. Text file withthe list of regions. Each line contains one region with threerequired fields separated by tabs: chromosome, startcoordinate, end coordinate
http://genome.ucsc.edu/FAQ/FAQformat.html
less /home/biouser/mda13/mqc-igv/igv.bed
Load a bed file
I File → Load from file → igv.bedAnother track appears: blue boxes indicate target regions

Visualizing variants
Move to 21:48022375
I Variant: ref:C, alt:A, heterozygosis
Leave the cursor over that position on the histogram (top ofthe track)

Visualizing variants
Right click over that position on the histogram
Move to 21:47786817
I Variant: ref:C, alt:G, homozygosis

Visualizing variants
I Files containing a variant list can also be loaded: VCF files(Variant Calling Format).
less /home/biouser/mda13/mqc-igv/igv.vcf
I VCF format:
http://genome.ucsc.edu/FAQ/FAQformat.html
I Text fileI Header including information about the mapping and variant
calling processes: set of lines begining with ##I An additional header line begining with #: contains a table
header with column identifiersI One line for each variant: chromosome, genomic position,
reference and alternative bases

Visualizing variants
I VCF files need to be indexed before being loaded:
igvtools index /home/biouser/mda13/mqc-igv/igv.vcf
ls -la /home/biouser/mda13/mqc-igv/igv.vcf*
Load a VCF file
I File → Load from file → igv.vcf A new track is added
Move to 21:47786817
I A peak appears indicating the variant position.

Visualizing variants
I Leave the cursor over that position on the vcf track:

Overview
Interface
Loading Data
Browsing the Data
Sessions
Exercises

Create/Open/Save Sessions
I Your current session can be saved

Overview
Interface
Loading Data
Browsing the Data
Sessions
Exercises

Exercise 1
I Load /home/biouser/mda13/mqc-igv/igv2.bam
I Load /home/biouser/mda13/mqc-igv/igv1.bam
I Move to chr11:1,016,174-1,018,316
I Can you see any difference between both tracks?
I Is the igv2.bam mapping a good or a bad result?
I Can you think of the reasons that lead to such result?
I Can you think of any way of improving it?

Exercise 2
I Load /home/biouser/mda13/mqc-igv/igv1.bam
I Move to 21:47917047
I What is happenning in our sample in that position?

Exercise 3
I Load /home/biouser/mda13/mqc-igv/igv1.bam
I Move to 21:26973663
I What is happenning in our sample in that position?

Exercise 4
I Load /home/biouser/mda13/mqc-igv/igv1.bamI Which of these variants would you trust? Why? Which is the
sequence change in each case?
1. 21:478217262. 21:465962303. 21:428485604. 21:47917170

Exercise 5
I Considering that /home/biouser/mda13/mqc-igv/igv.bedcontains the target regions of a given sequencing experimentand that /home/biouser/mda13/mqc-igv/igv1.bam is themapping result, how well are the target regions of the geneMX2 covered?
I Focus on a particular target region and have a look at thehistogram on the top of the igv1.bam track.
I Which is the shape of the histogram? Can you explain this?I Which would be the desired shape?

Exercise 6
I Considering that /home/biouser/mda13/mqc-igv/igv.bedcontains the target regions of a given sequencing experimentand that /home/biouser/mda13/mqc-igv/igv1.bam is themapping result, look for unsequenced target regions of thePRMT2 gene.