Embed Size (px)
Citation preview

Visualization of Large-Scale Distributed Data
Jason Leigh1, Andrew Johnson1, Luc Renambot1, Venkatram Vishwanath1, Tom Peterka2, Nicholas Schwarz3 1Electronic Visualization Laboratory, University of Illinois at Chicago; 2Argonne National Laboratory; 3 Northwestern University INTRODUCTION
The primary goal of visualization is insight. An effective visualization is best achieved through the creation of a proper representation of data and the interactive manipulation and querying of the visualization. Large-scale data visualization is particularly challenging because the size of the data is several orders of magnitude larger than what can be managed on an average desktop computer. Data sizes range from terabytes to petabytes (and soon exabytes) rather than a few megabytes to gigabytes. Large-scale data can also be of much greater dimensionality, and there is often a need to correlate it with other types of similarly large and complex data. Furthermore the need to query data at the level of individual data samples is superseded by the need to search for larger trends in the data. Lastly, while interactive manipulation of a derived visualization is important, it is much more difficult to achieve because each new visualization requires either re-traversing the entire dataset, or compromising by only viewing a small subset of the whole. Large-scale data visualization therefore requires the use of distributed computing.
The individual components of a data visualization pipeline can be abstracted as:
Data Retrieval à Filter / Mine à Render à Display
The degree to which these individual components are distributed or collocated has historically been driven by the cost to deploy and maintain infrastructure and services. Early in the history of scientific computing, networking bandwidth was expensive and therefore scarce. Consequently early visualization pipelines tended to minimize the movement of data over networks in favor of collocating data storage with data processing. However, as the amount and variety of data continued to grow at an exponential pace, it became too costly to maintain full replicas of the data for each individual that needed to use it. Instead, by leveraging the widespread expansion of the Internet and other national and international high-speed network infrastructure such as the National LambdaRail1, Internet-22, and the Global Lambda Integrated Facility3, data and service providers began to migrate toward a model of widespread distribution of resources.
In this chapter we will first introduce the various instantiations of the visualization pipeline and the historic motivation for their creation. We will then examine individual components of the pipeline in detail to understand the technical challenges that must be solved in order to ensure continued scalability. We will discuss distributed data management issues that are specifically 1 www.nlr.net 2 www.internet2.edu 3 www.glif.is

relevant to large-scale visualization. We will also introduce key data rendering techniques and explain through case studies approaches for scaling them by leveraging distributed computing. Lastly we will describe advanced display technologies that are now considered the “lenses” for examining large-scale data. THE LARGE-SCALE DATA VISUALIZATION PIPELINE Collocated Data, Filtering, Rendering and Display Resources
Most visualization software packages have a pipeline architecture where raw data comes in at one end of the pipeline from disk or the network, moves through a sequence of filters that process the data on the CPU and generate computer graphics primitives (e.g. lines, triangles, splats, pixels) which are rendered on the GPU, and displayed on a monitor at the other end of the pipeline. Some filters deal with accessing data or generating data. Other filters convert data from one form to another. Finally there are filters that deal with the creation of computer graphics. Each filter has an explicit input and output format allowing compatible filters to be linked together to move data through the pipeline, and new filters can be added to the library of filters to support new data formats, graphics formats or rendering techniques.
For example, in 2008 the NASA funded ENDURANCE project sent an autonomous underwater vehicle (AUV) into ice covered West Lake Bonney in Antarctica. The AUV took measurements of temperature, conductivity, pH, and five other values at over 18,000 points within the lake. If a scientist wants to see overall temperature trends in the lake then the pipeline could read in the data, and plot each temperature value as a box at the appropriate X, Y, Z location where each box is colored based on a transfer function that maps a given temperature value to a particular color. To look inside the lake, the scientist may want to see the temperature values only on a plane slicing through the lake. Here the pipeline could add a filter to interpolate raw temperature values across the surface of the plane. The scientist might also want to compare multiple values (e.g. temperature, conductivity, and pH) by plotting all three simultaneously.
Figure 1: Three views of West Lake Bonney in the McMurdo Dry Valleys of Antarctica. (ENDURANCE data collection was supported by NASA Space Sciences grant NNX07AM88G).
The advantages of this kind of pipeline/layered approach were described in the 1987 report from the first workshop on Visualization in Scientific Computing (McCormick, 1988) that in

many ways marked the official beginning of the field of Scientific Visualization. These advantages include:
• Easy adaptation to a variety of data sources and display devices; • Software that is tailorable to the needs of diverse applications; • The ability to add more techniques and algorithms; • Layers that can be distributed to different computers to better leverage their capabilities
and minimize cost; • Affording economically viable development of a shared and interoperable set of tools; • Software that can accommodate different budgets and equipment preferences of a broad
community of users; • Being able to address the demands of a broad scientific community in coherent unison
rather than on a case-by-case basis.
Rendering can produce geometric primitives such as points, lines, or surfaces made of triangles that can be cached on the graphics card. When the user changes their viewpoint on the visualization, these primitives can be quickly re-rendered without re-running the data access, data conversion, and rendering filters in the pipeline. While adequate for point, vector, or surface data, these polygonal representations are less appropriate for volumetric data. An alternative is direct rendering where there is no geometric representation and individual data points are drawn as ‘splats’, or volumes are rendered through raytracing each pixel on the screen. Direct rendering can give much better views of volumetric data, however as there are no graphics primitives to be cached, the entire scene must be re-rendered when the viewpoint changes.
In addition to rendering the dataset itself, supplementary graphics are often needed to put the data into context (e.g. in our example of the lake above, it might be helpful to see an outline of the lake, or a North pointing arrow, or latitude and longitude lines) and to supply information about the visualization (depth scale, legend, color bars, etc.) Filters in the pipeline generate these supplemental graphics or read them from disk. These also must be re-drawn when the visualization is re-rendered but supplementary graphics are usually very lightweight compared to the data being visualized.
Rendering is usually done locally on the display machine. These visualizations can be viewed in 2D on a typical monitor screen or projector, or in 3D using a stereoscopic monitor, CAVE© (Figure 2) (Cruz-Neira, 1992), or other stereo projection setup. Rendering in 3D may make it easier to disambiguate complex multi-dimensional datasets but the creation of the 3D version requires rendering the dataset from two viewpoints – one for each eye. For users lacking a 3D display, the ability to quickly rotate a visualization, and the ability to view the dataset from multiple angles simultaneously can help disambiguate complex scenes. While this text focuses on rendering data visually there is also a body of work focusing on ‘visualizing’ data using sonification or haptics to augment visualization through the use of other senses. In these cases most of the pipeline remains the same except that there is additional rendering and display needed for these other senses.
The user interacts with the visualization by directly or indirectly modifying the filters in the pipeline – either by adding or removing filters, or changing the parameters of the existing filters. One of the major advantages of a pipeline architecture is that the entire pipeline does not need to be re-run when a change is requested. If intermediate results are stored at each of the filters then only the filters downstream from the affected filter need to be recomputed. This saves time at the cost of needing more memory to hold both the original dataset and its intermediate forms. Once

the pipeline is set up correctly, similar datasets (e.g. multiple timesteps) can be fed through the pipeline without changing the filter settings.
Figure 2: Hydrology of the Chesapeake Bay visualized in the CAVE© Virtual Reality Environment.
The user can interact with the visualization in several ways. In the simplest case the user can
change their point of view, or rotate and scale the visualization to see the visualization as an object from the outside looking in, or from within the visualization looking around. The user will also typically want to turn individual visualizations or supplementary graphics on and off, change the time-step in an animated sequence, change the color transfer function, or change the representation of the visualization (points, surface, glyphs.) More sophisticated users will want to dynamically change the pipeline itself. Interaction with the pipeline is typically through a graphical user interface that is linked into the pipeline, allowing the user to interact with familiar interface elements - buttons, sliders, check boxes that affect the filter parameters behind the scenes. On desktop systems interaction is typically performed with a keyboard and mouse. Immersive environments with head-tracking allow a user to more naturally change their point of view by simply moving their head, but these environments typically use a hand-held pointer instead of a mouse and keyboard making it harder to accurately change parameters quickly.
Given the large amounts of data in multi-dimensional datasets, the amount of data must be reduced at several points prior to display; there will often be more raw data points than there are pixels on the screen to display them, or space in main memory to hold them. For interactive visualization, datasets often need to be reduced so they will fit on disk at the local site, further reduced to fit in main memory at the local site, and further reduced to fit into memory on the local graphics card(s). Visualization systems often store data at multiple resolutions to allow the user to have fast interactive access to a lower resolution version of the visualization that can remain on the graphics card. This allows a user to quickly manipulate the low-resolution version, for example rotating a wireframe box showing the space the data takes up, or a visualization of only

every 100th data item, while still seeing enough landmarks to do the manipulation accurately. Once the user stops manipulating the low-resolution version of the visualization, the pipeline can take the time to generate the full-resolution version, replacing the low-resolution version.
For real-time interaction with this kind of visualization there are limited filtering opportunities. Interaction is very fast if the data being visualized fits in the graphics card, for example changing the viewpoint on a polygonal surface representation or on volume data that fits in the card’s 3D texture memory. If the user changes the visualization parameters on an existing visualization (e.g. generating a new polygonal iso-surface or changing the viewable subset of volume data) then various filters are going to need to be re-run. The CPU will need to use data from main memory to compute the new visualization and send it to the graphics card. If the necessary data are not currently stored in main memory then the CPU needs to move it in from disk or from the network, and the user must wait for that data to be fetched before the pipeline can execute and display the results. Prefetching data to local disk or main memory can be used to reduce this wait time, but there is only so much storage space on the graphics card, in main memory, and on local disk, so that space usage must be optimized for a given visualization. This often means that an initial preprocessing step is needed to turn large datafiles into a hierarchy of fixed sized blocks for faster transfer between the various caches.
With CPUs moving towards an increasing number of cores rather than each core becoming increasingly faster, being able to parallelize the work of the visualization pipeline on a single machine, as well as using clusters to parallelize the work across multiple machines is becoming more important in decreasing computation time for very large datasets. Shading languages such as GLSL and CG are being used to speed up the rendering on the GPUs. Languages like CUDA are being used on GPUs to speed up computation by moving some of the computation off of the CPU and onto the GPU. As with multiple CPUs, in these cases bus bandwidth can become another limiting factor- if one cannot move the data fast enough into the CPU then one cannot fully take advantage of the CPU’s processing power. Non-Interactive, Offline Rendered Visualization
When computational simulations produce extremely large datasets, and/or when raw data collected by scientific instruments, such as remote sensors, fill up storage systems, interactive exploration of the results becomes extremely difficult. A common and effective approach has been to produce animations and video files from the data that the scientist can explore at his or her home institution and can share with colleagues.
Long running simulations such as weather or earthquake simulations, protein folding, high-energy physics or astronomical computations fall in this category. They require large amounts of data as initial conditions (the starting point of the simulation) and produce greater amounts of data, often through a time series of results (a complete solution for each time step during the length of the simulation).
When faced with such a scenario, scientists are often in a situation where the data are too large to be gathered and shipped back to his or her office computer for analysis and visualization. The data has to remain within the supercomputing facility hosting the computational simulation or the data storage in the first place.
One solution then is to schedule batch (non-interactive) jobs that produce images based on the simulation results. An image can be generated for each time step of the simulation, or an animated camera can follow a predetermined path for a given dataset. More complex visualizations can combine animations of numerous parameters (camera path, time series, change

in representation, selection of variables to be visualized, etc.). While the time to render one frame can be rather large, the common approach is to apply an image-based parallelization where each processor renders a distinct complete frame. This is relatively simple to implement and fits well in the supercomputing infrastructure: a number of processor nodes can access a large commonly shared file system hosting the complete simulation results. If rendering jobs access different time step results, each processor will access unique files and maximizes I/O throughput. If rendering jobs access the same data, the read-only nature of the process also maximizes file system usage.
The end result of the rendering job is a series of frames, usually kept in a non-destructive file format, such as TIFF, to maintain data integrity. Since it’s a non-interactive process, high-resolution, including stereoscopic 3D, as well as high quality images can be produced using photo-realistic rendering techniques such as raytracing. Frames can be combined in various movie formats of different resolution and quality for multiple purposes (result dissemination, education and outreach, movie production, etc.).
The software used for such approaches varies greatly from very specific home-brewed visualization software for a very narrow purpose (such as seismic wave propagation for earthquake visualization), to scientific rendering toolkits (such as the ‘Visualization Toolkit’, vtk.org, for medical or engineering applications), finally up to general-purpose rendering packages (such as Autodesk Maya or Pixar’s Renderman). If available, graphics hardware can be used to speed up such intensive rendering jobs.
Given the non-interactive characteristics of this process, the problem resides in specifying the visualization and rendering parameters (variable selection, camera path, shading, lighting, etc.). Scientists have devised different approaches: for a well-defined visualization technique such as volume rendering, the main parameter to be selected is the transfer function that defines the mapping from data values into color and transparency. This function can be selected off-line, on a small dataset and then applied during full-scale rendering. A desktop user-interface or a web portal can be used to define rendering job characteristics (data input, image size, quality, etc.) and visualization parameters (viewpoint, transfer functions, etc.). More advanced systems let the user preview the visualization in low resolution and quality but give full access to all the parameters of the visualization (for instance Autodesk Maya). Even more advanced systems allow the user to be immersed in the visualization by using a VR device such as the CAVE©, where the scientists can interact with a proxy (reduced dataset) of the visualization and ‘choreograph’ the rendering to be done. Donna Cox, leading the Advanced Visualization Laboratory at the National Center for Supercomputing Applications (NCSA) at the University of Illinois at Urbana-Champaign, has pioneered such an approach with the ‘Virtual Director’ system (Thiebaux, 2000).
With the advent of petascale computing, where the data produced is so large that it overflows even the largest storage infrastructure, the approach of generating movies and animations directly inside the supercomputing facility is gaining renewed interest taking the model in different directions:
• Compared to petascale sized datasets, even the highest resolution uncompressed rendering is becoming attractive for its predictable and manageable size. A format gaining traction is the so-called 4K format (4096x2160 pixel resolution) adopted by the digital cinema initiative as the next generation movie distribution format. At four times the resolution of high-definition television, it becomes possible to portray a simulation dataset with exquisite detail.
• While simulations can run for an extremely long time, it is often beneficial to couple the simulation process with the visualization process, and generate early rendering results as

soon as possible while the simulation is still running. This technique, referred to as computational steering if the user can interactively control simulation parameters, enables early detections of problems such as programming bugs or incorrect initial conditions in the simulation. The simulation-visualization coupling can be done through a data checkpoint on storage, or through network communication between a simulation cluster and a visualization rendering resource.
• If a tight coupling between simulation and visualization is achieved by running both programs on the same computational resource, in situ visualization can be performed, removing the need for any storage or data transmission, hence speeding up the generation of visual results.
• Using high-speed networking, the rendering need not to be stored for later examination, but can be streamed in full quality to the scientist at his or her desk.
The benefits of running the complete visualization pipeline all at once and generating
animations or video streams are: • Asynchronous work (“submit and forget”) for the scientists; • Non-interactive jobs where known batch optimizations can be applied, and predictable
usage of resources make the visualization process efficient and acceptable by the scientist and the supercomputing community;
• Early rendering as the simulation is running can be extremely beneficial; • The end product is much smaller than the simulation data (even for high-resolution
uncompressed rendering), and can still be cut and edited into a movie production pipeline for education, dissemination and outreach.
The drawbacks of the approach are: • Non-interactive visualization- so the scientist needs to know what to look for, hence
limiting the visual exploration of simulation results. • May require work on proxy data beforehand to determine the visualization and rendering
parameters • Data has to be reloaded and re-rendered if modifications are needed.
Examples of Offline Rendered Visualizations
• The San Diego Supercomputing Center and the Southern California Earthquake Center’s TeraShake is the largest and most detailed simulation of what happens during a major earthquake on the southern San Andreas fault, computed at 3000x1500x400 resolution. Various volume renderings are used to produce movies. The parameters of visualization are submitted by scientist through a web portal, which in turn schedules and launches numerous jobs on large compute clusters such as the TeraGrid. The end results are time-series animations for various earthquake scenarios.
• The National Center for Supercomputing Applications’ classic tornado simulations calculated the birth of a tornado, starting with data from weather conditions that produced a powerful tornado in South Dakota. The results are choreographed and cinematic renderings of this complex simulation data combining artistic and scientific expertise translated the data into a dynamic, high-definition animated visualization. Data representations (proxies) are loaded into software such as Maya, visualization parameters

are selected interactively in pre-visualization, and then jobs are launched for rendering on a powerful cluster computer.
• Accurately modeling the dynamics and structure of the Earth's interior requires massively distributed computational techniques - the use of high-performance PC clusters generating terabytes of data which are then visualized through distributed volumetric rendering methods to produce high-quality monoscopic and stereoscopic visualizations. Global seismic wave propagation data are generated with software from the Theoretical & Computational Seismology group at the California Institute of Technology. This software produces highly accurate simulations of wave propagation. Global models for each time-step are combined to create a global model of seismic wave propagation over time. A one-hour seismic wave field divergence simulation of the 1994 earthquake in Bolivia highlighting positive amplitude compression (P) waves at progressive stages during propagation takes 21 hours to compute. The simulation data are redistributed across the cluster according to the requirements of the specific visualization algorithm. The 169 time steps of the simulation are sampled uniformly throughout model time, making the total time for gathering and interpolating the data 33.8 hours, producing a 512 x 512 x 512 regular grid at 16-bit resolution (40GB-worth of data). An interactive tool is used for staging and rendering monoscopic and stereoscopic 3D volumetric animations. The approach allows the user to interactively select datasets, setup camera positions, pick color, opacity and gradient transfer functions, and specify movie properties. The rendering was performed on a TeraGrid cluster at the San Diego Supercomputing Center on up to 64 nodes. The table below shows rendering times and speedups for a low-resolution stereoscopic rendering and high-resolution monoscopic rendering of the 169 time steps of the simulation: it shows significant acceleration, where the stereoscopic animation takes only 2 minutes and 30 seconds to generate on 64 processors, and the high-resolution animation showing all the simulation details took only 28 minutes. The end products, as shown in the following pictures, are time-series animations showing three different views of the wave propagation through the earth.
Stereo pairs (1024x768)
Time and speedup High-resolution (8000x3600)
Time and speedup 1 processor 2h30min 1.0 20h 1.0 32 processors 5min 30.0 52min 23.1 64 processors 2min30sec 60.0 28min 42.0
Table 1: Rendering time and speedups for seismic rendering on a 64-node cluster.

Figure 3: Seismic wave field divergence visualization of the 1994 earthquake in Bolivia highlights positive amplitude compressional waves at progressive stages during propagation (vanKeken, 2001). Fully Distributed Visualization
As the amount and variety of available data on the Internet grows, so will the means by which the data can be filtered or mined, visualized and displayed. There is no single data mining or visualization technique that will satisfy the needs of every application; the choice of technique is highly dependent on the fundamental question being asked about the data. The power of the Internet is maximally leveraged when storage, filtering / mining, visualization and display capabilities are presented as independent services that can be combined in a myriad different ways, distributing the visualization pipeline around the planet. Google maps is an example of how the coupling of a map service with a data service can provide wholly new forms of information and insight.
A key technological enabler for a distributed service-oriented paradigm (sometimes referred to as Grid Computing or Cloud Computing) is an abundance of high-speed networking. Traditionally, networking was considered expensive and it was therefore impractical to move large quantities of data over them. As a result, data filtering and mining algorithms were collocated with the source of the data. This made it difficult for new filtering and mining algorithms to emerge as it was not possible for the original data providers to anticipate all the different ways in which their users might want to use the data. However with the continual decrease in networking costs, a fully distributed model is quickly becoming practical.
In 2002, the National Science Foundation’s OptIPuter project sought to envision how unlimited networking bandwidth could change fundamental notions of computing and the way scientists conduct basic research (Smarr, 2003). In the OptIPuter model, all computing resources were fully distributed, and the networks that tied the resources together were thought of as wide-

area system busses rather than networks. Therefore a cluster of computers with massive amounts of storage was collectively considered a single virtual disk drive, and a cluster of computers with high performance graphics cards was thought of as a single graphics card. The project resulted in the creation of numerous innovations which include: ultra-high-speed network transport protocols that could routinely move data over 1-10 Gigabit/s networks between individual compute nodes at close to the full line rate of the network (Vishwanath, 2007; He, 2002; Xiong, 2005); ultra-high-speed national and international networks that could be provisioned directly by the applications through the allocation of dynamic light paths (DeFanti, 2003); wide-area RAMDisk caches that could improve I/O-bound scientific applications by five-fold (Vishwanath, 2008a); and new middleware and hardware approaches to drive network-enabled displays with hundreds of megapixels of resolution (Jeong, 2006). The OptIPuter project members were able to successfully demonstrate that these individual systems could be daisy-chained to produce a planetary-scale distributed computer (Zhang, 2003).
DATA MANAGEMENT FOR SUPPORTING DISTRIBUTED VISUALIZATION
Visual exploration of multi-terabyte and petabyte-sized datasets is critical to gain insight in scientific domains, such as astrophysics, earth sciences and biosciences. When a hurricane is about to make landfall, scientists involved in disaster management need to visualize, in real-time, climate models running on geographically distributed clusters, overlay these models with high-resolution map data, sensor data and traffic information, to make informed decisions regarding the evacuation of people. The requirements of these visualizations include access to multiple 2D, 3D, 4D and higher dimensional datasets that are geographically distributed. However, the critical challenges in achieving high performance are the access latencies of storage systems and wide-area networking, rapid access to large multi-dimensional datasets, and transparent access to both local and remote data repositories.
Scientists have traditionally copied remote datasets to local repositories in order to visualize them. However, data replication is no longer a viable solution due to the enormous data-set sizes, cost of the additional local storage, data consistency issues and real-time requirements. Prior work enabling visualization for distributed data were limited to accessing a single multi-dimensional dataset (Gao, 2005 and Ding, 2003), data present in a specific format (Prohaska, 2004) or data present on a specific storage system (Bethel, 2000 and Ding 2003). Additionally, these solutions were demonstrated on 1Gbps wide-area networks using TCP as the transport protocol to transfer data (Bethel, 2000, Ding, 2003 and Benyon, 2002). However, TCP fails to scale to the 10x Gbps wide-area networks, and novel transport protocols are needed to fully exploit the large available bandwidth. As visualization applications require access to data in multiple scientific formats present in various filesystems on distributed data repositories, a cohesive data management scheme that provides rapid and transparent access to datasets independent of their formats, storage systems, and at the same time fully exploiting the available bandwidth to provide low latency access is of paramount importance.
Case Study : LambdaRAM, a Distributed Data Cache
LambdaRAM (Vishwanath, 2009) is an approach to address the data management needs of large distributed data visualization. LambdaRAM is a high-performance, multi-dimensional, distributed cache that harnesses the memory of cluster nodes in one or more clusters that are interconnected by ultra-high-speed networks, providing data-intensive scientific visualization applications with rapid and transparent access to both local and remote data. LambdaRAM

employs novel latency mitigation heuristics based on the access patterns of an application, including presending, a push-based mechanism, prefetching, a pull-based mechanism, and hybrid combinations of them, proactively fetching data before an application needs it. It uses high-performance data transfer protocols, including Celeritas (Vishwanath, 2008b), designed to fully exploit the large available bandwidth of wide-area optical networks. LambdaRAM employs multi-dimensional distributed data structures, including multi-grids and octrees, to manage multi-dimensional datasets. This enables support for 2-D, volume, time-varying volume, and parallel coordinate based visualization. LambdaRAM efficiently distributes and manages the data across the nodes of the clusters. The data distribution in LambdaRAM is configurable and can easily be tuned to the needs of an application. Scientific visualization requires access to datasets present in formats including TIFF, HDF4, NetCDF, raw and binary data. Additionally, datasets could be located on local storage, parallel filesystems or distributed filesystems. LambdaRAM has an extensible design that aids in the design of plug-ins to interface visualization applications with multiple scientific data formats and filesystems. Additionally, as a scientific dataset is typically composed of multiple files, LambdaRAM presents an intuitive API to applications to access and manipulate this dataset as without having to worry about data management. The API allows visualization applications to easily subsample, subset and interact with the data. LambdaRAM can manage multiple-datasets simultaneously. This is critical for visualization applications using multi-resolution techniques wherein each resolution is managed as a dataset in LambdaRAM. LambdaRAM provides memory quality of service guarantees necessary in interactive data visualization to ensure that the low-resolution data are always cached in memory. Additionally, As we scale towards petascale and future exascale systems, software testing is no longer sufficient to guarantee reliable performance in mission critical environments. Formal verification techniques have been applied to prove the safety and progress properties of LambdaRAM (Vishwanath, 2008a). This helped identify a deadlock condition in the memory management of LambdaRAM.
Figure 4 depicts a parallel visualization application using LambdaRAM to access the 600TB multi-dimensional national aeronautics and space administration’s (NASA) modern era retrospective analysis for research and application (MERRA) data distributed on a local parallel filesystem. In this case, LambdaRAM harnesses the memory of the nodes of the cluster. LambdaRAM can harness the memory of the nodes of multiple clusters interconnected by ultra-high-speed networks to provide low-latency access to remote data. Figure 5 depicts a parallel data visualization application running at NASA Ames using LambdaRAM to rapidly and transparently access the MERRA data repository at NASA Goddard over 10 Gbps high-speed networks. LambdaRAM helps data visualization scientists spend their efforts on the visualization algorithms and facilitate scientific discovery instead of spending their efforts on data management issues including subsampling and subsetting the dataset, memory management and copying data between sites. LambdaRAM enables time-critical, high-performance data collaboration over both the local and wide-area for data-intensive applications. Its extensible design enables high-performance highly productive scientific visualization of large distributed data.

Figure 4: LambdaRAM encompassing the memory of nodes of a single cluster.
Figure 5: LambdaRAM harnessing the memory of multiple clusters to provide low latency and transparent access to remote data. Distributed Data Access and Visualization of NASA’S MERRA Data for Climate Analysis using LambdaRAM over Wide-Area Networks
The MERRA time period covers the modern era of remotely sensed data for the entire earth, from 1979 through the present and is key in understanding climate variability The data are published in the HDF4 format and consist of multiple 2D, 3D and 4D variables. The dataset size is approximately 600TB and is stored at NASA Goddard. Given the size of the dataset, replicating it at other sites incurs a heavy cost. Additionally, given the researchers’ need to modify the dataset, replication could lead to data consistency issues. NASA would like to enable their researchers and collaborators at various sites to seamlessly access the data located at

Goddard and use it in their weather analysis and visualizations. The ability to rapidly stride over the multidimensional MERRA data using LambdaRAM would enable earth scientists to make more informed weather predictions.
Figure 6: Wide-area 10Gbps testbed to evaluate the performance of accessing data using LambdaRAM to visualize MERRA data. StarLight4 is a 1 and 10 Gbps network connection point for both national and international research traffic.
The performance of a climate analysis and visualization application accessing NASA’s MERRA data using LambdaRAM over wide-are networks was evaluated. For this experiment, MERRA data for 1979 was stored on an ultra-fast storage system at Chicago. The dataset is approximately 1 Terabyte (TB) in size, and consists of 1440 data files in HDF4 format. The storage system consists of a dual-processor dual-core AMD Opteron system with 4GB of RAM, 2TB of storage and a 10GE PCI-e based network interface card (NIC). The 2TB storage was configured using eight 300 GB SATA – II disks on a PCI-e based 8-port 3ware RAID controller using RAID 0. The data analysis and visualization was performed on a node at NASA Goddard. This node consists of a dual-core dual-processor AMD Opteron with 4GB RAM and a 10GE PCI-X based Intel NIC. A dedicated 10 Gbps network was provisioned for the experiment to interconnect the two nodes. The network testbed is depicted in Figure 6 and consisted of the CAVEWave network between Chicago and McLean, Virginia, and the DRAGON network between McLean, VA and NASA Goddard. The total round trip latency for this network was around 18ms.
Figure 7 depicts the times to access, compute and visualize the average ozone thickness of MERRA data for 1979. From the figure, one can see as much as a 50% improvement in performance with a single LambdaRAM server and a 100% improvement using two LambdaRAM servers as compared to a typical ultra-fast storage system. On local storage, accessing multidimensional data involves accessing multiple noncontiguous regions on disk which incurs significant access overhead and leads to performance degradation. Improved performance was observed using presending over prefetching as it does not incur the one-way request latency in prefetching. Presending yielded 8.3% performance improvement over prefetching using a single LambdaRAM server and 21.6% using two LambdaRAM servers. Also observed is a 27% performance improvement by using Celeritas, an application-layer UDP-based reliable transport protocol, in comparison to TCP over the wide-area network. Celeritas sustained an average throughput of 3.5Gbps in the case of two LambdaRAM servers and 2.1Gbps using a single LambdaRAM server and played a key role in achieving high-performance over the Wide-area networks.
4 www.startap.net/starlight

Figure 7: Striding and computing the average ozone thickness for the entire world for 1979. The application runs at NASA Goddard and uses LambdaRAM to access data located in Chicago. Lower time indicates better performance.
Particularly noteworthy was that it was faster to stride, compute and visualize the average
ozone thickness of the remote MERRA data using LambdaRAM than using a local ultra-fast storage node. Additionally, parallel data analysis applications have demonstrated up-to a five-fold performance improvement by using LambdaRAM to access multidimensional data on a PVFS2 parallel filesystem in comparison to using MPI-IO to directly access the data. This is due to the multidimensional data management and latency mitigation heuristics in LambdaRAM. At Supercomputing 2004 and 2005, an interactive visualization of large 2-D imagery using LambdaRAM to access data over transatlantic networks, was demonstrated.
LambdaRAM’s model of aggressively using network bandwidth to overcome latency will be crucial to ensuring the scalability of distributed computing and visualization applications whose greatest bottleneck will be in getting the data to the processing units. DATA RENDERING FOR SUPPORTING DISTRIBUTED VISUALIZATION
So far, we have seen a number of complete examples demonstrating different instantiations of the visualization pipeline, both collocated and distributed, interactive and batch. The prior section emphasized the early stages of the pipeline, managing and staging data. We now move further down the visualization pipeline to the rendering step, again with a variety of architectures and with an emphasis on large, distributed, multivariate data. Before presenting more examples, though, we begin with a brief summary of basic methods and algorithms performed serially on a single machine. Next, we examine how these methods must be modified when datasets grow in size and complexity and architectures grow in parallelism and heterogeneity. We conclude with two case studies in parallel volume rendering – one in hardware on a rendering cluster another in software on a parallel supercomputer.

Rendering Techniques Rendering methods for scientific visualization are organized according to the type of data
values and grid containing those values. Data values constitute a field over the grid, F(G), where G ⊂ ℜn. Most often, G is two-dimensional (n = 2) and F = F(x, y), or three-dimensional (n = 3) and F = F(x, y, z). In the case of time-varying data, time can be treated as a fourth dimension, where F = F(x, y, z, t). Alternately, a time varying dataset can be represented as a sequence of steady state 3D datasets such that F = { F0(x, y, z), F1(x, y, z) … Ft(x, y, z) }, where time is in discrete steps from 0 to t. Each Ft is a separate time step that may be stored in a separate file on disk. G can be structured or unstructured, and F can consist of multiple scalar, vector, or tensor values at each grid point. Different rendering techniques are used depending on various combinations of F and G. Field Types
Scalar Fields: A scalar field contains single-valued data at each grid cell, for example, temperature. Multiple scalar values can exist at each location, for example, temperature, pressure, and density. Scalar fields can be rendered by selecting a particular value (isovalue) and displaying all of the locations where the field has that isovalue. The union of these locations forms a surface (isosurface), and surface rendering techniques such as triangle meshes are used to render isosurfaces (Lorensen, 1987; Gao, 2001). See Figure 8.
Rather than extracting an isosurface, the entire volume (assuming n = 3 or n = 4) can be visualized directly using volume rendering techniques (Levoy, 1998; Ma, 2000). Volume rendering creates an image of the entire 3D space using varying color and transparency. This allows partial or complete visibility of the inside regions of the volume. Colors and opacities are mapped the data values via a user-defined transfer function. See Figure 8.
Vector Fields: A vector field contains vector-valued data at each grid cell, for example, velocity (vx, vy, vz). The collection of velocity vectors represent the flow of particles in space and in time. When the flow is steady-state, a set of seed points can be numerically integrated over the velocity field to construct a set of streamlines. When the flow is time-varying, we call the resulting locus pathlines. An alternative construction for time-varying flows is streaklines, constructed by regenerating a constant set of seed points over time.
For rendering, each point in a streamline, pathline, or streakline can be connected to its neighbor with a line or a higher order curve. To reduce aliasing and increase visibility, these lines can be rendered as tubes or cylinders, or even semitransparent surfaces. To further improve clarity, lighting and texturing can be applied (Johnson, 2004; vonFunck, 2008). See Figure 8.
There are direct methods of rendering a vector field without tracing particles through it, including line integral convolution (LIC), glyphs, and topological methods. LIC renders the result of applying an anisotropic convolution filter directly over the field (Cabral, 1993). Glyphs are representations such as arrows, cones, etc., that are placed within the field and oriented tangent to it (de Leeuw, 1993). Topological methods do not visualize the field itself, but rather the topology of the flow by evaluating ridges, saddles, and critical points in the field (Gyulassy, 2008).

Figure 8: Examples of volume rendering (top), isosurfacing (bottom left), and streamline flow visualization (bottom right). Images courtesy of H.-W. Shen, the Ohio State University.
Tensor Fields: Tensors are matrices; for example 3x3 tensors are common in materials science and medical imaging. Tensors that arise in science can be characterized by their eigenvalues and eigenvectors. To render such a tensor field, a set of ellipsoidal glyphs is commonly used, where the principle directions of the ellipsoid correspond to the eigenvectors, and the major and minor ellipsoid radii reflect the maximum and minimum eigenvalues. Topological methods can also be applied to tensor fields (Tricoche, 2008). Grid Types
Structured Grids: A structured grid follows a regular pattern such that the coordinates of individual grid cells are not stored; positional and topological information is derived from a few parameters such as minimum, maximum, and spacing. Perhaps the most familiar example is a Cartesian grid, but others such as polar, cylindrical, spherical are common. Rectilinear and curvilinear grids are generalizations of these, where spacing varies across the extent of the grid (Schroeder, 2006).
A special case of variable-spacing grid is the adaptive mesh refinement (AMR) grid (Ma, 1999; Weber, 2001a; Weber, 2001b). In an AMR grid, block shaped regions corresponding to various data frequencies have different spatial resolution. These resolutions differ by a constant

factor, for example, half-spacing in each dimension. Many combinations and varieties of structured grids exist, depending on the data requirements of the underlying simulation. Structured grids are attractive because the regularity of grid locations saves storage space and speeds access to data values. Figure 9 shows examples of structured grids.
Unstructured Grids: Some computational problems exist over a data domain that cannot be effectively modeled by a structured grid without wasting a great deal of resources. Consider simulating the airflow over an airplane. Most of the grid cells in a structured grid enveloping such an irregular shape would represent air. This is appropriate if the objective is to understand the airflow patterns surrounding the airplane. However, if the objective is to model the stress on the fuselage, then most of the grid cells would be wasted.
Figure 9: From left to right, 2D examples of Cartesian, rectilinear, curvilinear, and AMR grids are shown. Analogies exist in 3D for each. Bottom: In 2D unstructured grids, cells are usually triangular or rectangular. In 3D unstructured grids, their counterparts are tetrahedral and hexahedral cells.
In such cases, each grid cell of interest is listed in an indexed structure. The grid coordinates of each point must be stored because they cannot be determined algorithmically. Also, topological information must be stored. In particular, links from each cell to the neighboring cells are necessary in order to traverse from one cell to an adjacent one. In 2D unstructured grids, cells are usually triangular or rectangular in shape. The 3D analogy to these cell shapes are tetrahedral and hexahedral grid cells (Nielson, 1997). See Figure 9. Data Intensive Rendering
In computational science, simulations run for hours, days, weeks, and sometimes months at a time across thousands or tens of thousands of compute nodes. These runs produce hundreds of terabytes, even petabytes of results. Often these datasets are time varying and multivariate. The scope of modern datasets poses new challenges for rendering; we will use the term data intensive rendering when discussing approaches to meet these challenges, but we emphasize that this is not a special case anymore. Eventually most if not all rendering of scientific computations will be data intensive (Mount, 2004; Ross, 2008).

Data intensive rendering can affect the visualization pipeline; in particular, overall performance depends on the successful use of parallelism and heterogeneity in the visualization workflow. The computational performance of individual CPUs and GPUs is limited by electrical consumption and heat dissipation, so parallelism is one alternative in order to continue to improve performance. This is true regardless whether parallelism is inter-core with shared memory or inter-node with distributed memory. Heterogeneity occurs when different architectures must cooperate in parallel. Combining today’s multicore chips in parallel induces different types of parallelism in the same rendering algorithm. The presence of multiple GPUs within the same system is another example. Ultimately, we must use all of the architectural components in parallel, not just the homogeneous ones, in order to raise the performance level of data intensive rendering.
Most strategies used to parallelize the rendering process follow a similar form: data are first decomposed and distributed to processing units for rendering after which the output of each task is combined to form the final output image. Parallelization strategies are commonly categorized based on how data are decomposed across processing units. Parallel direct volume rendering techniques are usually categorized as either object-order or image-order techniques.
Parallel object-order techniques assign a processing unit to a section of data regardless of where the data appears in the final output image. After each section of data are rendered, a compositing step based on the theory described by Porter and Duff (Porter, 1984) constructs the final image. Much effort has been devoted to developing efficient compositing methods including Hsu’s direct send method (Hsu, 1993), Camahort and Chakravarty’s projection method (Camahort, 1993), the binary-swap method (Ma, 1994) and the divided-screenwise hierarchical compositing method (Ino, 2003). Object-order implementations have been developed for distributed-memory clusters (Elvins, 1992; Gribble, 2004; Müller, 2006), and specialized hardware has been developed that implements the binary-swap compositing method (Lombeyda, 2001, Muraki, 2003, Frank, 2005).
Parallel image-order rendering techniques take advantage of the fact that a contribution to a pixel in the output image is independent of other pixels in the image. These techniques break the output image into disjoint regions and assign a processing unit to render everything in that region. Image-order implementations have been developed for shared-memory systems (Palmer, 1998) as well as distributed-memory systems (Bajaj, 2000).
Object-order methods distribute input data across processing units before rendering begins. Data remains stationary even when the view transformation changes. However, object-order methods require an additional compositing phase to assemble the final output image. The cost of this phase grows with the number of processing units. Image-order methods avoid the additional compositing phase but require redistribution of some portion of the input data when the viewpoint changes. The optimal choice of parallelization strategy is heavily dependent on the implementation architecture. We will see examples of both strategies later in the section.
A common theme in data intensive rendering is heterogeneity. Heterogeneity may exist within a compute node, as in the Roadrunner architecture (Barker, 2008), or it can take the form of a rendering hierarchy, similar to a memory or storage hierarchy. We can consider three levels in this hierarchy: supercomputer, graphics cluster, and workstation. Because computing power decreases and interactivity increases as we move to different levels in the hierarchy, one may expose different system characteristics at each level by mapping different visualization algorithms and stages of the algorithm to each machine architecture and thereby optimize the end-to-end performance.

For example, in a vector flow field visualization, the supercomputer can compute particle traces and transfer finished particles to a visualization cluster for rendering. There, graphical effects such as semitransparency and lighting can be added more effectively at the GPU hardware level than in software at the supercomputer. A subset of the rendered surfaces can be transferred to the scientist’s workstation for local interaction. This type of hierarchy has yet to be realized at large scales in practice, but heterogeneity of this type will likely play a role in future data intensive rendering. Some rough guidelines for mapping algorithms to architectures are:
• Supercomputer: Algorithms such as ray casting that either have a software equivalent or were originated in software; large scale data-bound problems where the cost of moving data is prohibitive; high quality or large image size rendering where rendering time is long; complex mesh problems where raw rendering time is not the bottleneck; preprocessing, filtering, transforming, or numerical analysis operations performed prior to rendering
• Graphics cluster: Algorithms such as marching cubes that originated as triangle rendering methods; algorithms that rely heavily on triangles or textures for which the GPU rendering pipeline is optimized; algorithms that benefit from multithread parallelism that GPUs can offer, data domains that fit in GPU memory, and interactive applications.
• Graphics workstation: Versions of graphics cluster algorithms operating on smaller data subdomains; applications with even higher levels of interactivity; and algorithms that make local approximations to the higher levels of the hierarchy, for example, image-based rendering (Chen, 1995).
Finally, a common theme in data intensive rendering is that many algorithm design decisions
are governed by the high cost of reading, writing, and transporting data. Overall performance is usually bound by the cost of data movement, rather than computation. This data movement can take the form of transporting files across a grid or the internet, reading and writing to and from storage systems, and communicating between the nodes of a cluster or supercomputer. We will see the cost of data movement reappear several times in the following examples. Case study: Parallel Volume Rendering on a Graphics Cluster
As the spatial size of volume data increases due to advances in scientific instrumentation, so too does the need to visualize such large data. High-resolution displays allow scientists to see their spatially large data at or nearer its native resolution. Most often, scalable high-resolution displays are composed of an array of liquid-crystal displays (LCDs) or projectors and a commodity distributed-memory cluster of computers with accelerated graphics hardware.
Schwarz and others have shown a distributed image-order volume rendering approach for high-resolution displays that scales as the output resolution of the display and the number of cluster nodes increases. This approach preprocesses data into a hierarchical structure which is distributed across the local storage of a distributed-memory cluster. The cluster is equipped with graphics cards capable of hardware accelerated 3D texture-mapping. Rendering is aborted and restarted at the lowest level in the hierarchical data structure if user interaction occurs before the highest-resolution level is completed.
The successful image-order parallelization of the rendering task relies on a data management scheme that uses a multi-level cache and distributed shared-memory system. The primary

responsibility of the multi-level cache is to keep the most recently used data bricks as close to the graphics hardware as possible. The distributed shared-memory system keeps track of all data bricks loaded in memory across cluster nodes. Data bricks are transferred between cluster nodes when required via the cluster’s high-speed backplane. If a data brick is not in memory on one of the nodes it is loaded from disk. Performance results show that the system scales as output resolution and cluster size increases.
The Purkinje dataset in Figure 10 is shown on a six panel, twenty-four megapixel tabletop display. The display is run by a three node cluster where each node is attached to two 2,560 x 1,600 LCDs. Each cluster node has one AMD Athlon 64 FX-60 Dual Core processor, 2 GB of RAM, and a PCI-E nVidia GeForce 7900 GT graphics card with 256 MB of texture-memory. The cluster is connected via a 10 Gbps Ethernet backplane with the MTU size set to 9,000 bytes.
The original raw data creates a 2,048 x 4,096 x 128 volume of 16-bit voxels. The real spatial extent of the data is about 80 µm x 80 µm x 15 µm. Purkinje neurons exist in the cerebellar cortex and are responsible for fine motor control. The study of Purkinje neurons may lead to treatments for genetic mutations, such as autism, and neurodegenerative diseases, such as sporadic ataxias.
The rat kidney dataset in Figure 11 is shown on a fifty-five panel, 100 megapixel display. The display is run by a twenty-eight node cluster where all but one node is attached to two 1,600 x 1,200 LCDs. Each cluster node has two AMD Opteron 246 processors, 4 GB of RAM, 500 GB of local storage space, and an 8x AGP nVidia Quadro FX 3000 graphics card with 256 MB of texture-memory. The cluster is connected via a 1 Gbps Ethernet backplane with the MTU size set to 9,000 bytes.
The original raw data comprises a 32,768 x 32,768 x 128 volume of 24-bit samples. The real spatial extent of the data is about 8mm x 5mm x 1.5mm. Scientists are particularly interested in cell neucli which are between 5 µm and 10 µm in length.
Figure 12 shows the average time to render a single frame of the Purkinje neuron dataset. Average rendering results for the rat kidney dataset are given in Figure 13. These results reflect the average time taken to render and display all data in all levels of the tree for a given view. The results show that as the output resolution increases along with the corresponding number of rendering nodes, the time taken to render each dataset decreases.

Figure 10: Researcher exploring the Purkinje neuron dataset on a twenty-four megapixel tabletop display. Data courtesy of the National Center for Microscopy and Imaging Research (NCMIR) at the University of California, San Diego (UCSD).
Figure 11: Scientist examining the rat kidney dataset on a 100 megapixel display. Data courtesy of the National Center for Microscopy and Imaging Research (NCMIR) at the University of California, San Diego.

Figure 12: Average rendering results for the Purkinje neuron dataset.
Figure 13: Average rendering results for the rat kidney dataset.
Case Study: Parallel Volume Rendering on the IBM Blue Gene
In contrast to the previous case study, Peterka et al. (Peterka, 2008) wondered whether and how parallel supercomputers such as the IBM Blue Gene and Cray XT can operate as parallel visualization engines. Even though they do not have graphics capability, under certain conditions of data size, algorithm, number of cores, and output display resolution, we have found that a software rendering solution running in parallel on a supercomputing platform can actually be an effective alternative to hardware-accelerated graphics cluster approaches that are the de facto rendering method today.
Running visualization algorithms on a supercomputer also opens the door to in situ visualization, where visualizations are rendered simultaneously with a running simulation (Ma, 2007; Tu, 2006; Yu, 2004). This permits scientists to “see into” their computations as they proceed, even to steer them dynamically. There are many problems yet to be solved before in situ visualization becomes a commonly used technique, but the ability to execute parallel visualizations on the same architecture as simulations is one step in that direction.
Peterka and others are researching parallel visualization algorithms on leadership-class systems, using the IBM Blue Gene/P system as a test environment. To date, a parallel volume rendering algorithm has been successfully applied to over 32,000 BG/P compute cores. Datasets of up to 335 billion elements were successfully volume rendered on BG/P to produce images up to 16 million pixels.
Figure 14 shows an output image from volume rendering the entropy within a core-collapse supernova using this approach. Through computational simulation, Blondin and Mezzacappa (Blondin, 2003) are studying the physics of the shock wave that forms during the death of some of the largest stars.

Figure 14: Volume rendering of entropy in a core-collapse supernova. Image courtesy of H. Yu, and K.-L. Ma, University of California at Davis.
Figure 15 shows the end-to-end performance and scalability for a range of data, image, and
system sizes. Because the data are time-varying, each time step must be read from storage prior to rendering. The size of a single time step can be gigabytes or even hundreds of gigabytes, and Figure 15 shows that most of the total frame time (time to render one time step from start to finish) is spent on I/O, reading the data from storage. Various optimizations, as already discussed earlier, can help to hide the high cost of I/O (Peterka, 2008).
Excluding I/O, Figure 16 also shows that compositing is the next most expensive operation. Compositing is a many-to-many communication step among all of the compute cores to exchange partial results and merge these into a final image. Like I/O, this is a data movement operation. This example demonstrates that large scale visualization performance is dominated by the cost of data transfers, both from storage and across the interconnect between compute cores.
Returning to the original question, whether parallel volume rendering can be done within such a supercomputing architecture, the answer is yes. The strengths of Argonne’s IBM Blue Gene are a large capacity parallel storage system, low-latency high-bandwidth interconnection network, and a large number of relatively low power compute nodes. Since the visualization algorithm (in this case volume rendering) is bound by data movement and not rendering speed, the algorithm properties and machine characteristics align. Data movement between supercomputer and separate visualization cluster is eliminated and future in situ visualization is enabled by performing visualization directly on the supercomputer.

1
10
100
1000
100 1000 10000
End-
to-E
nd F
ram
e Ti
me
(s)
Number of MPI Processes
Scalability at Large Problem Sizes
44803 pts 40962 px
22403 pts 20482 px
11203 pts 16002 px
Figure 15: Total frame time is plotted for three data and image sizes, in log-log scale.
10
20
30
40
50
60
70
80
90
100
64 128 256 512 1K 2K 4K 8K 16K 32K
% o
f End
-to-E
nd T
ime
Number of MPI Processes
Time Distribution as a Function of Number of Processes
Composite
Render
I/O
Figure 16: Percentage of time spent in I/O, rendering, and compositing. I/O dominates the overall algorithm’s performance. Data size: 1120 x 1120 x 1120 Image size: 1600 x 1600.

ADVANCED DISPLAYS FOR SUPPORTING DISTRIBUTED VISUALIZATION
Traditionally data rendering and display occur together- i.e. the same computer that does the rendering, displays the result. In distributed visualization, especially as necessitated by the sheer massiveness of the data that needs to be rendered, it is ultimately more economical to separate rendering from display. This Thin Client model is actually widely used in practice today – for example every time we query Google, the “heavy lifting” of generating the result or visualization is performed by massive compute clusters at Google, and the viewer simply sees the result on their desktop computer, laptop or smartphone. This model is attractive because the large-scale (and therefore expensive) computing infrastructure that supports such services can be shared amongst large populations of users, and can be located near reliable and renewable power sources.
As the types of problems we tackle grow in scale and complexity our notion of what constitutes a Thin Client must change. The new Thin Client is a large ultra-high-resolution display interfaced with an ultra-high-speed network. Increased screen real-estate and resolution enables users to display and juxtapose more data simultaneously and thereby enhances the users’ ability to derive insight from data.
Until the mid-90s image creation for large displays (often called Power Walls) primarily used Cathode Ray Tube-based projectors. The main advantage of CRT projectors is that they maintain good brightness to 10,000 hours, are capable of generating very high resolution images (up to 1920x1200), and are able to refresh at high rates. In the mid to late 90s, LCD and DLP projectors were rapidly declining in cost as well as physical size. This was driven largely by the business graphics market which required low cost projectors for projecting presentation slides in board rooms. Tilings of LCD or DLP projectors were used to create larger walls (Funkhouser, 2000). While these projectors were relatively inexpensive it was difficult to align the geometry and color of the screens. Techniques have been developed for automatic alignment through the use of computer-vision. As a result commercial turnkey solutions are now available- but at a relatively high cost. Today DLP projectors such as Sony's SXRD are capable of 8-megapixel resolution (4096x2160) and are largely used in movie theaters. In prototype form is NHK's Super Hi-Vision project (Kanazawa, 2003) which is capable of 7680x4320.
Currently the most economical way to build scalable ultra-high-resolution displays is by using tilings of LCD panels rather than projectors due to the LCD’s long life, low power consumption, high resolution and low cost. Other benefits include the fact that LCD panels are quite well color calibrated and apart from the physical alignment of the panels during tiling, require no further alignment, unlike projectors. Tilings of these have been used to create extremely high resolution walls such as the 100 Megapixel LambdaVision display (Renambot, 2005). The main drawback of LCD panels is that they have mullions that prevent them from producing truly seamless displays. Mullions do not adversely impact the viewing of an image if they are taken into account in the rendering of the image. However mullions do make the reading of text difficult when it either occludes an entire sentence or words. Driving these tilings of displays requires a cluster of computers, often each computer drives anywhere between 1 and 4 displays, and a master computer coordinates the entire cluster. By building these tiled displays using small low cost computers equipped with gigabit networking- such as Mac Minis we can leverage the Thin Client paradigm and utilize remote shared computing infrastructure to generate and stream the visualizations to the tiled display.
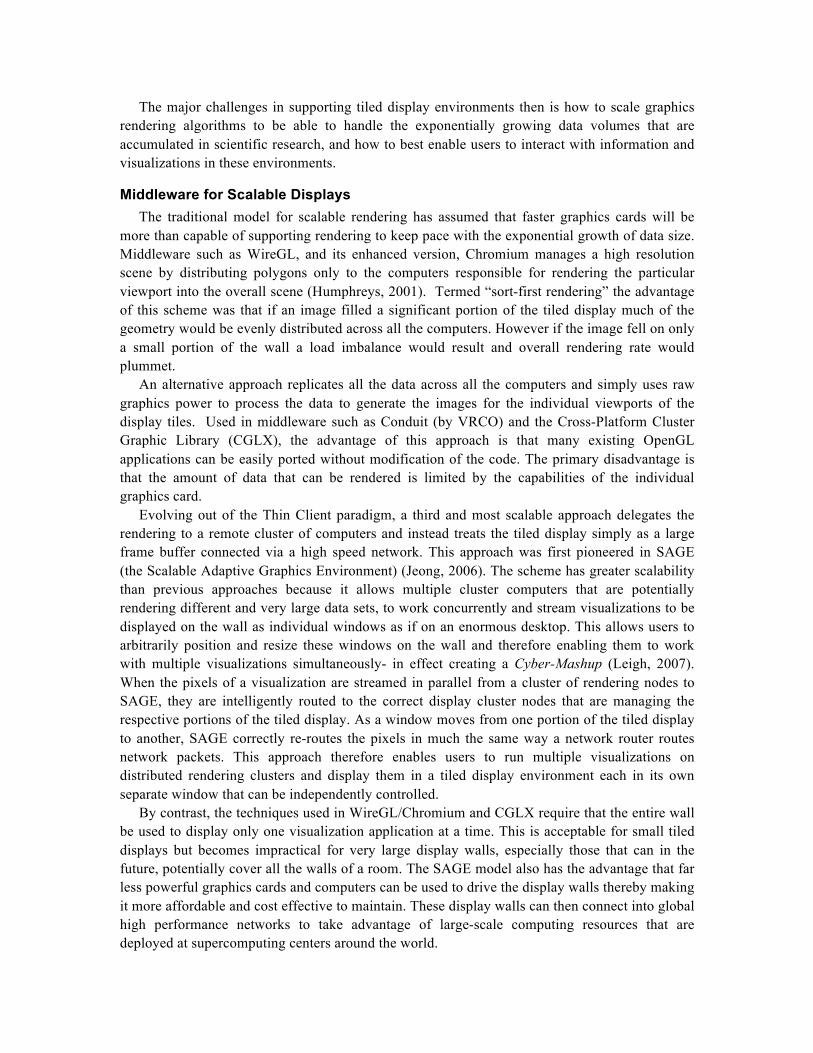
The major challenges in supporting tiled display environments then is how to scale graphics rendering algorithms to be able to handle the exponentially growing data volumes that are accumulated in scientific research, and how to best enable users to interact with information and visualizations in these environments. Middleware for Scalable Displays
The traditional model for scalable rendering has assumed that faster graphics cards will be more than capable of supporting rendering to keep pace with the exponential growth of data size. Middleware such as WireGL, and its enhanced version, Chromium manages a high resolution scene by distributing polygons only to the computers responsible for rendering the particular viewport into the overall scene (Humphreys, 2001). Termed “sort-first rendering” the advantage of this scheme was that if an image filled a significant portion of the tiled display much of the geometry would be evenly distributed across all the computers. However if the image fell on only a small portion of the wall a load imbalance would result and overall rendering rate would plummet.
An alternative approach replicates all the data across all the computers and simply uses raw graphics power to process the data to generate the images for the individual viewports of the display tiles. Used in middleware such as Conduit (by VRCO) and the Cross-Platform Cluster Graphic Library (CGLX), the advantage of this approach is that many existing OpenGL applications can be easily ported without modification of the code. The primary disadvantage is that the amount of data that can be rendered is limited by the capabilities of the individual graphics card.
Evolving out of the Thin Client paradigm, a third and most scalable approach delegates the rendering to a remote cluster of computers and instead treats the tiled display simply as a large frame buffer connected via a high speed network. This approach was first pioneered in SAGE (the Scalable Adaptive Graphics Environment) (Jeong, 2006). The scheme has greater scalability than previous approaches because it allows multiple cluster computers that are potentially rendering different and very large data sets, to work concurrently and stream visualizations to be displayed on the wall as individual windows as if on an enormous desktop. This allows users to arbitrarily position and resize these windows on the wall and therefore enabling them to work with multiple visualizations simultaneously- in effect creating a Cyber-Mashup (Leigh, 2007). When the pixels of a visualization are streamed in parallel from a cluster of rendering nodes to SAGE, they are intelligently routed to the correct display cluster nodes that are managing the respective portions of the tiled display. As a window moves from one portion of the tiled display to another, SAGE correctly re-routes the pixels in much the same way a network router routes network packets. This approach therefore enables users to run multiple visualizations on distributed rendering clusters and display them in a tiled display environment each in its own separate window that can be independently controlled.
By contrast, the techniques used in WireGL/Chromium and CGLX require that the entire wall be used to display only one visualization application at a time. This is acceptable for small tiled displays but becomes impractical for very large display walls, especially those that can in the future, potentially cover all the walls of a room. The SAGE model also has the advantage that far less powerful graphics cards and computers can be used to drive the display walls thereby making it more affordable and cost effective to maintain. These display walls can then connect into global high performance networks to take advantage of large-scale computing resources that are deployed at supercomputing centers around the world.

Figure 17: In SAGE, tiled displays are driven by multiple remote rendering pipelines that independently stream visualizations onto individual windows. Pictured is a 100-Megapixel tiled LCD display wall at the Electronic Visualization Laboratory (University of Illinois at Chicago).
Supporting Distance Collaboration in Scalable Display Environments
Today, remote application sharing and video conferencing using tools such as WebEx, Skype, and iChat, are making it routine for distributed users to work with each other and to work with data from their desktop computers. These solutions however do not scale to ultra-high-resolution display environments, which need to be able to share high-resolution visualizations and high-definition video and audio in real-time to facilitate group-to-group collaboration.
Visualcasting is a novel image broadcasting scheme that extends SAGE to support distance collaboration with multiple end-points without the need for traditional router-based support for multicasting which have always been difficult to deploy over wide-area networks (Renambot, 2009). Visualcasting is a scalable real-time image replication service for multiple high-resolution tiled displays. A visualization application streamed to multiple Visualcasting end-points (tiled displays) can have different window layouts on each tiled display. The window operations (moving or resizing) on each tiled display can occur independently. As windows on the tiled display are resized or repositioned, SAGE performs the non-trivial task of reconfiguring the multiple streams from the rendering source to the PC nodes that drive potentially differing tiled displays.
Visualcasting is realized via the SAGE Bridge- a high-speed intelligent bridging system that duplicates and splits pixel streams received from rendering clusters for each end-point. This allows each rendering node to stream whole images without having to be cognizant of the window layouts and tiled display configurations of multiple end-points. A single SAGE Bridge node is built from a high-performance PC equipped with 10-gigabit network interfaces. Multiples of these can be ganged together to facilitate the sharing of even higher resolution content or more varieties of content. For example one bridge could be dedicated to high-definition audio/video conferencing while another could be dedicated to sharing visualizations.

SAGE also supports audio streaming to facilitate distance collaboration. The design goal has always been to treat sound data in SAGE in a similar fashion to pixel data potentially allowing for sounds to be spatially collocated with the displays that show the visualizations. Sound buffers are captured at various sources (microphones, high-definition video capture card, audio files, or application-provided buffers), then streamed in an uncompressed form to minimize latency, and finally sent to a sound card for playback.
Figure 18 and Figure 19 show a Visualcasting trial conducted over an international network testbed called the Global Lambda Integrated Facility. In the trial ultra-high-resolution tiled displays at the SC08 conference in Austin, Texas (Figure 18), Electronic Visualization Laboratory at the University of Illinois at Chicago (Illinois), the School of Information at the University of Michigan, and Masaryk University (Czech Republic) (Figure 19) were linked to Visualcasting servers in Chicago so that they are all able to share a 4K (4096x2048) pixel visualization stream as well as communicate over high-definition video conferencing.
Figure 18: Visualcasting view on a prototype Sharp 4K (4096x2048) pixel LCD display at the SC2008 conference in Austin, Texas.

Figure 19: The views of the Visualcasting collaboration from the University of Michigan (top left), University of Illinois at Chicago (bottom left), and Masaryk University (bottom right). CONCLUSION
The World Wide Web has been a transformative technology that has afforded its users the ability to publish and retrieve an unprecedented amount of data. Making data massively available and providing facilities for combining them stimulates the production of new insight. A crucial component to the derivation of insight is visualization- the production of a meaningful visual representation of data.
As data size continues to grow exponentially, the long-established technique of first downloading data to a desktop computer and then creating a plot on a spreadsheet has given way to distributed models of data retrieval, visualization and analysis. The majority of techniques used on the Web today have their roots in the field of High-Performance Computing (HPC). For almost two decades, the HPC community has developed innovative approaches for deriving insight from large-scale distributed data.
Large-scale data visualization is conducted via a pipeline consisting of data retrieval, filtering, rendering, and finally display. The motivation to collocate or distribute the steps of the pipeline is driven largely by the economics of meeting user demand and managing scalability. Traditionally when data was small, all the steps of the pipeline could reside on the same computer. Visualization was interactive and users could adjust the visualizations in real-time. As data sizes grew, visualization on single computers had to expand to utilize parallel processing on multiple computers in order to keep pace. However, parallel computing was still largely collocated computing because high speed wide-area networks were scarce. Furthermore, parallel computers often worked in batch mode, and therefore the results of parallel visualization algorithms consisted mainly of animated movies rather than interactive graphics. Viewing the visualization from a different point of view was therefore not possible without time consuming re-computation.
As data volumes continued to grow, the economics of providing data management and data processing services necessitated greater wide-area distribution of resources. Serendipitously, this

led to an explosion of new applications beyond scientific computing that includes e-commerce and even video gaming.
The key challenge in data visualization today is how to provide users with the interactive experience that they have grown accustomed to on their desktop computers, while offering the scalability to handle the exponential explosion of data. Experiments show that large-scale visualization is an Input/Output-bound problem. That is, the rate at which visualizations can be generated is bound by the rate at which data can be sent through the visualization pipeline. If one cannot move the data through the pipeline fast enough then one cannot process the data fast enough. When interactivity is required, data access latency becomes another major problem- especially when the data is distributed over wide-area networks. However as high-speed networks such as the National LambdaRail and Internet-2 grow in capacity, the limitation of bandwidth between distributed resources diminishes. Furthermore, through the aggressive use of bandwidth to presend and prefetch data, it becomes possible to significantly reduce data access times to the point where, surprisingly, it can be faster to access data from a remote computer than from one’s local disk drive. Some researchers would argue that there will never be enough wide-area bandwidth available to keep pace with both the growth of data and the multi-core and many-core systems that are needed to process the data. In this case, researchers are examining the notion of in situ rendering, where the parallelized visualization and computational algorithms are collocated so that rendering the data can be done during the generation of the data. In in situ visualization, the computation and visualization could be either collocated on the same supercomputer or run on separate specialized resources that are collocated at the same site. In the first case, the data transfer between computers is reduced though at a cost of sharing compute resources of the supercomputer for visualization. In the latter approach, a visualization cluster, typically a GPU-based cluster, needs to be interconnected to the supercomputer via high-speed local network interconnects.
The notion of in situ visualization however is not a silver bullet. The rate at which a frame of visualization is generated is bound by the rate of a simulation timestep- which can be on the order of seconds to even hours. Therefore, in situ visualization does not lend itself to interactive visualization. In situ visualization's greatest value is in allowing the user to catch a glimpse of how the computation is evolving in order to determine whether it is worth allowing it to continue for days to weeks. This approach can enable computational steering where the user would directly modify the parameters of the computation. Then once the computation is complete, techniques for low-latency real-time distributed visualization can be brought to bear to provide users with a means to interactively explore the results. ACKNOWLEDGMENTS This publication is based on work supported in part by Award CNS-0935919 and 0959053, made by the National Science Foundation, and U.S. Dept. of Energy under Contract DE-AC02-06CH11357. REFERENCES Bajaj C., Ihm I., Park S. & Song D. (2000). Compression-based ray casting of very large volume data in distributed environments. Proceedings of the Fourth International Conference on High-Performance Computing in the Asia-Pacific Region (HPC00),2, 720–725.

Barker, K. J., Davis, K., Hoisie, A., Kerbyson, D. J., Lang, M., Pakin, S. & Sancho, J. C., (2008). Entering the petaflop era: the architecture and performance of roadrunner, Proceedings of the 2008 ACM/IEEE conference on Supercomputing (SC’08). IEEE Press, 1–11.
Bethel, W., Tierney, B., Lee, J., Gunter, D., Lau, S.,(2000). Using High-Speed WANs and Network Data Caches to Enable Remote and Distributed Visualization. Proceeding of the IEEE Supercomputing 2000 Conference.
Beynon, M., Chang, C., Catalyurek, U., Kurc, T., Sussman, A., Andrade, H., Ferreira, R., and Saltz, J., (2002). Processing Large-Scale Multidimensional Data in Parallel and Distributed Environments. Parallel Computing. 28(5):827-859. May 2002. Special issue on Data Intensive Computing.
Blondin, J. M., Mezzacappa, A. & DeMarino, C. (2003). Stability of standing accretion shocks, with an eye toward core collapse supernovae, The Astrophysics Journal, 584 (2), 971.
Cabral, B. & Leedom, L. C. (1993). Imaging vector fields using line integral convolution, Proceedings of the 20th annual conference on Computer graphics and interactive techniques (SIGGRAPH’93). ACM, 263–270.
Camahort E. & Chakravarty I. (1993), Integrating volume data analysis and rendering on distributed memory architectures. Proceedings of 1993 Symposium on Parallel Rendering (PRS ’93), 89–96.
Chen, S. E., (1995). Quicktime VR: an image-based approach to virtual environment navigation, Proceedings of the 22nd annual conference on Computer graphics and interactive techniques (SIGGRAPH’95), 29–38.
Cruz-Neira, C., Sandin, D. J., DeFanti, T. A., Kenyon, R. V., Hart, J. C., (1992). The Cave - Audio Visual Experience Automatic Virtual Environment. Communications of the ACM, 35(6): 64-72.
de Leeuw, W. C. & van Wijk, J. J. (1993). A probe for local flow field visualization, Proceedings of the 4th conference on Visualization (VIS ’93), 39–45.
DeFanti, T. A., Brown, M. D., Leigh, J., Yu, O., He, E., Mambretti, J., Lillethun D., & Weinberger, J. (August 2003). Optical Switching Middleware for the OptIPuter, Institute of Electronics, Information and Communication Engineers (IEICE) Transactions on Communications (special issue on Photonic IP Network Technologies for Next Generation Broadband Access), Japan, E86-B (8), 2263-2272.
Ding, J., Huang, J., Beck, M., Liu, S., Moore, T., Soltesz S., (2003). Remote Visualization by Browsing Image Based Databases with Logistical Networking. In the proceedings of SC2003, Phoenix, AZ, USA.
Elvins T. T. (1992): Volume rendering on a distributed memory parallel computer. Proceedings of the 3rd conference on Visualization ’92, pp. 93–98.
Frank S. & Kaufman A. (2005). Distributed volume rendering on a visualization cluster. Proceedings of the Ninth International Conference on Computer Aided Design and Computer Graphics, CAD-CG ’05, 371–376.

Funkhouser, T. & Li, K. (July 2000). Large Format Displays, IEEE Computer Graphics and Applications, 25 (4), 20-21.
Gao, J. & Shen, H.W. (2001). Parallel view-dependent isosurface extraction using multi-pass occlusion culling, Proceedings of the IEEE 2001 symposium on parallel and large-data visualization and graphics (PVG ’01). 67–74.
Gao, J., Huang, J., et al. (2005). Distributed data management for large volume visualization. Visualization, 2005. VIS 05. IEEE: 183-189.
Gribble C., Parker S. & Hansen C. (2004). Interactive Volume Rendering of Large Datasets Using the Silicon Graphics Onyx4 Visualization System. Tech. rep., University of Utah.
Gyulassy, G., Bremer, P.-T., Hamann, B. & Pascucci, (2008). A practical approach to morse-smale complex computation: Scalability and generality, IEEE Transactions on Visualization and Computer Graphics, 14 (6), 1619–1626.
He, E., Leigh, J., Yu, O., & DeFanti T. A. (2002), Reliable Blast UDP : Predictable High Performance Bulk Data Transfer, Proceedings of IEEE Cluster Computing 2002.
Hsu W. M. (1993). Segmented ray casting for data parallel volume rendering. Proceedings of the 1993 symposium on Parallel rendering (PRS93), 7–14.
Humphreys, G., Eldridge, M., Buck, I., Stoll, G., Everett, M. & Hanrahan, P. (2001). WireGL: a scalable graphics system for clusters, Proceedings of the 28th International Conference on Computer Graphics and Interactive Techniques, 129 – 140.
Ino F., Sasaki T., Takeuchi A. & Hagihara K. (2003). A divided-screenwise hierarchical compositing for sort-last parallel volume rendering. Proceedings of the 17th International Symposium on Parallel and Distributed Processing (IPDPS ’03), p. 141.
Jeong, B, Renambot, L., Jagodic, R., Singh, R., Aguilera, J., Johnson, A. & Leigh, J. (November 2006), High-Performance Dynamic Graphics Streaming for Scalable Adaptive Graphics Environment, Proceedings of Supercomputing 2006 (SC06).
Johnson, C. & Hansen, C. (2004). Visualization Handbook. Academic Press, Inc.
Kanazawa, M. et al. (2003). Ultrahigh-Definition Video System with 4000 Scanning Lines, NHK Technical Report.
Leigh, J. & Brown, M. D. (December 2007), Cyber-Commons: Merging Real and Virtual Worlds. Communications of the ACM, 51 (1), 82-85.
Levoy, M. (1988). Display of surfaces from volume data, IEEE Computer Graphics and Applications, 8 (3), 29–37.
Lombeyda S., Moll L., Shand M., Breen D., Heirich A. (2001). Scalable interactive volume rendering using off-the-shelf components. Proceedings of the IEEE 2001 symposium on parallel and large-data visualization and graphics (PVG ’01), 115–121.
Lorensen, W. E. & Cline, H. E. (1987), Marching cubes: A high resolution 3d surface construction algorithm, ACM Computer Graphics, 21 (4), 163–169.
Ma K.-L., Painter J. S., Hansen C. D. & Krogh M. F. (1994). Parallel volume rendering using binary-swap compositing. IEEE Comput. Graph. Appl. 14, 4, 59–68.
Ma, K. L. & Camp, D. M. (2000). High performance visualization of time-varying volume data over a wide-area network. Proceedings of Supercomputing 2000, 29.
Ma, K.-L., (1999). Parallel rendering of 3D AMR data on the SGI/Cray T3E, Proceedings of 7th Annual Symposium on the Frontiers of Massively Parallel Computation 1999, 138–145.
Ma, K.-L.,Wang, C., Yu, H. & Tikhonova, A. (2007). In situ processing and visualization for ultrascale simulations, Journal of Physics, 78, 2007.
McCormick, B. H., DeFanti, T. A. & Brown, M. D. (1988). Visualization in Scientific Computing, ACM Computer Graphics, Volume 21, Number 6, ACM SIGGRAPH.
Mount, R. (2004). The office of science data-management challenge. Report from the DOE office of science data-management workshops, Tech. Rep.
Müller C., Strengert M. & Ertl T. (2006). Optimized volume raycasting for graphics-hardware-based cluster systems. Eurographics Symposium on Parallel Graphics and Visualization (EGPGV06), 59–66.
Muraki S., Lum E. B., Ma K.-L., Ogata M. & Liu X. (2003). A pc cluster system for simultaneous interactive volumetric modeling and visualization. Proceedings of the 2003 IEEE Symposium on Parallel and Large-Data Visualization and Graphics (PVG ’03), 95–102.
Nielson, G. M., Hagen, H. & Muller, H. (1997), Scientific Visualization, Overviews, Methodologies, and Techniques. IEEE Computer Society.
Palmer M. E., Totty B., Taylor S. (1998). Ray casting on shared-memory architectures: Memory-hierarchy considerations in volume rendering. IEEE Concurrency, 6, (1), 20–35.
Peterka, T., Ross, R., Yu, H., Ma, K.-L., Kenall, W. & Huang, J. (2008). Assessing improvements in the parallel volume rendering pipeline at large scale, Proceedings of SC 08 Ultrascale Visualization Workshop.
Peterka, T., Yu, H., Ross, R. & Ma, K.-L. (2008). Parallel volume rendering on the IBM blue gene/p, Proceedings of Eurographics Parallel Graphics and Visualization Symposium 2008.
Porter T., Duff T. (1984). Compositing digital images. Proceedings of the 11th annual conference on Computer graphics and interactive techniques (SIGGRAPH’84), 253–259.
Prohaska, S., Hutanu, A., Kahler, R., Hege, H., (2004). Interactive Exploration of Large Remote Micro-CT Scans. In VIS '04: Proceedings of the conference on Visualization '04, Washington, DC, USA, IEEE Computer Society.
Renambot, L., Jeong, B., Hur, H., Johnson, A., Leigh, J. (2009). Enabling High Resolution Collaborative Visualization in Display Rich Virtual Organizations, Future Generation Computer Systems, 25.
Renambot, L., Johnson, A., Leigh, J. (2005), Techniques for Building Cost-Effective Ultra-high-resolution Visualization Instruments, NSF CISE/CNS Infrastructure Experience Workshop 2005, www.cs.uiuc.edu/events/expwork-2005/Luc_Renambot_Abstract.pdf

Ross, R., Peterka, T., Shen, H.-W., Hong, Y., Ma, K.-L., Yu, H. & Moreland, K., Visualization and parallel I/O at extreme scale, Journal of Physics, 2008.
Schroeder, W., Martin, K. & Lorensen, W. E., The Visualization Toolkit, 4th ed. Kitware, Inc.
Smarr, L. L., Chien, A. A., DeFanti, T. A., Leigh, J., & Papadopoulos, P. M. (November 2003). The OptIPuter, Communications of the ACM, 46 (11), 58-67. Thiebaux, M., Cox, D., Patterson, R., (2000), Virtual Reality 3D Interface System for Data Creation, Viewing, and Editing. Patent No. 6,154,723. Issued Nov. 28, 2000.
Tricoche, X., Kindlmann, G. & Westin, C.-F., (2008). Invariant crease lines for topological and structural analysis of tensor fields, IEEE Transactions on Visualization and Computer Graphics, 14 (6), 1627–1634.
Tu, T., Yu, H., Ramirez-Guzman, L., Bielak, J., Ghattas, O., Ma, K.-L. & O’Hallaron, D. R., (2006). From mesh generation to scientific visualization: An end-to-end approach to parallel supercomputing, Proceedings of Supercomputing 2006.
Van Keken, P., Schwarz, N. (2001). Visualizing Seismic Wave Propagation, Eos. Trans. AGU Fall Meet. Suppl., Abstract ED31E-01, 84(46).
Vishwanath, V., Burns, R., Leigh, J., & Seablom, M. (2008). Accelerating tropical cyclone analysis using LambdaRAM, a distributed data cache over wide-area ultra-fast networks, Future Generation of Computer Science, The International Journal of Grid Computing: Theory, Methods and Applications.
Vishwanath, V., Shimizu, T., Takizawa, M., Obana, K., & Leigh, J. (November 2007). Towards Terabit/s Systems: Performance Evaluation of Multi-Rail Systems, Proceedings of Supercomputing 2007 (SC07).
Vishwanath, V., Zuck, L., and Leigh, J., (2008a). Specification and Verification of LambdaRAM: A Wide-area Distributed Cache for High Performance Computing. In proceedings of the 6th ACM/IEEE International Conference on Formal Methods and Models for Co-Design, 2008 (MEMOCODE 2008), 5-7 June 2008, 187 – 198.
Vishwanath, V., Leigh, J., Shimizu, T., Nam, S., Renambot, L., Takahashi, H & Takizawa, M., Kamatani, O., (2008b). The Rails Toolkit (RTK) - Enabling End-System Topology-Aware High End Computing, 4th IEEE International Conference on e-Science.
Vishwanath, V., Burns, R., Leigh, J., & Seablom, M. (2009). Accelerating tropical cyclone analysis using LambdaRAM, a distributed data cache over wide-area ultra-fast networks, Future Generation of Computer Science, The International Journal of Grid Computing: Theory, Methods and Applications.
von Funck, W., Weinkauf, T., Theisel, H. & Seidel, H.-P. (2008). Smoke surfaces: An interactive flow visualization technique inspired by real-world flow experiments, IEEE Transactions on Visualization and Computer Graphics, 14 (6), 1396–140.
Weber, G. H., Hagen, H., Hamann, B., Joy, K. I., Ligocki, T. J., Ma, K. –L. & Shalf, J. M. (2001). Visualization of adaptive mesh refinement data, Proceedings of IS&T/SPIE Visual Data Exploration and Analysis VIII, 121–132.

Weber, G. H., Kreylos, O., Ligocki, T. J., Shalf, J. M., Hagen, H., Hamann, B., Joy, K. I. & Ma, K.-L. (2001). High-quality volume rendering of adaptive mesh refinement data.
Xiong, C., Leigh, J., He, E., Vishwanath, V., Murata, T., Renambot, L., & DeFanti, T. (2005). LambdaStream – a Data Transport Protocol for Streaming Network-intensive Applications over Photonic Networks, Proceedings of The Third International Workshop on Protocols for Fast Long-Distance Networks.
Yu, H., Ma, K.-L. & Welling, J. (2004). A parallel visualization pipeline for terascale earthquake simulations, Proceedings of Supercomputing 2004, 49.
Zhang, C., Leigh, J., DeFanti, T.A., Mazzucco, M., & Grossman, R. (2003), TeraScope: Distributed Visual Data Mining of Terascale Data Sets over Photonic Networks, Journal of Future Generation Computer Systems (FGCS).