Embed Size (px)
Citation preview
Degree project in
Visual Planning in Lean ProductDevelopment
MERCEDES CÁMARA JURADO
Stockholm, Sweden 2012
XR-EE-ICS 2012:020
Industrial Information and ContMaster Thesis,

1
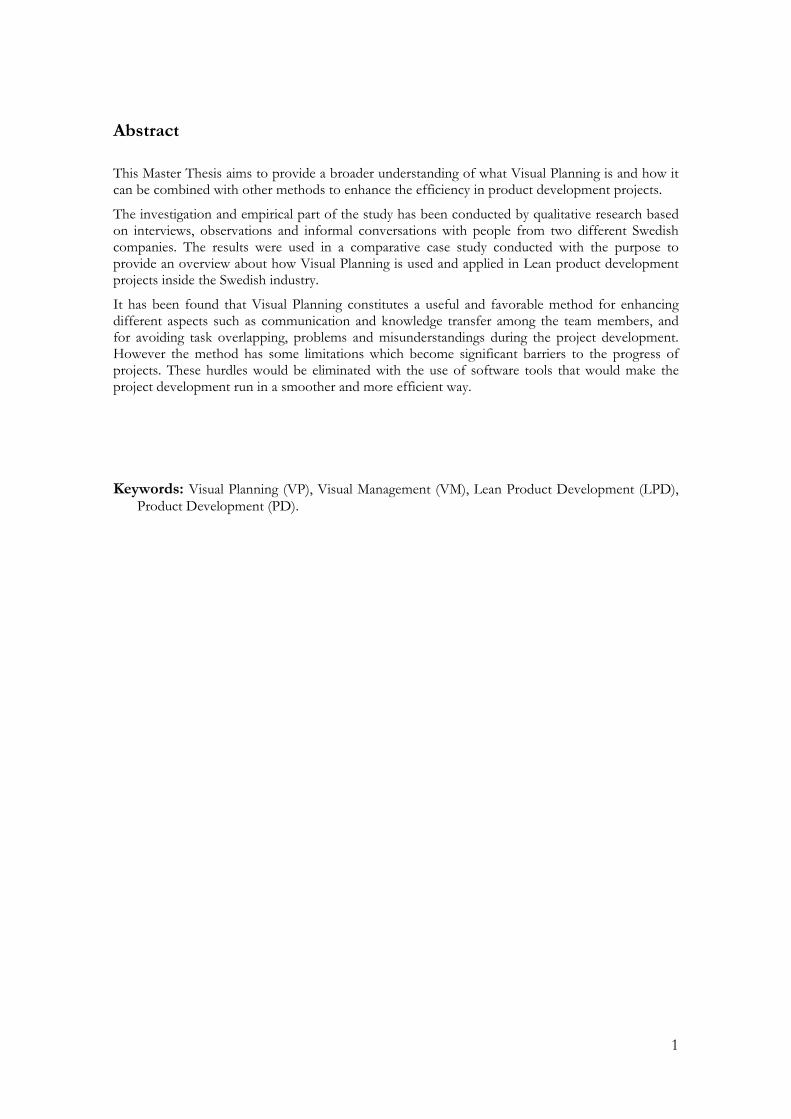
Abstract
This Master Thesis aims to provide a broader understanding of what Visual Planning is and how it can be combined with other methods to enhance the efficiency in product development projects.
The investigation and empirical part of the study has been conducted by qualitative research based on interviews, observations and informal conversations with people from two different Swedish companies. The results were used in a comparative case study conducted with the purpose to provide an overview about how Visual Planning is used and applied in Lean product development projects inside the Swedish industry.
It has been found that Visual Planning constitutes a useful and favorable method for enhancing different aspects such as communication and knowledge transfer among the team members, and for avoiding task overlapping, problems and misunderstandings during the project development. However the method has some limitations which become significant barriers to the progress of projects. These hurdles would be eliminated with the use of software tools that would make the project development run in a smoother and more efficient way.
Keywords: Visual Planning (VP), Visual Management (VM), Lean Product Development (LPD), Product Development (PD).

2
3
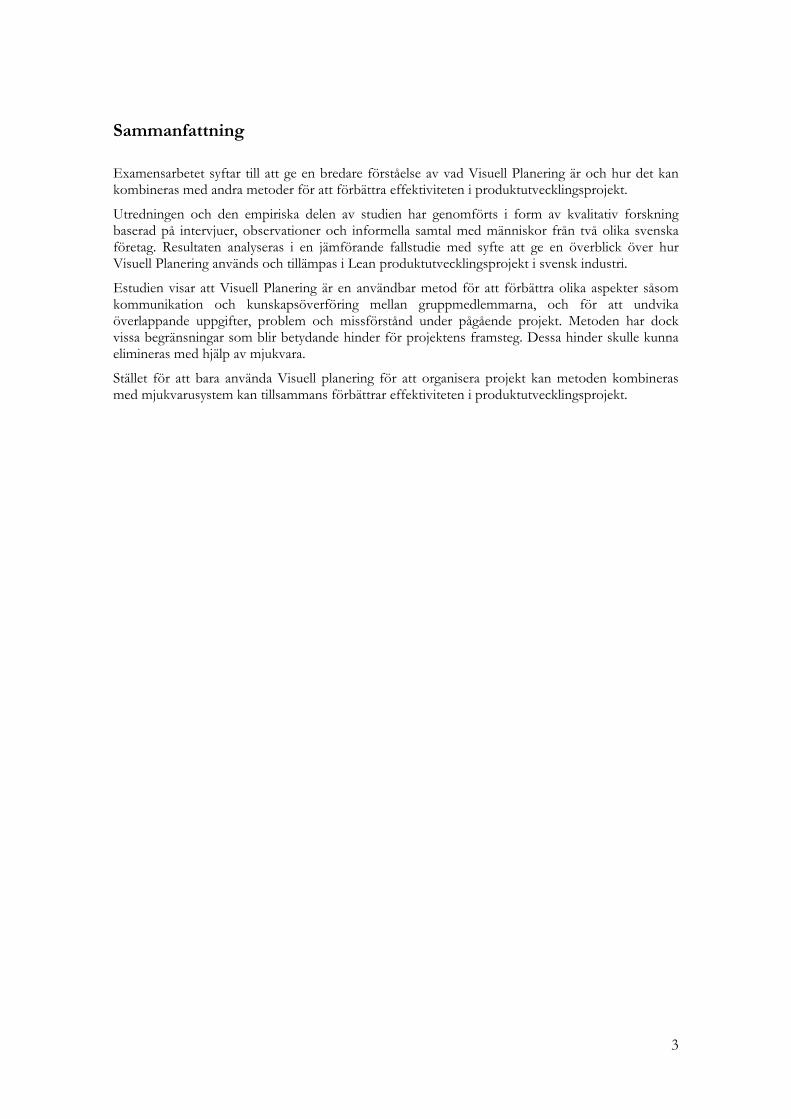
Sammanfattning
Examensarbetet syftar till att ge en bredare förståelse av vad Visuell Planering är och hur det kan kombineras med andra metoder för att förbättra effektiviteten i produktutvecklingsprojekt.
Utredningen och den empiriska delen av studien har genomförts i form av kvalitativ forskning baserad på intervjuer, observationer och informella samtal med människor från två olika svenska företag. Resultaten analyseras i en jämförande fallstudie med syfte att ge en överblick över hur Visuell Planering används och tillämpas i Lean produktutvecklingsprojekt i svensk industri.
Estudien visar att Visuell Planering är en användbar metod för att förbättra olika aspekter såsom kommunikation och kunskapsöverföring mellan gruppmedlemmarna, och för att undvika överlappande uppgifter, problem och missförstånd under pågående projekt. Metoden har dock vissa begränsningar som blir betydande hinder för projektens framsteg. Dessa hinder skulle kunna elimineras med hjälp av mjukvara.
Stället för att bara använda Visuell planering för att organisera projekt kan metoden kombineras med mjukvarusystem kan tillsammans förbättrar effektiviteten i produktutvecklingsprojekt.

5
Acknowledgements
To begin with, I would like to give special thanks to Liv Gingnell and Evelina Ericsson who together, have guided me throughout the whole project. Thanks for the important knowledge and advices that they you shared with me in every meeting and e-mail message.
I am very grateful to the interviewees for all the help, the important experiences and the time that they have provided throughout my work. My especial thanks to Anders Cöster and Ayesha Azam.
I cannot forget to thank Björn Söderberg and Ludvig Lindlöf for their generosity sharing their research and knowledge with me.
Also, thanks to the all my friends that selflessly have shown interest in my project and have advised and helped me during its development, especially thanks to Rosa and Elena.
Thanks to my Spanish friends from the neighborhood and college and to the ones I have met in Sweden for their support not only through this year, but also during my complete studies in Spain. At this point, I cannot forget to give my especially thanks to Alfon, my best supporter and friend.
Thanks also to my “favorite neighbors” for their endless support throughout my time at the university and for believing in me.
Last but not least, I would like to thank my parents and my sister who have always been there for me. Without them I would not be where I am and none of this would have been possible. I love you very much.
Mercedes Cámara Jurado Stockholm, Sweden September 2012

6
7
Table of Contents
1. INTRODUCTION .................................................................................................. 9
2. OBJECTIVES, SCOPE AND DELIMITATIONS ............................................... 11
3. METHOD .............................................................................................................. 13
3.1 QUALITATIVE RESEARCH STUDY .......................................................................................... 13
3.2 CHOICE OF METHOD ................................................................................................................... 13
3.3 LITERATURE STUDY ..................................................................................................................... 14
3.4 INTERVIEWS AND INFORMAL CONVERSATIONS .......................................................... 14
3.5 OBSERVATIONS ............................................................................................................................... 15
3.6 VALIDITY AND RELIABILITY ................................................................................................... 15
4. THEORETICAL FRAMEWORK ......................................................................... 17
4.1 PART I: PROJECT MANAGEMENT AND PRODUCT DEVELOPMENT ..................... 17
4.1.1 Project Management .................................................................................................................... 17
4.1.2 Product Development ................................................................................................................. 18
4.1.3 Lean Product Development ........................................................................................................ 19
4.1.4 Project Management in Lean Product Development ............................................................. 20
4.2 PART II: INNOVATION IN PROJECT MANAGEMENT. VISUAL PLANNING IN LEAN PRODUCT DEVELOPMENT ................................................................................................. 21
4.2.1 Knowledge transfer and communication in Lean Product Development projects ........... 22
4.2.2 Visual Planning and its components ......................................................................................... 24
4.2.3 Visual Planning and Scrum ......................................................................................................... 27
4.3 PART III: SOFTWARE-BASED PLANNING METHODS IN LEAN PRODUCT DEVELOPMENT ..................................................................................................................................... 29
4.3.1 Software-based planning methods ............................................................................................. 29
5. RESULTS. EMPIRICAL FINDINGS .................................................................. 33
5.1 VISUAL PLANNING (SCRUM) AND ITS COMPONENTS ................................................. 33
5.2 KNOWLEDGE TRANSFER AND COMMUNICATION IN VISUAL PLANNING ...... 35
5.3 WASTES/SAVES USING VISUAL PLANNING IN LEAN PRODUCT DEVELOPMENT ..................................................................................................................................... 37
5.4 SOFTWARE-BASED METHODS VS. VISUAL PLANNING ................................................ 38
6. ANALYSIS .............................................................................................................. 41
6.1 VISUAL PLANNING (SCRUM) AND ITS COMPONENTS ................................................. 41
6.2 KNOWLEDGE TRANSFER AND COMMUNICATION IN VISUAL PLANNING ...... 42
6.3 WASTES/SAVES USING VISUAL PLANNING IN LEAN PRODUCT DEVELOPMENT ..................................................................................................................................... 42
8
6.4 SOFTWARE-BASED METHODS VS. VISUAL PLANNING ................................................ 43
7. DISCUSSION ........................................................................................................ 45
7.1 VISUAL PLANNING (SCRUM) AND ITS COMPONENTS ................................................. 45
7.2 KNOWLEDGE TRANSFER AND COMMUNICATION IN VISUAL PLANNING ...... 46
7.3 WASTES/SAVES USING VISUAL PLANNING IN LEAN PRODUCT DEVELOPMENT .................................................................................................................................... 46
7.4 SOFTWARE-BASED METHODS VS. VISUAL PLANNING .............................................. 46
8. CONCLUSIONS AND FURTHER RESEARCH ............................................... 49
8.1 FINAL CONCLSUIONS ................................................................................................................... 49
8.2 SUGGESTIONS FOR FURTHER RESEARCH ......................................................................... 49
9. REFERENCES ...................................................................................................... 51
10. APPENDIX .......................................................................................................... 55
APPENDIX A: QUESTIONS FOR INTERVIEWS ......................................................................... 55
APPENDIX B: STAND-UP MEETINGS, VISUAL PLANNING BOARDS AND SOFTWARE-BASED METHODS SCREENS ........................................................................... 57
APPENDIX C: LIST OF FIGURES ..................................................................................................... 61

Chapter 1. Introduction
VISUAL PLANNING IN LEAN PRODUCT DEVELOPMENT 9
1 INTRODUCTION
Nowadays companies struggle more than ever to enter and stay in the market. In the world of developing new products there is a fierce competition when launching new products as well as maintaining previously existing ones. Thus, companies seek a balance between quality and costs to achieve a competitive advantage and getting a percentage of the overall customers (William J. Stevenson, 2012). However, for reaching these purposes, companies must overcome different barriers and problems that come up during the development of their products.
A problem that arises fairly regularly in the product development industry is the fact that its projects show a tendency not to maintain the expected budget and time. Initial forecasts do not reflect the final results, usually due to an inaccurate planning of resources, either human or material (Graham M. Winch, 1995). Hence the need to prevent the project failure from arising. There are different planning methods which aim to avoid the lack of organization within projects and make them successful.
Visual planning is a method derived from visual management and originating from behavioral science. It focuses on the human side instead of technology. When applied in product development, it is mainly used for planning the workload and tasks involved in a concrete phase of the project life cycle. In a colloquial way it can be described as a visual schedule where all the members of the team that are involved in the project can see how the project is developing. With just a quick glance it is possible to find out who is doing each task, and when they have to finish it. The visual method is employed to see the problems, to communicate suggestions, to understand and apply basic problem solving techniques, to communicate the problem solving process and results to other people, and to praise the involvement effort (Tezel & Koskela & Tzortzopoulos, 2011).
There are software tools that can also be used for planning. These tools allow the project manager responsible for the development process to keep track of its status, the workload and the estimated deadlines. Moreover, software planning allows all of the team members involved in the project to access the project information when required. Software-based tools focus on technology rather than on humans.
It can be said that project planning is an essential topic when it comes to managing a project. The use of visual or computer tools depends on different factors, such as the company’s requirements, its staff, its culture or its way of working, among others. Even though there are companies that prefer the use of visual planning, others prefer software planning tools or even a combination of both. The choice of how to plan a project, and consequently the development of a product, is up to the organizations. This choice determines as well the company’s ability to solve upcoming problems, and thus, develop products efficiently. Companies try their best to achieve their project goals within the budget and time constraints, and therefore, making a good choice when planning the project has a decisive influence on the final outcome.
Due to the different possibilities and ways of planning a project, the purpose of this Thesis is to provide a broader understanding of what visual planning is and how it can be combined with other software tools to enhance efficiency in product development projects.
The experiences of two Swedish companies with visual planning and its complementation with software-based methods will be used for drawing up the analysis of the study. Interviews were conducted to compare the planning methods used within different departments but they all related to the product development area. After analyzing and discussing the results obtained, some conclusions and subsequent personal suggestions will be presented as the culmination of the research.
Chapter 1. Introduction
VISUAL PLANNING IN LEAN PRODUCT DEVELOPMENT 10

Chapter 2. Objectives, Scope and Delimitations
VISUAL PLANNING IN LEAN PRODUCT DEVELOPMENT 11
2 OBJECTIVES, SCOPE AND DELIMITATIONS
The main objective is to study the visual planning method and investigate how it is applied and used. Hence, the scope of this Master Thesis consists of providing wider perception and a deeper insight into what visual planning is and how companies apply it in order to intensify the efficiency of their product development projects.
However, there are other non-visual methods for planning projects that can be complementary and give an overall view of the project status as well. A general study of this kind of software methods will be made in parallel with the visual planning. Besides, how visual and non-visual methods are applied when planning real projects will also be studied. Two Swedish companies will be visited with the purpose of extracting and gathering the maximum amount of information about their planning methods. Interviews and observations will be the main way of obtaining the data for further analysis. The analysis will consist of a comparison between the different methods studied and the way that the interviewed companies implement and use them. The possible differences in terms of benefits, drawbacks, advantages and disadvantages will be collected through to the opinions, comments, insights and points of view of different workers and departments from the two mentioned Swedish companies. Thus, depending on the results obtained after a deep study of the data, conclusions will be extracted and shared in this report. Finally, personal opinions about the outcomes will be exposed with the purpose of being useful for further users of visual planning and software-based planning methods.
Nevertheless, it is important to mention that there are some limitations that restrain this Master Thesis. The study is based on the experiences of two Swedish companies regarding their planning methods so that the study is limited to the Swedish industry. Another constraint is that the project only focuses on visual and non-visual planning methods applied in the product development environment, hence reducing the number of companies that may find this study useful.
It is however essential to mention the confidentiality clauses existing during the development of new products to avoid potential early reaction from competitors. Due to that, it may be assumed that not all the relevant information was shared by interviewees. Therefore the analysis of the data will remain under this premise, and so will the conclusions.
Visual planning is a fairly new method. Despite the fact that the amount of literature about its use in product development projects is limited, useful conclusions can be extracted from the comparison between theoretical research and the actual experiences at the companies.
Chapter 2. Objectives, Scope and Delimitations
VISUAL PLANNING IN LEAN PRODUCT DEVELOPMENT 12
Chapter 3. Method
VISUAL PLANNING IN LEAN PRODUCT DEVELOPMENT 13
3 METHOD
The method aims to show how the research has been conducted. Besides, the choices made during the process must be justified to give validity to the elected method.
3.1 QUALITATIVE RESEARCH STUDY
In terms of research strategy, the study stays firmly in the qualitative realm as opposed to the quantitative. Qualitative research focuses on words rather than numbers, but also shows three important features: “an inductive view of the relationship between theory and research, whereby the former is generated out of the latter; an epistemological position described as interpretive, meaning that, in contrast to the adoption of a natural scientific model in quantitative research, the stress is on the understanding of the social world through an examination of the interpretation of that world by its participants; and an ontological position described as constructionist which implies that social properties are outcomes of the interactions between individuals, rather than phenomena ‘out there’ and separate from those involved in its construction” (Alan Bryman, 2004).
Qualitative methods can offer information in a deep way that is not possible with quantitative methods. Qualitative research gives “richer” answer to questions and may give valuable insights that could have been missed by any other method (Mays, N. & Pope, C., 1995)
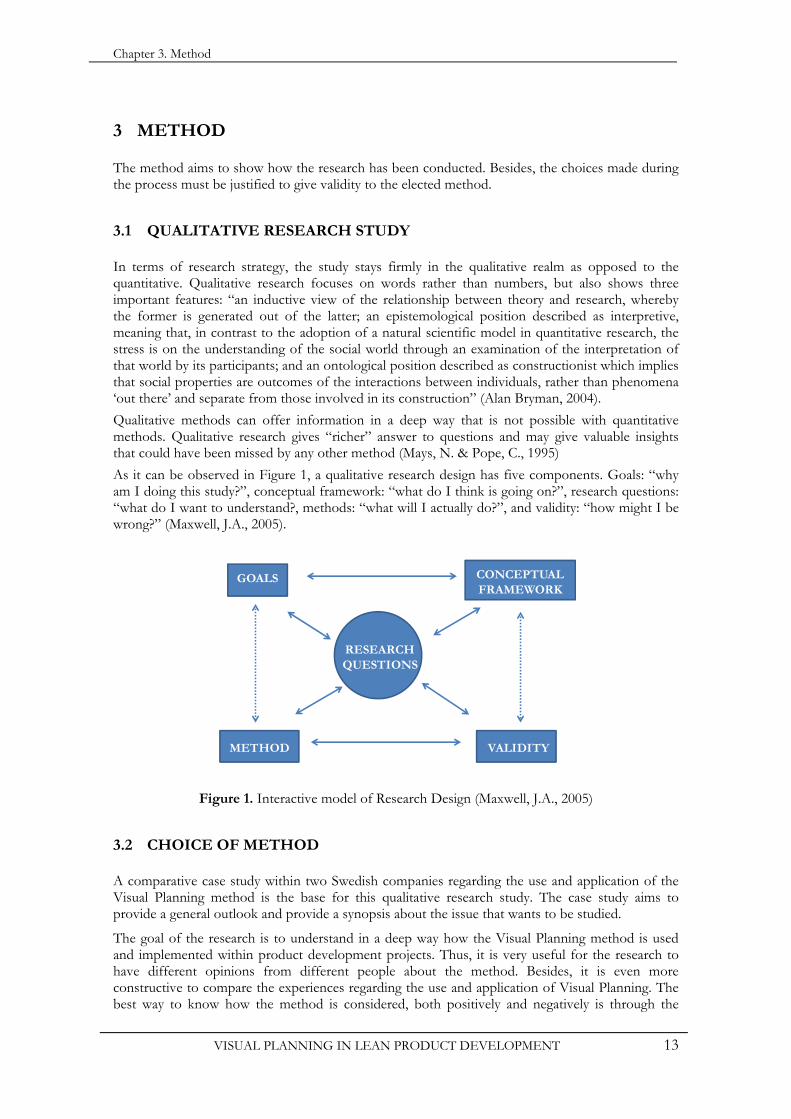
As it can be observed in Figure 1, a qualitative research design has five components. Goals: “why am I doing this study?”, conceptual framework: “what do I think is going on?”, research questions: “what do I want to understand?, methods: “what will I actually do?”, and validity: “how might I be wrong?” (Maxwell, J.A., 2005).
Figure 1. Interactive model of Research Design (Maxwell, J.A., 2005)
3.2 CHOICE OF METHOD
A comparative case study within two Swedish companies regarding the use and application of the Visual Planning method is the base for this qualitative research study. The case study aims to provide a general outlook and provide a synopsis about the issue that wants to be studied.
The goal of the research is to understand in a deep way how the Visual Planning method is used and implemented within product development projects. Thus, it is very useful for the research to have different opinions from different people about the method. Besides, it is even more constructive to compare the experiences regarding the use and application of Visual Planning. The best way to know how the method is considered, both positively and negatively is through the
GOALS CONCEPTUAL FRAMEWORK
METHOD VALIDITY
RESEARCH QUESTIONS
Chapter 3. Method
VISUAL PLANNING IN LEAN PRODUCT DEVELOPMENT 14
personal experiences of people that are working with it. This gives more reliability to the method chosen and the conclusions obtained could be considered more valuable than if the study had been carried out based on a single person or within only one company.
Consequently, different interviews have been carried out for gathering experiences and current opinions about the Visual Planning method. In addition, informal conversations and observations have been conducted in order to intensify the richness and quality of the research.
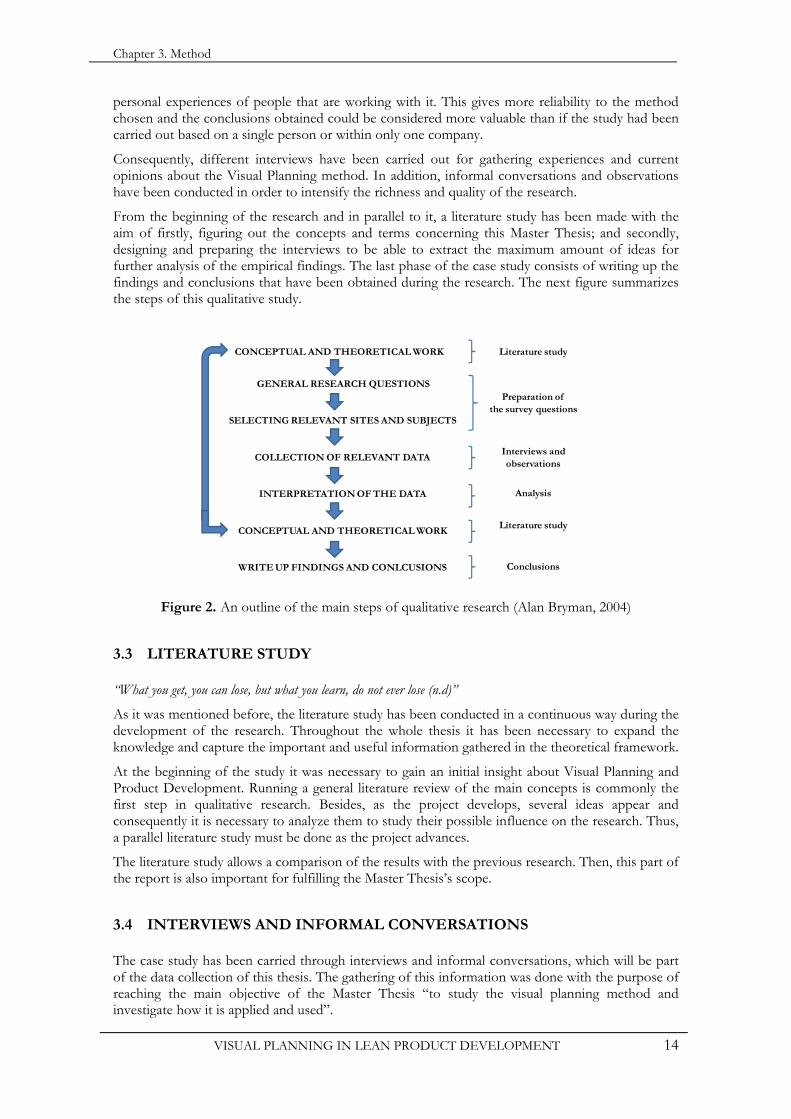
From the beginning of the research and in parallel to it, a literature study has been made with the aim of firstly, figuring out the concepts and terms concerning this Master Thesis; and secondly, designing and preparing the interviews to be able to extract the maximum amount of ideas for further analysis of the empirical findings. The last phase of the case study consists of writing up the findings and conclusions that have been obtained during the research. The next figure summarizes the steps of this qualitative study.
Figure 2. An outline of the main steps of qualitative research (Alan Bryman, 2004)
3.3 LITERATURE STUDY
“What you get, you can lose, but what you learn, do not ever lose (n.d)”
As it was mentioned before, the literature study has been conducted in a continuous way during the development of the research. Throughout the whole thesis it has been necessary to expand the knowledge and capture the important and useful information gathered in the theoretical framework.
At the beginning of the study it was necessary to gain an initial insight about Visual Planning and Product Development. Running a general literature review of the main concepts is commonly the first step in qualitative research. Besides, as the project develops, several ideas appear and consequently it is necessary to analyze them to study their possible influence on the research. Thus, a parallel literature study must be done as the project advances.
The literature study allows a comparison of the results with the previous research. Then, this part of the report is also important for fulfilling the Master Thesis’s scope.
3.4 INTERVIEWS AND INFORMAL CONVERSATIONS
The case study has been carried through interviews and informal conversations, which will be part of the data collection of this thesis. The gathering of this information was done with the purpose of reaching the main objective of the Master Thesis “to study the visual planning method and investigate how it is applied and used”.
GENERAL RESEARCH QUESTIONS
SELECTING RELEVANT SITES AND SUBJECTS
COLLECTION OF RELEVANT DATA
INTERPRETATION OF THE DATA
CONCEPTUAL AND THEORETICAL WORK
WRITE UP FINDINGS AND CONLCUSIONS
CONCEPTUAL AND THEORETICAL WORK Literature study
Preparation of the survey questions
Interviews and observations
Analysis
Conclusions
Literature study
Chapter 3. Method
VISUAL PLANNING IN LEAN PRODUCT DEVELOPMENT 15
The interviews and informal conversations were focused on extracting the maximum amount of information about the benefits, lacks, advantages and disadvantages of planning projects in a visual way as compared to other planning systems. They were conducted with people from different departments and different companies, all which were involved in product development projects.
A total of four interviews were carried with different members of different departments within Company B. The opinions of these four people regarding their use of Visual Planning will be referred as B1, B2, B3 and B4. On the other hand one interview was conducted with one person from a department inside Company A. This unique experience with the visual method will be named as A1.
Regarding the organization of the interviews they can be unstructured, structured or semi-structured. The unstructured interviews are completely flexible, almost like an informal conversation. Questions are not predetermined and they are created as the conversation flows. On the other hand, structured interviews have a standardized way of collecting information and, the same type of questions are used for each respondent. A semi-structured interview differs from the structured version in the flexibility. An interview guide is used but there are no fixed order topics and specific questions are not necessarily previously prepared (Lynda S. Robson & Harry S. Shannon & Linda M. Goldenhar & Andrew R. Hale, 2011).
The interviews used in this research have been designed in a semi-structured way, which is common in qualitative research. Also, this structure allows the respondents to be open in their answers so they can reply to questions on their own terms and in as much detail as they want. Thus, the information obtained contributes to the richness of the empirical findings.
Interviews can be made via telephone, email or in person (Ghauri, P. & Gronhaug, K,. 2010). The majority of the interviews in this study have been conducted in person. They have been recorded and some notes were taken as well. However, some interviews have been made by email or phone having a structured appearance although the interviewees had the freedom to reply to their questions in as much depth as they wanted.
All these interviews, via email, phone or in person, and the informal conversations are compared and used in the analysis part of this Thesis, with the aim to reach its purpose and to draw the final conclusions of this research.
3.5 OBSERVATIONS
As it was mentioned before, another method used for collecting qualitative data consists of observations on the spot. These are useful for having a comprehension of opinions, experiences, approaches and postures regarding the use of Visual Planning inside the companies. With participant observations, everything can be captured, including the physical environment, social organization, program activities, as well as behaviors and interactions of people. It is an effective way to collect first-hand information in a natural setting (Ghauri, P. & Gronhaug, K., 2010).
Several observations in the application of the Visual Planning method and the use of its components have been made in order to amplify and increase the bounty of the empirical findings. Direct perception provides a deeper insight of the method and complements the information obtained in the interviews and informal conversations. These observations have been collected inside the two Swedish companies selected for this study.
3.6 VALIDITY AND RELIABILITY
“Validity in qualitative research is the result not of indifference, but of integrity (Leonard Bickman, Debra J. Rog, 1998)” .
The qualitative method stated and used in the report must be consistent throughout the whole study (reliability concerns). It must not hide biases, prejudices, tendencies, preferences, etc. in the
Chapter 3. Method
VISUAL PLANNING IN LEAN PRODUCT DEVELOPMENT 16
data collection, the data analysis or the conclusions drawn (validity concerns) (Lynda S. Robson & Harry S. Shannon & Linda M. Goldenhar & Andrew R. Hale, 2011).
All the interviews were transcribed after being done. They were summarized and some quick conclusions were extracted. This brief abstract was sent to the interviewees to get their approval of the conclusions that were drawn. Seeking the cooperation of informants to confirm the objectivity and credibility of the notes taken during the interviews and observations makes this study valid and reliable. This makes sure that what has been seen or recorded is concordant with what interviewees see or say about the research subjects (Nahid Golafshani, 2003). A second review was conducted in order to validate the opinions extracted from the interviewees. The final report of this Master Thesis was sent to them for both verifying its content and confirming the reliability of the document.
Every technical method available today was used to preserve the witnessed reality. Interviews were recorded and observations were photographed.
The data collection and analysis methods are specified. Thus other researchers can make use of the original report as an operation manual to repeat the study (Guba, E.G & Lincoln, Y.S, 1989). Besides, this specification makes it easier to extend the results of the study to other planning methods different from those used in this Master Thesis (transferability).
Finally, it is important to mention that the whole Thesis has had a continuous monitoring from the Industrial Information and Control Systems Department at the University KTH of Stockholm.
Chapter 4. Theoretical Framework
VISUAL PLANNING IN LEAN PRODUCT DEVELOPMENT 17
4 THEORETICAL FRAMEWORK
The purpose of this section is to give theoretical support when reading through the thesis for understanding what “Visual Planning in Lean Product Development” is and for linking the theory with the analysis of the results obtained.
4.1 PART I: PROJECT MANAGEMENT AND PRODUCT DEVELOPMENT
4.1.1 Project Management
The main objective when managing projects is to ensure that the project is delivered in accordance with the parameters that have been pre-defined which traditionally are scope, time and cost. According to the Project Management Institute (PMI), the whole project is defined by three characteristics: it is temporary, unique and requires a progressive development.
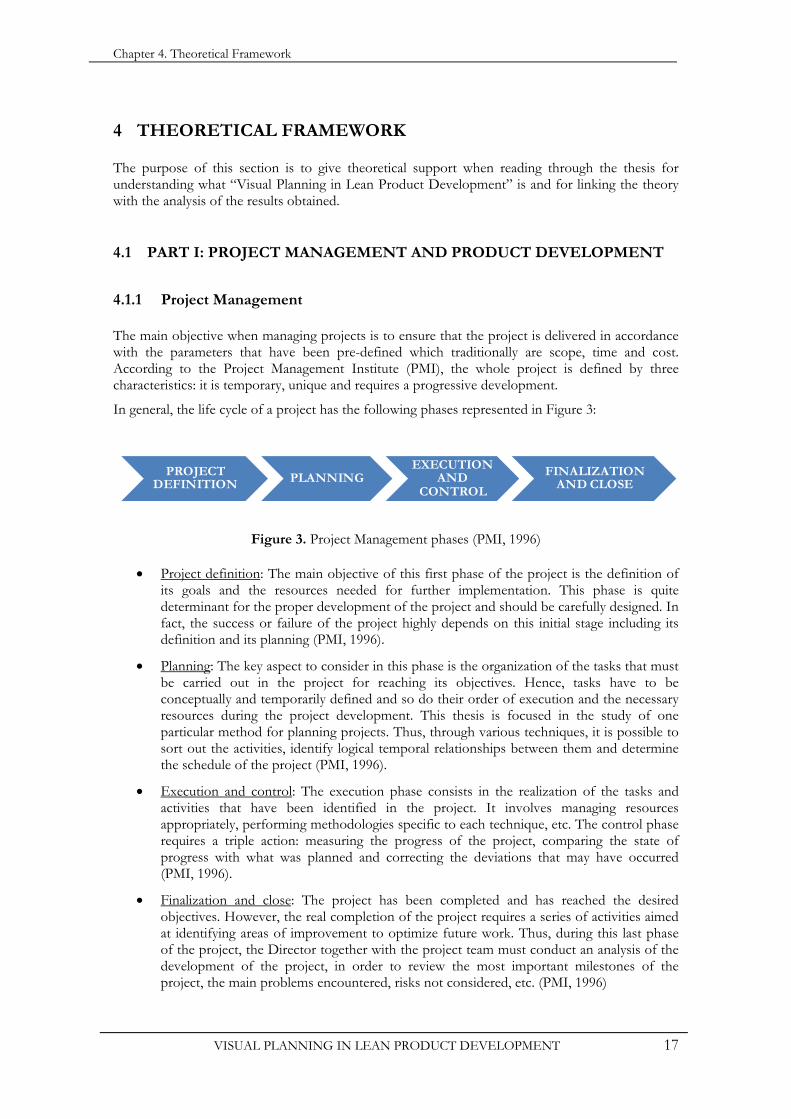
In general, the life cycle of a project has the following phases represented in Figure 3:
Figure 3. Project Management phases (PMI, 1996)
Project definition: The main objective of this first phase of the project is the definition of its goals and the resources needed for further implementation. This phase is quite determinant for the proper development of the project and should be carefully designed. In fact, the success or failure of the project highly depends on this initial stage including its definition and its planning (PMI, 1996).
Planning: The key aspect to consider in this phase is the organization of the tasks that must be carried out in the project for reaching its objectives. Hence, tasks have to be conceptually and temporarily defined and so do their order of execution and the necessary resources during the project development. This thesis is focused in the study of one particular method for planning projects. Thus, through various techniques, it is possible to sort out the activities, identify logical temporal relationships between them and determine the schedule of the project (PMI, 1996).
Execution and control: The execution phase consists in the realization of the tasks and activities that have been identified in the project. It involves managing resources appropriately, performing methodologies specific to each technique, etc. The control phase requires a triple action: measuring the progress of the project, comparing the state of progress with what was planned and correcting the deviations that may have occurred (PMI, 1996).
Finalization and close: The project has been completed and has reached the desired objectives. However, the real completion of the project requires a series of activities aimed at identifying areas of improvement to optimize future work. Thus, during this last phase of the project, the Director together with the project team must conduct an analysis of the development of the project, in order to review the most important milestones of the project, the main problems encountered, risks not considered, etc. (PMI, 1996)
PROJECT DEFINITION PLANNING
EXECUTION AND
CONTROL
FINALIZATION AND CLOSE
Chapter 4. Theoretical Framework
VISUAL PLANNING IN LEAN PRODUCT DEVELOPMENT 18
4.1.2 Product Development
“There is much more opportunity for competitive advantage in product development than anywhere else” (The Toyota Product Development System, James. M. Morgan, Jeffrey K. Liker).
The process of developing a product could be translated into Project Management terms as the management of a product. Product Development is mostly done on project basis (Lindlöf, L. & Söderberg, B., 2011). It is interpreted as the transformation of a market opportunity and a set of assumptions about product technology into a product available for sale (Krishnan, V. & Ulrich, K.T., 2001). Besides, it can involve into the product in different ways, such as new features/functions, new looks or new technologies, promoting the most important sources for maintaining customers excited, all of which affect the results by keeping or rising market share (Kosonen, K. & Buhanist, P., 1995).
New products are becoming the key item of competition for many companies. Thus Product Development is even more critical every day (Clark, K.B. & Fujimoto, T., 1991) and also what gives competitive advantage. It is a medium by which members of the organizations adapt, diversify, and reinvent to balance market evolution and technical conditions (Schoohoven, C.B. & Eisenhardt, K.M. & Lyman, K., 1990).
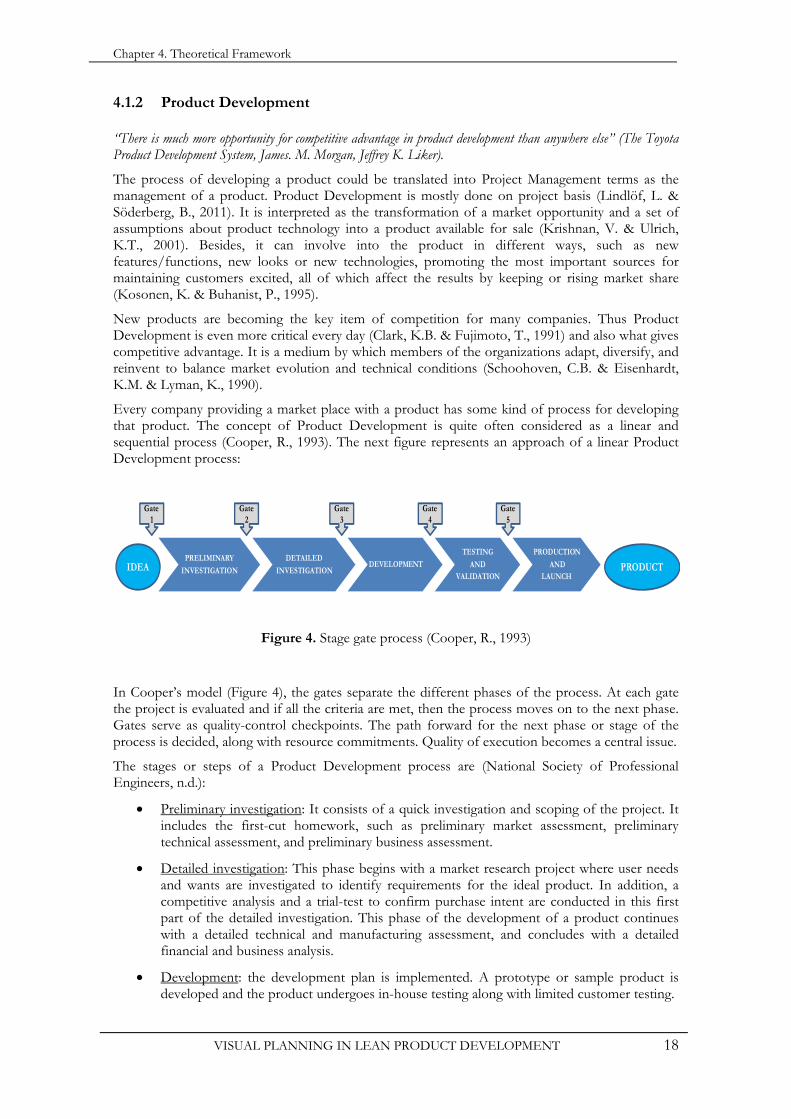
Every company providing a market place with a product has some kind of process for developing that product. The concept of Product Development is quite often considered as a linear and sequential process (Cooper, R., 1993). The next figure represents an approach of a linear Product Development process:
Figure 4. Stage gate process (Cooper, R., 1993)
In Cooper’s model (Figure 4), the gates separate the different phases of the process. At each gate the project is evaluated and if all the criteria are met, then the process moves on to the next phase. Gates serve as quality-control checkpoints. The path forward for the next phase or stage of the process is decided, along with resource commitments. Quality of execution becomes a central issue.
The stages or steps of a Product Development process are (National Society of Professional Engineers, n.d.):
Preliminary investigation: It consists of a quick investigation and scoping of the project. It includes the first-cut homework, such as preliminary market assessment, preliminary technical assessment, and preliminary business assessment.
Detailed investigation: This phase begins with a market research project where user needs and wants are investigated to identify requirements for the ideal product. In addition, a competitive analysis and a trial-test to confirm purchase intent are conducted in this first part of the detailed investigation. This phase of the development of a product continues with a detailed technical and manufacturing assessment, and concludes with a detailed financial and business analysis.
Development: the development plan is implemented. A prototype or sample product is developed and the product undergoes in-house testing along with limited customer testing.
PRELIMINARY
INVESTIGATION
DETAILED
INVESTIGATION DEVELOPMENT
TESTING
AND VALIDATION
PRODUCTION
AND LAUNCH
Gate1
Gate5
Gate4
Gate3
Gate2
IDEA PRODUCT
Chapter 4. Theoretical Framework
VISUAL PLANNING IN LEAN PRODUCT DEVELOPMENT 19
Testing and validation: in this phase the proposed new product is tested and validated. The deliverable is a fully tested product and production process, ready for commercialization.
Production and launch: this last stage marks the beginning of full production and commercial selling.
The challenge in product development is to make the process effective from the initial idea to the final product. Thus, many people, departments, projects, resources, etc. are involved to some extent in the development of the product. Therefore, everything related to the product development process should be organized and planned carefully and smoothly, in order to reach the maximum efficiency.
4.1.3 Lean Product Development
The term “lean” was first used by Womack and Jones in their book Lean Thinking, where they collected all the concepts and theories of management and production companies that were obtained after their studies in Japan during the decade of the 1980s. According to “lean methodology”, you are producing in a lean way if, having an optimum quantity of resources, you use them to make products with the minimum amount of waste: “Doing more and more with less and less” (Womack, J.P & Jones, D.T. & Roos, D., 1991). The concept of Lean is also considered as “a mindset, or a way of thinking, with a commitment to achieve a totally waste-free operation that is focused on the customer’s success. It is achieved by simplifying and continuously improving all processes and relationships in an environment of trust, respect and full employee involvement. It is about people, simplicity, flow, visibility, partnerships and true value as perceived by the customer” (David Hogg, 2008).
Lean is commonly related with the term “production”, meaning those processes that are related with material supply, component production and the delivery products. However, Lean Thinking could be applied outside the manufacturing operations such as Product Development. The positive effects that are shown with this methodology in manufacturing can also be seen in product development as well as in other parts within organizations (Wang, X.G.L & Ming, F.B & P.P Wang, D.Li, 2012).
Lean Product Development could be defined as the application of lean principles to the Product Development process to eliminate wastes (Womack, J.P & Jones, D.T, 2003). It involves suppliers, cross-functional teams, simultaneous engineering, etc. It focuses on integration of activities instead of coordination, strategic management, and also in visions and objectives instead of detailed specifications (Karlsson, C. & Ahlstrom, P., 1996). Nevertheless, the applicability of the Lean principles in a Product Development context has not been an easy on going topic.
Different authors and researchers, when referring to Lean Product Development write about it in terms of waste elimination; others talk about how to improve flow in product development, and consider other points of view. However, there is not a standard procedure for the transition of each activity in the Product Development process to Lean.
Toyota provides a model displayed in Figure 5 for product-process development as it was previously done in the manufacturing area. This approach model is called Toyota’s Product Development System. In here, it is mentioned that what really makes Lean Product Development powerful is the entire system of jointly supportive tools, processes and human system working in parallel.

Chapter 4. Theoretical Framework
VISUAL PLANNING IN LEAN PRODUCT DEVELOPMENT 20
Figure 5. Systems approach to Product Development (Liker, J.K. & Morgan, J.M., 2006)
4.1.4 Project Management in Lean Product Development
There are different methods when it comes to managing the development of a product. The way of organizing the tasks involved in a project depends on many factors (e.g. the type of project itself, the number of people, time available, etc.) Thus, the methods used for planning a project depend on its requirements.
Cooper’s model presented in Figure 4 becomes obsolete when product development is not linear. In this situation, specific situations and new conditions may occur, thus forcing the initial planning to change. Consequently, the product could fail in meeting the expectations of the final users (Wheelright, S. & Clark, K., 1992).
Because of this there are different methods for managing Product Development projects. They can be divided into two main groups: conventional or classic methods and dynamic or agile methods. The classic methods are related to the conventional way of working. They are based on prediction and try to avoid possible project changes in the initial set of requirements. On the other hand, Agile philosophy is closely related to Lean. Planning methods based on this agile philosophy and applied to Product Development give Lean character to the way in which the product has been developed (Walton, M., 1999).
“Requirements change, the design changes, business changes, technology changes, equipment changes and team members change. The problem is not change, because change will inevitably occur. The problem is our inability to face changes” (Kent Beck, one of the creators of the agile model).
Agile methods appear as an attractive option. In contrast to conventional methods that act based on principles of linearity, stability and control, agile methodologies do not focus on prediction, or pretend to have a perfectly defined system previous to its construction, but perceive changes as an opportunity to improve the system and increase customer satisfaction. “Agility is persistent behavior or skill, a sentient entity, which has flexibility to adapt to changes rapidly, expected or unexpected. Moreover, agility seeks the shortest duration in time, using simple and quality economic instruments in a dynamic environment, and uses knowledge and previous experience to learn from both the internal and the external environment” (Qumer, A. & Henderson-Sellers, B., 2007).
According to Kent Beck et al., agile principles are based on:
- Working closely with the client - Willingness to respond to change
Process
LEAN PRODUCT
DEVELOPMENT SYSTEM
11. Adapt technology to fit your people and process12. Align your organization through simple, visual communication13. Use powerful tools for standardization and organizational learning
1. Establish customer-value to separate value-added fromwaste2. Front-Load the PD process to explore thoroughly alternative solutions while there is maximum design space 3. Create a leveled Product Development Process Flow4. Utilize rigorous standardization to reduce variation, and create flexibility and predictable outcomes
5. Develop a chief engineer system tointegrate development from start to finish6. organize to balance functional expertiseand cross-functional integration7. Develop towering technical competence in all engineers8. Fully integrate suppliers into the ProductDevelopment System9. Build in learning and continuous improvement10. Build a culture to support excellence and relentless improvement
Chapter 4. Theoretical Framework
VISUAL PLANNING IN LEAN PRODUCT DEVELOPMENT 21
- Incremental development with frequent deliveries of functionality - Direct verbal communication - Simplicity, using only the devices necessary - Motivation, commitment and team responsibility for self-management and self-
organization
Nowadays, there is a tendency towards shortening the product life and thus, faster development and application must be implemented as well. Change and rapid and continuous evolution are inherent factors in this unstable environment. The competitive advantage is to increase productivity and meet the varying needs of the customer in the shortest possible time to provide greater business value (Boehm, B., 2006).
Conventional methods face several problems when dealing with a wide range of industrial projects in this turbulent environment (Lindvall, et al., 2002). They try to avoid changes in the initial set of requirements because as the project progresses, it is more expensive to fix errors or it is more difficult to introduce changes. For this reason, they are also known as predictive methodologies. This control causes customer dissatisfaction; they perceive the project as being inflexible and not suiting their needs (Boehm, B., 2006).
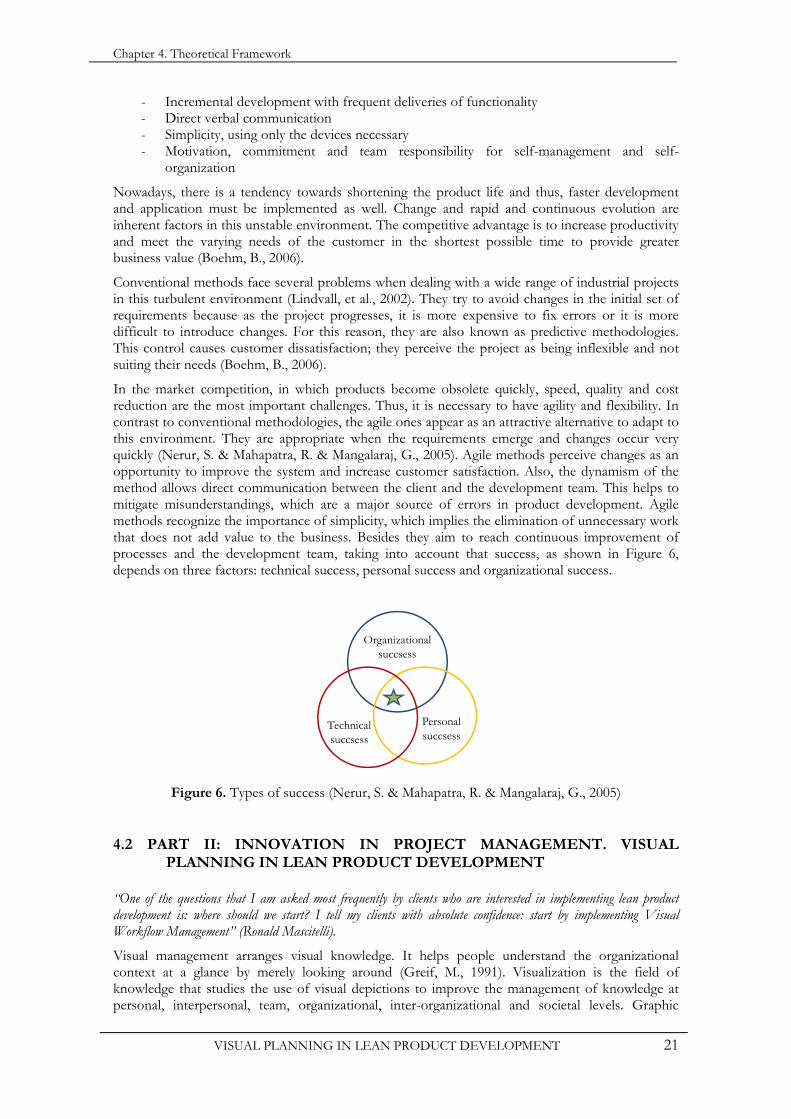
In the market competition, in which products become obsolete quickly, speed, quality and cost reduction are the most important challenges. Thus, it is necessary to have agility and flexibility. In contrast to conventional methodologies, the agile ones appear as an attractive alternative to adapt to this environment. They are appropriate when the requirements emerge and changes occur very quickly (Nerur, S. & Mahapatra, R. & Mangalaraj, G., 2005). Agile methods perceive changes as an opportunity to improve the system and increase customer satisfaction. Also, the dynamism of the method allows direct communication between the client and the development team. This helps to mitigate misunderstandings, which are a major source of errors in product development. Agile methods recognize the importance of simplicity, which implies the elimination of unnecessary work that does not add value to the business. Besides they aim to reach continuous improvement of processes and the development team, taking into account that success, as shown in Figure 6, depends on three factors: technical success, personal success and organizational success.
Figure 6. Types of success (Nerur, S. & Mahapatra, R. & Mangalaraj, G., 2005)
4.2 PART II: INNOVATION IN PROJECT MANAGEMENT. VISUAL PLANNING IN LEAN PRODUCT DEVELOPMENT
“One of the questions that I am asked most frequently by clients who are interested in implementing lean product development is: where should we start? I tell my clients with absolute confidence: start by implementing Visual Workflow Management” (Ronald Mascitelli).
Visual management arranges visual knowledge. It helps people understand the organizational context at a glance by merely looking around (Greif, M., 1991). Visualization is the field of knowledge that studies the use of visual depictions to improve the management of knowledge at personal, interpersonal, team, organizational, inter-organizational and societal levels. Graphic
Organizationalsuccsess
Technicalsuccsess
Personal succsess

Chapter 4. Theoretical Framework
VISUAL PLANNING IN LEAN PRODUCT DEVELOPMENT 22
formats such as ad hoc, joint drawings of ideas in meetings, are examples of knowledge visualization.
Visual management is a wide term. It includes several types of visual methods in different kinds of processes, operations and activities. Depending on the environment that visual management is applied in, it is named differently, e.g. visual workplace, visual control, visual factory, visual tools, visual communication, etc. In the field of interest of this project, the term “Visual Management” is used.
Within the Product Development environment, there are different manners of visualizing and managing the information. The method which is going to be the basis for the analysis in this report is called “Visual Planning”.
However, it is important to mention that the concept of Visual Planning could have different meanings. Visual planning is a method or a tool for visualizing the planning or organization of something. Thus, when Visual Planning is referred to as a method, it will be written with capital letters or with the abbreviation “VP”. On the other hand, when it is considered as a visible tool for planning it will be written in lowercase.
4.2.1 Knowledge transfer and communication in Lean Product Development projects
Knowledge transfer within organizations could be defined as the process through which a unit, group, department or division, is affected by the experience of another (Argote, L. & Ingram, P., 2000). It is a challenge to transfer knowledge about products, customer and internal processes inside an organization.
There are different types of knowledge: tacit and explicit knowledge.
Tacit knowledge is defined as “being understood without being openly expressed’’ (Random House dictionary of the English Language, 1971). It is automatic, requires little or no time or thought, and helps determinE how organizations make decisions and influence the collective behavior of their members (Liebowitz & Beckman, 1998). Tacit knowledge is the knowledge that cannot be told, the one that is used without thinking about it (like riding a bicycle).
On the other hand, explicit knowledge is the one that is technical and requires a level of academic knowledge or understanding, which is gained through formal education, or structured study. Most explicit knowledge is technical or academic data or information that is described in formal language, like manuals, mathematical expressions, copyright and patents(Elizabeth A. Smith, 2001).
Comparing tacit with explicit knowledge, the explicit type can be transmitted with physical tools like texts or graphics, however tacit knowledge needs social interaction or practical experience to be internalized (Nonaka, I., 1994). In addition, the amount of information that managers have is difficult to transfer to the staff because this information is usually vast and dense.
Because the brain can process images more easily than texts, visual methods are often used for this purpose (Martin J. Eppler & Rema A. Burkhard, 2007). They are used for turning knowledge into a compact and comprehensible package (Lindlöf, L. & Söderberg, B. & Persson, M., 2012). “Lean product development offers a complete set of tools for organizational knowledge that, if applicable, can be evaluated and purposefully implemented to improve the knowledge transfer practices in the organization concerned” (Lindlöf, L. & Söderberg, B. & Persson, M., 2012).
As it was mentioned above, tacit knowledge requires human integration. All the people involved in a project have their own wisdom and they bring it into the project development in an implicit way. If this tacit knowledge is not communicated it becomes obsolete. Thus, communication plays an important role in the transfer of knowledge.
Communication is a means of transmitting information and making oneself understood by another or others. As in knowledge transfer, communication is a challenge for managers and other persons

Chapter 4. Theoretical Framework
VISUAL PLANNING IN LEAN PRODUCT DEVELOPMENT 23
involved in projects. They are all responsible for providing information which results in efficient and effective performance in organizations (Nancy Borkowski, 2011).
Communication results in the creation or exchange of thoughts, ideas, emotions and agreements among different people. Due to the disparity of people involved in the development of a project, different barriers could exist when they communicate with each other. The common barriers to overcome can be personal (beliefs, values, lack of empathy, etc.) and environmental (multiple levels of hierarchy, organizational complexity, specific terminology, etc.). Figure 7 shows the typical communication process and the corresponding barriers mentioned above.
Figure 7. The communication process (Nancy Borkowski, 2011)
The messages within communication processes can be transmitted by different channels: verbal and nonverbal. Nonverbal communication is out of the field of this study due to the fact that it consists in sharing information without using words to encode messages. In development projects, it is in fact essential to use words.
There are different forms of verbal communication, which should be used for different situations. As Figure 8 shows, face-to-face meetings are information-rich, since they allow emotions to be transmitted and immediate feedback to take place. Written communication is more appropriate for describing details. Although traditional written communication was traditionally considered slow, with the development of electronic mail and computer-aided communication, written communication has dramatically improved its efficiency.
Figure 8. Communication channels (Daft, R.L. & Lengel, R.H, 1984)
Feedback• receive• decode
Sender
Message
Sender
Message• create• encode
Message• receive• decode
Barriers• environment• personal
• create• encode
Feedback
• create• encode
Face-to-face meetingVideo Conference
Fax MessageElectronic email
Web PageIndividulized letter
Personalized note or memoPolicy statement
Newspaper, television, radio
Formal written reportBulletin, newsletter
Formal numeric report
HIGHEST
INFORMATION RICHNESS
LOWEST
Chapter 4. Theoretical Framework
VISUAL PLANNING IN LEAN PRODUCT DEVELOPMENT 24
Knowledge transfer and communication are both closely connected. Communication plays an important role in knowledge management. Effective communication minimizes the lack of knowledge transfer. It is one of the most critical goals of organizations (Spillan, J. E. & Mino, M. & & Rowles, M.S., 2002).
4.2.2 Visual Planning and its components
Visual planning is a method which has been the first step towards the implementation of lean product development by several companies. It is a simple method where activities and deliverables are outlined and illustrated on a physical planning board and discussed at frequent meetings. In addition, it seeks to visualize the undertakings of the team to create a unified view that enhances team communication (Lindlöf, L. & Söderberg, B., 2011).
There is a need to create approaches which allow feedback and can be used in Product Development projects that are complex and uncertain (Jaafari, A., 2003). Visualization is used in product development, where it is very common to have complexity and uncertainty. Somehow it simplifies and clarifies the process development. Stand-up meetings and whiteboards are the basis of the Visual Planning method.
Several meetings are carried out throughout the development project for giving feedback to the project in general and to the tasks and personal involved in particular. Managers in charge of the project meet with their teamwork usually once a week and for no more than fifteen minutes. In the course of these meetings, an intensive interaction between the participants exists. A detailed list of actions, issues, status and progress are updated and captured in real time on whiteboards.
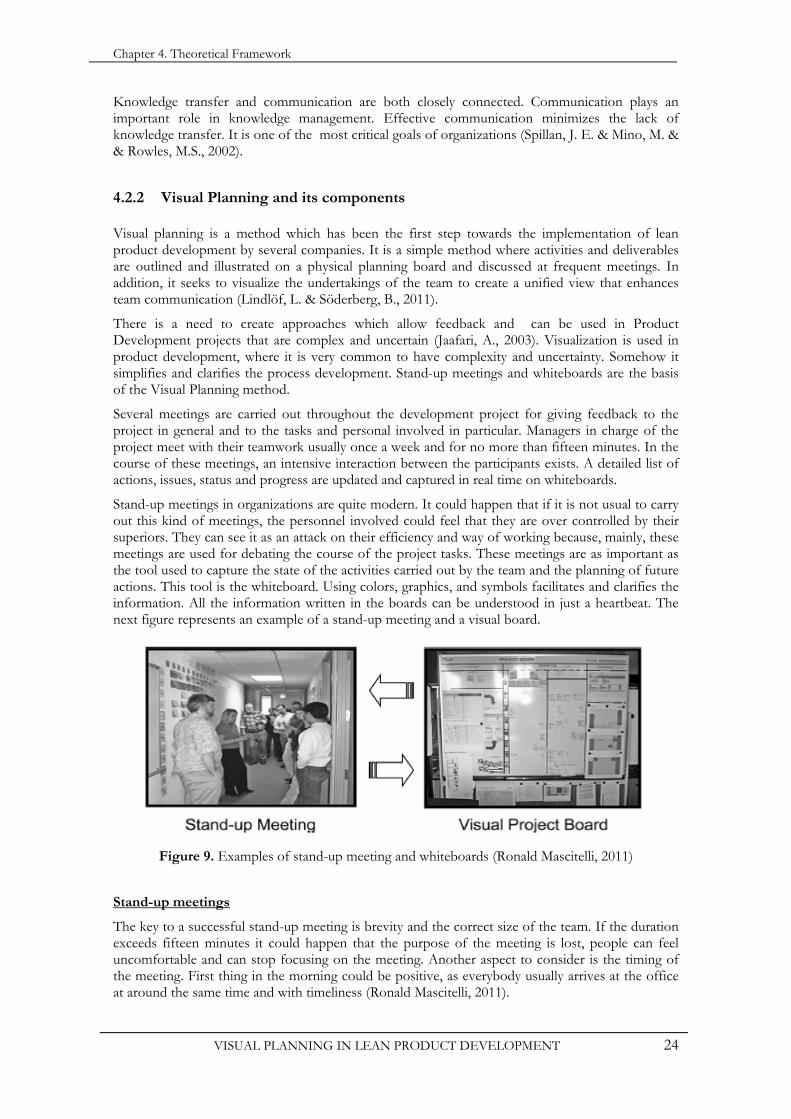
Stand-up meetings in organizations are quite modern. It could happen that if it is not usual to carry out this kind of meetings, the personnel involved could feel that they are over controlled by their superiors. They can see it as an attack on their efficiency and way of working because, mainly, these meetings are used for debating the course of the project tasks. These meetings are as important as the tool used to capture the state of the activities carried out by the team and the planning of future actions. This tool is the whiteboard. Using colors, graphics, and symbols facilitates and clarifies the information. All the information written in the boards can be understood in just a heartbeat. The next figure represents an example of a stand-up meeting and a visual board.
Figure 9. Examples of stand-up meeting and whiteboards (Ronald Mascitelli, 2011)
Stand-up meetings
The key to a successful stand-up meeting is brevity and the correct size of the team. If the duration exceeds fifteen minutes it could happen that the purpose of the meeting is lost, people can feel uncomfortable and can stop focusing on the meeting. Another aspect to consider is the timing of the meeting. First thing in the morning could be positive, as everybody usually arrives at the office at around the same time and with timeliness (Ronald Mascitelli, 2011).
Chapter 4. Theoretical Framework
VISUAL PLANNING IN LEAN PRODUCT DEVELOPMENT 25
Each meeting involves teamwork. The size of the group for an effective meeting should be no bigger than twelve people (Ronald Mascitelli, 2011). At these meetings three questions are generically answered by the team members:
- What has the team completed since the last meeting? - What actions should be accomplished for the next meeting? - What potential troubles or risks will have to be overcome in order to achieve the project
goals?
One reason why meetings could be inefficient is the lack of communication among team members. They must communicate well for achieving a successful meeting. Communication is a mechanism that explains, shares and integrates information (Hirst, G. & Mann, L., 2004). When communication between the members of a team is open, it leads to a better and more complete understanding of potential problems.
A work team is an interdependent collection of individuals who share responsibility for specific outcomes for their organizations and who seek to combine their efforts to achieve a common goal: the success of the Product Development (Leigh L. Thompson, 2011). Therefore, the communication among the work team should be fluent and active. For this reason if stand-up meetings are carried out every day probably from one day to the next, there will not be an accurate answer to the questions above. However, indecision, misunderstandings, incorrect assumptions, among other things, can happen if the gap between meetings is too big.
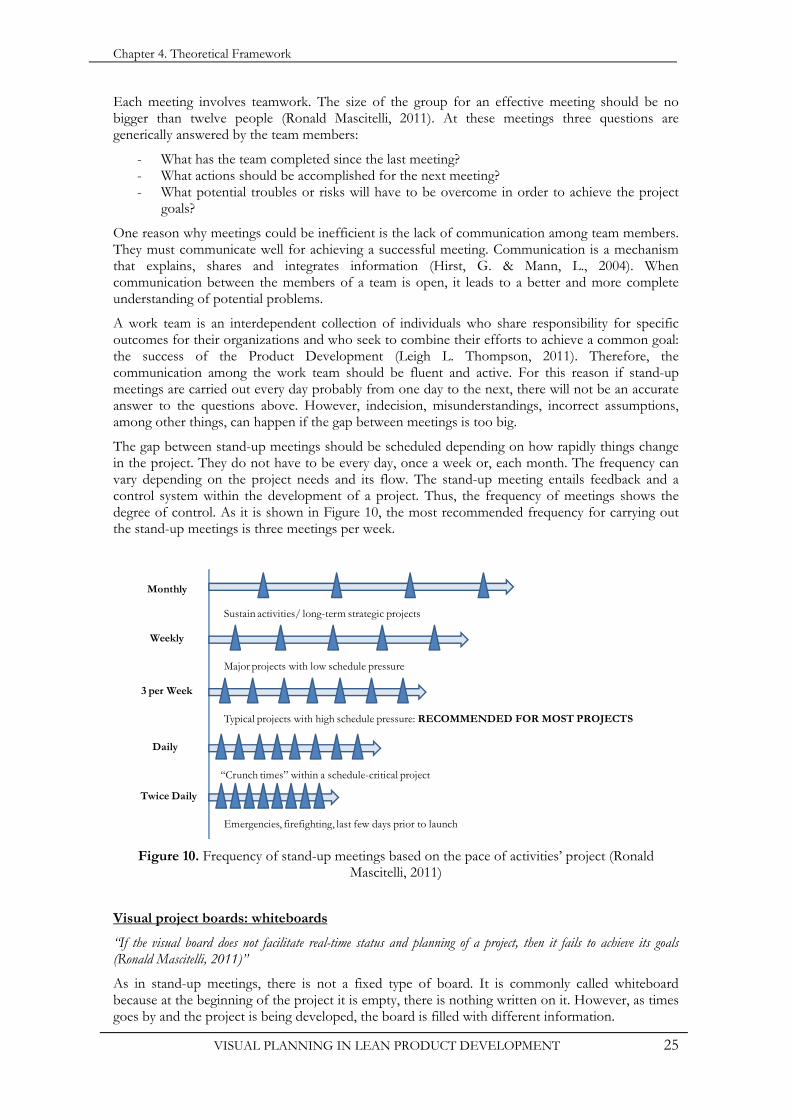
The gap between stand-up meetings should be scheduled depending on how rapidly things change in the project. They do not have to be every day, once a week or, each month. The frequency can vary depending on the project needs and its flow. The stand-up meeting entails feedback and a control system within the development of a project. Thus, the frequency of meetings shows the degree of control. As it is shown in Figure 10, the most recommended frequency for carrying out the stand-up meetings is three meetings per week.
Figure 10. Frequency of stand-up meetings based on the pace of activities’ project (Ronald Mascitelli, 2011)
Visual project boards: whiteboards
“If the visual board does not facilitate real-time status and planning of a project, then it fails to achieve its goals (Ronald Mascitelli, 2011)”
As in stand-up meetings, there is not a fixed type of board. It is commonly called whiteboard because at the beginning of the project it is empty, there is nothing written on it. However, as times goes by and the project is being developed, the board is filled with different information.
Monthly
Weekly
3 per Week
Daily
Twice Daily
Sustain activities/ long-term strategic projects
Major projects with low schedule pressure
Typical projects with high schedule pressure: RECOMMENDED FOR MOST PROJECTS
“Crunch times” within a schedule-critical project
Emergencies, firefighting, last few days prior to launch
Chapter 4. Theoretical Framework
VISUAL PLANNING IN LEAN PRODUCT DEVELOPMENT 26
The main goal of the project board is to show at a glance the progress and status of the project in an intuitive and understandable way to all the staff involved in development of the project.
A Gantt chart is another visual tool for organizing and seeing the progress of a project. Nevertheless, a task-list format on the whiteboard could be more suitable for product development because it is easier to read and it allows for more information to be shown (e.g. status, comments, names, dates, etc.) than a typical bar-chart. Each organization can use the project board in a different way; that is to say, some use colors for defining the task status (red, yellow and green), others use colored sticky notes, or even use Edding colored pens.
The most interesting and powerful element of the visual project board is the “wall-chart”. This tool is designed to engage the team in the real-time planning of near-term activities and encourage ownership and accountability by team members. It is very common to use sticky notes on the wall-chart. Team members write and place the post-its. Each note describes a near-term task or achievement that must be accomplished by a given member during the period of time previously fixed. Sticky notes can be pulled because the task is completed, can be transferred to a later date or can be changed to another person.
Lean aims to reach zero waste and prioritizes each task depending on the value that it promotes to the development project. Thus, using different sticky note colors, this priority issue can be understood by all the personal involved in the project. Another positive aspect of this method is that it is easy to see who to contact if there is a problem, which can be very useful during the development process.
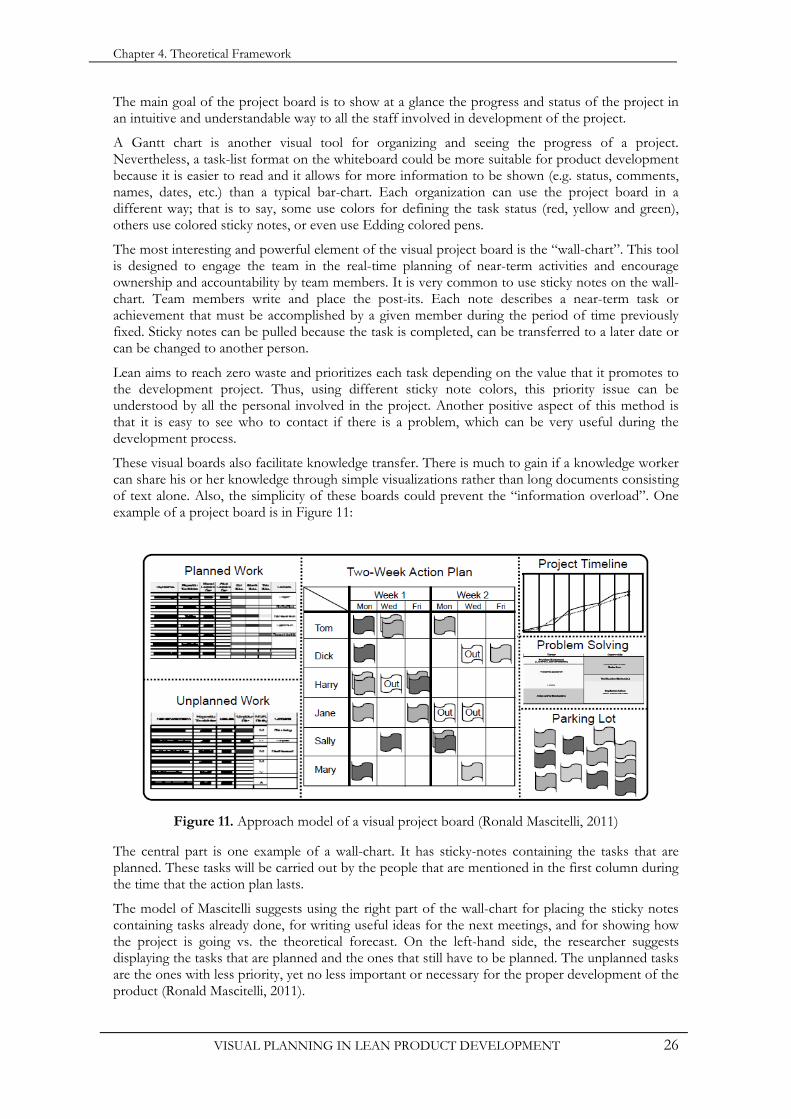
These visual boards also facilitate knowledge transfer. There is much to gain if a knowledge worker can share his or her knowledge through simple visualizations rather than long documents consisting of text alone. Also, the simplicity of these boards could prevent the “information overload”. One example of a project board is in Figure 11:
Figure 11. Approach model of a visual project board (Ronald Mascitelli, 2011)
The central part is one example of a wall-chart. It has sticky-notes containing the tasks that are planned. These tasks will be carried out by the people that are mentioned in the first column during the time that the action plan lasts.
The model of Mascitelli suggests using the right part of the wall-chart for placing the sticky notes containing tasks already done, for writing useful ideas for the next meetings, and for showing how the project is going vs. the theoretical forecast. On the left-hand side, the researcher suggests displaying the tasks that are planned and the ones that still have to be planned. The unplanned tasks are the ones with less priority, yet no less important or necessary for the proper development of the product (Ronald Mascitelli, 2011).
Chapter 4. Theoretical Framework
VISUAL PLANNING IN LEAN PRODUCT DEVELOPMENT 27
It is important to mention that there are no fixed stand-up meetings or visual board formats. Those are in fact the components of the Visual Planning method but they can be used in different manners.
4.2.3 Visual Planning and Scrum
“Visual planning is initially an important part of Scrum, an approach in development projects. In turn, it is built up on Lean and the Agile manifesto” (Ericsson, E. & Lilliesköld, J. & Marcks von Würtemberg, L., 2012).
Along these lines, visual planning is considered as a tool used within the Scrum method. However, for this research Scrum is going to be considered as a specific example of the Visual Planning method. There are several specific examples other than Scrum such as XP, Kanban, A3 from Toyota, etc. Despite the existence all these methods, the one that will be studied in this project because of its relationship with the companies interviewed, is Scrum.
Scrum, which is the term that describes a way to develop products, was initiated in Japan. Originally, Scrum is a strategy used in rugby in which all the team members work together to advance the ball and win the match. In 1987 Ikujiro Nonaka and Hirotaka Takeuchi proposed this term for calling a new type of product development process because of the similarities that existed between the game of rugby and the type of process intended to create they would both be adaptable, quick, self-organizing and with few breaks (Takeuchi H. & Nonaka I., 1986).
Scrum is a process for the management and control of products that tries to eliminate the complexity in these areas in order to focus on business needs. It is simple and easily applicable or combinable with other engineering practices, development methodologies and standards existing in the organization (Henrik Kniberg, 2007).
The Scrum method is based on the Agile philosophy. It focuses mainly on the people and the development team that builds the product. Its goal is that team members work together efficiently, obtaining complex and sophisticated products. Scrum could be understood as a kind of social engineering that seeks to achieve the satisfaction of everyone involved in the development process by promoting cooperation through self-organization. This will favor openness among the team as well as product visibility. Moreover, this methodology claims for no hidden problems, issues or obstacles that could jeopardize the project. Teams are guided by their knowledge and experience, rather than by a formally defined project plan. Detailed planning is done over short periods of time allowing constant periods of time, allowing for constant feedback obtained from simple inspections. Thus, product development occurs incrementally and with an empirical control process, which allows for continuous improvement (Schwaber, K. & Beedle, M., 2006).
Whatever type of methodology is used, it starts off with the same problem: knowing customer needs. Scrum, like all other agile methodologies, advocates the incorporation of the client as a member of the development team.
User stories are the basic elements that Scrum uses to describe the characteristics that the user expects to have, that is, the product that is desired. These user stories are presented from the user’s perspective. Thus, it is not described using technical terminology but they are written using a language understandable by both customers and developers (Cohen, M, 2004). They are constructed focusing on the characteristics of the product:
- 1st: the person who proposes the user story who - 2nd: the characteristics included in the user story are described what - 3rd: the reason why these characteristics are needed is described why
At first, it is not necessary to fully detail all the user stories, but only those with a higher level of priority for the user. This allows the development process to be adapted to subsequent modifications of the user's needs, so that the development process becomes more flexible.
“Whenever there is a product for a customer, there is a value stream. The challenge lies in seeing it (Rother and Shook)” The result of this phase is what is called in Scrum "Product Backlog", which contains a list
Chapt
of all basedprojec
It is euser Devebalan
Onceinto splace comphighePlann
Iteratfifteenmemb
- - -
Here Plannevolu
After anythphaseuser retrosimproScrumthe sp
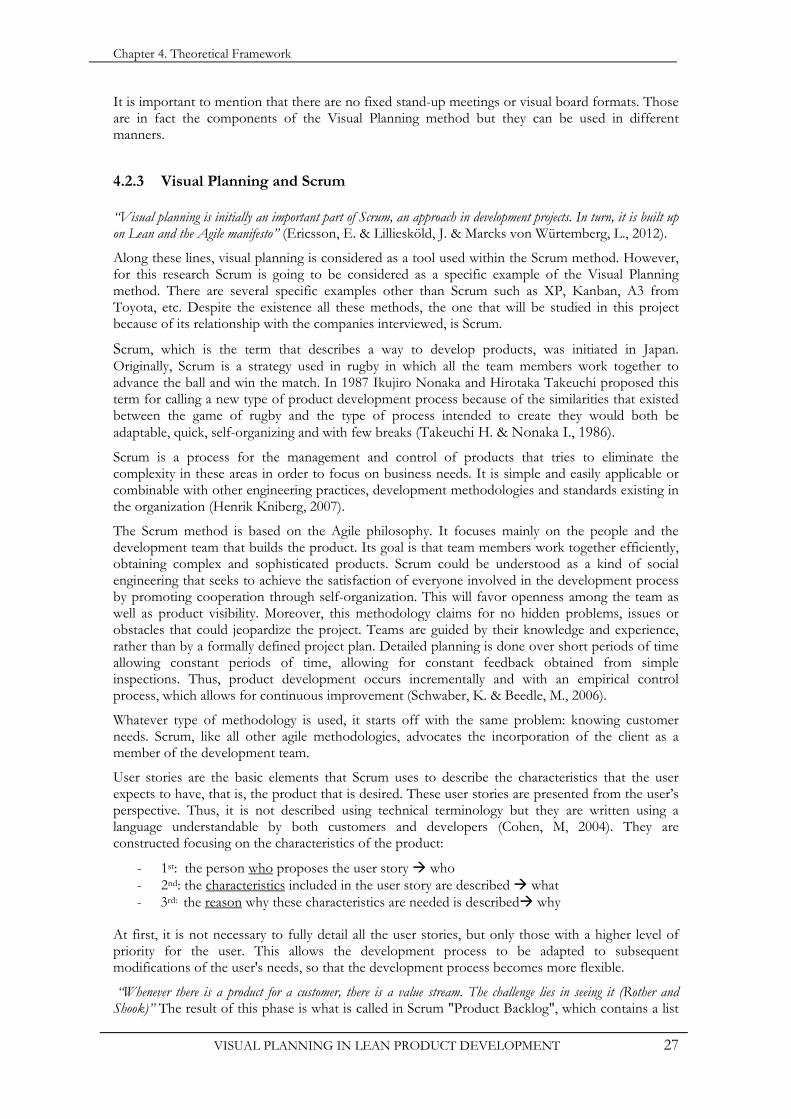
Previois divOne e
ter 4. Theoreti
V
prioritized ud on who, wct planning p
easy to see hostories and t
elopment systnced Product
e the user stoshort phases
with the pupletion. The gest priority foning it is divid
tively, every dn minutes areber is asked t
What taskWhat taskWhat helpprevent th
is the relationing. In Scruution of the ta
the sprint, hing that can e of the projestories to thspective meeoves the devm displays itsprint is a visu
ously in the rvided in sprinexample of a
Figure 12
ical Framework
VISUAL PLA
user stories awhat and whypossible.
ow Scrum is the product tem: establishDevelopmen
ories in the Pr(lasting no m
urpose of plagoal is to moor the client.ded in days o
day throughoe carried out three question
ks have been ks will be donp is necessaryhe normal pr
on with the um meetingsasks are answ
a part of thebe displayed ect takes plache Product Bting is held. T
velopment prs informationual board, like
report, it wasnts and usuall
project boar
2. Approach
k
ANNING IN L
and tasks thaty, makes it e
related with backlog, are hing customent Process Flo
roduct Backlmore than 30anning the t
ove into the “ While the Sr weeks.
ut the sprint,with the dev
ns:
made since tne today? y to do this wogress of the
stand-up mes, different q
wered as well.
e product shshowing the ce in order tBacklog. In This allows frocess. Here n during the me in Visual Pla
mentioned tly the rest of rd designed b
of a project v
LEAN PROD
t must be caeasier to prio
Lean Produrelated to th
er-value to sow, etc.
log are identi0 days) calledtasks and act“Sprint BacklScrum metho
, quick informvelopment tea
the last meeti
work? (i.e., ide project).
eetings whichquestions rel
hould be obte progress achto show the
addition, fofor reflection
lies again thmeetings. Thanning.
that there is nf the space is by a Scrum us
visual board u
DUCT DEVEL
arried out duroritize user s
ct Developmhe process peparate adde
ified and priod “sprints”. Ftivities to belog”and orgaod divides th
mal business am. During t
ng? (i.e., wor
dentify obstac
h is one of thlated to the
tained, somethieved in the advances and
ollowing the n on the expehe analogy whe element us
not a fixed tyused for sho
ser is shown i
using Scrum
LOPMENT
ring the projetories, which
ment. These pprinciples of ed value from
oritized, user For each sprine done, and nize those us
he process in
meetings lastthese short m
k done in on
cles or risks th
he main comproject deve
thing that caSprint. At th
d incorporatecompletion rience gained
with Visual Psed for show
ype of visual bowing tasks din the next fig
(Henrik Knib
ect. This apph makes the
parts of Scrumthe Lean Pr
m waste, crea
stories are dnt, a meetingto fix the dser stories win sprints, in
ting a maximmeetings, each
ne day).
that may imp
mponents of velopment an
an be deliverhis point, a ree if necessaryof each spr
d and continuPlanning, alth
wing the proc
board. In Scrdone and not gure:
berg 2007)
28
proach initial
m, the roduct ating a
divided g takes date of ith the Visual
mum of h team
ede or
Visual nd the
red, or evision y, new rint, a uously hough cess of
rum, it done.
Chapter 4. Theoretical Framework
VISUAL PLANNING IN LEAN PRODUCT DEVELOPMENT 29
To organize this process, Scrum distinguishes different actors with different roles. Generally, it can be differentiated the Product Owner (the only person responsible for the direction and control of the Product Backlog), the Scrum Master (who is the responsible for the success in implementing the Scrum methodology within the development of the project or product, ensuring that the values, practices and rules are followed by the rest of the team), the Scrum Team (people responsible of implementing the functionality or features chosen by the Product Owner) and the last actor which is the Customer or User (the beneficiaries of the product, and those that watch the progress and provide ideas, suggestions or needs whose participation is important and essential in this methodology). (Schwaber, K. & Beedle, M., 2006).
The effectiveness of the methodology is based on a set of core values to be followed by all team members: commitment, dedication, honesty, respect and value. Team members must commit to the goal of every sprint and the overall project. Scrum provides the team with all the authority they need in exchange for their commitment. Each member should concentrate all their efforts and skills on meeting the work they have committed to and carrying it out with dedication. All aspects of the project are visible for the whole team so sincerity is also a core value (Schwaber, K. & Beedle, M., 2006).
4.3 PART III: SOFTWARE-BASED PLANNING METHODS IN LEAN PRODUCT DEVELOPMENT
Stand-up meetings and visual project boards are the main physical components for using Visual Planning in Product Development. Of course, there are software tools that help the project planning. The use digital visualization in Product Development is also very common among companies.
The frequent use of software-based methods for coordinating projects is justified by the large amount of information about activities and deliverables within each development project. However software methods require an understanding of project management tools that a typical team member will likely not possess.
The needs of the customers are continuously changing, and so there are software programs that are designed to meet these changes. A large body of technology has been developed over the past 50 years to make software more reliable and hence, trustworthy (Nerur, S. & Mahapatra, R. & Mangalaraj, G. 2005).
However, the emerging literature on Lean Product Development methods suggests that the information related to the project can be managed through the use of simple and analogue visualization methods.
4.3.1 Software-based planning methods
The software methods are designed, developed and marketed to assist project managers in developing plans, assigning resources to tasks, tracking progress, managing budgets and analyzing workload. One of the most common tasks in project management is planning the work. The complexity of this task depends entirely on the way in which the tool is used. Some of the difficulties in project planning include:
- Events that depend on the creation of other events. - Planning on how to work on the tasks required. - Assigning resources to tasks. - Handling uncertainties, with estimated duration of certain tasks. - Arranging tasks to meet milestones. - Managing multiple projects simultaneously to meet requirements.
All these difficulties can be managed with appropriate software planning methods according to the company requirements.
Chapter 4. Theoretical Framework
VISUAL PLANNING IN LEAN PRODUCT DEVELOPMENT 30
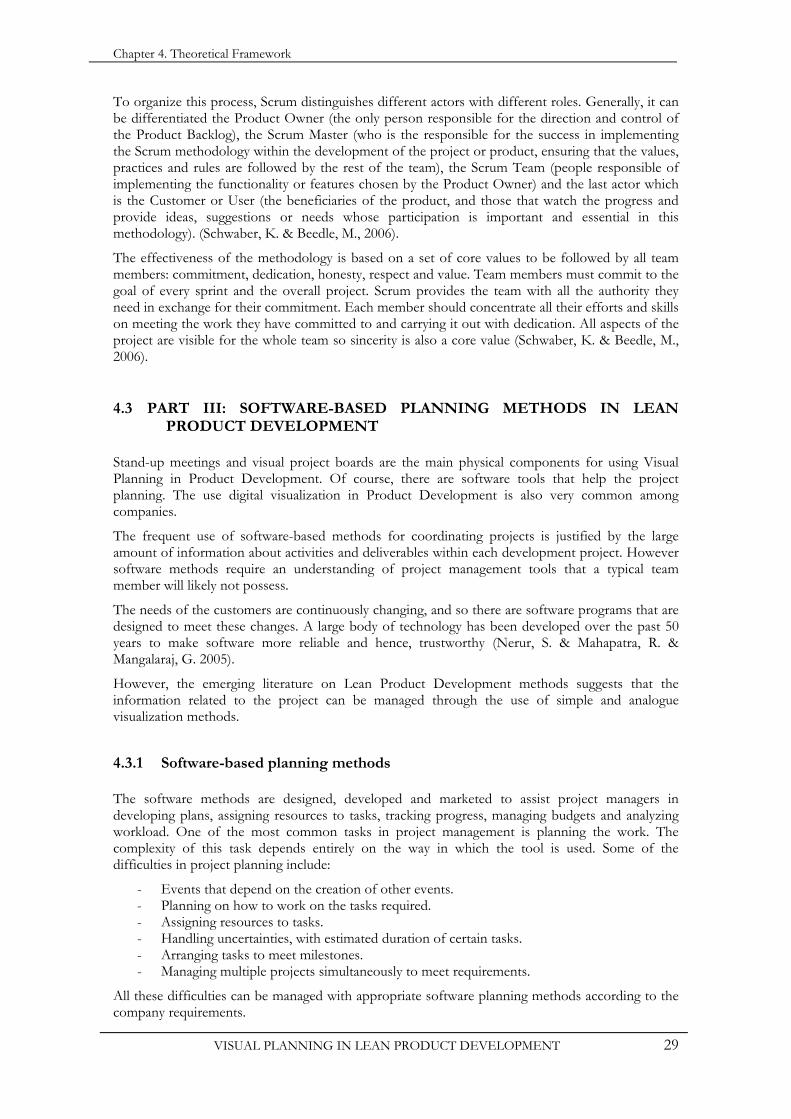
As it was mentioned in the epigraph 4.1.4, there are two types of methods for planning Product Development projects: conventional and agile methods. This classification exists as well in Software Development. Concretely, as shown in Figure 13, the Agile Manifesto says:
Figure 13. Manifesto for agile software development (Kent Beck et al., 2001)
The use of software methods for planning projects is not new. In 1917 Gantt created the “Gantt chart”, which was used for controlling production. Microsoft created in 1984 the software called “Microsoft Project” which assisted in project planning. Nowadays, there are several tools that aid in organizing projects, their tasks, resources, times, etc. such as Hansoft, ScrumWorks or Rational Team Concert (RTC), (see Figures Appendix B4., B7., B8.).
The last three software-based methods mentioned above follow the Agile philosophy. However, before the Agile methods, other kinds of software methods existed, mainly based on the “Waterfall method”, which have now been substituted by the Agile ones (Abran, A. & Moore, J.W., 2004).
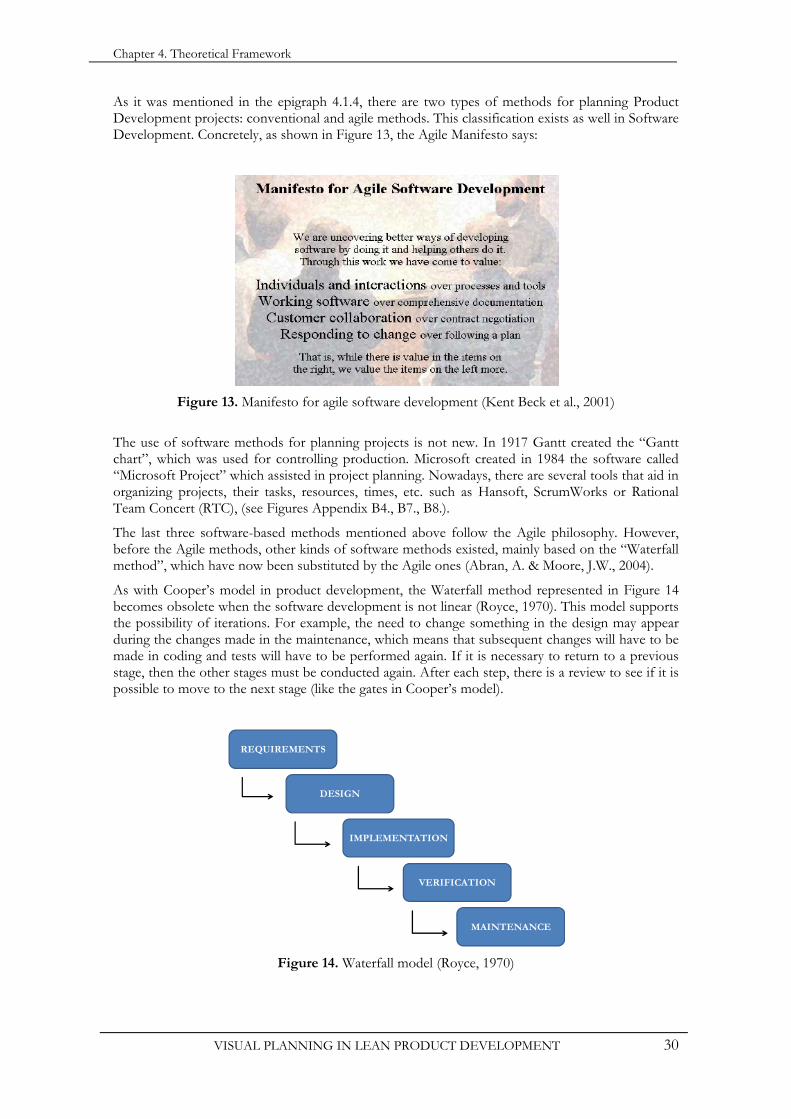
As with Cooper’s model in product development, the Waterfall method represented in Figure 14 becomes obsolete when the software development is not linear (Royce, 1970). This model supports the possibility of iterations. For example, the need to change something in the design may appear during the changes made in the maintenance, which means that subsequent changes will have to be made in coding and tests will have to be performed again. If it is necessary to return to a previous stage, then the other stages must be conducted again. After each step, there is a review to see if it is possible to move to the next stage (like the gates in Cooper’s model).
Figure 14. Waterfall model (Royce, 1970)
REQUIREMENTS
DESIGN
IMPLEMENTATION
VERIFICATION
MAINTENANCE
Chapter 4. Theoretical Framework
VISUAL PLANNING IN LEAN PRODUCT DEVELOPMENT 31
The worst thing about the Waterfall method is the need to have all the customer requirements at the beginning. Typically, the customer does not have well-defined system specifications, and foreseen needs may arise during the development of the software.
If mistakes have been made during one phase, it is difficult to go back. Errors that are committed during the analysis phase will not be discovered until the delivery of the product. All this may imply an important waste of resources. These drawbacks within the Waterfall method created need for look for a more flexible one: the agile software methods.

Chapter 5. Results. Empirical Findings
VISUAL PLANNING IN LEAN PRODUCT DEVELOPMENT 33
5 RESULTS. EMPIRICAL FINDINGS
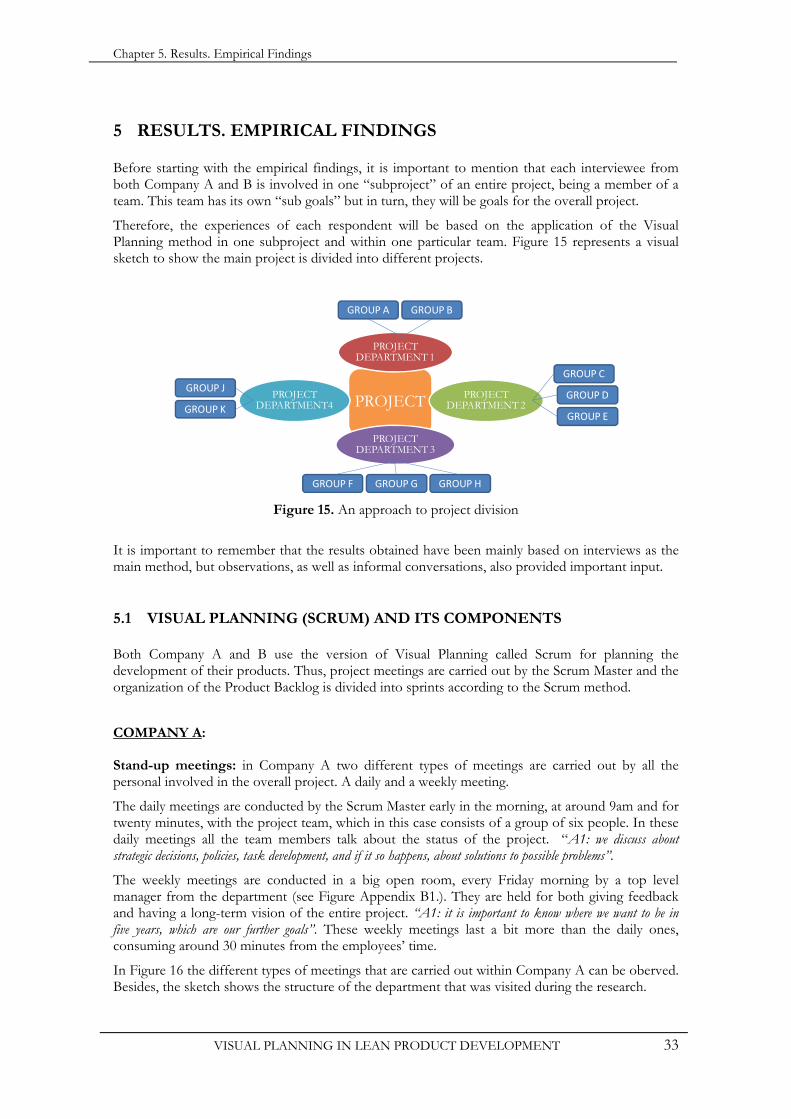
Before starting with the empirical findings, it is important to mention that each interviewee from both Company A and B is involved in one “subproject” of an entire project, being a member of a team. This team has its own “sub goals” but in turn, they will be goals for the overall project.
Therefore, the experiences of each respondent will be based on the application of the Visual Planning method in one subproject and within one particular team. Figure 15 represents a visual sketch to show the main project is divided into different projects.
Figure 15. An approach to project division
It is important to remember that the results obtained have been mainly based on interviews as the main method, but observations, as well as informal conversations, also provided important input.
5.1 VISUAL PLANNING (SCRUM) AND ITS COMPONENTS
Both Company A and B use the version of Visual Planning called Scrum for planning the development of their products. Thus, project meetings are carried out by the Scrum Master and the organization of the Product Backlog is divided into sprints according to the Scrum method.
COMPANY A:
Stand-up meetings: in Company A two different types of meetings are carried out by all the personal involved in the overall project. A daily and a weekly meeting.
The daily meetings are conducted by the Scrum Master early in the morning, at around 9am and for twenty minutes, with the project team, which in this case consists of a group of six people. In these daily meetings all the team members talk about the status of the project. “A1: we discuss about strategic decisions, policies, task development, and if it so happens, about solutions to possible problems”.
The weekly meetings are conducted in a big open room, every Friday morning by a top level manager from the department (see Figure Appendix B1.). They are held for both giving feedback and having a long-term vision of the entire project. “A1: it is important to know where we want to be in five years, which are our further goals”. These weekly meetings last a bit more than the daily ones, consuming around 30 minutes from the employees’ time.
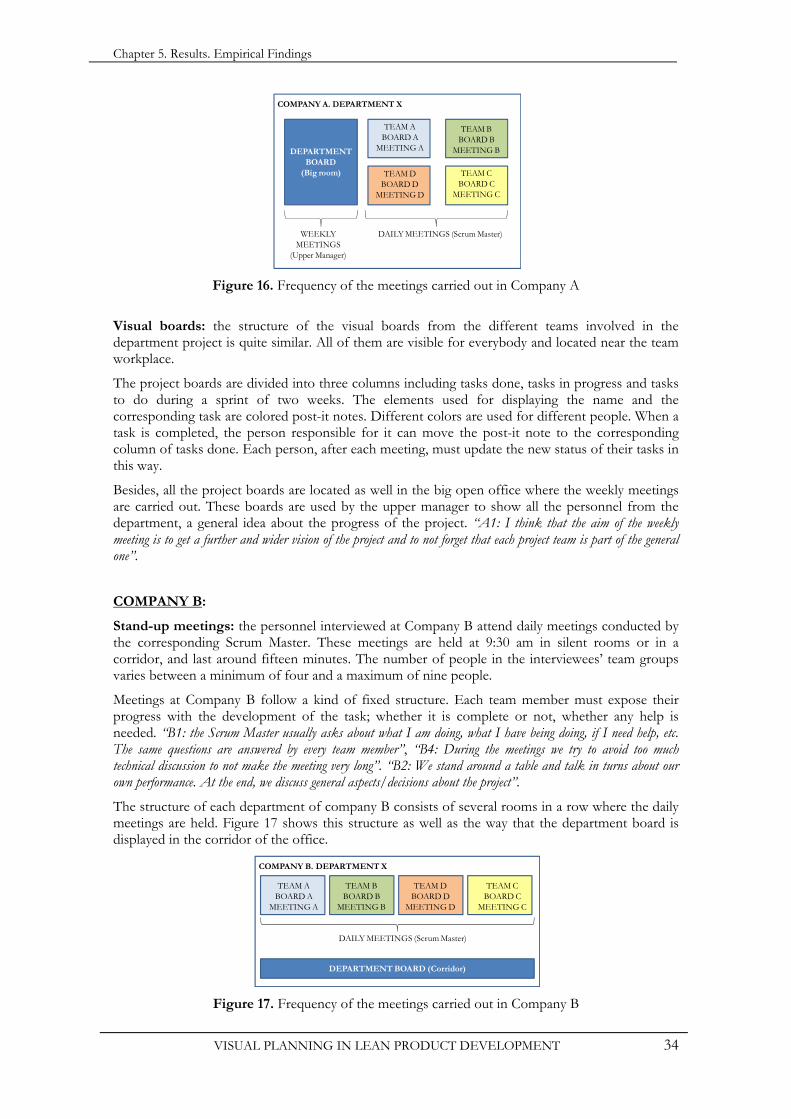
In Figure 16 the different types of meetings that are carried out within Company A can be oberved. Besides, the sketch shows the structure of the department that was visited during the research.
PROJECT
PROJECT DEPARTMENT 1
PROJECT DEPARTMENT 2
PROJECT DEPARTMENT 3
PROJECT DEPARTMENT4
GROUP A GROUP B
GROUP E
GROUP D
GROUP C
GROUP J
GROUP K
GROUP F GROUP G GROUP H
Chapter 5. Results. Empirical Findings
VISUAL PLANNING IN LEAN PRODUCT DEVELOPMENT 34
Figure 16. Frequency of the meetings carried out in Company A
Visual boards: the structure of the visual boards from the different teams involved in the department project is quite similar. All of them are visible for everybody and located near the team workplace.
The project boards are divided into three columns including tasks done, tasks in progress and tasks to do during a sprint of two weeks. The elements used for displaying the name and the corresponding task are colored post-it notes. Different colors are used for different people. When a task is completed, the person responsible for it can move the post-it note to the corresponding column of tasks done. Each person, after each meeting, must update the new status of their tasks in this way.
Besides, all the project boards are located as well in the big open office where the weekly meetings are carried out. These boards are used by the upper manager to show all the personnel from the department, a general idea about the progress of the project. “A1: I think that the aim of the weekly meeting is to get a further and wider vision of the project and to not forget that each project team is part of the general one”.
COMPANY B:
Stand-up meetings: the personnel interviewed at Company B attend daily meetings conducted by the corresponding Scrum Master. These meetings are held at 9:30 am in silent rooms or in a corridor, and last around fifteen minutes. The number of people in the interviewees’ team groups varies between a minimum of four and a maximum of nine people.
Meetings at Company B follow a kind of fixed structure. Each team member must expose their progress with the development of the task; whether it is complete or not, whether any help is needed. “B1: the Scrum Master usually asks about what I am doing, what I have being doing, if I need help, etc. The same questions are answered by every team member”, “B4: During the meetings we try to avoid too much technical discussion to not make the meeting very long”. “B2: We stand around a table and talk in turns about our own performance. At the end, we discuss general aspects/decisions about the project”.
The structure of each department of company B consists of several rooms in a row where the daily meetings are held. Figure 17 shows this structure as well as the way that the department board is displayed in the corridor of the office.
Figure 17. Frequency of the meetings carried out in Company B
COMPANY A. DEPARTMENT X
TEAM ABOARD A
MEETING A
TEAM BBOARD B
MEETING B
TEAM CBOARD C
MEETING C
TEAM DBOARD D
MEETING D
DEPARTMENT BOARD
(Big room)
DAILY MEETINGS (Scrum Master)WEEKLY MEETINGS
(Upper Manager)
COMPANY B. DEPARTMENT X
TEAM ABOARD A
MEETING A
TEAM BBOARD B
MEETING B
TEAM CBOARD C
MEETING C
TEAM DBOARD D
MEETING D
DEPARTMENT BOARD (Corridor)
DAILY MEETINGS (Scrum Master)
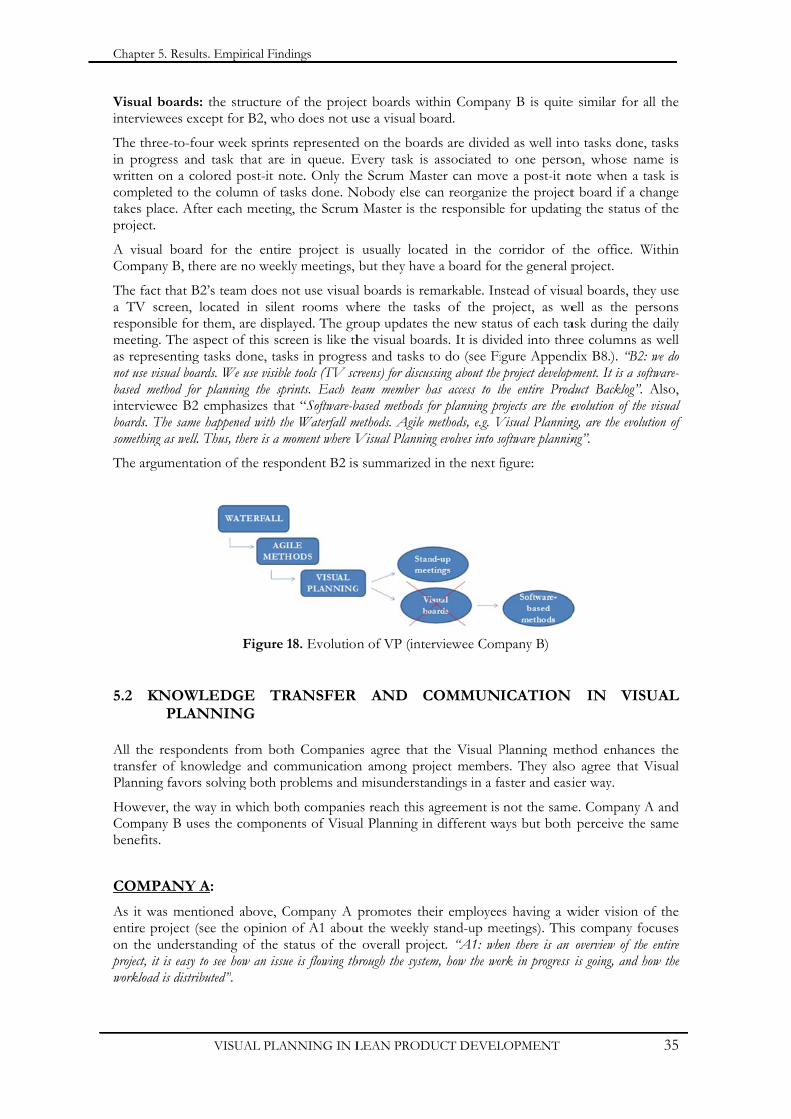
Chapt
Visuainterv
The tin prowrittecomptakes projec
A visComp
The fa TVrespomeetias repnot usbased intervboardssometh
The a
5.2
All thtransfPlann
HoweCompbenef
COM
As it entireon thprojectworklo
ter 5. Results. E
V
al boards: thviewees excep
three-to-four ogress and ten on a colorpleted to the
place. After ct.
sual board fpany B, there
fact that B2’sV screen, loconsible for thing. The aspepresenting tasse visual boards
method for plviewee B2 ems. The same hahing as well. Th
argumentation
KNOWLEPLANN
he respondenfer of knowlning favors so
ever, the waypany B uses fits.
MPANY A:
was mentione project (seehe understandt, it is easy to sload is distribut
Empirical Find
VISUAL PLA
he structure pt for B2, wh
week sprintstask that are red post-it ncolumn of taeach meeting
for the entire are no week
s team does ncated in silenem, are displect of this scrsks done, tass. We use visibllanning the spmphasizes thaappened with thhus, there is a m
n of the resp
Figure
EDGE TRNING
nts from botledge and coolving both p
y in which bothe compone
ned above, Ce the opinionding of the ssee how an issuted”.
dings
ANNING IN L
of the projecho does not u
s representedin queue. E
ote. Only theasks done. Ng, the Scrum
e project is kly meetings,
not use visualnt rooms whlayed. The grreen is like thks in progresle tools (TV scrprints. Each teat “Software-bhe Waterfall mmoment where V
ondent B2 is
18. Evolution
RANSFER
th Companieommunicationproblems and
oth companieents of Visua
Company A pn of A1 aboustatus of the ue is flowing th
LEAN PROD
ct boards wiuse a visual bo
d on the boarEvery task is e Scrum Mas
Nobody else cm Master is th
usually locabut they hav
l boards is rehere the taskroup updates he visual boass and tasks
creens) for discuseam member hbased methods fmethods. Agile mVisual Plannin
s summarized
n of VP (inte
AND C
es agree that n among pro
d misundersta
es reach this aal Planning in
promotes thut the weekly
overall projhrough the syste
DUCT DEVEL
thin Companoard.
rds are divideassociated t
ster can movcan reorganizhe responsible
ated in the cve a board for
emarkable. Inks of the prthe new stat
ards. It is divito do (see Fissing about the has access to tfor planning prmethods, e.g. Vng evolves into s
d in the next f
erviewee Com
COMMUN
the Visual Poject memberandings in a fa
agreement is n different w
eir employeestand-up me
ect. “A1: whem, how the wo
LOPMENT
ny B is quite
ed as well intoto one persove a post-it ne the projecte for updatin
corridor of tr the general p
nstead of visuroject, as weus of each taided into threigure Appendproject developm
the entire Prodrojects are the e
Visual Planningsoftware plannin
figure:
mpany B)
ICATION
Planning metrs. They alsoaster and easi
not the sameays but both
es having a weetings). Thisen there is an
ork in progress
e similar for
to tasks doneon, whose nanote when a t board if a cng the status
the office. Wproject.
ual boards, thell as the peask during theee columns adix B8.). “B2pment. It is a sofduct Backlog”. evolution of the
ng, are the evolung”.
IN VIS
thod enhanco agree that ier way.
e. Company h perceive the
wider vision s company fooverview of this going, and h
35
all the
, tasks ame is task is
change of the
Within
hey use ersons e daily as well
2: we do oftware-
Also, e visual ution of
SUAL
es the Visual
A and e same
of the ocuses e entire how the
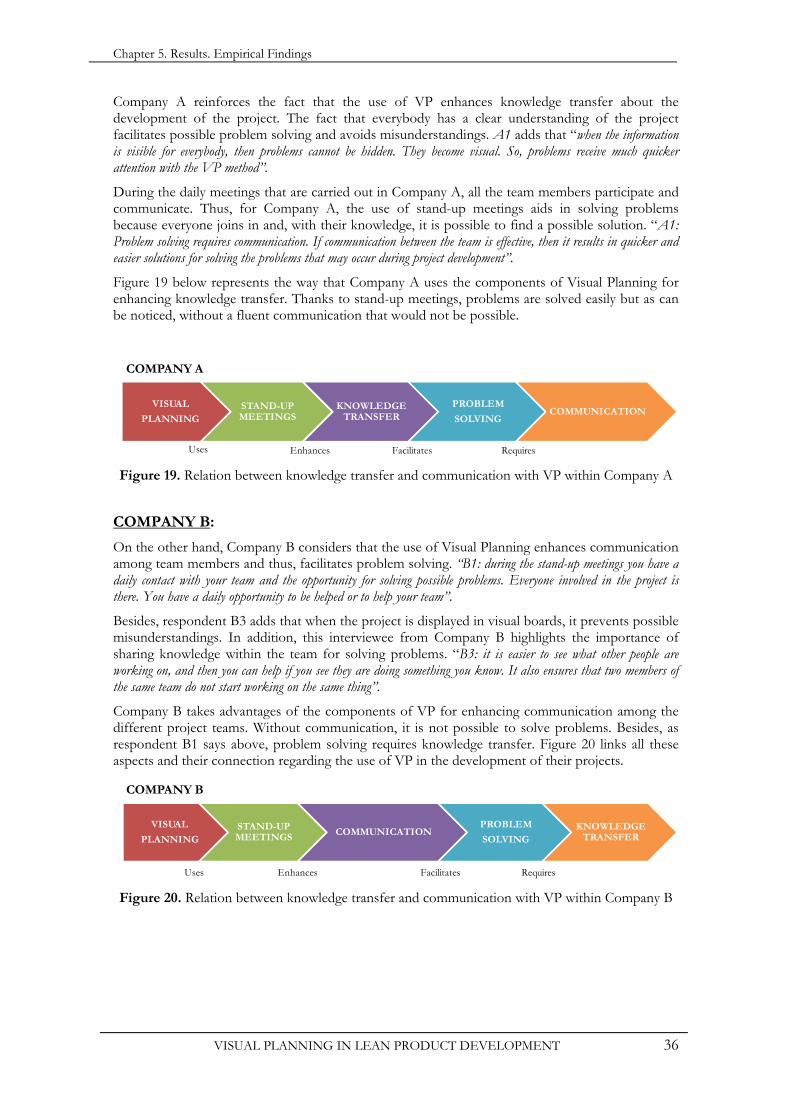
Chapter 5. Results. Empirical Findings
VISUAL PLANNING IN LEAN PRODUCT DEVELOPMENT 36
Company A reinforces the fact that the use of VP enhances knowledge transfer about the development of the project. The fact that everybody has a clear understanding of the project facilitates possible problem solving and avoids misunderstandings. A1 adds that “when the information is visible for everybody, then problems cannot be hidden. They become visual. So, problems receive much quicker attention with the VP method”.
During the daily meetings that are carried out in Company A, all the team members participate and communicate. Thus, for Company A, the use of stand-up meetings aids in solving problems because everyone joins in and, with their knowledge, it is possible to find a possible solution. “A1: Problem solving requires communication. If communication between the team is effective, then it results in quicker and easier solutions for solving the problems that may occur during project development”.
Figure 19 below represents the way that Company A uses the components of Visual Planning for enhancing knowledge transfer. Thanks to stand-up meetings, problems are solved easily but as can be noticed, without a fluent communication that would not be possible.
Figure 19. Relation between knowledge transfer and communication with VP within Company A
COMPANY B:
On the other hand, Company B considers that the use of Visual Planning enhances communication among team members and thus, facilitates problem solving. “B1: during the stand-up meetings you have a daily contact with your team and the opportunity for solving possible problems. Everyone involved in the project is there. You have a daily opportunity to be helped or to help your team”.
Besides, respondent B3 adds that when the project is displayed in visual boards, it prevents possible misunderstandings. In addition, this interviewee from Company B highlights the importance of sharing knowledge within the team for solving problems. “B3: it is easier to see what other people are working on, and then you can help if you see they are doing something you know. It also ensures that two members of the same team do not start working on the same thing”.
Company B takes advantages of the components of VP for enhancing communication among the different project teams. Without communication, it is not possible to solve problems. Besides, as respondent B1 says above, problem solving requires knowledge transfer. Figure 20 links all these aspects and their connection regarding the use of VP in the development of their projects.
Figure 20. Relation between knowledge transfer and communication with VP within Company B
COMPANY A
VISUAL
PLANNINGSTAND-UP MEETINGS
KNOWLEDGE TRANSFER
PROBLEM
SOLVINGCOMMUNICATION
Enhances Facilitates RequiresUses
VISUAL
PLANNINGSTAND-UP MEETINGS COMMUNICATION
PROBLEM
SOLVINGKNOWLEDGE
TRANSFER
COMPANY B
Enhances Facilitates RequiresUses

Chapter 5. Results. Empirical Findings
VISUAL PLANNING IN LEAN PRODUCT DEVELOPMENT 37
5.3 WASTES/SAVES USING VISUAL PLANNING IN LEAN PRODUCT DEVELOPMENT
Both company A and B admit that the use of VP adds efficiency to the overall project development. This efficiency is reached, among other things, by saving resources, either human or material.
COMPANY A:
As it was mentioned before, respondent A1 emphasizes that VP is a visible method and thus problems are exposed to everybody. A1 also agrees that when problems are detected, they receive faster attention than without using the VP method. The readiness of Company A in solving problems as fast as possible saves time to the overall project development.
Moreover, the use of visual boards allows the team to have a clear understanding of the project and thus, saves time since the comprehension of the status of the project is immediate. “A1: VP benefits the overall project development. It saves a lot of time. You have an overview of a large group and you can understand at a glance the state of hundreds of people. Also if you need assistance, you know perfectly who to get in contact with. Thus, you save time in different ways”.
Therefore, for Company A the use of VP has a positive effect when it refers to saving time, due to the project planning being accurate and the resources, well distributed. Thus, for Company A VP also prevents wastes in human resources. Employees are working continuously and they have a clear understanding of their tasks and deadlines, and even know perfectly the tasks that the rest of the team are doing. “A1: VP increases the understanding of the project; you know better the work in progress. Also it prevents gaps and overloads. Everybody is working for the project but doing different tasks. VP ensures that the same task is not being done by two people of the same team”.
Thus, according to the experiences from Company A, the most relevant savings that the use of VP brings to the overall project are in terms of time and “human resources”.
COMPANY B:
B3 says: “the main differences in planning, implementation and evaluation with the use of VP is that planning takes a bit longer, but it is more accurate on the guesses. The implementation runs smoother when you can see what everybody is working on. There are no overlaps. Evaluation of the work done is easier, since we save the note about what has been done and can remember it more easily”.
For this respondent, VP consumes and requires more time (daily time) than other methods. However, despite this time consumption, B3 agrees that even though the time consumed by each individual involved in the project is higher with VP, in the overall development of the project the method saves time.
On the other hand respondent B1 says that “The planning is more accurate and also prevents both contradictions and future problems encountered that might be in too far into a phase, too late to resolve. VP mainly prevents errors and task overload”.
Therefore Company B considers, as does Company A, that the application of the VP method saves time within the project and its use also provides a proper task distribution for achieving the project goal.
The next figure summarizes the savings obtained by the use of VP within both Company A and B. In addition, Figure 21 shows the savings in the areas in which efficiency is improved.
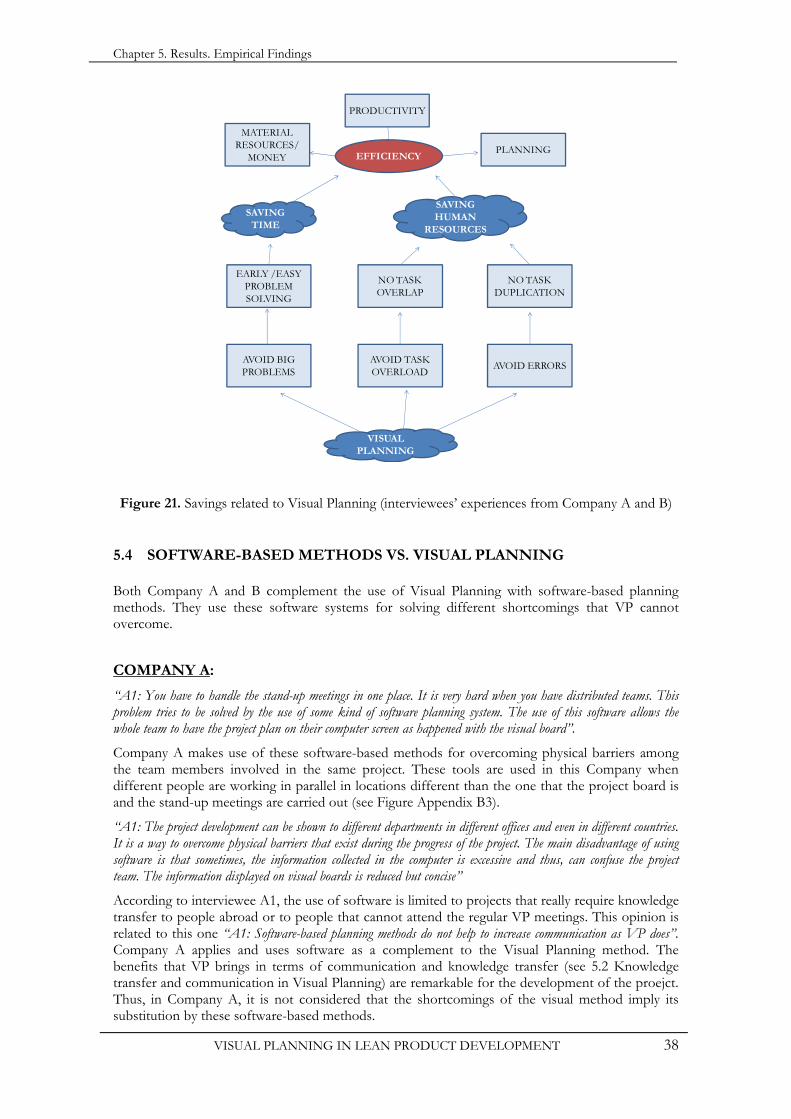
Chapter 5. Results. Empirical Findings
VISUAL PLANNING IN LEAN PRODUCT DEVELOPMENT 38
Figure 21. Savings related to Visual Planning (interviewees’ experiences from Company A and B)
5.4 SOFTWARE-BASED METHODS VS. VISUAL PLANNING
Both Company A and B complement the use of Visual Planning with software-based planning methods. They use these software systems for solving different shortcomings that VP cannot overcome.
COMPANY A:
“A1: You have to handle the stand-up meetings in one place. It is very hard when you have distributed teams. This problem tries to be solved by the use of some kind of software planning system. The use of this software allows the whole team to have the project plan on their computer screen as happened with the visual board”.
Company A makes use of these software-based methods for overcoming physical barriers among the team members involved in the same project. These tools are used in this Company when different people are working in parallel in locations different than the one that the project board is and the stand-up meetings are carried out (see Figure Appendix B3).
“A1: The project development can be shown to different departments in different offices and even in different countries. It is a way to overcome physical barriers that exist during the progress of the project. The main disadvantage of using software is that sometimes, the information collected in the computer is excessive and thus, can confuse the project team. The information displayed on visual boards is reduced but concise”
According to interviewee A1, the use of software is limited to projects that really require knowledge transfer to people abroad or to people that cannot attend the regular VP meetings. This opinion is related to this one “A1: Software-based planning methods do not help to increase communication as VP does”. Company A applies and uses software as a complement to the Visual Planning method. The benefits that VP brings in terms of communication and knowledge transfer (see 5.2 Knowledge transfer and communication in Visual Planning) are remarkable for the development of the proejct. Thus, in Company A, it is not considered that the shortcomings of the visual method imply its substitution by these software-based methods.
SAVING TIME
VISUAL PLANNING
AVOID BIG PROBLEMS
AVOID TASK OVERLOAD
AVOID ERRORS
EARLY /EASY PROBLEM SOLVING
NO TASK OVERLAP
NO TASK DUPLICATION
EFFICIENCY
MATERIAL RESOURCES/
MONEY
PRODUCTIVITY
PLANNING
SAVING HUMAN
RESOURCES
Chapter 5. Results. Empirical Findings
VISUAL PLANNING IN LEAN PRODUCT DEVELOPMENT 39
Therefore, Company A sees necessary the use software for planning projects as necessary but not sufficient. “A1: My personal opinion is that I do not know any other system that would do all the positive things within the project development that Visual Planning does”
COMPANY B:
Three respondents from Company B expose that the method VP is not the most appropriated method for planning projects when it is necessary to overcome physical barriers during the progress of the project.
Reading through the last epigraph from Company A, it is appreciable that Company B shares the same Company A’s thoughts about using software-based methods for removing physical restrictions during project development.
However, Company B adds another drawback in the use of VP for planning projects, the way that the historical data is gathered during the project development with the use of VP is disputable according to two interviewees from Company B: “B1: When post-its are removed from one sprint, where should I check the information if it is necessary during the next sprint?”, “B4: What happens if a post-it which contains important information goes missing?”
When a task is completed, its corresponding post-it note is removed from the column of the visual board called “tasks done”. Company B considers this method limited, not safe and unorthodox. Hence, within this Company, a software system is used for gathering all the project information and thus display and save historical data from previous sprints. Therefore, Company B considers that the visual method requires the use of software in order to overcome physical barriers and gather historical data.
As happened in Company A, three interviewees from Company B considered the use of software as a help to the Visual Planning method. They consider that it is perfect to mix both methods. “B1: The main advantage of using software is, for example, that everybody can check the project schedule in the computer and they do not have to go to the corridor. Or people that are not in the office can access instantaneously the project information. Besides, in the computer, the post-its do not fail and the information will not disappear. The main disadvantage is that face-to-face communication is not possible in front of a computer. I mean, if you are planning the project using only software, you miss the benefits of the stand-up meetings in communication and in early problem solving” (see Figure Appendix B.7, B.8).
To conclude with, software tools, respondent B1 and B4 agree that it does not require much effort to learn how to use these tools. Nobody within Company B felt rejection when using a new tool. “B1: the software that we are implementing in our project development is quite easy to use and to learn how to apply it”, “B2: I do not know any other system for planning our tasks easier to use and that displays the project development so clearly”.


Chapter 6. Analysis
VISUAL PLANNING IN LEAN PRODUCT DEVELOPMENT 41
6 ANALYSIS
“The results are analyzed based on the theoretical part of the study”, “It should be clear to the reader what is the contribution of the author regarding the analysis and interpretation of information” (Eileen Figueredo, Zulívis Vívenes 2011).
The same structure as in Chapter 5 is followed in the analysis part. It consists in breaking down the main problem into the different elements that compose it, with the purpose of studying them in a deeper way. These elements will be compared and related to the theoretical framework as well as to previous research in the field of interest of this Master Thesis.
The analysis will compare Company A’s and Company B’s experiences regarding the different aspects of theVisual Planning method. Both companies will be analyzed together, not separately.
6.1 VISUAL PLANNING (SCRUM) AND ITS COMPONENTS
As explained in the theoretical chapter, there are several methods based on Visual Planning. Both Company A and B use the version of Visual Planning called Scrum. However, the Scrum Master in charge of the project can handle the baton in the way that they consider most efficient for the project, but always following the rules and procedures of the method (see last paragraph in 4.2.2). Thus, the product backlog, sprint backlog, stand-up meetings, visual boards, etc. exist within all the projects developed in Company A and Company B, but have different designs.
Stand-up meetings: The theoretical framework states that the key to a successful stand-up meeting is brevity, an appropriate size of the team and the time of the day that it takes place (Ronald Mascitelli, 2011). Company A and Company B follow these guidelines for accomplishing a successful meeting. In both companies the meetings are brief (around twenty minutes) and the size of the team is within average (between four and nine people). Besides, the stand-up meetings are performed early in the morning (at around 9:30 am). Therefore, these three aspects are consistent with the theory of previous studies.
Previous studies assert that stand-up meetings ensure feedback and control for the project. For typical projects with high schedule pressure, the most widely recommended number of meetings per week is three (see Figure 9). Neither Company A nor Company B follows this recommendation. Company A celebrates daily and weekly stand-up meetings while Company B carries them out every day. On the other hand, Company B performs the suggested structured meetings where questions related to the status of the project are answered by all the team members. In contrast, Company A does not follow any structured meeting sequence but all the project members somehow participate in it.
Visual boards: the boards design at Company A and B are very similar to the one suggested in Figure 13. The number of weeks of each sprint agree with the one suggested in the Scrum method (around three weeks) and the elements used for displaying task information are sticky notes. In addition, both companies locate their boards in a visible area as previous research studies recommended.
However there are two differences within Company B in comparison to the theoretical framework. First of all, only the Scrum Master can move, remove or change a post-it from the board if necessary. In Company A the person responsible for the task is free to move it whenever it is required. This limitation in moving the data of the visual board is not highlighted as an important aspect to take into account in previous studies. Second, one department of Company B does not use visual boards. This department skips the use of one of the components of the Visual Planning
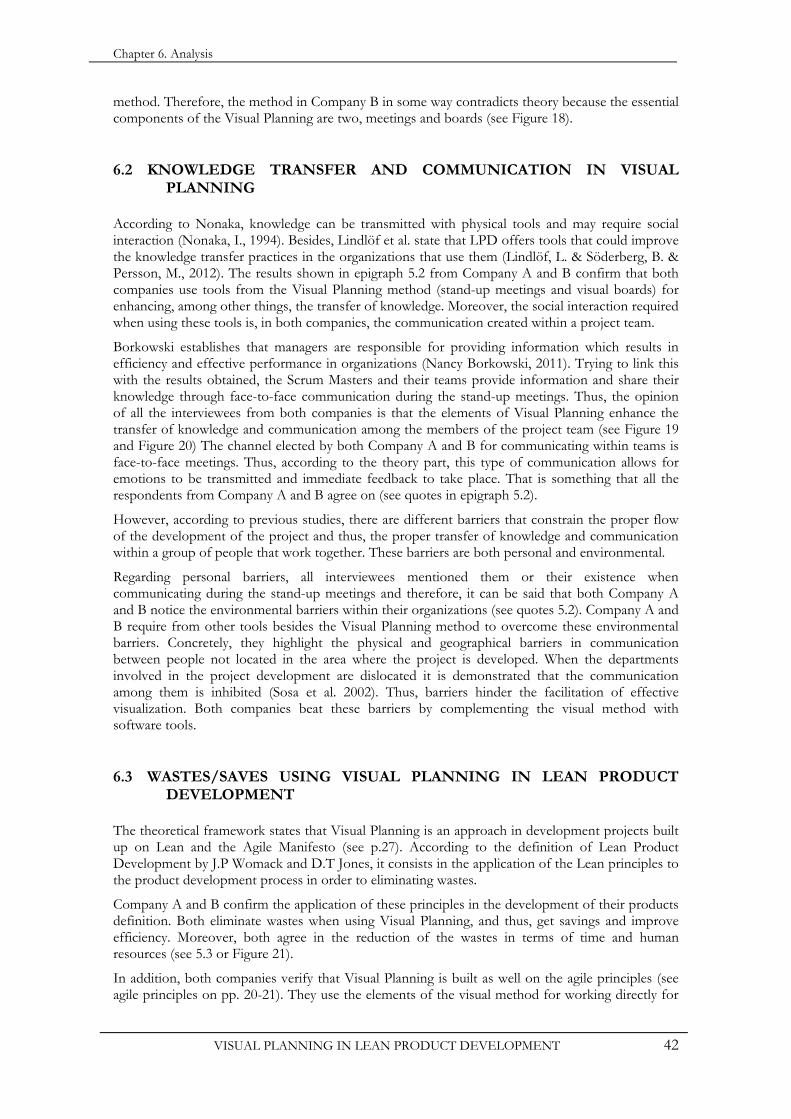
Chapter 6. Analysis
VISUAL PLANNING IN LEAN PRODUCT DEVELOPMENT 42
method. Therefore, the method in Company B in some way contradicts theory because the essential components of the Visual Planning are two, meetings and boards (see Figure 18).
6.2 KNOWLEDGE TRANSFER AND COMMUNICATION IN VISUAL PLANNING
According to Nonaka, knowledge can be transmitted with physical tools and may require social interaction (Nonaka, I., 1994). Besides, Lindlöf et al. state that LPD offers tools that could improve the knowledge transfer practices in the organizations that use them (Lindlöf, L. & Söderberg, B. & Persson, M., 2012). The results shown in epigraph 5.2 from Company A and B confirm that both companies use tools from the Visual Planning method (stand-up meetings and visual boards) for enhancing, among other things, the transfer of knowledge. Moreover, the social interaction required when using these tools is, in both companies, the communication created within a project team.
Borkowski establishes that managers are responsible for providing information which results in efficiency and effective performance in organizations (Nancy Borkowski, 2011). Trying to link this with the results obtained, the Scrum Masters and their teams provide information and share their knowledge through face-to-face communication during the stand-up meetings. Thus, the opinion of all the interviewees from both companies is that the elements of Visual Planning enhance the transfer of knowledge and communication among the members of the project team (see Figure 19 and Figure 20) The channel elected by both Company A and B for communicating within teams is face-to-face meetings. Thus, according to the theory part, this type of communication allows for emotions to be transmitted and immediate feedback to take place. That is something that all the respondents from Company A and B agree on (see quotes in epigraph 5.2).
However, according to previous studies, there are different barriers that constrain the proper flow of the development of the project and thus, the proper transfer of knowledge and communication within a group of people that work together. These barriers are both personal and environmental.
Regarding personal barriers, all interviewees mentioned them or their existence when communicating during the stand-up meetings and therefore, it can be said that both Company A and B notice the environmental barriers within their organizations (see quotes 5.2). Company A and B require from other tools besides the Visual Planning method to overcome these environmental barriers. Concretely, they highlight the physical and geographical barriers in communication between people not located in the area where the project is developed. When the departments involved in the project development are dislocated it is demonstrated that the communication among them is inhibited (Sosa et al. 2002). Thus, barriers hinder the facilitation of effective visualization. Both companies beat these barriers by complementing the visual method with software tools.
6.3 WASTES/SAVES USING VISUAL PLANNING IN LEAN PRODUCT DEVELOPMENT
The theoretical framework states that Visual Planning is an approach in development projects built up on Lean and the Agile Manifesto (see p.27). According to the definition of Lean Product Development by J.P Womack and D.T Jones, it consists in the application of the Lean principles to the product development process in order to eliminating wastes.
Company A and B confirm the application of these principles in the development of their products definition. Both eliminate wastes when using Visual Planning, and thus, get savings and improve efficiency. Moreover, both agree in the reduction of the wastes in terms of time and human resources (see 5.3 or Figure 21).
In addition, both companies verify that Visual Planning is built as well on the agile principles (see agile principles on pp. 20-21). They use the elements of the visual method for working directly for
Chapter 6. Analysis
VISUAL PLANNING IN LEAN PRODUCT DEVELOPMENT 43
the client (Product Backlog), for having direct communication (stand-up meetings) and for simplifying the process (visual boards).
6.4 SOFTWARE-BASED METHODS VS. VISUAL PLANNING
Company A and B use software planning methods during the development of their projects. Both agree that when planning projects, some difficulties may appear. Concretely, they find obstacles in the use of the VP method when managing multiple projects with distributed teams. In this respect, both companies confirm the advantage of using software-based methods for planning their projects.
In addition, one interviewee from Company B (B2) reinforces the theory exposed on page 25 about the evolution of the planning methods for the development of products, but contradicts the utility of the visual boards exposed in the literature review (Ronald Mascitelli, 2011).
However, Company A and B, despite the opinion of B2, use software not as the sole method of planning, but as a complement to the main planning method in the development of their products, which is Visual Planning. Software methods require an understanding of project management tools and thus require training time. Every respondent’s opinion confirms this affirmation stated in the theoretical framework. Interviewees from both companies considered that the use of software methods do not cost a lot of time, being both easy and user friendly (see p.39).

Chapter 7. Discussion
VISUAL PLANNING IN LEAN PRODUCT DEVELOPMENT 45
7 DISCUSSION
The discussion is based on the analysis. It involves the personal interpretation of the results found during data collection and their analysis. The purpose of the discussion is to show the relationships between the events expected and those observed.
Once the results of the interviews have been analyzed and compared to the theoretical framework, there are several aspects that motivate further thinking and discussion.
7.1 VISUAL PLANNING (SCRUM) AND ITS COMPONENTS
Despite the simplicity of the method and its components, it is surprising that there is neither consensus nor a set pattern when applying and using Visual Planning. This makes sense since organizations inside the sector of Product Development aim at different goals, and, consequently, they try to obtain benefits by using the method in the most convenient way.
The components of Visual Planning are adapted to the project requirements not vice versa. The definition of method is "an established, habitual, logical, or prescribed practice or systematic process of achieving certain ends with accuracy and efficiency, usually in an ordered sequence of fixed steps”(Business Dictionary). Thus, it does not seem logical that the conditions of the project should fix the way to use the method. However, on the other hand, Visual Planning is based on the Lean and agile philosophy. For example, the 11th principle of the Lean Product Development System says “adapt technology to fit your people and process”, also the Agile Manifesto states “planning on how to work on the tasks required”. Therefore, these arguments favor the understanding of the flexibility and adaptability of the visual method despite what establishes the above definition.
The profits obtained by the companies of the comparative study are the same despite the differences in the use of VP. This is not unexpected since within the Product Development area, all organizations try to plan their projects being accurate in time, budget and resources. “B4: Time is gold and the competition is fierce”. What gives competitive advantage to companies that develop new products is getting quality products with competitive prices and launching them before the competitors with the purpose of gaining market share (William J. Stevenson, 2012). For this reason, it is entirely coherent that companies obtain the same profits when using Visual Planning.
Concerning the hurdles of the method, it seems important to mention the time-space limitations that slow down project development. It sounds reasonable to recommend Visual Planning within short projects and among teams located in the same office. Visual boards only show a short term status of the project and the long term vision can be lost. Besides, the stand-up meetings are carried out in one particular place and the information emerges and stays there. If a project member is not in the room it is necessary to use extra methods for transferring what has happened there.
According to the respondents’ opinions during the research, the benefits of Visual Planning are observable and significant. However, are they observable and significant as well when the method is applied to other projects beyond Product Development? The answer is immediate. One method could be optimal for some projects but not for all kinds of projects. For example, it is demonstrated that quantitative research is optimal for some type of scientific projects. However, for this Master Thesis, which mainly consists of a comparative study, the use of quantitative methods is not suitable despite their benefits when applied to other projects. Therefore, it would be interesting to know the advantages and benefits when Visual Planning is applied outside Product Development projects, as this might improve on the visual method as it is used today.
Chapter 7. Discussion
VISUAL PLANNING IN LEAN PRODUCT DEVELOPMENT 46
7.2 KNOWLEDGE TRANSFER AND COMMUNICATION IN VISUAL PLANNING
The components of the Visual Planning method, stand-up meetings and whiteboards, are mainly used for enhancing the communication and the knowledge transfer within the project teams. Communication is one of the most important issues inside organizations and Visual Planning favors its fluency and directness. Face-to-face meetings every morning in front of the project board are a good way to ensure that the whole team is aware of what is going on as well as, which are the responsibilities and the tasks that must be accomplished by each member. In addition, the daily meetings are a good opportunity to communicate, to be open if some help is required, or if it is necessary to solve some problems.
When the entire team is attending a meeting, each person’s knowledge can be used for both solving possible problems and maintaining a smoothly running project development process. The opinion of the team is important for the managers and they consider them as an important part of the success of the project. The combination of communication and information sharing that takes place during the meetings is the key to this success. For example, it is very common than when somebody is stuck on something and is not able to see where the problem lies, another person who may come from a different background, may see or identify the problem immediately. That is one of the most positive things of the method everything becomes visible.
7.3 WASTES/SAVES USING VISUAL PLANNING IN LEAN PRODUCT DEVELOPMENT
One of the most common problems during the development of projects is the lack of information about them within work teams. This problem can in turn create bigger ones, such as misunderstandings, task overlapping, work duplicity and harder problem solving.
Managers want their employees to have a clear understanding of the project status from the beginning of each working day. There is no better way to start the day than having a very clear idea of what you have to do. However, it is also important to know what the others are doing. Carrying out daily meetings is a good way to ensure that the team is working efficiently. Therefore, if everybody is aware of how the project is flowing and everybody is working with, it seems logical to obtain some saves related to human resources. The work load is also well distributed, because two people are not going to work on the same and the tasks will not overlap. In addition, it is not surprising that time saves are obtained when applying visual planning because problems are solved the moment that they are identified which saves time within the overall project development.
These saves in terms of time and human resources are strongly associated with the fluent communication and the knowledge transfer that take place during the stand-up meetings. Without good communication, problems may not be identified. In the same way, without proper information transfer, the project status could be misunderstood and thus, derive in failure.
7.4 SOFTWARE-BASED METHODS VS. VISUAL PLANNING
The opinions, impressions and feelings of two different people on the same topic may be completely different. Therefore, it seems logical that there are partisans and nonpartisans of the Visual Planning method. “A1: My personal opinion is that I do not know any other system that would do all the positive things within project development that Visual Planning does”. “B2: Visual Planning is archaic; it is the moment for Agile Software”.
Regarding the opinion of interviewee B2 it is interesting to consider that the fact that a method produces benefits within project development, its simplicity or antiquity may not be relevant as long as it gives quantifiable profits. The truth is that those factors are not essential. The tendency nowadays is to move towards more complex computer-based systems. Visual Planning is a simple
Chapter 7. Discussion
VISUAL PLANNING IN LEAN PRODUCT DEVELOPMENT 47
method with modest components. This simplicity is the key to its success. It is clear that the method could be more sophisticated. However, the important outputs that the method brings are not related to its complexity but its simplicity. When something works, there is no need to change it into something more modern. The basics, if beneficial, are sufficient. For example, there is no need to use a smart phone for making a call because with a simple mobile phone it is possible to do it and the final goal, which is to communicate with another person, is reached as well.
Currently, there is a tendency towards world globalization (Kremer, M. & Maskin, E., n.d.). So, perhaps this argument can lead to a standardization in the way of planning and organizing future projects. In fact, this is already happening with the use of IT tools as a complement to Visual Planning method for overcoming physical and information barriers among different members of the same project. Maybe the evolution of Visual Planning will arrive and derive into an exclusive use of software-base methods, or maybe, as the majority of the interviewees agree, it is the time for Visual Planning.


Chapter 8. Conclusions and Further Research
VISUAL PLANNING IN LEAN PRODUCT DEVELOPMENT 49
8 CONCLUSIONS AND FURTHER RESEARCH
This section manifests the most important findings in the research. It also represents the personal contributions and advice that can be extracted from the study.
8.1 FINAL CONCLUSIONS
The main objective of this research was to study the Visual Planning method and investigate how it is applied and used in Lean Product Development projects. Besides, this Master Thesis aims to provide a broader understanding of what Visual Planning is and how it can be combined with other methods to enhance efficiency when organizing product development projects. The conclusions extracted from the investigation can be divided, according to the results obtained its analysis and discussion, into two main sections: positive and negative aspects of Visual Planning.
The Visual Planning method and its components are simple, flexible and adjustable to the needs of each project. In addition, there is no pattern to follow when it is applied and thus, this freedom gives accuracy in fulfilling the project's requirements.
The comparative study states that the use of Visual Planning brings very similar benefits to the organizations that are using it despite the different character of their projects and their corresponding goals. The most highlighted benefits within companies using Visual Planning are an easier and faster way to solve problems, which includes the enhancement of both fluent communication and knowledge transfer. Visual Planning also provides a more accurate planning schedule, which derives in reducing errors and task overlapping.
In addition, the Lean nature of the method brings savings to the overall development project. The most significant are project time reductions and an accurate administration of its human resources.
Despite all these benefits and advantages, Visual Planning has some shortcomings. This method has some limitations which become significant barriers to the project progress. Visual Planning is not able to overcome physical barriers when it is applied in distributed teams. Besides, the way of collecting historical data is neither safe nor proper. Therefore companies that use the visual method require supporting tools, such as software-based methods, for overcoming of these drawbacks.
In conclusions, Visual Planning presents more positive than negative aspects. Besides, its lacks can be regarded as an opportunity to improve the method while maintaining its benefits when complementing it with other tools.
Nowadays the tendency in the world of business is to move towards more complex, computer-based systems. By virtue of this fact, the minimalism of the method components and the physical character of the method present a challenge. Nevertheless, it is important to bear in mind that simplicity should not be underestimated when it has been proved that it is the key to the success of Visual Planning.
8.2 SUGGESTIONS FOR FURTHER RESEARCH
Some possible improvements regarding the methodology of this Thesis are related to the interviews with the people from each company. Some of the answers given during these interviews were crucial and changed the course and objectives of the Master Thesis. As a result, it became more difficult to investigate and fathom the new thoughts and development of the study, even more so during the last phases of the research. Therefore, it would be advisable to make the interviews closer to the beginning of the research process.
This research of the Visual Planning method has focused on the product development area. However, for further research it would be interesting to extend the field of study to other kinds of
Chapter 8. Conclusions and Further Research
VISUAL PLANNING IN LEAN PRODUCT DEVELOPMENT 50
environments with the aim of obtaining and gathering more data as well as comparing different sectors.
The limitations of the project that were mentioned at the beginning of this research, it could also be interesting for future studies to investigate in more depth the experiences of people that only use software-based methods for planning their projects. In this study it happened to be the case in only one department but they were very satisfied with the use of these tools instead of the visual boards.
Chapter 9. References
VISUAL PLANNING IN LEAN PRODUCT DEVELOPMENT 51
9 REFERENCES
Abran, A. & Moore, J.W., 2004. Guide to the Software Engineering Body of Knowledge. IEEE, SWEBOK.
Alan Bryman, 2004. Social Research Methods. Second Edition, p.266-280.
Argote, L. & Ingram, P., 2000. Knowledge transfer: a basis for competitive advantage in firms. Organizational Behavior and Human Decision Processes. Volume 82. Issue 1, pp. 150-169.
Boehm, B., 2006. A View of 20th and 21st Century Software Engineering. University of Southern California University Park Campus, Los Angeles.
Clark, K.B. & Fujimoto, T., 1991. Product Development Performance. Harvard Business School Press.
Cohen, M, 2004. User Stories Applied for Agile Software Development. Addison-Wesley Professional. 1st edition.
Cooper, R., 1993. Winning at new products: Accelerating the process from idea to launch. Perseus books.
Daft, R.L. & Lengel, R.H, 1984. A new approach to managerial behavior and organizational design. Office of Naval Research Technical Report Series.
David Hogg, 2008. High Performance Solutions. http://www.leanppd.org.
Eileen Figueredo & Zulívis Vívenes, 2011. Análisis, conclusiones y recomendaciones. Universidad Gran Mariscal de Ayacucho.
Elizabeth A. Smith, 2001. The role of tacit and explicit knowledge in the workplace. Journal of Knowledge Management Volume 5. Number 4. 2001, pp. 311-321. MCB University Press.
Ericsson, E. & Lilliesköld, J. & Marcks von Würtemberg, L., 2012. Visual Planning Applied in a Research Environment.
Ghauri, P. & Gronhaug, K., 2010. Research Methods in Business Studies. A Practical Guide Financial Times/ Prentice Hall. 3rd ed., Pearson Education.
Graham M. Winch, 1995. Managing Production: Engineering Change and Stability, Oxford University Press.
Greif, M., 1991. The Visual Factory: Building Participation through Shared Information. Productivity Press. 1st edition.
Guba, E.G & Lincoln, Y.S, 1989. Fourth generation evaluation. SAGE Publications.
Henrik Kniberg, 2007. Scrum and Xp from the Trenches: How we do Scrum. INFO Q. Enterprise Software Development Series.
Hirst, G. & Mann, L., 2004. A model of R&D leadership and team communicatio: the relationship with project performance. R&D Management, pp.147-160.
Jaafari, A., 2003. Project management in the age of complexity and change.
Karlsson, C. & Ahlstrom, P., 1996. The difficult path to Lean Product Development. Product Innovation Management, Vol 13, Number 4, pp.283-95.

Chapter 9. References
VISUAL PLANNING IN LEAN PRODUCT DEVELOPMENT 52
Kent Beck et al., 2001. Manifesto for Agile Software Development.
Kosonen, K. & Buhanist, P., 1995. Customer focused Lean Production Development. International Journal of Production Economics, Vol.41, pp.211-16.
Kremer, M. & Maskin, E., Globalization and Inequality. Department of Economics, Harvard University; The Brookings Institution.
Krishnan, V. & Ulrich, K.T., 2001. Product Development Decisions: A Review of the Literature. Management Science. Vol 47, Number 1, pp.1-21.
Leigh L. Thompson, 2011. Making the Team. A guide for Managers Prentice Hall. 2nd ed.
Leonard Bickman, Debra J. Rog, 1998. Handbook of applied social research methods. Sage Publications.
Liker, J.K. & Morgan, J.M., 2006. The Toyota Product Development System: Integrating People, Process and Technology. Productivity Press.
Lindlöf, L. & Söderberg, B., 2011. Pros and cons of Lean Visual Planning: experiences from four product development organizations.
Lindlöf, L. & Söderberg, B. & Persson, M., 2012. Practices supporting knowledge transfer. An analysis of lean product development.
Lindvall, et al., 2002. Empirical Findings in Agile Methods. Center for Experimental Software Engineering.
Lynda S. Robson & Harry S. Shannon & Linda M. Goldenhar & Andrew R. Hale, 2011. Guide to Evaluating the Effectiveness of Strategies for Preventing Work Injuries: How to show whether a safety intervention really works. http://ssmon.chb.kth.se/safebk/.
Martin J. Eppler & Rema A. Burkhard, 2007. Visual Representations in Knowledge Management: framework and cases. Journal of Knowledge Management. Vol. 11. Issue 4, pp. 112 - 122.
Maxwell, J.A., 2005. Qualitative Research Design: An Interactive Approach. Sage Publications. 2nd edition.
Mays, N. & Pope, C., 1995. Rigor and qualitative research. British Medical Journal 311, pp.109-12.
Nahid Golafshani, 2003. Understanding Reliability and Validity in Qualitative Research. The Qualitative Report, Volume 8, Number 4.
Nancy Borkowski, 2011. Organizational behavior in health care, Jones and Barlett publishers.
National Society of Professional Engineers, Engineering Stages of New Product Development.
Nerur, S. & Mahapatra, R. & Mangalaraj, G., 2005. Challenges of migrating to agile methodologies. Magazine Communications of the ACM, Volume 48, Issue 5, pp. 72-78.
Nonaka, I., 1994. A dynamic theory of organizational knowledge creation. Institute of Business Research, Hitotsubashi University.
PMI, 1996. A Guide to the Project Management Body of Knowledge. Project Management Inst; 4th Original edition.
Qumer, A. & Henderson-Sellers, B., 2007. An evaluation of the degree of agility in six agile methods and its applicability for method engineering. Journal Information and Software Technology archive Volume 50, Issue 4, pp. 280-295.
Chapter 9. References
VISUAL PLANNING IN LEAN PRODUCT DEVELOPMENT 53
Ronald Mascitelli, 2011. Mastering Lean Product Development: A Practical, Event-Driven Process for Maximizing Speed, Profits, and Quality. Technology Perspectives. 1st edition.
Schoohoven, C.B. & Eisenhardt, K.M. & Lyman, K., 1990. Speeding Products to Market: Waiting Time to First Product Introduction in New Firms. Administrative Science Quarterly, Nº35, pp.177-207.
Schwaber, K. & Beedle, M., 2006. Agile Software Development with SCRUM.
Sosa et al., 2002. Factors that influence technical communication in distributed product development: an empirical study in the telecommunications industry. IEEE Technology Management Council. Volume: 49 , Issue: 1, pp. 45-58.
Spillan, J. E. & Mino, M. & & Rowles, M.S., 2002. Sharing organizational messages through effective lateral communication. Research Library Core.
Tezel & Koskela & Tzortzopoulos, 2011. The Functions of Visual Managemet. http://usir.salford.ac.uk.
Walton, M., 1999. Strategies for Lean Product Development. Lean Aerospace Initiative. Center for Technology, Policy, and Industrial Development. Massachusetts Institute of Technology.
Wang, X.G.L & Ming, F.B & P.P Wang, D.Li, 2012. Focus on Implementation: a Framework for Lean Prduct Development. Journal Manufacturing Technology Management, Vol.23, Nº1, pp.4-24.
Wheelright, S. & Clark, K., 1992. Revoluzioning Product Development. The Free Press.
William J. Stevenson, 2012. Operations Management. Chapter 2, pp.40-43, McGraw-Hill Higher Education.
Womack, J.P & Jones, D.T. & Roos, D., 1991. The Machine That Changed The World. The Story of Lean Production. Harper Perennial.
Womack, J.P & Jones, D.T, 2003. Lean Thinking: Banish Waste and Create Wealth in Your Corporation. Free Press. 2nd ed.
Chapter 9. References
VISUAL PLANNING IN LEAN PRODUCT DEVELOPMENT 54

Chapter 10. Appendix
VISUAL PLANNING IN LEAN PRODUCT DEVELOPMENT 55
10 APPENDIX
APPENDIX A: QUESTIONS FOR INTERVIEWS
INTRODUCTIVE QUESTIONS:
- What is your task/job? Department? - Which is your background? - How long have you been working for the company? - How many projects are you involved in?
VISUAL PLANNING MEETINGS:
- Can you describe a VP meeting? (time, place, duration, No of people, tools used, frequency)
- Who holds the baton? - What do you talk about? - Do you follow any structured meeting? Do you answer fixed questions?
VISUAL PLANNING BOARDS:
- Can you describe your white board? (sections, No. of weeks, colors, use of post-it notes) - Did you change the office layout? Where is the board located? Is it visible for everybody
involved in the project? - What do you do when a task is done? How do you save this information? How it can be
checked if necessary? - Do you have different project boards in different departments? And a general one for the
whole project? How many departments are using VP? - How do you manage communicating possible changes to the general board? - How do you overcome physical and geographical barriers in the use of the VP boards?
And individual or departmental barriers?
WHEN, WHERE, HOW:
- Had you heard about VP before using it? - How did the idea of using VP emerge? - How long have you been using VP? - What did you use for planning projects before? What are the differences in planning,
implementation and evaluation comparing the VP method with the previous one? - What would you say is the purpose of introducing it? - How did the personnel react to the change? - Was it difficult to manage this new way of working? How did this affect to the project? - Were you trained before using VP?
PERSONAL RELATIONSHIPS:
- How do you think that VP affects problem-solving? Is it faster? Visible? Easier? - What main problem did you solve by introducing VP? How has VP affected the
attenuation of problems? Do you ask for external help when there is a problem that you cannot solve?
- How do you think that VP affects decision-making? Is it faster? Faster at lower-levels? Easier?
- How do you think that VP affects communication? Has face-to-face communication increased compared to phone/email? Has interdepartmental communication improved?
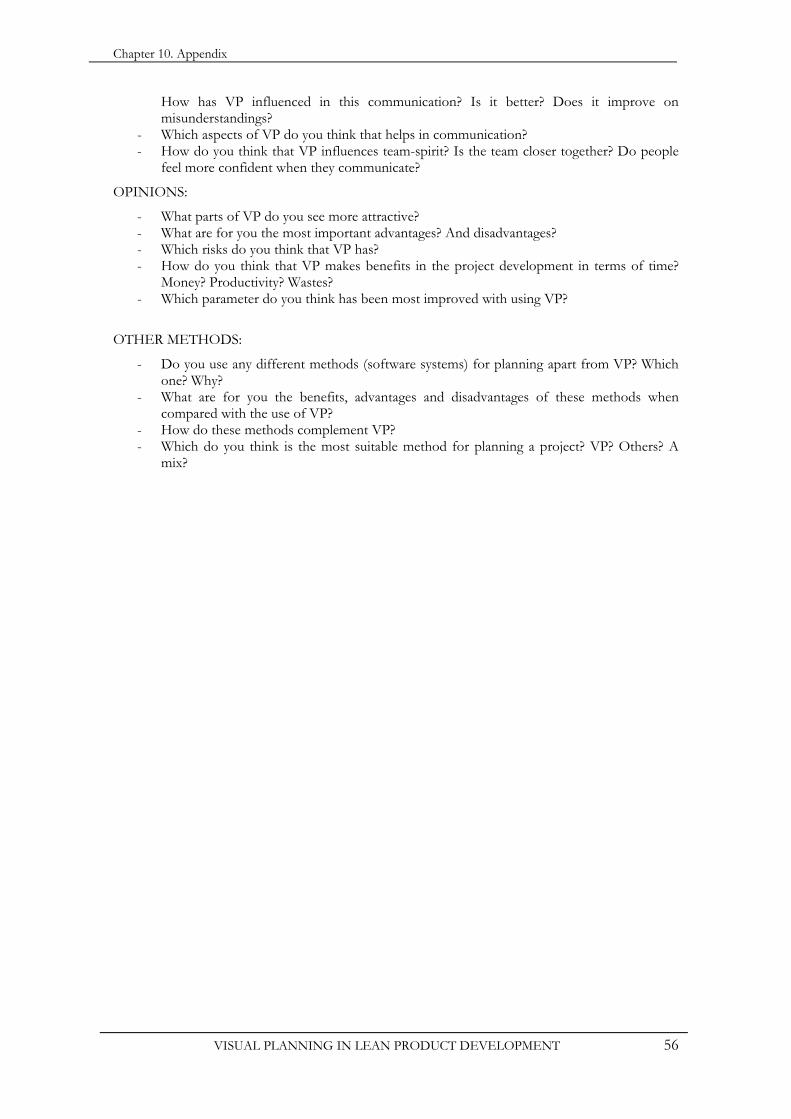
Chapter 10. Appendix
VISUAL PLANNING IN LEAN PRODUCT DEVELOPMENT 56
How has VP influenced in this communication? Is it better? Does it improve on misunderstandings?
- Which aspects of VP do you think that helps in communication? - How do you think that VP influences team-spirit? Is the team closer together? Do people
feel more confident when they communicate?
OPINIONS:
- What parts of VP do you see more attractive? - What are for you the most important advantages? And disadvantages? - Which risks do you think that VP has? - How do you think that VP makes benefits in the project development in terms of time?
Money? Productivity? Wastes? - Which parameter do you think has been most improved with using VP?
OTHER METHODS:
- Do you use any different methods (software systems) for planning apart from VP? Which one? Why?
- What are for you the benefits, advantages and disadvantages of these methods when compared with the use of VP?
- How do these methods complement VP? - Which do you think is the most suitable method for planning a project? VP? Others? A
mix?
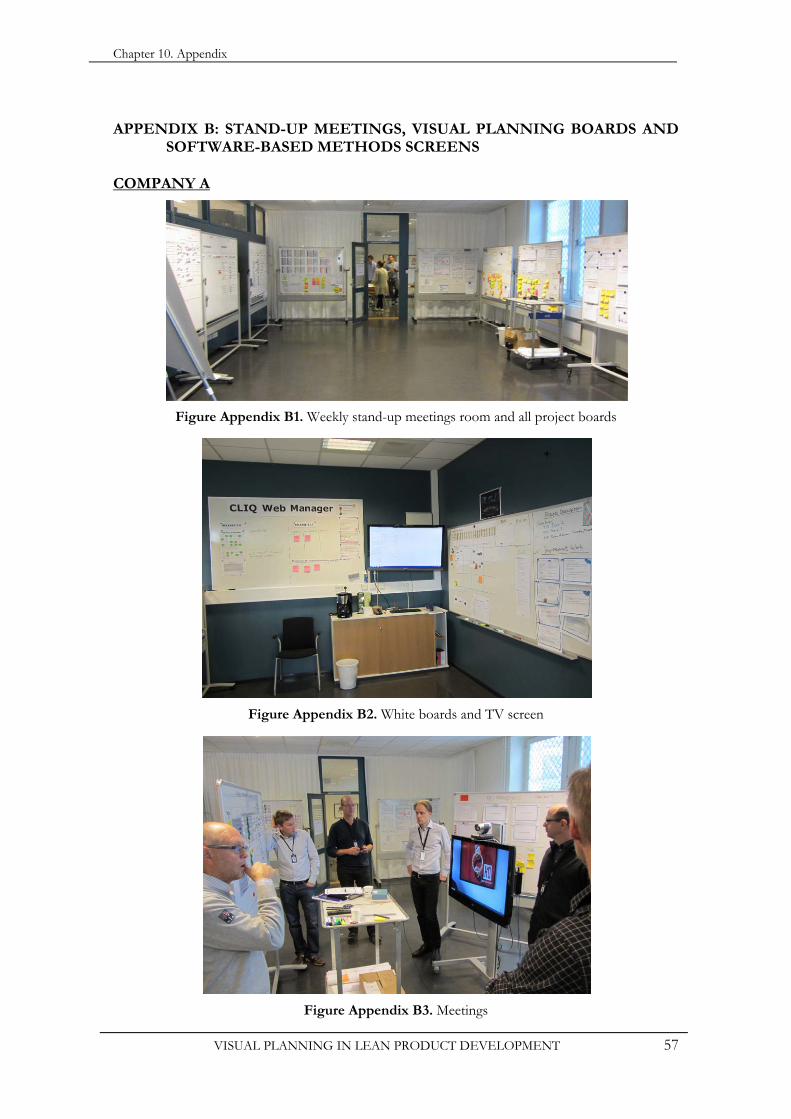
Chapter 10. Appendix
VISUAL PLANNING IN LEAN PRODUCT DEVELOPMENT 57
APPENDIX B: STAND-UP MEETINGS, VISUAL PLANNING BOARDS AND SOFTWARE-BASED METHODS SCREENS
COMPANY A
Figure Appendix B1. Weekly stand-up meetings room and all project boards
Figure Appendix B2. White boards and TV screen
Figure Appendix B3. Meetings
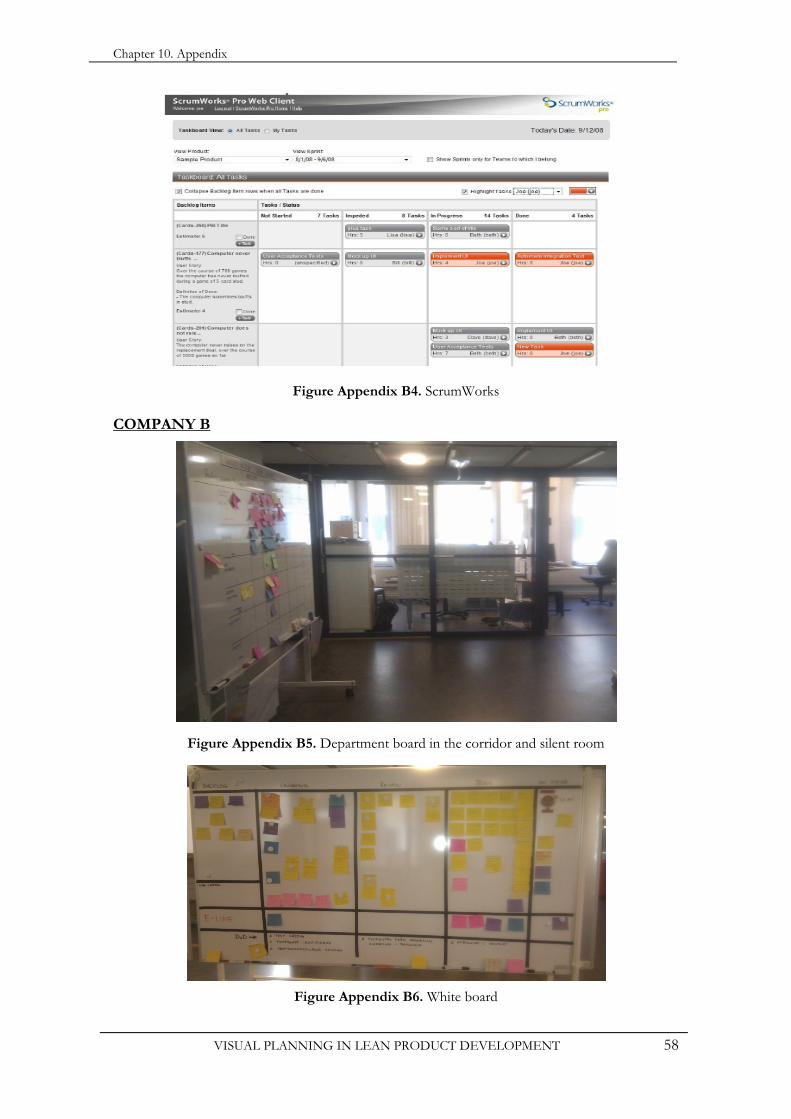
Chapter 10. Appendix
VISUAL PLANNING IN LEAN PRODUCT DEVELOPMENT 58
Figure Appendix B4. ScrumWorks
COMPANY B
Figure Appendix B5. Department board in the corridor and silent room
Figure Appendix B6. White board
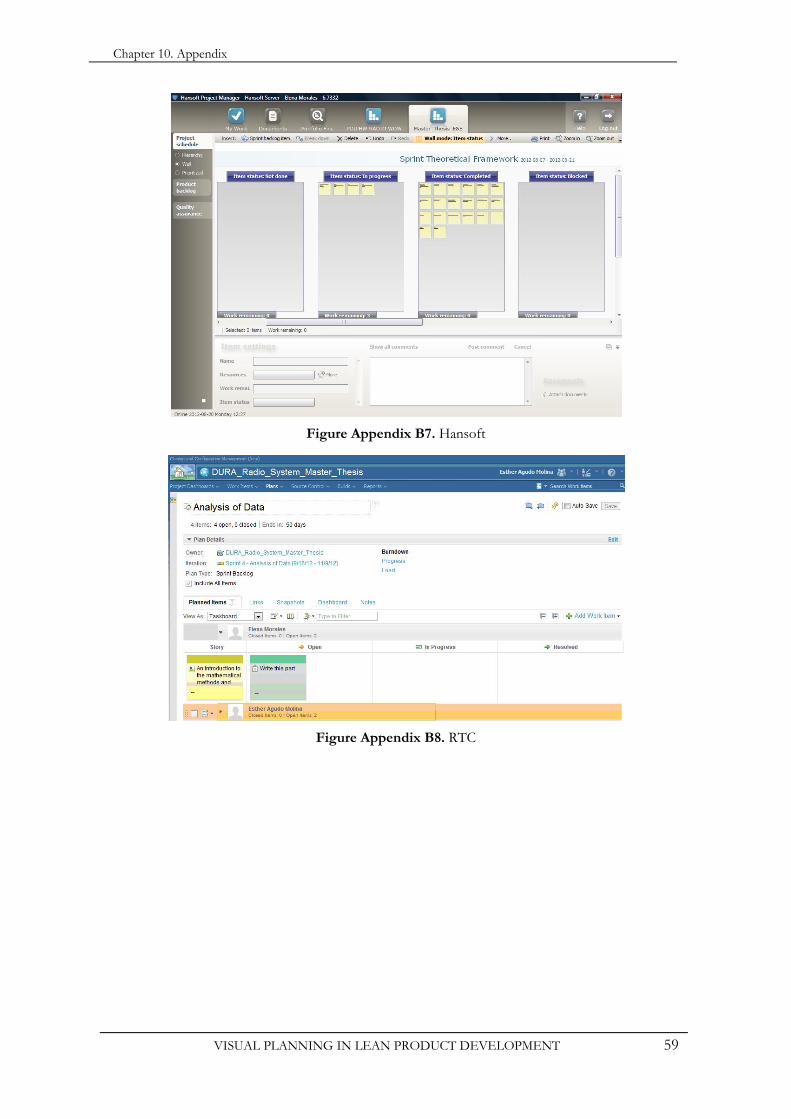
Chapter 10. Appendix
VISUAL PLANNING IN LEAN PRODUCT DEVELOPMENT 59
Figure Appendix B7. Hansoft
Figure Appendix B8. RTC

Chapter 10. Appendix
VISUAL PLANNING IN LEAN PRODUCT DEVELOPMENT 60
VISUAL PLANNING IN LEAN PRODUCT DEVELOPMENT 61
APPENDIX C: LIST OF FIGURES
Chapter 3. Method
Figure 1. Interactive model of Research Design (Maxwell, J.A. 2005) .................................................. 13
Figure 2. An outline of the main steps of qualitative research (Alan Bryman 2004) .......................... 14
Chapter 4. Theoretical Framework
Figure 3. Project Management phases (PMI) ............................................................................................ 17
Figure 4. Stage gate process (Cooper, R. 1993) ........................................................................................ 18
Figure 5. Systems approach to Product Development (Liker, J.K. & Morgan, J.M. 2006) ............... 20
Figure 6. Types of success (Nerur, S. & Mahapatra, R. & Mangalaraj, G. 2005) ................................ 21
Figure 7. The communication process (Nancy Borkowski 2011) .......................................................... 23
Figure 8. Communication channels (Daft, R.L. & Lengel, R.H 1984) .................................................. 23
Figure 9. Examples of stand-up meeting and whiteboards (Ronald Mascitelli 2011) ......................... 24
Figure 10. Frequency of stand-up meetings based on the pace of activities’ project (Ronald Mascitelli 2011) ................................................................................................................................. 25
Figure 11. Approach model of a visual project board (Ronald Mascitelli 2011) .................................. 26
Figure 12. Approach of a project visual board using Scrum (Henrik Kniberg 2007) ......................... 28
Figure 13. Manifesto for agile software development (Kent Beck et al. 2001) .................................... 30
Figure 14. Waterfall model (Royce, 1970) .................................................................................................. 30
Chapter 5. Results. Empirical Findings
Figure 15. An approach to project division ............................................................................................... 33
Figure 16. Frequency of the meetings carried out in Company A ......................................................... 34
Figure 17. Frequency of the meetings carried out in Company B ......................................................... 34
Figure 18. Evolution of VP (interviewee Company B) ............................................................................ 35
Figure 19. Relation between knowledge transfer and communication with VP within Company A ....................................................................................................................................................... 36
Figure 20. Relation between knowledge transfer and communication with VP within Company B ....................................................................................................................................................... 36
Figure 21. Savings related to Visual Planning (interviewees’ experiences from Company A and B) ............................................................................................................................................................ 38
Chapter 10. Appendix
Figure Appendix B1. Weekly stand-up meetings room and all project boards .................................. 57
Figure Appendix B2. White boards ........................................................................................................... 57
Figure Appendix B3. Meetings .................................................................................................................. 57
Figure Appendix B4. ScrumWorks ........................................................................................................... 58
Figure Appendix B5. Department board in the corridor ...................................................................... 58
VISUAL PLANNING IN LEAN PRODUCT DEVELOPMENT 62
Figure Appendix B6. White boards ........................................................................................................... 58
Figure Appendix B7. Hansoft .................................................................................................................... 59
Figure Appendix B8. RTC .......................................................................................................................... 59