Embed Size (px)
Citation preview

visual packet analysis
Eye P.A. by MetaGeek USER GUIDE page 1

Eye P.A. visual packet analysis
Table Of Contents
SYSTEM REQUIREMENTS
INSTALLATION
LIVE CAPTURE
COMPATIBLE FILE FORMATS
HOW TO GET A .pcap FILE
MAIN VIEWS
Work Flow
Filter Bar
Multi-Layered P ie C harts
T ime Graph
A ctive Selec tion
A ssoc iated Data Table
P acket V iewer
MULTI-LAYERED PIE CHARTS
Packets
Bytes
T ime
TIME GRAPH
T ime Segment A nalys is
A djus ting the T ime Span
Packets , Bytes , and T ime
DATA VISUALS
Multi-Layered P ie C harts
Ring O rder
Drill-Down
Bread C rumbs
Hover (Inspec tor Tool)
PACKET VIEWER
UNDERSTANDING COLOR
Data Rate
Data Frames
Management Frames
C ontrol Frames
ASSOCIATED DATA TABLE
FREQUENTLY ASKED QUESTIONS
Eye P.A. by MetaGeek USER GUIDE page 2

SYSTEM REQUIREMENTS1) Microsoft .NET Framework 4 Client Profile
(Eye P.A. installer will direct you to download)
2) Microsoft .NET Framework 4 Extended
(Eye P.A. installer will direct you to download)
INSTALLATION1) Download the latest version of Eye P.A. from MetaGeek
http://www.metageek.net/products/eye-pa/download
2) Once the file has finished downloading, double-click on the installer.
Go through the installation dialogue. The program will install under
the directory “MetaGeek.”
3) Double click on the icon “Eye P.A.” to start the application.
If this is the first time Eye P.A. is run, it will ask for a license key.
If you do not have a license key, click the “Continue Trial” button to
run Eye P.A. in full evaluation mode free for 15 days.
Eye P.A. by MetaGeek USER GUIDE page 3

DIRECT CAPTUREEye P.A. can capture 802.11 packets with an accompanying AirPcap Nx USB
adapter.
To begin, connect your device to your
computer’s USB and open Eye P.A. Click the
START category at the top of the screen.
Here you will select your AirPcap, the 2.4 or 5
GHz band and the channel that you wish to
scan. Click START CAPTURE to begin
accumulating raw 802.11 frames.
Eye P.A. by MetaGeek USER GUIDE page 4
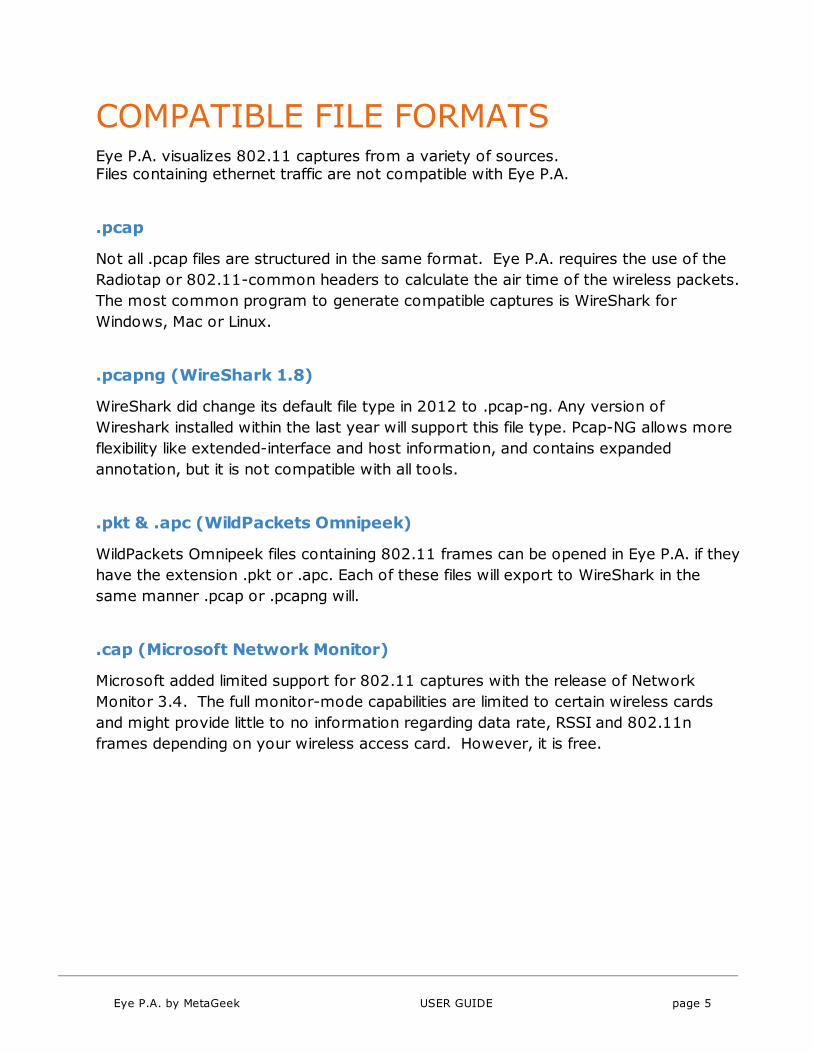
COMPATIBLE FILE FORMATSEye P.A. visualizes 802.11 captures from a variety of sources.Files containing ethernet traffic are not compatible with Eye P.A.
.pcap
Not all .pcap files are structured in the same format. Eye P.A. requires the use of the
Radiotap or 802.11-common headers to calculate the air time of the wireless packets.
The most common program to generate compatible captures is WireShark for
Windows, Mac or Linux.
.pcapng (WireShark 1.8)
WireShark did change its default file type in 2012 to .pcap-ng. Any version of
Wireshark installed within the last year will support this file type. Pcap-NG allows more
flexibility like extended-interface and host information, and contains expanded
annotation, but it is not compatible with all tools.
.pkt & .apc (WildPackets Omnipeek)
WildPackets Omnipeek files containing 802.11 frames can be opened in Eye P.A. if they
have the extension .pkt or .apc. Each of these files will export to WireShark in the
same manner .pcap or .pcapng will.
.cap (Microsoft Network Monitor)
Microsoft added limited support for 802.11 captures with the release of Network
Monitor 3.4. The full monitor-mode capabilities are limited to certain wireless cards
and might provide little to no information regarding data rate, RSSI and 802.11n
frames depending on your wireless access card. However, it is free.
Eye P.A. by MetaGeek USER GUIDE page 5

CommView for Wi-Fi (.ncf)
Acquire full 802.11n captures on a windows machine without an AirPcap Nx, use
CommView for Wi-Fi. Supporting more wireless adapters than other packet analysis
applications, it may have limitations similar to Microsoft Network Monitor.
HOW TO GET A .pcap FILEEye P.A. is a wireless network data visualization tool. It sorts and displays data that
has been captured in a .pcap file in order to make it easy for you to troubleshoot
problems with your wireless network.
You can get a .pcap file in a lot of different ways. The ways listed below are the ones
we’re accustomed to gathering them with. We’d love to hear more about how you
use .pcap files in our user forum.
WITH Mac OS X Lion and WireShark
There are two methods in capturing 802.11 frames in Mac OS X Lion.
1) Use the included utility application, “Wi-Fi Diagnostics”.
Open Finder and navigate to: /System/Library/CoreServices/
Scroll down and select the Wi-Fi Diagnostics application.
(you can also make an alias or drag the icon to your dock for easier access later)
Eye P.A. by MetaGeek USER GUIDE page 6

Select "Capture Raw Frames"
Select "Capture all data from all nearby networks" and
"Disconnect from the network and capture only data from channel"
Choose the channel you wish to monitor.
Eye P.A. by MetaGeek USER GUIDE page 7

Click "OK" on the text dialogue window.
Click “Start Capture.”
(Don't make the mistake of clicking “Continue” before making your capture).
Click “Stop Capture” when you are satisfied with the length of time.
Choose "Show in Finder" and extract the .tgz file to reveal a .pcap file that can be opened
in WireShark or Eye P.A.
Eye P.A. by MetaGeek USER GUIDE page 8

2) Use WireShark to create a pcap file using the internal wireless network interface. Select
the adapter en1 and click options to go into the advanced settings. Select “Capture
packets in monitor mode” and then click start. WireShark will begin to log all of the
wireless frames. Click File > Save to create a .pcap which will create a file that can be
opened by Eye P.A.
WITH Microsoft Network Monitor
Microsoft Network Monitor is a free tool, but unfortunately it does not accurately
portray HT 802.11n frames and data rates. MetaGeek recommends using an
AirPcap adapter or CommView for Wi-Fi instead. However, the following will help
you create files compatible with Eye P.A.
A list of Network Monitor supported Wi-Fi adapters:
http://social.technet.microsoft.com/Forums/en-US/netmon/thread/737def6e
-b927-4deb-997a-6a11e0aa94e2
To download Microsoft Network Monitor 3.4 visit:
http://www.microsoft.com/en-us/download/details.aspx?id=4865
Eye P.A. by MetaGeek USER GUIDE page 9

To capture 802.11 frames, deselect all of the adapters except for the wireless card
in the “Select Networks” pane.
Click “New Capture” in the top left of the screen.
Eye P.A. by MetaGeek USER GUIDE page 10

Click “Capture Settings” underneath the main menu. A new window will appear.
Select your Wi-Fi adapter, and then click properties.
Click “Scanning Options” to put the Wi-Fi card in Monitor Mode.
Eye P.A. by MetaGeek USER GUIDE page 11

Put a check next to “Switch to Monitor Mode” and then select the Wi-Fi channels
and time you would like Microsoft Monitor to spend on each channel.
Click “Apply.” And leave the window open. Return to the main window and click
“Start.”
Do not click “Close and Return to Local Mode” in the “Wi-Fi Scanning Options”
unless you are done scanning.
To save the file click “Save As” underneath the main menu.
Eye P.A. by MetaGeek USER GUIDE page 12

ANALYZE
Eye P.A. examines a variety of aspects of your capture, and will provide analysis based
upon what it finds.
After starring the network(s) you are interested in, a pie chart will be shown that displays
the percentages of the starred network’s data, retransmits, control, and management
packets compared to the percentage of packets belonging to other networks. The
remaining black area of the pie chart represents the amount of available air time.
Below the pie chart, you will find suggestions for adjustments
you can make in order to better your wireless network’s
performance. The areas where Eye P.A. looks for
improvements include protection mechanisms, presence of
legacy rates, high retransmission rates, encryption settings, and
channel choice issues.
Any applicable tips will be shown for each network you star. Clicking the clipboard icon to
the right of your selected network’s name in the tips window will copy the tips for that
network to your clipboard, allowing for easy export.
Eye P.A. by MetaGeek USER GUIDE page 13

MAIN VIEWS
Eye P.A. by MetaGeek USER GUIDE page 14

Work Flow
Across the top of Eye P.A. are 4 different categories called the Work Flow. Eye P.A.
helps users learn how to use its core features in the “LEARN” tabs. The “CAPTURE”
section is where users can open packet captures, or create their own capture using
an AirPcap Nx. “VISUALIZE” takes the entire capture and generates Time Graphs,
multi-layered pie charts, and data tables. After visually filtering the data necessary
select “ANALYZE to perform the analysis. The “PACKETS” section will display the
individual packets for a more in-depth analysis.
Filter Bar
The top of the filter bar is where the user can type in the name, MAC, Channel,
Data Rate or RSSI. Users can apply exclusive filters to quickly remove data from a
particular access point or client by selecting the “-” before the text entry field.
Selecting a “+” will build an inclusive filter. The Data Rate and RSSI can also be
filtered based on a “greater than” or “less than” selection. With this filter, users can
remove all frames with a RSSI less than or equal to -90dBM.
It can also be helpful to filter out certain types of packets like beacons,
acknowledgements, or other non-essential frame types to focus only on the
packets that matter most. To remove specific frame types from the multi-layered
pie charts, click “Subframe Filters” in the Filter Bar at the top of the application.
Checking and unchecking frame types allows the user to selectively choose the
which packets Eye P.A. will graph.
Filter Breadcrumbs
The filter bread crumbs represent the current requirements the user has manually
Eye P.A. by MetaGeek USER GUIDE page 15

entered as filters or navigated to by means of the multi-layered pie chart. To
remove a crumb click the x. Bread crumbs will either be black to represent
exclusive filters or gray to show inclusive filters.
Note: Filtering packets will affect the data exported to WireShark. For example, if “Beacons” are unchecked
from the display filters, they will be excluded from the data you can export to WireShark.
Multi-Layered Pie Charts
Eye P.A. uses multi-layered pie charts to display overall utilization of total
packets, total bytes, and total amount of air time. The size of the slices in the
rings are proportionate to the total, while the colors represent the type of data
being displayed.
Eye P.A. by MetaGeek USER GUIDE page 16

The data is a hierarchical breakdown by SSID > Client > Frame Type > Subframe
Type. Each slice is divided into smaller slices in the next layer.
For example, by clicking on a client, Eye P.A. will draw a new multi-layered pie
chart with all of the data for that particular client.
Adjustable Time Graph
Eye P.A. displays a historical summary of the data capture in the top time slider. By
default, the Adjustable Time Graph in Eye P.A. selects the capture in its entirety.
The user can select a different window of time by dragging the start and stop
handles on either side of the time slider. When the user selects a smaller time
range, both the data visuals and tables will update, only displaying data from the
selected range, which helps you narrow in on unusual network activity.
Eye P.A. by MetaGeek USER GUIDE page 17

Active Selection
The Active Selection legend located at 3 o'clock displays the related data to the
center of the multi-layer pie chart. This data will change as the user drills down
through layers. It displays total time, bytes, number of packets, BSSIDs, clients,
and retry rate. By clicking the star you can select the BSSID for optimization in
the Analyze tab.
Associated Data Table
The table displays quantifiable metrics for the layer on the next ring out from the
center (ring 1). Upon opening a .pcap file, the table will show each BSSID, the
total amount of air time utilized, bytes, number of clients associated, average
data frame rate, and retry rate.
The multi-layered pie chart can be rearranged by clicking the table's column
headers to sort the data. Similar to a clock, the sorting will start at the 12
position and display clockwise in the pie chart with its order indicated in the table
data.
Eye P.A. by MetaGeek USER GUIDE page 18

Packet Viewer
Eye P.A. will display the basic details of individual packets in the Packets Table,
including Subframe Type, RSSI, Retry, and Destination. The user can define the
columns in the packet viewer by right-clicking on a column header and selecting the
details they wish to view. Apply filters from the Filter Bar or use the Treepie in the
left pane to drill-down in the packet viewer.
Eye P.A. will automatically remove columns as
they become redundant due to the filtered data
set. For example, if the BSSID is the same in
every frame it will no longer be represented as a
column.
To bring any missing columns back into view
right-click at the top of the packet viewer table
and select the columns you would like visible.
Eye P.A. by MetaGeek USER GUIDE page 19

MULTI-LAYERED PIE CHARTSTo alternate visually between the different types of data, click the arrow above any pie
chart to select TIME, PACKETS, or BYTES and move it to the featured position. This will
change the main pie chart and the Time Graph to that type of data.
Packets
This view represents the proportionate amounts of packets in comparison to the
total captured.
Bytes
This view represents 100% of the total data captured in Bytes. Each slice is the
total data sent by BSSID or client.
Air Time
This view represents the proportionate amount of air time each station utilized.
It is important to note that lower data rates use more air time than higher data
rates to transfer the same number of bytes.
Wireless is similar to wired communication in the sense that no two devices can “talk” atthe same time. Therefore the amount of time each station takes prohibits the otherstations from transmitting.
Eye P.A. by MetaGeek USER GUIDE page 20

To simplify and increase the performance speed of Eye P.A.,
the software will aggregate any small packets into a gray
slice labeled “Miscellaneous.” To see the contents of a gray
slice, use the associated data table and double click on it. If
the gray slice is on the outside of a green ring, expand its
parent by clicking on it. Eye P.A. will redraw all of the outer
sections to display the data that was aggregated in a gray
“Miscellaneous” slice.
Time GraphTime Segment Analysis
Wireless environments can look different within minutes. Issues may be erratic and
intermittent. By adjusting the time span in the slider, users can omit time when the
WLAN was functioning properly and focus on a smaller time window when an issue
occurred.
Eye P.A. by MetaGeek USER GUIDE page 21

Adjusting the Time Span
The time span is the line graph at the bottom of the display.
When opening a .pcap file in Eye P.A., the software will
automatically adjust the time span to the beginning and end of
the capture. The time window has two handles that can be
adjusted in and out to help you choose select times of the
capture.
To move the time span, click in the middle of the handle and
drag it to another location in time.
Packets, Bytes, and Air Time
The left hand side of the Time Graph will toggle between total bytes transferred, total
packets, and total air time utilized. The line graph represents the current largest
multi-layered pie chart and will automatically change when the user toggles between
the pie charts.
Eye P.A. by MetaGeek USER GUIDE page 22
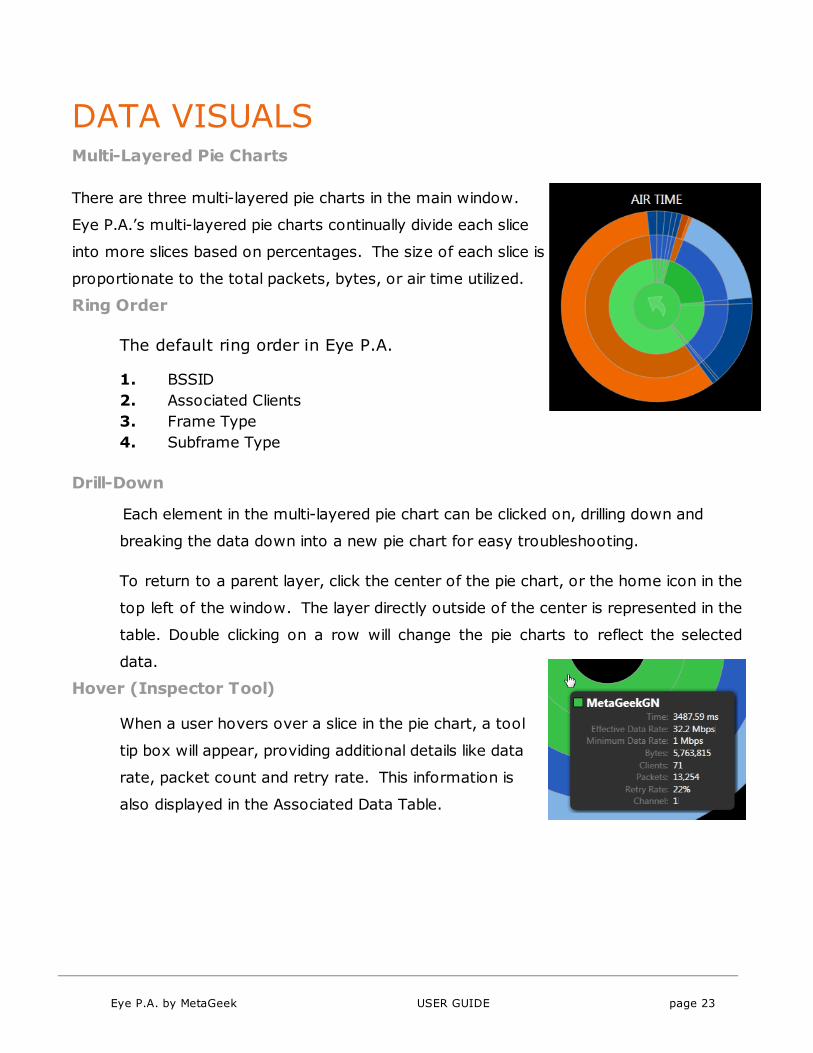
DATA VISUALSMulti-Layered Pie Charts
There are three multi-layered pie charts in the main window.
Eye P.A.’s multi-layered pie charts continually divide each slice
into more slices based on percentages. The size of each slice is
proportionate to the total packets, bytes, or air time utilized.
Ring Order
The default ring order in Eye P.A.
1. BSSID
2. Associated Clients
3. Frame Type
4. Subframe Type
Drill-Down
Each element in the multi-layered pie chart can be clicked on, drilling down and
breaking the data down into a new pie chart for easy troubleshooting.
To return to a parent layer, click the center of the pie chart, or the home icon in the
top left of the window. The layer directly outside of the center is represented in the
table. Double clicking on a row will change the pie charts to reflect the selected
data.
Hover (Inspector Tool)
When a user hovers over a slice in the pie chart, a tool
tip box will appear, providing additional details like data
rate, packet count and retry rate. This information is
also displayed in the Associated Data Table.
Eye P.A. by MetaGeek USER GUIDE page 23

ASSOCIATED DATA TABLE
The Associated Data Table provides details for the innermost ring (Ring 1) of the Multi
Layer Pie Chart.
Table Columns
■ SSID - This is the network name.
■ Air Time - The amount of time used to transmit
■ Bytes - The amount of data transferred
■ Client - A unique identifier for each network interface (MAC)
■ Packets - The total # of packets per BSSID
■ Retry - The percentage of packets that had to be resent
■ Effective Data Rate - The average data rate achieved by the client including
inter frame spacing and network allocation vector times.
Eye P.A. by MetaGeek USER GUIDE page 24

SEND TO WIRESHARK
Send any layer of the multi-layer pie chart to WireShark by clicking “File” in the
main menu and then “Send to WireShark.” Conveniently, Eye P.A. automatically
bundles up the data in the current multi-layer pie chart, applies the filters you’ve
drilled down to select, and sends all of the packets to WireShark for more
in-depth analysis.
REPORTINGIn each pane of Eye P.A. you will see a clipboard icon.
Clicking this will copy the contents of the pane to the
user’s clipboard. The time graph and and treepies will be
copied as images, while the active selection and
associated data table will be copied as a csv.
Eye P.A. by MetaGeek USER GUIDE page 25

FREQUENTLY ASKED QUESTIONSWhat is the “Broadcast” SSID?
In 802.11, clients or stations can broadcast management frames called Probe
Requests. Probe requests occur when stations are looking for access points they
previously connected with. These do not occur in a network but Eye P.A. groups
them into a broadcast group for organizational simplicity.
Why won’t Eye P.A. open my .pcap file?
There are currently two types of .pcap files that Eye P.A. can open. The .pcap must
contain 802.11 frames with Radiotap or 802.11-common PPI headers. Typically
these captures are created using:
■ Wireshark with Airpcap adapter■ Mac OS X with Wi-Fi Diagnostics or WireShark in Monitor Mode■ Linux with WireShark or Kismet■ Export a .cap or .pcap from a wireless access point
Why are the packet counts different in WireShark and Eye P.A.?
Sometimes the capturing device receives packets that are malformed or corrupt.
Eye P.A. drops any packets that do not have a proper Frame Check Sequence (FCS)
in the packet, even though Wireshark will display those
packets.
What is a Hidden SSID?
Some wireless network administrators may hide their SSID,
which tells the router not to broadcast its name. Typically only users who know the
name of the wireless network can connect to a hidden SSID.
Eye P.A. by MetaGeek USER GUIDE page 26

What is the “Miscellaneous” gray slice?
The gray slices contain valid packet data from a high amount of different
sources. For example a capture file may have 10 top talkers that make up
90 percent of the total traffic. However, 100 clients make up the remaining
10 percent. Instead of drawing each slice, Eye P.A. aggregates them into
miscellaneous slices. They are colored gray because they may contain
management, data, and control frames. To view any of the data in the gray
slice, click on its parent slice and all of the data will be redrawn.
How is the Effective Data Rate calculated?
The effective data rate reflects the data frames transferred to and from a BSSID and
client. Eye P.A. takes the total bytes transferred and divides it by the total air time.
The air time for each frame is calculated by dividing the bytes in the payload by the
data rate for that frame.
Eye P.A. by MetaGeek USER GUIDE page 27

UNDERSTANDING COLORData Rate
The first two layers in the multi-layered pie chart are colored by the average data
rate of the traffic. The shade of green is based on a sliding scale. The minimum
average data rate captured is represented by light green, while the highest is
represented by dark green, with shades in between.
Eye P.A. by MetaGeek USER GUIDE page 28
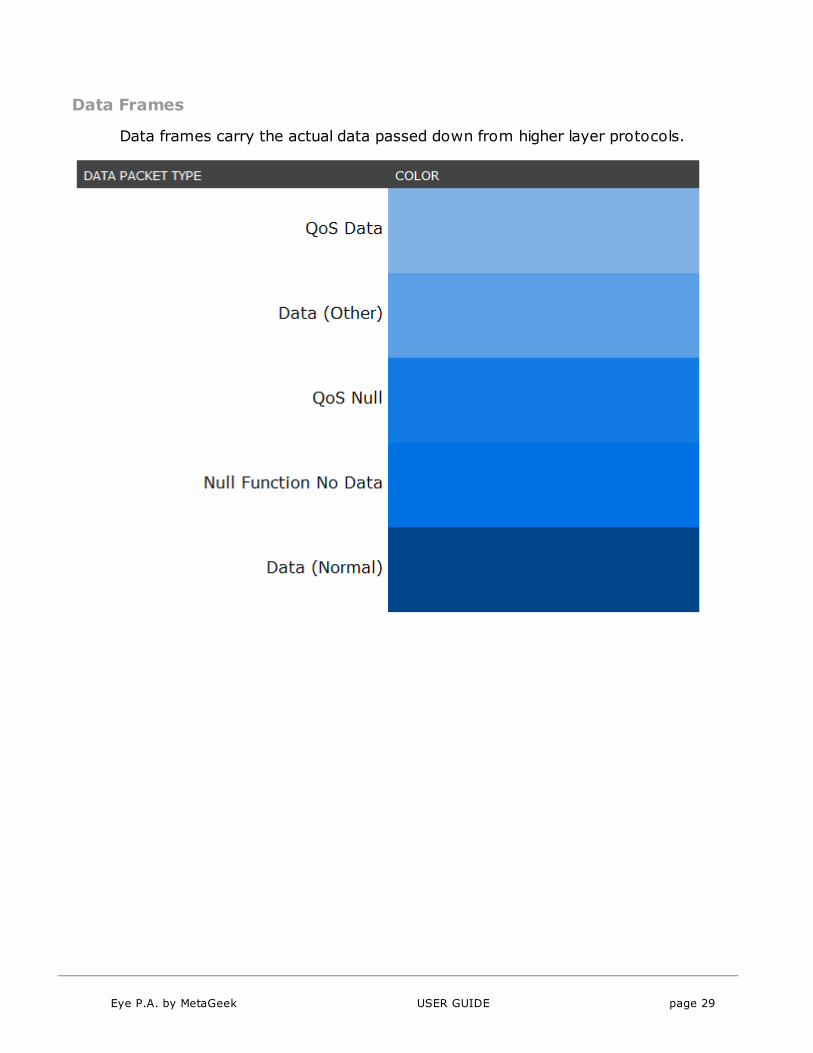
Data Frames
Data frames carry the actual data passed down from higher layer protocols.
Eye P.A. by MetaGeek USER GUIDE page 29

Management Frames
A majority of the frame types in an 802.11 network.
Used by wireless stations to join and leave the network.
Eye P.A. by MetaGeek USER GUIDE page 30

Control Frames
Control frames help with the delivery of the data frames. Control frames must be able
to be heard by all stations; therefore, they must be transmitted at one of the basic
rates. Control frames are also used to clear the channel, acquire the channel, and
provide unicast frame acknowledgments.
LEARN MOREYou can learn more about Eye P.A. at our website:
http://www.metageek.net/products/eye-pa
Eye P.A. by MetaGeek USER GUIDE page 31