Embed Size (px)
Citation preview
Cognition, 46 (1993) 139-181
Visual imagery and visual-spatial language:
Enhanced imagery abilities in deaf and
hearing ASL signers*
Karen Emmorey,” Stephen M. Kosslynb and Ursula Bellugi”
“Laboratory for Cognitive Neuroscience, The Salk Institute for Biological Studies, 10010 North Torrey
Pines Road, La Jolla, CA 92037, USA
bDepartment of Psychology and Social Relations, Harvard University, Cambridge, MA 02138, USA
Received April 22, 1991, final version accepted September 7, 1992
Abstract
Emmorey, K., Kosslyn, S.M., and Bellugi, U., 1993. Visual imagery and visual-spatial language:
Enhanced imagery abilities in deaf and hearing ASL signers. Cognition, 46: 139-181.
The ability to generate visual mental images, to maintain them, and to rotate them
was studied in deaf signers of American Sign Language (ASL), hearing signers
who have deaf parents, and hearing non-signers. These abilities are hypothesized to
be integral to the production and comprehension of ASL. Results indicate that both
deaf and hearing ASL signers have an enhanced ability to generate relatively
complex images and to detect mirror image reversals. In contrast, there were no
group differences in ability to maintain information in images for brief periods or
to imagine objects rotating. Signers’ enhanced visual imagery abilities may be tied
to specific linguistic requirements of ASL (referent visualization, topological
classifiers, perspective shift, and reversals during sign perception).
Correspondence to: Dr. Karen Emmorey, Laboratory for Cognitive Neuroscience, The Salk
Institute for Biological Studies, 10010 North Torrey Pines Road, La Jolla, CA 92037, USA; e-mail:
*This work was supported by NIH grant HD-13249 awarded to Ursula Bellugi and Karen
Emmorey, as well as NIH grants DC-00146, DC-0021 and NSF grant BNS86-09085. It was also
supported by NSF grant BNS 90-09619 and NINDS Grant 2 POl-17778-09 awarded to Stephen
Kosslyn. We would like to thank Don Baer, Dennis Galvan, Petra Horn, Jenny Larson, and Lucinda
O’Grady-Batch for their helpful assistance in testing subjects and data processing, and Phil Daly and
Sania Hamilton for technical assistance. We also thank Edward Klima, Ovid Tzeng, and especially two
anonymous reviewers for their helpful comments on the manuscript. We are also particularly grateful
to Gallaudet University, Washington, DC, and to the deaf and hearing subjects who participated in
these studies.
OOlO-0277/93/$06.00 0 1993 - Elsevier Science Publishers B.V. All rights reserved.
140 K. Emmorey et al.
Introduction
American Sign Language (ASL), the language of deaf communities in the United
States, exploits visual-spatial mechanisms to express grammatical structure and
function. Visual-spatial perception, memory, and mental transformations are
prerequisites to grammatical processing in ASL (Emmorey & Corina, 1990;
Emmorey, Norman, & O’Grady, 1991; Hanson & Lichtenstein, 1990), and also
are central to visual mental imagery (Farah, 1988; Finke & Shepard, 1986;
Kosslyn, 1980; Shepard & Cooper, 1982). Hence, it is of interest to examine the
relation between the use of ASL and spatial imagery abilities. In this article we
report a series of experiments in which we compare various aspects of visual
mental imagery in deaf signers of ASL, hearing signers who learned ASL from
their deaf parents, and hearing non-signers. We investigate whether signers are
more adept at imagery abilities that apparently are recruited to produce and
comprehend ASL.
The hypothesis that deaf ASL signers are especially adept at certain aspects of
visual imagery is plausible because ASL makes use of visual-spatial distinctions at
all linguistic levels (Bellugi, 1980; Klima & Bellugi, 1979; Lillo-Martin & Klima,
1990). The most striking surface difference between English and ASL is in the
latter’s reliance on explicitly marked spatial contrasts at all linguistic levels. This is
particularly evident in the complex spatial organization underlying ASL syntax
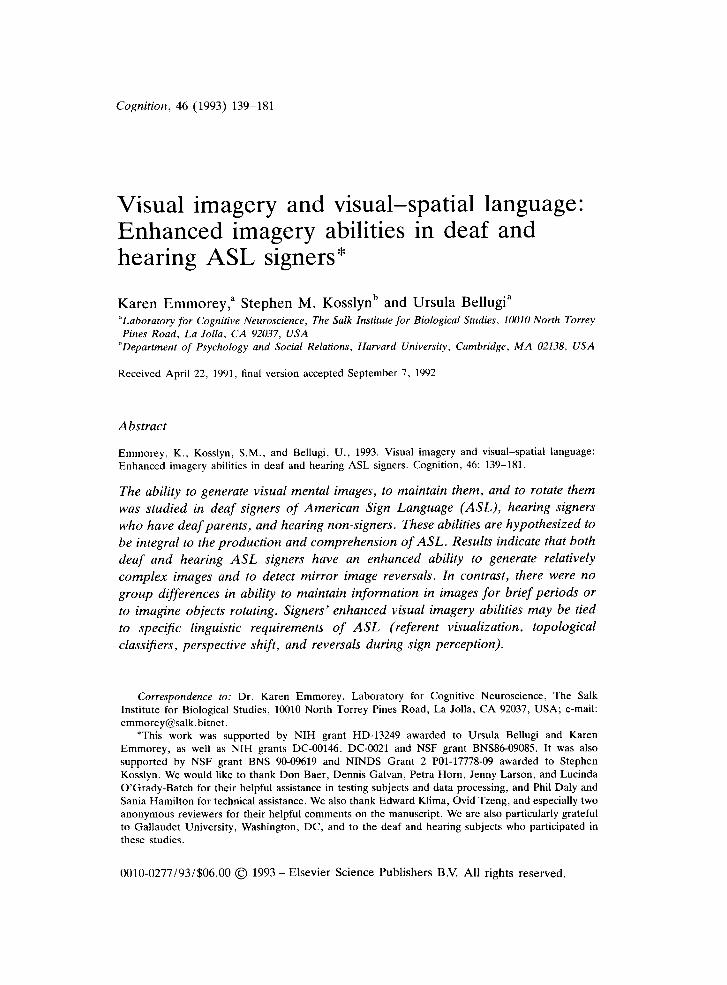
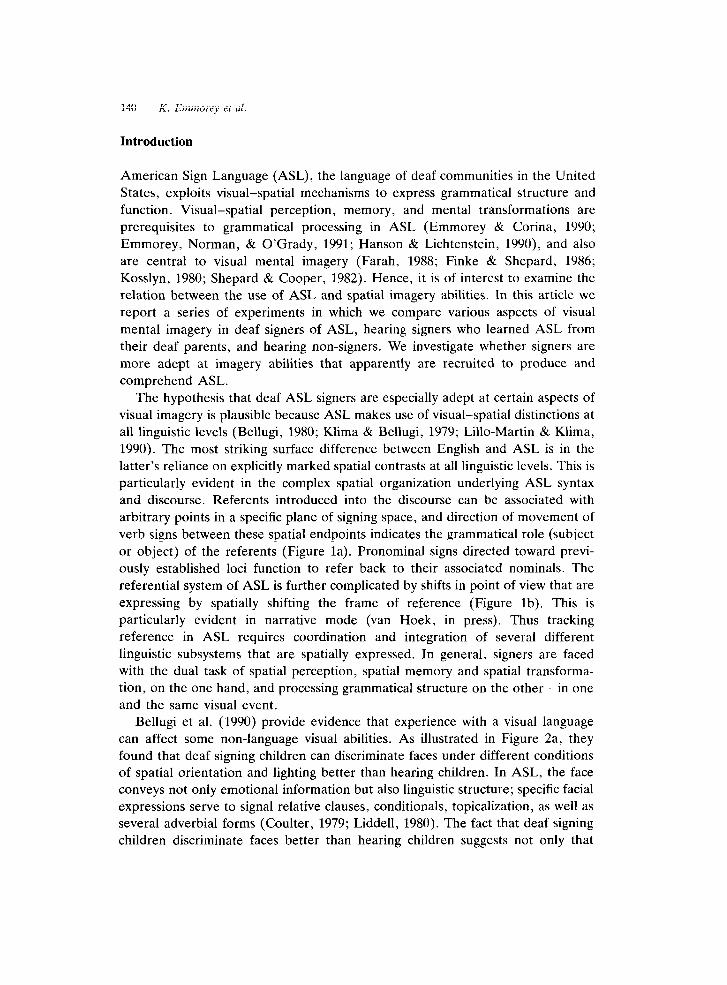
and discourse. Referents introduced into the discourse can be associated with
arbitrary points in a specific plane of signing space, and direction of movement of
verb signs between these spatial endpoints indicates the grammatical role (subject
or object) of the referents (Figure la). Pronominal signs directed toward previ-
ously established loci function to refer back to their associated nominals. The
referential system of ASL is further complicated by shifts in point of view that are
expressing by spatially shifting the frame of reference (Figure lb). This is
particularly evident in narrative mode (van Hoek, in press). Thus tracking
reference in ASL requires coordination and integration of several different
linguistic subsystems that are spatially expressed. In general, signers are faced
with the dual task of spatial perception, spatial memory and spatial transforma-
tion, on the one hand, and processing grammatical structure on the other - in one
and the same visual event.
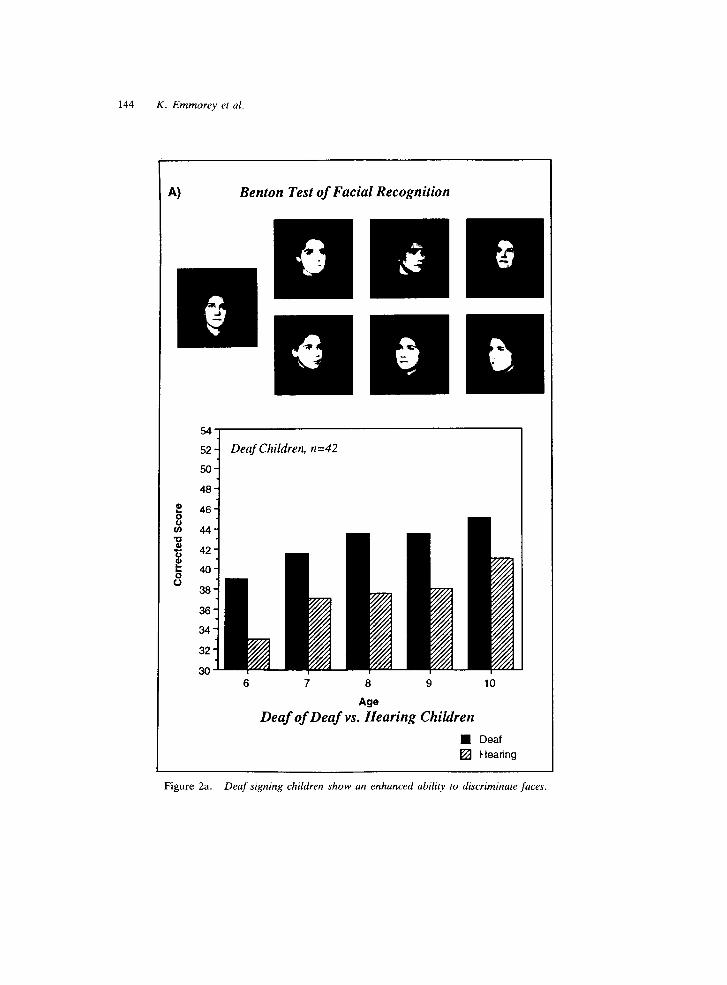
Bellugi et al. (1990) provide evidence that experience with a visual language
can affect some non-language visual abilities. As illustrated in Figure 2a, they
found that deaf signing children can discriminate faces under different conditions
of spatial orientation and lighting better than hearing children. In ASL, the face
conveys not only emotional information but also linguistic structure; specific facial
expressions serve to signal relative clauses, conditionals, topicalization, as well as
several adverbial forms (Coulter, 1979; Liddell, 1980). The fact that deaf signing
children discriminate faces better than hearing children suggests not only that

Visual imagery and visual-spatial language 141
acquiring the ability to detect grammatical distinctions expressed on the face
enhances other (non-linguistic) aspects of face recognition, but also that some
aspects of visual processing may subserve both linguistic and non-linguistic
functions.
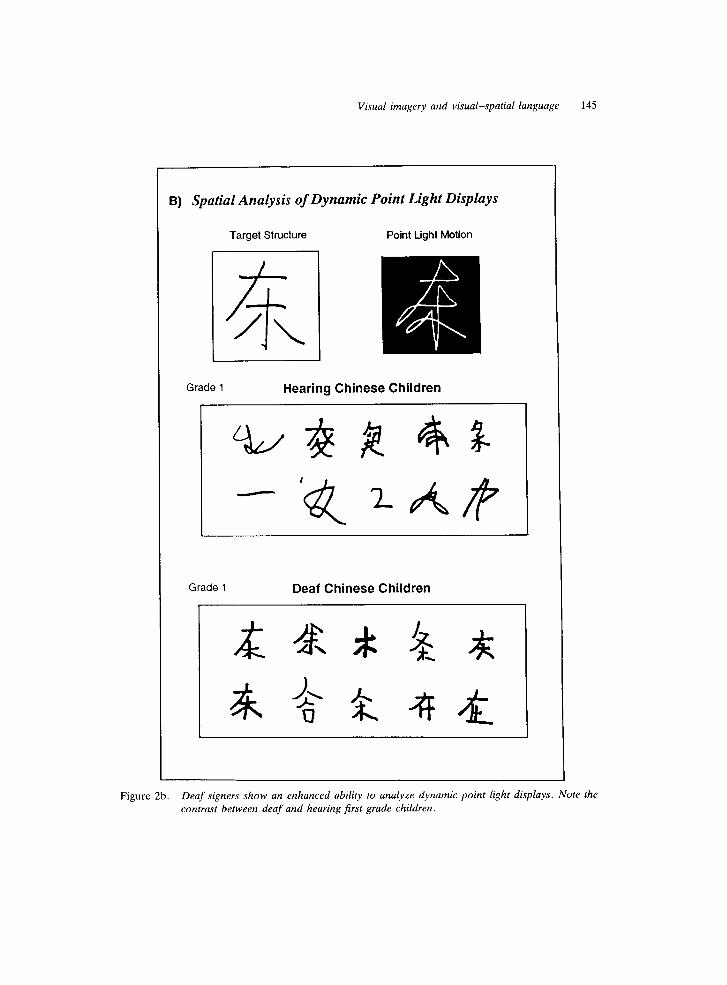
In addition, Klima, Tzeng, Fok, Bellugi, and Corina (1992) and Bettger (1992)
found that deaf signers can detect and interpret moving light displays better than
hearing non-signers. In this experiment, Chinese pseudo-characters were written
in the air with a light-emitting diode, which created a continuous stream of
movement. Deaf signers (both Chinese and American) were significantly better
than their hearing counterparts at perceiving the underlying segments of these
pseudo-characters. Figure 2b shows the contrast between first-grade Chinese
hearing and deaf children on this task. Furthermore, Neville has shown that deaf
signers have a heightened ability to detect the direction of movement in the
periphery of vision (Neville, 1988). Enhanced movement interpretation and
detection in deaf subjects can be tied to their linguistic experience because
recognition of dynamic movement is integral to morpholexical recognition in ASL
(see Emmorey & Corina, 1990; Poizner, 1983).
In the experiments reported here, we investigate three visual mental imagery
abilities that we hypothesize are integral to ASL production and comprehension:
image generation, maintenance, and transformation. These abilities also reflect
the typical progression of processing when imagery is used in cognition: an image
is first generated, and it must be maintained in short-term memory in order to be
manipulated. If ASL does in fact recruit these abilities, and thus signers practice
them frequently, then we might expect signers to be better at these aspects of
imagery than non-signers. Image generation is the process whereby an image
(i.e., a short-term visual memory representation) is created on the basis of
information stored in long-term memory. That is, a visual mental image is not
stored as a whole; rather it must be constructed either actively or passively, and
this process itself becomes more efficient with practice (see Kosslyn, Brunn,
Cave, & Wallach, 1985). In ASL, image generation may be an important process
underlying not only the spatially organized syntax but also the expression of
real-world spatial relations represented in the language. As opposed to its
syntactic use, space in ASL also functions in a topographic way. The space within
which signs are articulated can be used to describe the layout of objects in space.
In such mapping, spatial relations among signs correspond topographically to
actual spatial relations among objects described (Bellugi, Poizner, & Klima, 1989;
Supalla, 1986, in press). Spatial mapping uses ASL predicates of location and
motion, including size and shape specifiers (SASSes), termed “classifier signs”, to
represent external real-world space (see Figure lc). Classifier constructions
indicate the movement and location of objects in space, and often require precise
representation of visual-spatial relationships within a scene; such explicit lin-
guistic encoding may necessitate the generation of detailed visual images. Unlike
142 K. Emmorey et al
A) Spatially Organized Syntax in ASL
AOOAESSEE ADORESSEE
Qj Q 1 I
AOOAESSEE
B) Fixed and Shifting Frames of Reference
& *____.__-- ---- , *. . f+ *. -. ‘.
_.-- \___--
SEAT SASS (indicating location)
,G!&&ypk&
L I
lv SASS TABLE SASS
C) Sign Space to Represent Real World Space
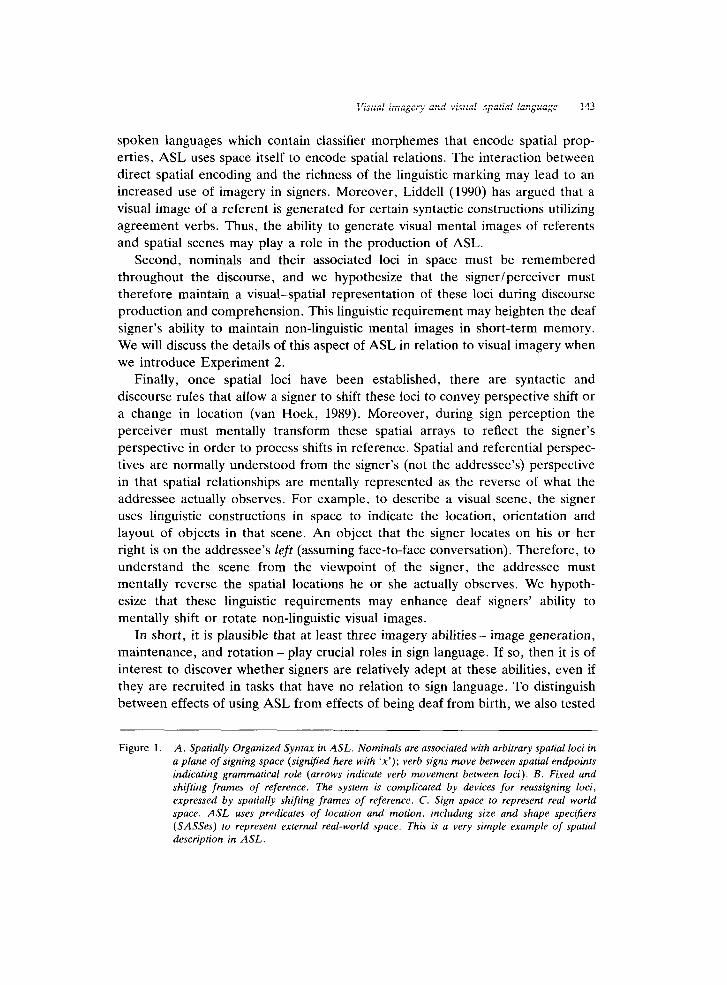
Visual imagery and visual-spatial language 143
spoken languages which contain classifier morphemes that encode spatial prop-
erties, ASL uses space itself to encode spatial relations. The interaction between
direct spatial encoding and the richness of the linguistic marking may lead to an
increased use of imagery in signers. Moreover, Liddell (1990) has argued that a
visual image of a referent is generated for certain syntactic constructions utilizing
agreement verbs. Thus, the ability to generate visual mental images of referents
and spatial scenes may play a role in the production of ASL.
Second, nominals and their associated loci in space must be remembered
throughout the discourse, and we hypothesize that the signer/perceiver must
therefore maintain a visual-spatial representation of these loci during discourse
production and comprehension. This linguistic requirement may heighten the deaf
signer’s ability to maintain non-linguistic mental images in short-term memory.
We will discuss the details of this aspect of ASL in relation to visual imagery when
we introduce Experiment 2.
Finally, once spatial loci have been established, there are syntactic and
discourse rules that allow a signer to shift these loci to convey perspective shift or
a change in location (van Hoek, 1989). Moreover, during sign perception the
perceiver must mentally transform these spatial arrays to reflect the signer’s
perspective in order to process shifts in reference. Spatial and referential perspec-
tives are normally understood from the signer’s (not the addressee’s) perspective
in that spatial relationships are mentally represented as the reverse of what the
addressee actually observes. For example, to describe a visual scene, the signer
uses linguistic constructions in space to indicate the location, orientation and
layout of objects in that scene. An object that the signer locates on his or her
right is on the addressee’s left (assuming face-to-face conversation). Therefore, to
understand the scene from the viewpoint of the signer, the addressee must
mentally reverse the spatial locations he or she actually observes. We hypoth-
esize that these linguistic requirements may enhance deaf signers’ ability to
mentally shift or rotate non-linguistic visual images.
In short, it is plausible that at least three imagery abilities - image generation,
maintenance, and rotation - play crucial roles in sign language. If so, then it is of
interest to discover whether signers are relatively adept at these abilities, even if
they are recruited in tasks that have no relation to sign language. To distinguish
between effects of using ASL from effects of being deaf from birth, we also tested
Figure 1. A. Spatially Organized Syntax in ASL. Nominals are associated with arbitrary spatial loci in
a plane of signing space (signified here with *x’); verb signs move between spatial endpoints
indicating grammatical role (arrows indicate verb movement between loci). B. Fixed and
shifting frames of reference. The system is complicated by devices for reassigning loci,
expressed by spatially shifting frames of reference. C. Sign space to represent real world
space. ASL uses predicates of location and motion, including size and shape specifiers
(SASSes) to represent external real-world space. This is a very simple example of spatial
description in ASL.
144 K. Emmorey et al.
Benton Test of Facial Recognition
54
52
5c
46
46
44
42
40
38
36
34
32
30
I-
-L
Deaf Children, n=42
6 7 8 9 10
Age
Deaf of Deaf vs. Hearing Children
! Deaf
" Hearing
Figure 2a. Deaf signing children show an enhanced ability to discriminate faces.
Visual imagery and visual-spatial language 145
B) Spatial Analysis of Dynamic Point Light Displays
Target Structure Point Light Motion
Grade 1 Hearing Chinese Children
Grade 1 Deaf Chinese Children
Figure 2b. Deaf signers show an enhanced ability to analyze dynamic point light displays. Note the
contrast between deaf and hearing first grade children.
146 K. Emmorey et al.
a group of subjects who are hearing and were born to deaf parents. These
“hearing-of-deaf” (HD) subjects learned ASL as their first language and continue
to use ASL in their daily lives. If the HD signers have abilities like those found
for the deaf signers, this would suggest that differences in visual imagery arise
from the use of a visual language. On the other hand, if HD signers have abilities
like those found for the hearing subjects, this would suggest that differences in
imagery may be due to auditory deprivation from birth, and it would be difficult
to claim that using ASL per se affects imagery.
In addition, it is important to note that the deaf population in the United
States is not linguistically homogeneous. Although most deaf people use ASL as
their primary language, only a small percentage are actually native signers. Native
signers are deaf people who have deaf parents; these people acquired sign
language starting from infancy in a parallel manner to hearing children acquiring a
spoken language (Bellugi, 1988; Newport & Meier, 1985). However, only about
3-8% of deaf people have deaf parents, and thus the majority were born into
families who did not sign and had no language exposure in infancy and early
childhood (Brown, 1986; Schein & Delk, 1974). Deaf individuals with hearing
parents typically learn ASL when they enter a residential school and become
immersed in the language, using it to converse with other deaf children and
adults. In the experiments reported here, we compare native deaf signers to
“non-native” deaf signers, who acquired ASL later in childhood. This comparison
will allow us to determine whether any observed differences in visual imagery
might depend upon very early exposure to sign language.
GENERAL METHOD
Subjects
Forty deaf signers (mean age = 27 years) and 34 hearing non-signers (mean
age = 23 years) volunteered to participate as subjects. Nineteen of the deaf were
native signers of ASL (9 male, 10 female) and 21 were non-native signers (10
male, 11 female). The non-native signers learned ASL between age 2 and 16 (the
mean age of sign acquisition was 8 years), and had been signing for an average of
20 years. The non-native signers were further divided into two groups: “early”
signers (N = 14) who learned ASL between ages 2 and 8 (mean = 4.9 years), and
“late” signers (N = 7) who learned ASL between ages 12 and 16 (mean = 14.5
years). Thirty-four of the 40 deaf signers were deaf from birth, 5 were prelingually
deaf (before age 2), and one became deaf at age 4. Deaf subjects had an average
hearing loss of 9.5 dB in the better ear; a loss of 90 dB or more indicates profound

Visual imagery and visual-spatial language 147
deafness, and even shouted speech cannot be heard (American National Stan-
dards Institute, 1969). ASL was the preferred means of communication for all
deaf signers. Almost all subjects in both groups were right handed, as determined
by self report (35 in the deaf group and 32 in the hearing group).’ The deaf
subjects were tested either at The Salk Institute or Gallaudet University. The
hearing subjects (6 male, 28 female) participated as part of a class project and
were tested at San Diego State University. According to self report, the hearing
subjects had no experience with a signed language and had normal hearing. All
subjects were volunteers, and all were either paid for their participation or
received course credit.
We also included a group of 10 hearing subjects who have deaf parents (HD
signers). These subjects were matched as closely as possible with 10 deaf and 10
hearing subjects for age, education, handedness, and gender. However, although
we were able to match the ages of the HD group (mean age = 33 years) and the 10
deaf signers (mean age = 32.8 years), the HD group tended to be older than the
10 matched hearing subjects (mean age = 25.4 years). All of the HD signers
learned ASL as their first language, although they were also bilingual in English.
All of the HD signers continue to use ASL in their daily lives either as
interpreters for the deaf or through daily contact with their deaf family and
friends.
Most subjects were able to participate in all tasks, but in some cases a subject
only participated in part of the study or was excluded from a task because of a
computer error. For example, several subjects did not perform the image
generation task because of time constraints (the full testing session required over
2 hours). Thus, we report the number of subjects who participated in each of the
tasks. The 10 HD signers participated in all tasks, as did the matched comparison
samples of deaf and hearing subjects.
General method and procedure
The tasks we used have been shown previously to tap different subcomponents of
mental imagery in hearing subjects (Kosslyn, Cave, Provost, & Von Gierke, 1988;
Kosslyn & Dror, 1992; Kosslyn, Margolis, Barrett, Goldknopf, & Daly, 1990).
These tasks not only allow us to assess specific imagery processes, but they also
allow us to tease apart differences in perceptual ability and true differences in
imagery ability. All tasks were presented using a Macintosh computer with
MacLab software (Costin, 1988), and all subjects received the tasks in the same
‘All statistical analyses were also conducted using only the right-handed subjects; the results from
these analyses did not differ from the results reported here.
148 K. Emmorey et al.
order: practice with making yes/no responses, shape memory task, image mainte-
nance (short delay and then long delay), perceptual baseline, image generation,
and mental rotation. We present these tasks in the following three sections: image
generation, image maintenance, and mental rotation.
The practice yes/no task required subjects simply to push a key marked “Y” or
“N” on the keyboard in response to the words “yes” and “no”, which appeared
in the center of the screen. Each word appeared 16 times, in a random order. This
short task familiarized subjects with the computer response keys (b and n) that
would be used for all tasks. The response hand (left/right) and response key
(whether the b key was yes or no) were constant for all tasks, and were
counterbalanced across subjects.
For each task, feedback about accuracy was given only for the practice trials; a
wrong response was signaled auditorily for hearing subjects and visually for deaf
and HD signers. Each task was preceded by 12 practice trials, unless otherwise
noted below. The instructions were given in ASL or English, whichever was the
preferred language of the subject group. For all tasks, the subjects were asked to
respond as quickly as possible while remaining as accurate as possible.
Finally, the trials were presented in a pseudo-random order, with the con-
straint that no more than three consecutive trials could have the same response or
value on any of the independent variables (e.g., no more than three trials in a row
could have stimuli at the greatest level of complexity, the least amount of tilt, and
so on). In addition, the same stimulus could not appear twice within four
consecutive trials. Each task except rotation was presented twice: once with
stimuli in grids and once with stimuli in brackets; each set of stimuli was
presented in a separate block of trials, and the blocks were counterbalanced such
that an equal number of subjects from each group received the grids first or the
brackets first. Detailed descriptions of the remaining aspects of the method and
procedure are provided within each section below.
IMAGE GENERATION
When one creates a visual mental image, a common introspection is that the
object appears as a whole and all at once. In fact, however, the results from
several studies have shown that this is a misconception: visual mental images are
constructed serially from parts (e.g, Kosslyn et al., 1988; Roth & Kosslyn, 1988).
For example, Kosslyn et al. (1988) modified a task developed by Podgorny and
Shepard (1978) so that they could measure the relative time to form images.
Subjects first memorized upper-case block letters that were formed by blackening
sets of cells in 4 x 5 grids, and then were shown a series of grids that contained
only two X marks. A lower-case letter was beneath each of these grids, and the
Visual imagery and visual-spatial language 149
subjects were asked to decide as quickly as possible whether the corresponding
upper-case block letter would cover both of the X marks if it were in the grid. The
crucial aspect of the experiment was that the two probe marks appeared in the
grid only 500 ms after the lower-case cue letter was presented. This was enough
time for subjects to read the cue letter and move their eyes up to the grid, but was
not enough time for the subjects to complete forming the image. Thus, the
response times reflected in part the time to generate the image.
Kosslyn et al. (1988) found that subjects required more time to image shapes
that were composed of more segments in the grid, such as “J” or “G” compared
to “L” or “C”. In addition, by varying the locations of the probe X marks,
Kosslyn et al. discovered that subjects imaged segments in the same order in
which they are drawn. This inference was based on the finding that subjects
required more time to evaluate probes that were located on segments that are
drawn later in the sequence. This result only occurred when the probe marks were
presented before subjects could finish forming the image; if the subjects were
allowed to form the image first, and then the probes were presented, the location
of the probe marks did not affect response times. Thus, the effect of probe
location appears to tap the processes that build up the image a segment at a time,
and not processes that scan over or evaluate the image pattern.,
To investigate the relative skills of deaf and hearing subjects in generating
visual images, we utilized a task similar to that devised by Kosslyn et al. (1988);
we modified this task so that only one X mark appeared, and again varied the
complexity of the letters and the location of the probe marks. This task allows us
to assess the ease with which one activates stored visual information and adds
segments to an image, and hence to compare the ability to generate images per se
by examining the effects of complexity and probe location in the three groups. By
comparing the relative effects of complexity and probe location on response times
and errors, we eliminate the contribution of processes that encode the cue,
encode of the probe mark, make an on/off decision, and generate a response; all
of these processes are held constant across the different levels of complexity and
probe location (for further discussion of the logic, see Kosslyn et al., 1990).
We hypothesized that ASL signers would be better at generating images than
non-signers because the production of certain constructions in ASL may require
one to form detailed mental images. Specifically, the topographic classifier system
of ASL must be used to describe spatial locations of objects and people in
real-world or imagined space. Unlike English, ASL requires spatial relations to be
encoded linguistically and specified explicitly when describing the layout of a
scene. For example, within the classifier system of ASL, it is impossible to sign
“The bed is on the right and the chair on the left” without also specifying the
orientation and location of the bed and chair as well as their relationship to each
other. Spatial information is layered within a sign and produced simultaneously
(see Supalla, 1986 and in press, for a more detailed description). When a signer
150 K. Emmorey et al.
describes a scene, the language appears to require him or her to create a more
detailed mental image compared to an English speaker. English does not demand
the same kind of explicit spatial information to describe a similar scene; indeed,
to be as explicit, several adjunct phrases must be added within each sentence.
Note that spoken languages differ in which aspects of space must be encoded
obligatorily (see Choi & Bowerman, 1991; Jackendoff & Landau, 1991). For
example, some languages require certain aspects of the geometry of paths to be
encoded in the verb, and some languages have obligatory morphemes which
encode size or shape properties of objects. What is unique about ASL is that
space itself is used to mark spatial relationships. Thus, not only does ASL have a
very rich linguistic system for marking spatial relations, but these relations are
directly encoded in space. We argue that what is crucial is the interaction be-
tween what has to be encoded from the referent (when it is in fact spatial) and
how it is encoded in ASL. The richness of the linguistic system and the spatial
encoding may engender more explicit and possibly more frequent mental image
generation.
In addition, Liddell (1990) argues that under certain conditions signers may
imagine referents as physically present, and these visualized referents can be
relevant to the expression of verb agreement morphology. Liddell gives the
following example involving the verb ASK (in this case, articulated toward the
head):
To direct the verb ASK toward an imagined referent, the signer must conceive of the location of
the imaginary referent’s head. For example, if the signer and addressee were to imagine that Wilt
Chamberlain was standing beside them ready to give them advice on playing basketball, the sign
ASK would be directed upward toward the imaged height of Wilt Chamberlain’s head. This is
exactly the way agreement works when a referent is present. Naturally, if the referent is imagined
as laying down, standing on a chair, etc., the height and direction of the agreement verb reflects
this. Since the signer must conceptualize the location of body parts of the referent imagined to be
present, there is a sense in which an invisible body is present. The signer must conceptualize such a
body in order to properly direct agreement verbs. (Liddell, 1990, p. 184)
If deaf subjects are in fact generating visual images prior to or during sign
production, then the speed of forming these images would be important, and we
expect signers to develop enhanced abilities to generate images. Of course, all
ASL discourse does not involve descriptions of spatial scenes or imagined
referents; thus, the influence of this aspect of ASL syntax may not be strong
enough to enhance deaf signers’ ability to generate visual images outside a
linguistic context. The present experiment allows us to investigate this issue.
Finally, we also administered a perceptual task in order to ensure that
differences in the imagery task reflect imagery per se. The perceptual baseline
task was analogous to the imagery task. In this case, a gray shape remained in the
grid when the X mark appeared, and the subjects merely indicated whether the X
was on or off the shape.

Visual imagery and visual-spatial language 151
Method
Subjects
Twenty-four deaf signers (12 native, 12 non-native) and 28 hearing subjects
participated in this experiment. Ten HD signers (matched with 10 deaf signers
and 10 hearing subjects) also participated.
Imagery condition materials
A set of 4 x 5 grids was drawn, and upper-case letters were formed within them
by blackening specific cells. Ten letters were used, five of which (L, C, U, F, H)
contained three or fewer segments in the grid (the simple letters), and five of
which (P, J, 0, S, G) contained four or more segments (the complex letters). The
letters L and 0 were used only for the practice trials in the testing session. All
stimuli were memorized by the subjects prior to the testing session proper.
A second set of stimuli was created. Each stimulus consisted of a 4 x 5 grid that
was empty except for a single X mark. The X mark was created by connecting the
corners of a cell with diagonal lines. Two “yes” and two “no” trials were created
for each letter. For “yes” trials, the probe X mark was placed in a cell that would
have been occupied by the first or second segment of the upper-case letter (an
“early” trial), or the X mark appeared in a cell that would be occupied by the last
or penultimate segment (a “late” trial); for “no” trials, the probe mark was
placed in a cell that was adjacent to one that would be occupied by a letter
segment. The procedure used to determine which letter segments are imaged
early and which are imaged late is described in Kosslyn et al. (1988).* The
corresponding lower-case letter appeared immediately prior to these grids.
Each stimulus was then modified so that the grid lines were removed and only
the four corners of the grid remained visible, as is illustrated in Figure 3. Thus, we
created a new set of 10 upper-case letters for the initial training session, and a
new set of test stimuli. We created this second set of “brackets” materials because
previous research (Kosslyn et al., 1988) has shown that the left cerebral hemi-
sphere of right-handed normal subjects is better able to form images when the
grid lines are intact, whereas the right hemisphere is better able to form images
when the grid lines are removed. Although we did not lateralize stimuli in the
present experiments, if we find differences between deaf and hearing subjects for
the two types of stimuli this might provide an important hint about underlying
differences in processing.
*In previous articles, probe locations were referred to as “near” or “far”. We have changed these
labels to “early” and “late” to describe the sequence of events during image generation more
accurately.
152 K. Emmorey et al.
Perceptual Baseline Grid Condition
no
Bracket Condition
yes
yes
Image Generation
Grid Condition
%
500 nl.%c
Bracket Condition
od
500 rnSBC
no
I- -l
X
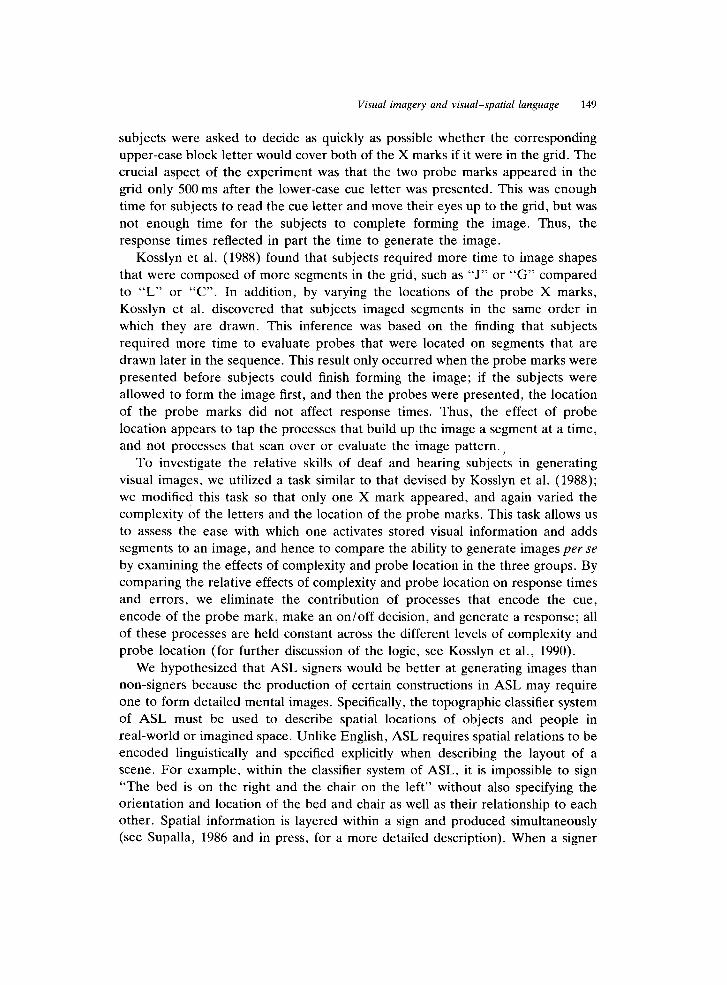
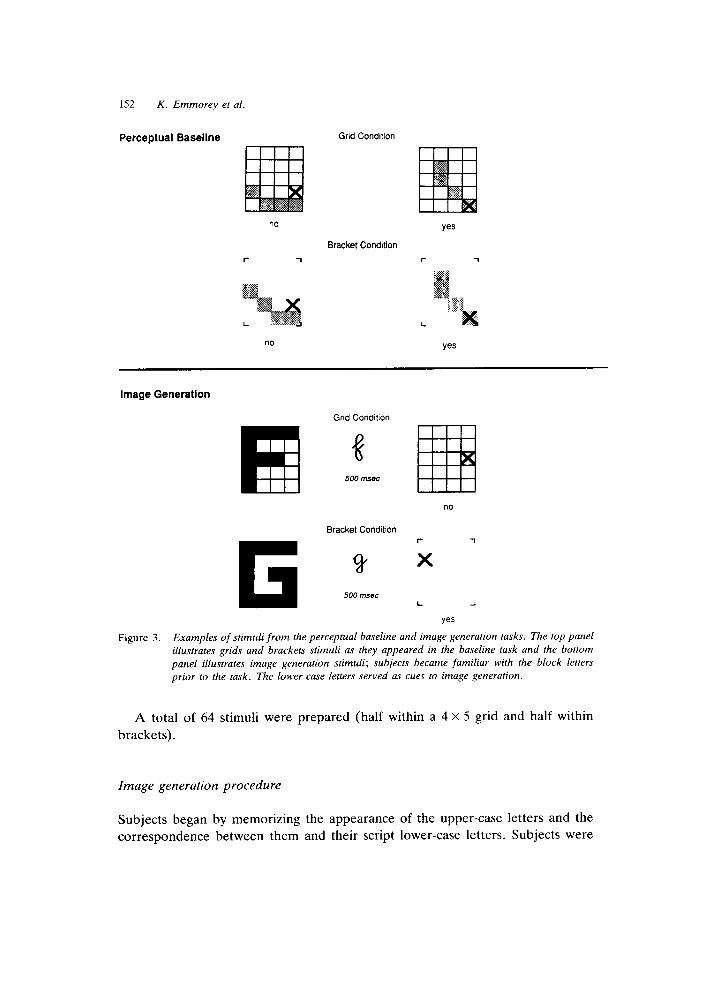
Figure 3. Examples of stimuli from the perceptual baseline and image generation tasks. The top panel
illustrates grids and brackets stimuli as they appeared in the baseline task and the bottom
panel illustrates image generation stimuli; subjects became familiar with the block letters
prior to the task. The lower-case letters served as cues to image generation.
A total of 64 stimuli were prepared (half within a 4 x 5 grid and half within
brackets).
Image generation procedure
Subjects began by memorizing the appearance of the upper-case letters and the
correspondence between them and their script lower-case letters. Subjects were

Visual imagery and visual-spatial language 153
asked to study the upper-case letters, and then were given a blank page with a
grid or set of corner brackets (depending on the block of trials.) A lower-case
script letter was presented in the center of the computer screen, and subjects were
asked to draw the corresponding upper-case letter in the empty grids or brackets.
If the subject made an error, he or she was given the upper-case letter and asked
to study it again. This procedure was repeated until the subjects could draw each
letter correctly from memory.
Following this initial training session, the subjects were given 8 practice trials
and then the test trials. Subjects were first presented with a lower-case script cue
letter (center screen) for 500 ms, followed by a blank screen for 500 ms. A grid (or
set of corner brackets) containing a probe X then appeared. The subjects were to
decide whether the corresponding upper-case letter would cover the X if it were
present in the grid or brackets. After each response, the subject pressed the space
bar to initiate the next trial.
Perceptual baseline condition materials
The materials used in the perceptual task were identical to those used in the
maintenance task (see below), except that the empty grids were now modified so
that the pattern appeared in light gray. The probe X appeared either superim-
posed on the gray shape or off to one side (see Figure 3). A total of 96 stimuli
were presented (half within a 4 X 5 grid and half within brackets).
Perceptual baseline condition procedure
The subject’s task was simply to decide whether the X appeared on or off the
pattern. This task also was used as a baseline for the image maintenance task
described below. All other aspects of the procedure were the same as in the
imagery condition.
Results
Separate analyses of variance (ANOVAs) were conducted for response times and
error rates. Subject group, gender, stimulus type (grid/brackets), complexity, and
probe location were treated as independent variables. Within the deaf group we
also compared native signers and non-native signers (and divided this last group
into early and late signers). For all analyses reported in this article, outliers were
removed prior to the ANOVA. An outlier was defined as a response time that was
two standard deviations from the mean in a given cell for a given subject. This
154 K. Emmorey et al
procedure eliminated less than 5% of the data. All effects and interactions not
mentioned here or in subsequent Results sections were not significant (p > .05 in
all cases). In some cases, however, we will report non-significant results if they
are of particular theoretical interest.
There was no effect of, or interaction with, gender and age of sign acquisition
(native vs. non-native (or early and late) signers), and therefore these variables
were not included in the analyses reported below.
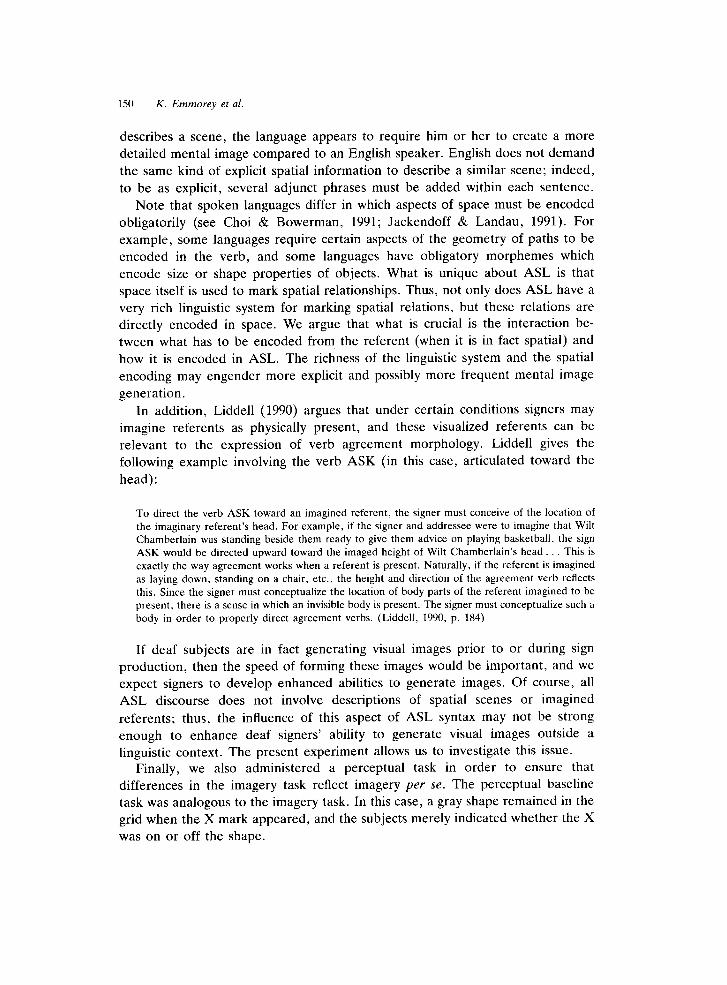
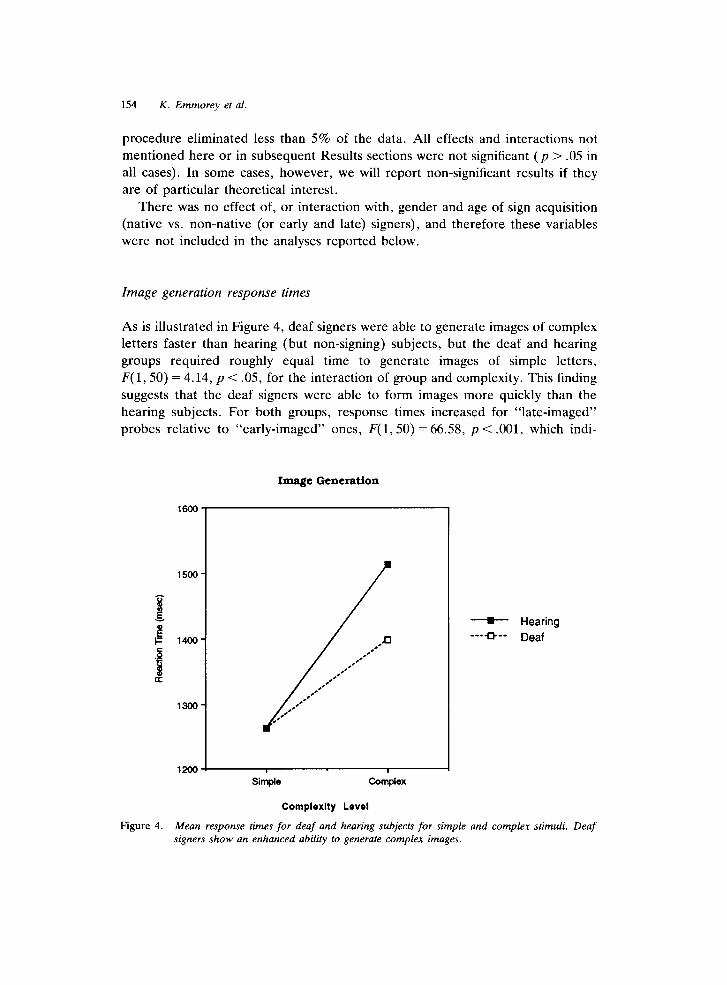
Image generation response times
As is illustrated in Figure 4, deaf signers were able to generate images of complex
letters faster than hearing (but non-signing) subjects, but the deaf and hearing
groups required roughly equal time to generate images of simple letters,
F( 1,50) = 4.14, p < .05, for the interaction of group and complexity. This finding
suggests that the deaf signers were able to form images more quickly than the
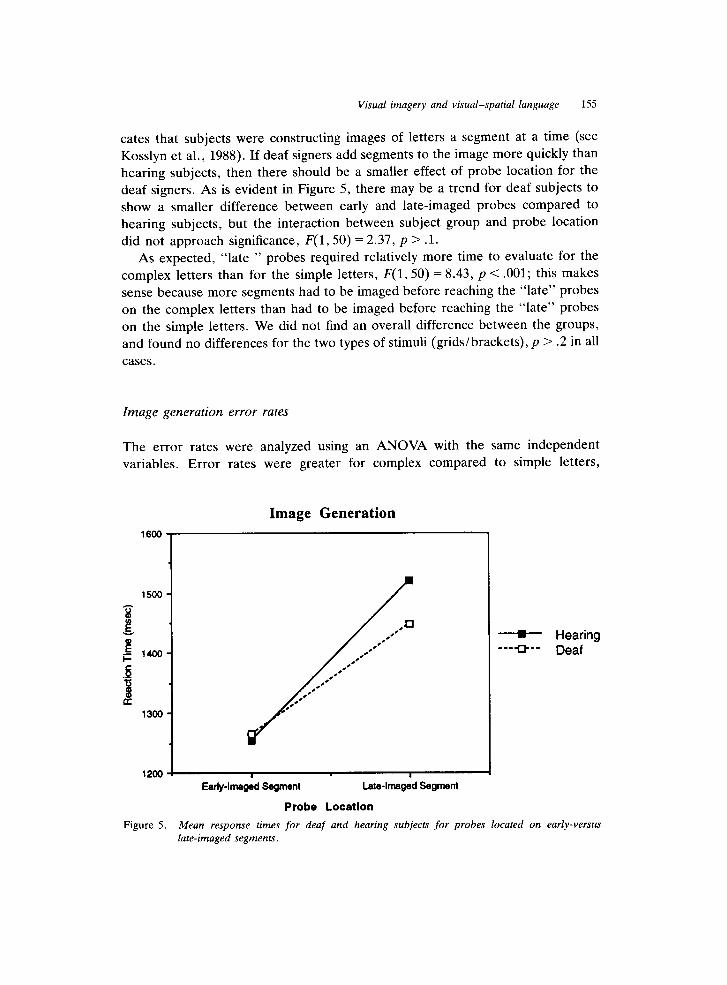
hearing subjects. For both groups, response times increased for “late-imaged”
probes relative to “early-imaged” ones, F( 1,50) = 66.58, p < .OOl, which indi-
Image Generation
1600
1300
1200 1 I
Simple CMlpl~X
Complexity Level
--C- Hearing ___*__ Deaf
Figure 4. Mean response times for deaf and hearing subjects for simple and complex stimuli. Deaf
signers show an enhanced ability to generate complex images.
Visual imagery and visual-spatial language 155
cates that subjects were constructing images of letters a segment at a time (see
Kosslyn et al., 1988). If deaf signers add segments to the image more quickly than
hearing subjects, then there should be a smaller effect of probe location for the
deaf signers. As is evident in Figure 5, there may be a trend for deaf subjects to
show a smaller difference between early and late-imaged probes compared to
hearing subjects, but the interaction between subject group and probe location
did not approach significance, F( 1,50) = 2.37, p > .l.
As expected, “late ” probes required relatively more time to evaluate for the
complex letters than for the simple letters, F(1,50) = 8.43, p < .OOl; this makes
sense because more segments had to be imaged before reaching the “late” probes
on the complex letters than had to be imaged before reaching the “late” probes
on the simple letters. We did not find an overall difference between the groups,
and found no differences for the two types of stimuli (grids/brackets), p > .2 in all
cases.
Image generation error rates
The error rates were analyzed using an ANOVA with the same independent
variables. Error rates were greater for complex compared to simple letters,
Image Generation
1 2 0 0 - E a r l y-I m a g e d Segment Late-Imaged Segment
Probe Location
-+- Hearing __-~--
Deaf
Figure 5. Mean response times for deaf and hearing subjects for probes located on early-versus
late-imaged segments.
1.56 K. Emmorey et al.
F(1,50) = 34.17, p < .OOl, and this was true for both groups, F < 1 for the
interaction of subject group and complexity. Thus, our response time results
cannot be ascribed to a speed-accuracy trade-off. Subjects also made more errors
for the late-imaged probes (mean = 9.8%) than for the early-imaged ones
(mean = 3.5%), F(l,50) = 52.12, p < ,001, and subjects made relatively more
errors on late probes for the more complex letters, F(1,50) = 14.75, p < .OOl, for
the interaction of location and complexity. Unlike the response time data, the
effect of probe location was amplified for the brackets stimuli (with a difference of
8.2% between early and late-imaged probes) compared to the grid stimuli (with a
difference of 4.5%), F(1,50) = 6.80, p < .Ol for the interaction of probe type and
probe location. This difference was the same for both groups, F < 1, for the
interaction of group, stimulus type, and probe location.
Hearing-of-deaf comparison for image generation
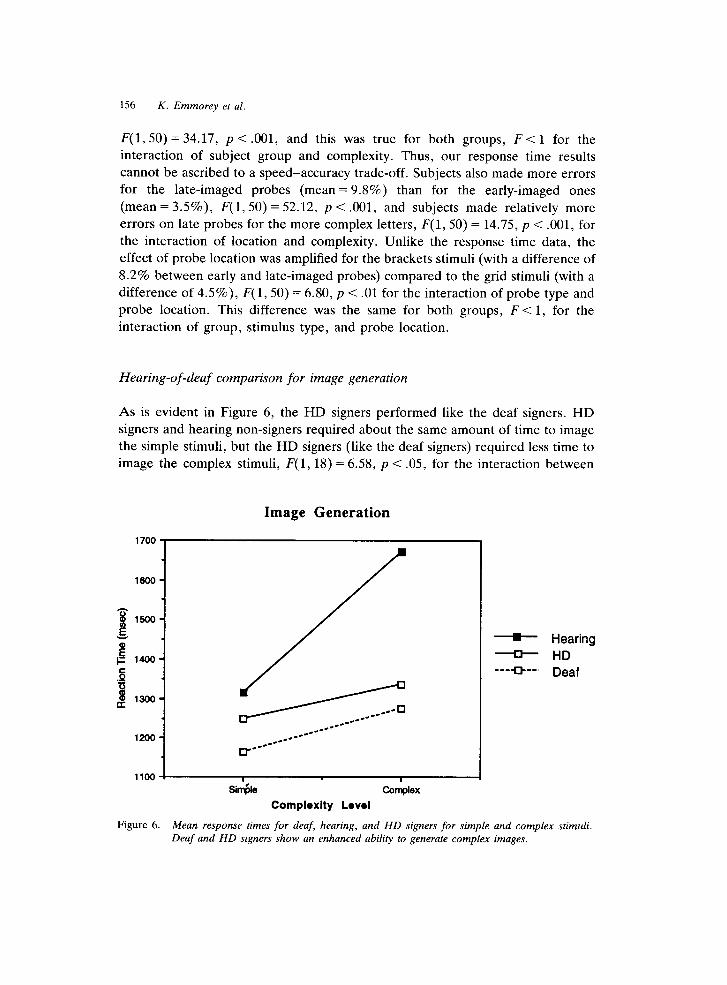
As is evident in Figure 6, the HD signers performed like the deaf signers. HD
signers and hearing non-signers required about the same amount of time to image
the simple stimuli, but the HD signers (like the deaf signers) required less time to
image the complex stimuli, F(1, 18) = 6.58, p < .05, for the interaction between
Image Generation
1700
1600
E
1500
g1400
. j
8 1300
1200-
siIl$le coriplex Complexity Level
--)- Hearing
* HD ___
+I--, Deaf
Figure 6. Mean response times for deaf, hearing, and HD signers for simple and complex stimuli.
Deaf and HD signers show an enhanced ability to generate complex images.
Visual imagery and visual-spatial language 157
complexity and group. HD signers and hearing subjects did not differ in error
rate, F < 1, and thus the difference in response time cannot be due to a
speed-accuracy trade-off. The HD signers did not differ significantly from deaf
signers in any comparison.
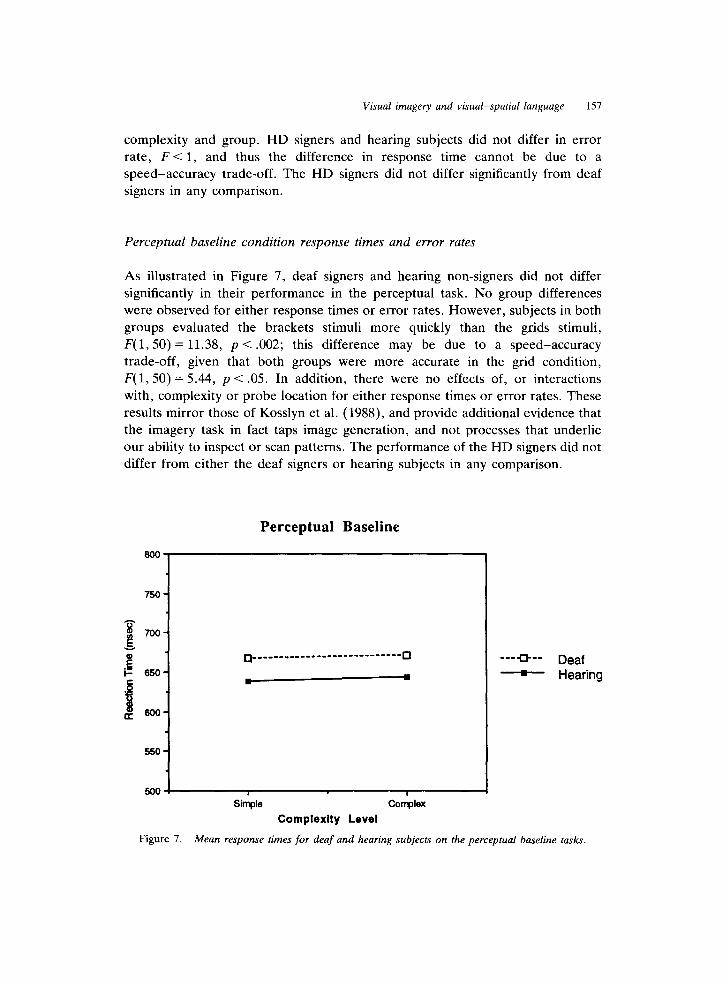
Perceptual baseline condition response times and error rates
As illustrated in Figure 7, deaf signers and hearing non-signers did not differ
significantly in their performance in the perceptual task. No group differences
were observed for either response times or error rates. However, subjects in both
groups evaluated the brackets stimuli more quickly than the grids stimuli,
F(1,50) = 11.38, p < .002; this difference may be due to a speed-accuracy
trade-off, given that both groups were more accurate in the grid condition,
F(1,50) = 5.44, p < .05. In addition, there were no effects of, or interactions
with, complexity or probe location for either response times or error rates. These
results mirror those of Kosslyn et al. (1988), and provide additional evidence that
the imagery task in fact taps image generation, and not processes that underlie
our ability to inspect or scan patterns. The performance of the HD signers did not
differ from either the deaf signers or hearing subjects in any comparison.
Perceptual Baseline
3
%
700 -
E c so-
.8
I K 600-
___ Q-- Deaf
--m-- Hearing
550-
500 . I I
Sir+ CorTplex
Complexity Level
Figure 7. Mean response times for deaf and hearing subjects on the perceptual baseline tasks.
158 K. Emmorey et al.
Discussion
The finding that both deaf and HD signers form relatively complex images faster
than non-signers suggests that experience with ASL may affect image generation
ability. The results from the perceptual task indicate that this difference in
performance was due to a difference in image generation ability, rather than to
differences in scanning or inspection; signers and non-signers did not differ in
their ability to evaluate probe marks when the shape was physically present. The
signing and non-signing subjects were equally accurate, which suggests that
although signers create complex images faster than non-signers, they generate
equally good images. The fact that the HD signers performed like the deaf signers
shows that the enhancement of image generation is not a consequence of auditory
deprivation. Rather, it appears to be due to experience with a visual language.
Deaf and hearing subjects appear to image letters in the same way; both
groups of subjects required more time and made more errors for probes located
on late-imaged segments, and these effects were of comparable magnitude in the
two groups. This finding indicates that neither group of subjects generated images
of letters as complete wholes, and both groups imaged segments in the same
order. The error rates indicated that the effect of probe position was less
pronounced with the grid stimuli than with the bracket stimuli. It is possible that
the grid lines helped the subjects to locate the probe X in relation to the imaged
letter, particularly for late-imaged segments.
One might want to argue that our findings are an artifact of hearing subjects
having more experience with letters. However, there is little reason to expect that
deaf, hearing, and HD subjects have different amounts of practice with written
letters. In particular, there is no reason to expect that hearing people who have
deaf parents (HD signers) have more experience with written letters than hearing
people who do not sign. And yet one would have to make this assumption in
order to explain our results in terms of experience with written letters. In any
event, we wanted to make sure that our results could not be explained by
differences in familiarity with letters, and so we compared the number of errors
that each subject group made when copying the letter stimuli from memory
during training. For example, errors occurred when subjects omitted the “hook”
segment on the lower part of the “J” or extended the lower horizontal segment of
the “F” such that it was the same length as the top segment. There were no group
differences in the number of copying errors: 37% of the deaf subjects made one
or more copying errors, 36% of hearing subjects made one or more errors, and
20% of the HD signers made a copying error.
In short, we found that deaf signers are relatively good at creating complex
mental images. We expected such a result if certain aspects of ASL structure
require mental imagery, and the fact that HD and deaf signers produced similar
results supports this conjecture. It appears that using a visual language facilitates
Visual imagery and visual-spatial language 159
one’s ability to form visual mental images. We hypothesize that the initiation or
“loading” phase of image generation is enhanced for ASL signers, but cannot rule
out the possibility that the process which adds components to create an image is
also enhanced for ASL signers.
IMAGE MAINTENANCE
In this experiment, we investigated the ability of deaf and hearing subjects to
maintain an image in short-term memory. We have reason to hypothesize that
deaf signers may show improved visual short-term memory compared to hearing
subjects. As mentioned in the Introduction, nominals in ASL are associated with
specific spatial loci in signing space. Signers refer to these loci throughout the
discourse, and therefore the association between nominals and their spatial loci
must be maintained in memory over stretches of discourse. These linguistic
memory requirements may enhance non-linguistic visual short-term memory.
However, deaf signers also encode much more information visually compared
to hearing subjects, who can utilize both auditory and visual memory stores. If we
find a difference in performance between these groups, it could be because of the
general reliance on visual memory by deaf signers, in contrast to hearing subjects.
By examining the performance of the HD signers, we can tease apart whether any
observed differences are due to linguistic influences or to an enhanced visual
memory caused by auditory deprivation.
In this task, the subjects first studied a pattern within a grid or within four
corner brackets. After they memorized the pattern, it was removed and an X
probe appeared within the empty grid or brackets. The subjects indicated whether
the X would have fallen on the pattern, were it still present. Thus, the subjects
did not need to retrieve information from long-term memory or generate the
image; they simply needed to retain an image of the pattern in visual short-term
memory. Similarly, ASL signers may retain visual information about linguistic
spatial loci in short-term memory. This ability is not completely analogous to the
non-linguistic image maintenance task presented here between the linguistic
“image” may be somewhat more abstract and may also be transferred to
long-term memory at some point during discourse. However, the task we used
provides a measure of the initial stage in which a visual image must be main-
tained, and it also provides a strong test concerning the degree of overlap
between linguistic and non-linguistic visual processing that is necessary to affect
non-linguistic visual abilities.
In this experiment, we not only varied the complexity of the to-be-retained
pattern, but also varied the time that the subject had to retain the image; the
probe appeared a short (500ms) or long (2500ms) time after the pattern was
removed. Hence, we were able to examine two aspects of image maintenance

160 K. Emmorey et al
capacity: the effects of decay over time and the effects of the amount of material
to be retained.
Finally, we also presented subjects with a memory task that required them to
evaluate the shape of a pattern. Subjects studied one pattern, it was removed, and
shortly thereafter another pattern appeared. The subjects decided whether the
second pattern was the same as the first. This task will allow us to determine
whether the subjects differed in their ability to store the patterns per se.
Method
Subjects
Thirty deaf signers (14 native and 16 non-native signers) and 30 hearing subjects
participated in the maintenance and shape memory tasks. Again, the same 10 HD
signers participated.
Maintenance task materials
As illustrated in Figure 9, nonsense patterns were created by blackening contigu-
ous cells in 4 X 5 grids. The patterns had 1, 2, or 3 perceptual units; a perceptual
unit was defined using the Gestalt laws of good continuation and symmetry. A
l-unit pattern was a vertical or horizontal bar, which varied in length and
position; 2- and 3-unit patterns were composed of distinct clumps of filled cells,
with two clumps touching at a single corner point. The patterns were created so
that each cell of the grid was filled approximately equally often at each level of
complexity. Each pattern was paired with an empty grid, and a single X mark was
placed in the empty grid. For half the grids at each level of complexity, the X
mark would have fallen on the pattern were it present (“yes” trials); for the other
half, it would have fallen in a cell adjacent to a filled cell (“no” trials). A total of
48 grid stimuli were prepared. A second set of 48 stimuli was created by
eliminating the grid lines, leaving only the four corner brackets (as was done in
the image generation task).
Maintenance task procedure
The subjects were asked to study each stimulus, and the computer recorded the
time they spent memorizing the stimuli. When the pattern had been memorized,
subjects pressed the space bar, and the pattern plus the grid (or set of brackets)
disappeared. In one set of trials, a probe mark appeared in an empty grid (or
Visual imagery and visual-spatial language 161
brackets) after 500 ms; in the other set, the probe appeared after 2500 ms. The
subjects decided as quickly as possible whether the X probe would have been
covered by the previous pattern, were it still visible. After each response, the
subjects pressed the space bar to initiate another trial. A total of 192 trials were
presented in four blocks: two with the short delay and two with the long delay;
and one of each of these within grids and one within brackets.
Shape memory task materials
The shapes used in the maintenance task were also used here. However, instead
of being paired with an X probe mark, each pattern was paired with a second
pattern. For half of the stimuli at each level of complexity, the same pattern was
used twice; these were “same” trials. For the other half, the value of one cell was
altered; for half of these, a filled cell was unfilled, and vice versa for the other
half. These were the “different” trials.
Shape memory task procedure
The subjects were first presented with a pattern, which they were to memorize.
When ready, they pressed the space bar and another pattern was presented after a
1 s delay. The subjects decided as quickly as possible whether the second pattern
was the same as the first. A total of 96 stimuli were presented, half in the grid
condition and half in the bracket condition.
Results
Separate ANOVAs were conducted for response times and error rates. Subject
group, gender, stimulus type (grid/bracket), delay (500/2500 ms) , and memory
load (1, 2, or 3 units) were treated as independent variables. Native and
non-native signers (either as a group or divided into early and late signers) were
also compared for the deaf group. In all other respects, the data were analyzed as
in the image generation task. We found no main effect of, or interaction with,
gender or age of sign acquisition; therefore, the data were collapsed across these
variables.
Image maintenance memorization times
Deaf signers took less time to memorize the patterns than hearing subjects,
F(1,58) = 6.48, p < .05 (with means of 997 ms vs. 1388 ms). Both groups took
162 K. E m m o r e y et al.
longer to memorize more complex patterns, F(2,116) = 29.34, p < .OOl, and
longer to memorize stimuli in the long delay condition, F( 1,523) = 11.10, p < .Ol.
Memorization times were not recorded for the shape memory task.
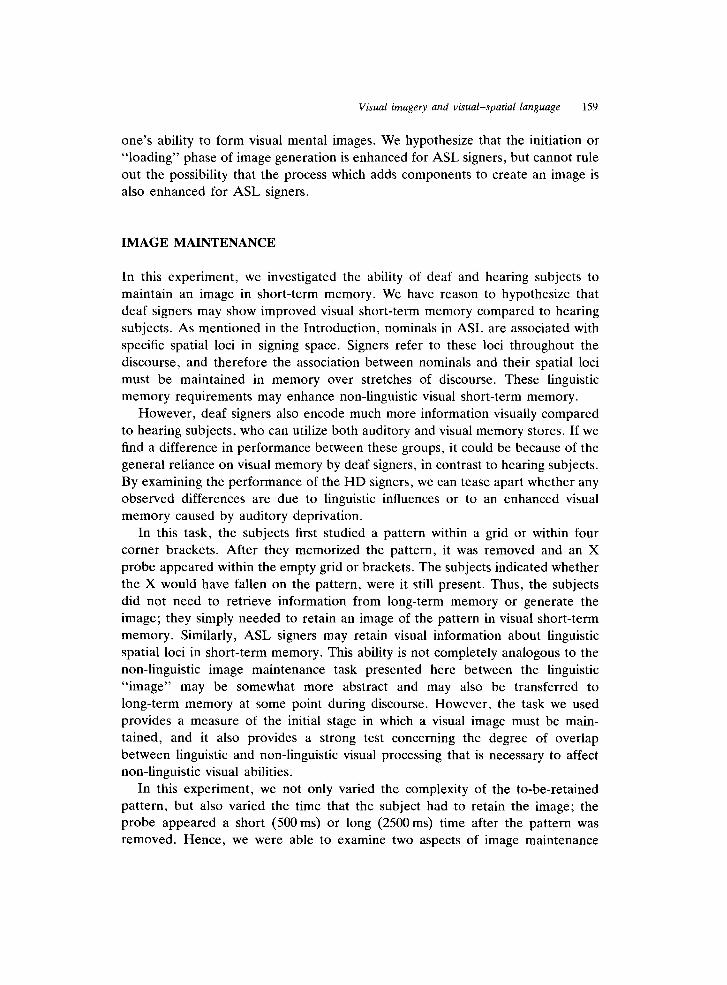
Image maintenance response times
In contrast to the results from the generation task, there were no effects or
interactions that involved subject group in the maintenance task. As is illustrated
in Figure 8, deaf and hearing subjects had very similar response times. We
inferred that results from the generation task reflect the time to activate informa-
tion in long-term memory prior to producing a response; in this task, information
presumably was not stored in long-term memory. The failure to find such effects
was not due to a lack of power. Subjects required more time when they had to
hold the image longer, F( 1,58) = 63.02, p < .OOl, and more time for more
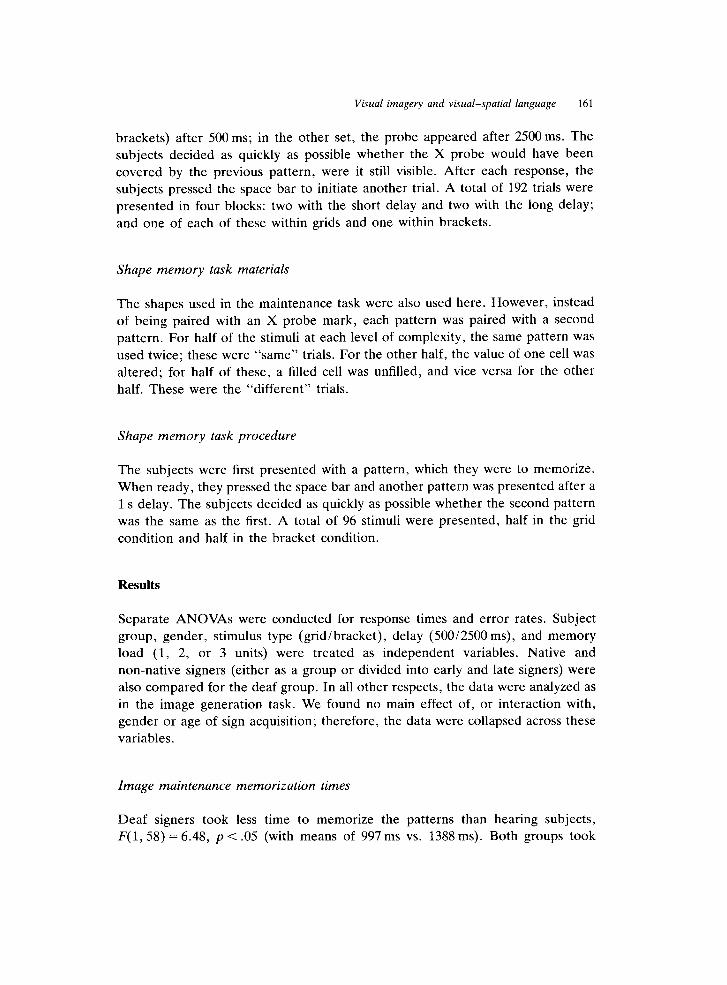
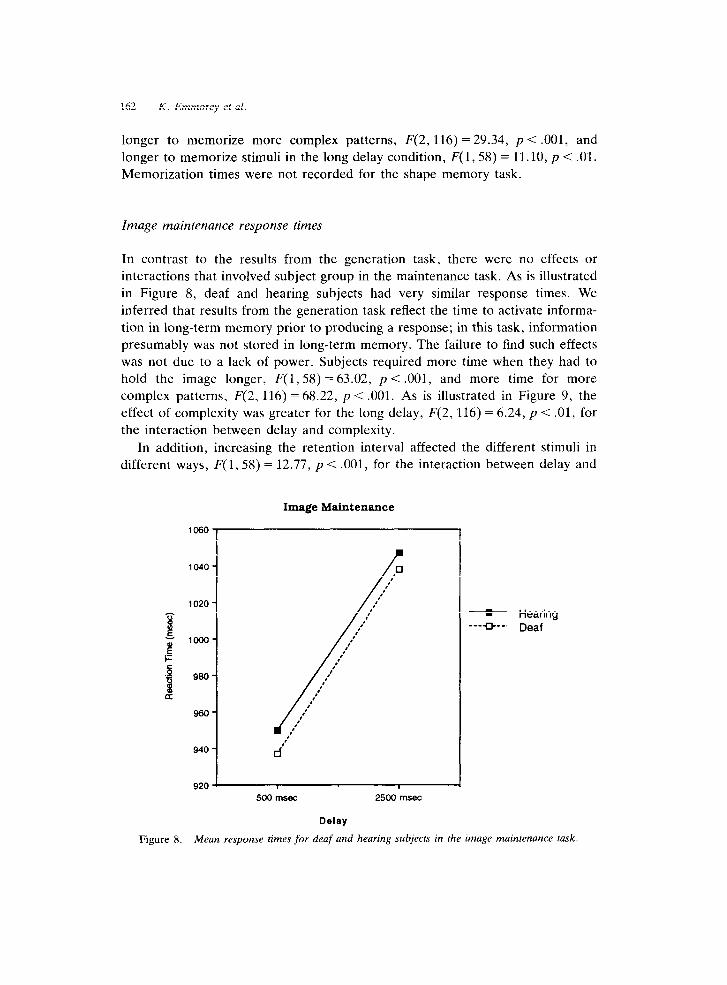
complex patterns, F(2, 116) = 68.22, p < .OOl. As is illustrated in Figure 9, the
effect of complexity was greater for the long delay, F(2, 116) = 6.24, p -=c .Ol, for
the interaction between delay and complexity.
In addition, increasing the retention interval affected the different stimuli in
different ways, F(1,58) = 12.77, p < ,001, for the interaction between delay and
Image Maintenance
Figure 8.
Hearing
Deaf
5oolnsw 2 5 0 0 m .s e c
Mean response times for deaf and hearing subjects in the image maintenance task.
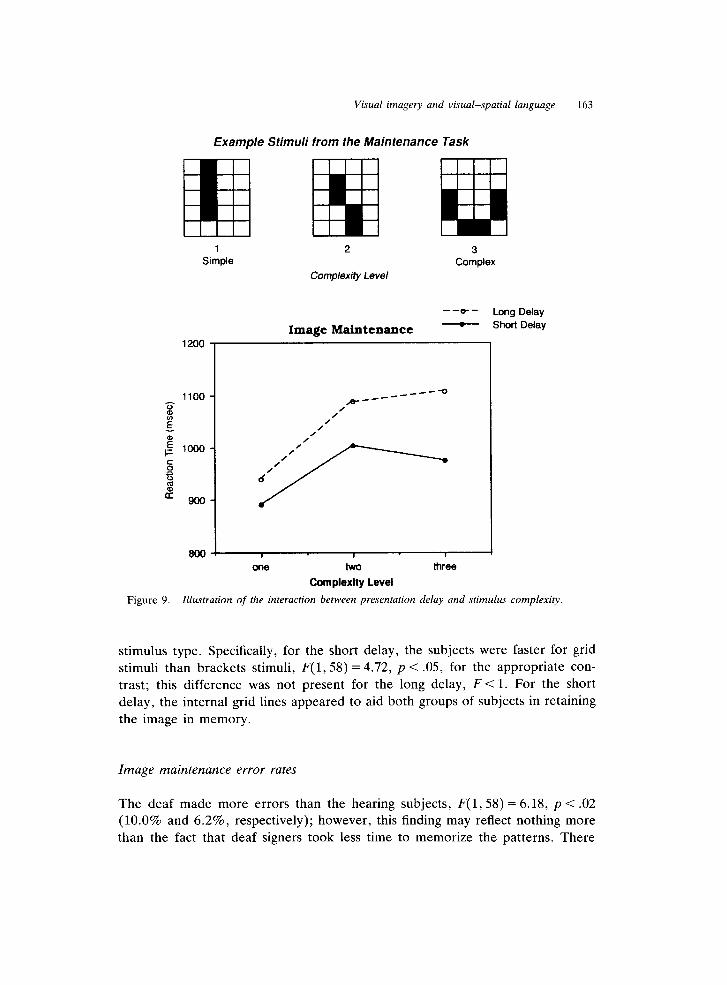
Visual imagery and visual-spatial language 163
Example Stimuli from the Maintenance Task
1
Simple
2
Complexity Level
3
Complex
--*- Long Delay
Image Maintenance - Short Delay
1200 I
800 :
one two three
Complexity Level
Figure 9. Illustration of the interaction between presentation delay and stimulus complexity.
stimulus type. Specifically, for the short delay, the subjects were faster for grid
stimuli than brackets stimuli, F(1,58) = 4.72, p < .05, for the appropriate con-
trast; this difference was not present for the long delay, F < 1. For the short
delay, the internal grid lines appeared to aid both groups of subjects in retaining
the image in memory.
Image maintenance error rates
The deaf made more errors than the hearing subjects, F(l, 58) = 6.18, p < .02
(10.0% and 6.2%, respectively); however, this finding may reflect nothing more
than the fact that deaf signers took less time to memorize the patterns. There
164 K. Emmorey et al.
were no other differences between the subject groups. In addition, there was no
difference between the two delays (F < l), and subjects made more errors with
the complex patterns, F(2,116) = 27.10, p < .OOl. Finally, subjects made more
errors with the bracket stimuli (8.9%) than with the grid stimuli (7.2%),
F(1,58) = 7.28, p < .Ol.
Shape memory response times and error rates
There were no differences between the groups in either response times or error
rates in this task. Both response times, F(2,116) = 9.96, p < .OOl, and error rates,
F(2,116) = 7.09, p < .Ol, increased for the more complex patterns. However,
response times increased with complexity only for the grid stimuli, F(2, 116) =
5.18, p < .Ol, for the interaction of complexity and stimulus type. The mean
response times for the grid stimuli were 821, 880, and 872 ms for l-, 2-, and 3-unit
patterns; for the bracket stimuli the means were 856, 879, and 858 ms for the
same respective levels of complexity.
Hearing-of-deaf comparison for maintenance and shape memory tasks
In contrast to the results from the image generation task, in the maintenance and
shape memory tasks the HD signers responded more like the hearing subjects
than the deaf signers. In the maintenance task, the matched deaf signers required
less time to memorize the stimuli than did the HD signers, F(1,18) = 4.81,
p < .05, and HD and matched hearing subjects did not differ significantly in their
memorization times, F(1, 18) = 1.91, n.s. In addition, HD and hearing subjects
had similar error rates in the maintenance task (4.6% and 5.8%, respectively),
and deaf signers tended to have higher error rates (10.0%); however, the
differences in error rate did not approach significance, F(2,27) = 2.03, p = .15.
On the maintenance task, all subjects required more time to respond,
F( 1,27) = 25.11, p < .OOl , and made more errors, F( 1,27) = 7.05, p < .05, in the
long delay condition. Subjects also required more time, F(2,54) = 37.05,
p < .OOl, and made more errors, F(2,54) = 7.34, p < .Ol, for the more complex
patterns. On the shape memory task, subjects also required more time to
respond, F(2,54) = 5.07, p < .Ol, and made more errors, F(2,54) = 3.56, p < .05,
for complex patterns.
Discussion
Experience with a visual language does not enhance one’s ability to maintain a
pattern in a visual image in the task we examined. In fact, the deaf signers
Visual imagery and visual-spatial language 165
actually made more errors than the hearing subjects and HD signers; however,
these greater error rates may have occurred because the deaf signers took less
time to memorize the patterns. Deaf signers may have had undue confidence in
their ability to perform the task, and therefore spent less time memorizing the
patterns. Our findings suggest that although ASL requires information about
spatial location to be retained in memory during discourse, this linguistic process
does not transfer to a non-linguistic visual image. The overlap between short-term
linguistic and non-linguistic visual image retention does not appear to be enough
to influence non-linguistic visual short-term memory.
We must note, however, that we measured image retention over a relatively
short time (0.5 s and 2.5 s). In ASL discourse, spatial loci must be maintained
over much longer intervals. It is possible that we would have found a difference in
image retention between deaf signers and hearing subjects if we examined spatial
memory over longer periods of time. It is also possible that signers did not show
enhancement for image maintenance because images of referential spatial loci
may not be maintained as visual images but rather are transferred to a more
abstract representation which is not located in visual short-term memory. Further
research into ASL processing and non-linguistic visual memory in deaf and
hearing signers should help to determine the relationship between memory for
non-linguistic visual images and memory for linguistic structure that is visually and
spatially coded.
Our results also indicate that auditory deprivation does not necessarily lead to
enhanced visual memory. This result is consistent with other findings in the
literature. For example, Mills (1985) asked deaf and hearing subjects to view a
visual temporal pattern (a string of Xs, each appearing with a different duration),
and after a 1 s delay to determine whether the timing of a second pattern was the
same or different. There was no difference in the performance of the deaf and
hearing subjects in this task. In addition, Tomlinson-Keasey and Smith-Winberry
(1990) found that although deaf signers were significantly worse than hearing
subjects on the WAIS-R digit span task, the two groups did equally well on a
visual sequential memory task that required them to remember a sequence of
colored lights (the Simon game). Therefore, it appears that deaf signers do not
have enhanced short-term visual memory for information about spatial patterns,
temporal patterns, or sequential order (at least for these types of tasks).
MENTAL ROTATION
Finally, we examined the ability of deaf and hearing subjects to mentally rotate
imaged objects. We used a mental rotation task similar to the one devised by
Shepard and Metzler (1971). They showed subjects pairs of forms created by
166 K. Emmorey et al
juxtaposing cubes to form angular, multi-segment arms, and asked the subjects to
decide whether the two forms were the same regardless of orientation. Response
times in this task increased linearly with the angular disparity of the stimuli
suggesting that subjects had “mentally rotated” one form to match the orientation
of the other before making a comparison (Shepard & Metzler, 1971). Our task
used two-dimensional analogs of the forms used by Shepard and Metzler.
Mental rotation is required when subjects must compare forms that may differ
in subtle ways (Shepard & Cooper, 1982). The most common discrimination is
between a form and its mirror reversal. It was of interest to use this discrimination
in our study for another reason: ASL makes use of “mirror” or reversal
transformations, and hence we hypothesized that deaf signers might be faster at
making these judgments. For example, during sign comprehension, the perceiver
(i.e., the addressee) must mentally reverse the spatial arrays created by the signer
such that a spatial locus established on the right of the signer (and thus on the left
of the addressee) is understood as on the right in the scene being described by the
signer. The scene is normally understood from the signer’s perspective, not the
addressee’s. This problem is not unlike that facing understanders of spoken
languages who have to keep in mind the referent directions “left” and “right”
with regard to the speaker. The crucial difference for ASL is that these and other
spatial relations are encoded spatially by the signer. The spatial loci used by the
signer to depict a scene (e.g., describing the position of objects and people) must
therefore be understood as the reverse of what the addressee actually observes
during discourse (assuming a face-to-face interaction).
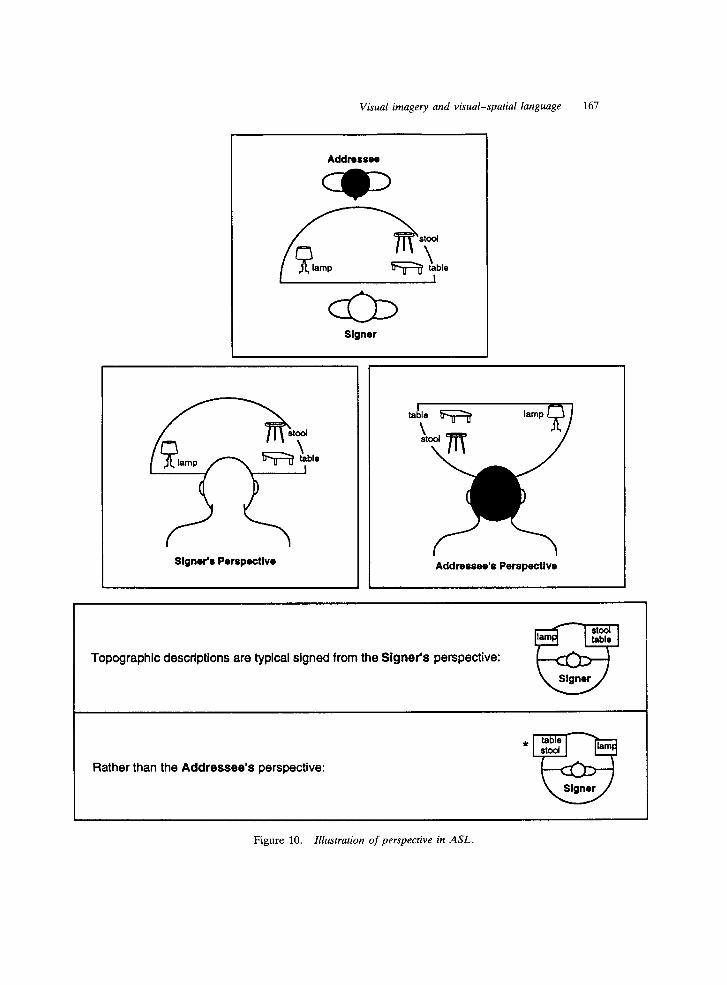
For example, the top of Figure 10 (adapted from Corina, Bellugi, Kritchevsky,
O’Grady-Batch, & Norman, 1990) shows a bird’s_eye view of a typical signer/
addressee relationship in a signed conversation. The signer is describing the
layout of three objects in a room - a lamp is on the signer’s left, a table and stool
are to his or her right, and the table is behind the stool. This description reflects
the signer’s perspective. To understand the relationship between these objects
with respect to the signer, the addressee must mentally transform the signer’s
perspective into his or her own (i.e., how the addressee would view the scene if
he or she were the signer). If the addressee were to repeat the signer’s statement
(e.g., for clarification), the addressee would not copy the signer exactly (e.g.,
using the same spatial loci), but rather would reverse all of the spatial loci so that,
for example, the lamp would be on the addressee’s left (but the signer’s right).
Although the same “absolute” space is often used during discourse (i.e., the
addressee uses the same space as the signer, pointing to the same loci that the
signer established), in the narrative mode the scene is most often understood
from the signer’s viewpoint. Spatial relationships are then mentally represented as
the reverse of what the addressee actually sees.
In fact, in order to understand and process sign, the subject must perceive the
reverse of what they themselves would produce (assuming that both signers are
Visual imagery and visual-spatial language 167
Addressem
Slgnw’s Perspoctivo Addressee’s Perspective
Topographic descriptions are typical signed from the Signer’s perspective:
Rather than the Addressee’s perspective:
Figure 10. Illustration of perspective in ASL.
168 K. Emmorey et al.
right handed). Anecdotally, hearing subjects have great difficulty with this aspect
of learning ASL; they do not easily transform a signer’s articulations into the
reversal that must be used to produce the signs. Given these linguistic require-
ments, we hypothesized that signers might be better than hearing subjects at
making the required reversal judgment at all degrees of rotation, including when
no rotation is necessary.
Method
Subjects
Thirty-four deaf signers (16 native and 18 non-native) and 32 hearing subjects
participated in the experiment. The same 10 HD signers also participated.
Materials
The stimuli were produced by first selecting four or five cells in a 4 x 5 grid (as are
illustrated in Figure 3); these cells formed a single asymmetrical connected shape,
but otherwise were selected at random. All lines that were not part of the outline
of the form were then eliminated, producing stimuli like those illustrated in
Figure 11. Pairs of stimuli were constructed, and one was placed to the left of a
fixation point and the other to the right of this fixation point. The stimulus on the
left was upright (i.e., the longest axis through the stimulus was aligned vertically),
whereas the stimulus on the right was presented at o”, 90”, 13.57, or 180” of
rotation. On half of the trials of each type, the right-hand pattern was mirror
reversed and on half it was normal. The top cell of each stimulus was black, which
helped the subjects to discover the relative orientations of the figures; the subjects
must locate the tops in order to know which direction to rotate most efficiently
(people typically rotate patterns “the short way around”; see Shepard & Cooper,
1982). The two stimuli together subtended about 20” of visual angle. Eight shapes
were created: half with four cells (simple stimuli) and half with five (complex
stimuli). Each shape appeared at each angle and in each lateral orientation, which
resulted in a total of 64 stimuli. Two additional stimuli were created for practice
trials, and a total of 16 practice trials were administered prior to the experiment
proper.
Procedure
An exclamation point appeared at the beginning of each trial, which remained
until the subjects pressed the space bar. The exclamation point then disappeared
Visual imagery and visual-spatial language 169
Same Shape
Target
Target
Mirror Image
0 90
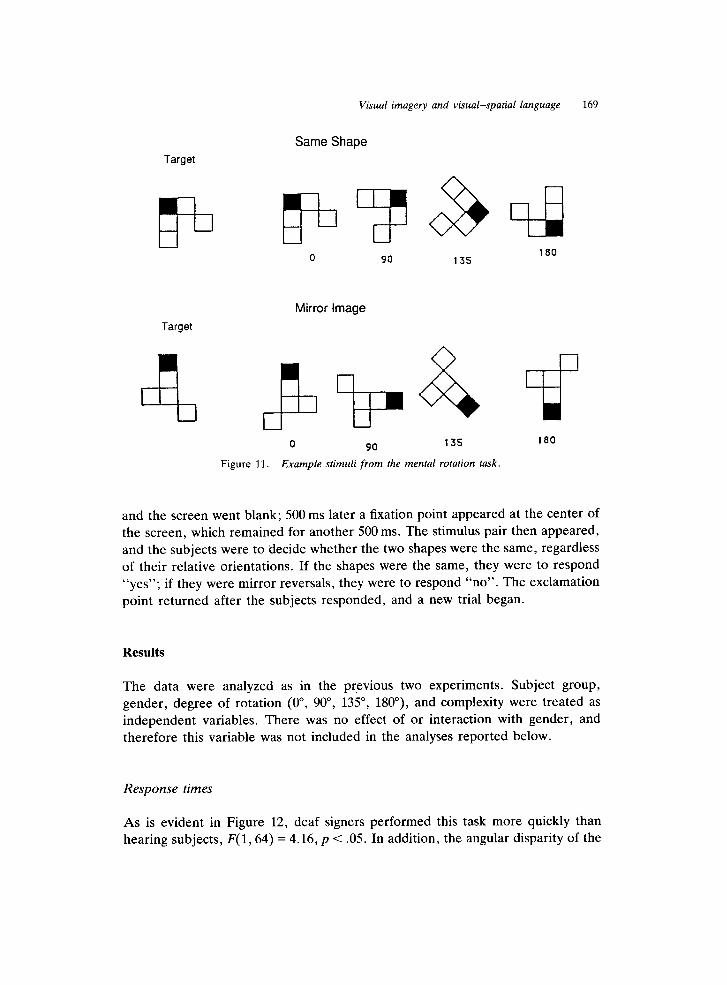
Figure 11. Example stimuli from the mental rotation task.
and the screen went blank; 500 ms later a fixation point appeared at the center of
the screen, which remained for another 500 ms. The stimulus pair then appeared,
and the subjects were to decide whether the two shapes were the same, regardless
of their relative orientations. If the shapes were the same, they were to respond
“yes”; if they were mirror reversals, they were to respond “no”. The exclamation
point returned after the subjects responded, and a new trial began.
Results
The data were analyzed as in the previous two experiments. Subject group,
gender, degree of rotation (O”, 90”, 135”, 180”), and complexity were treated as
independent variables. There was no effect of or interaction with gender, and
therefore this variable was not included in the analyses reported below.
Response times
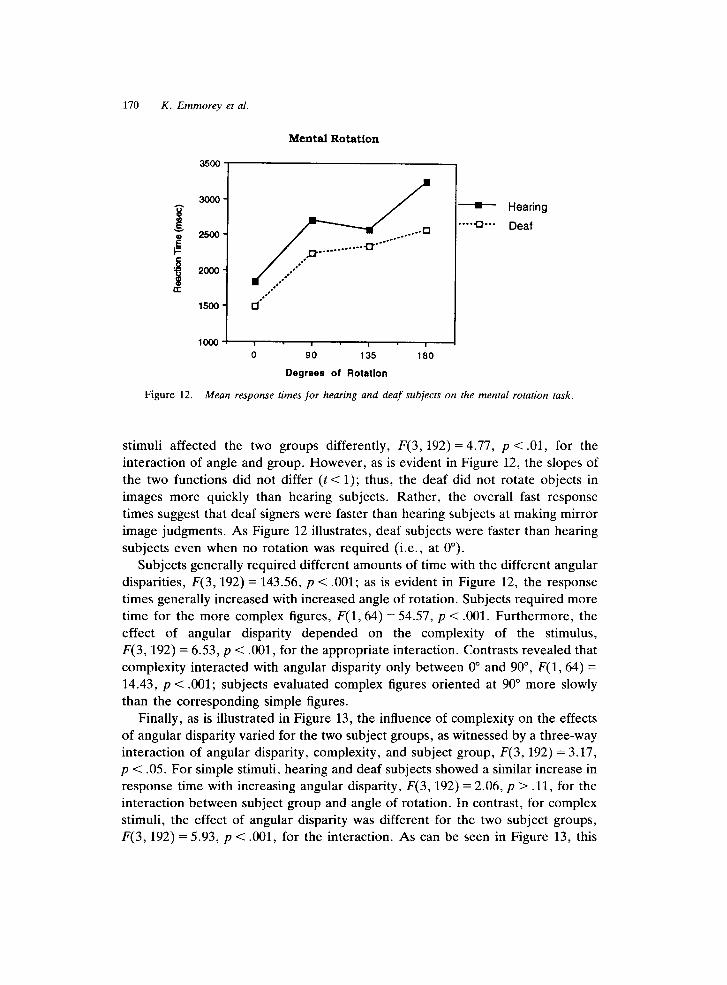
As is evident in Figure 12, deaf signers performed this task more quickly than
hearing subjects, F(1,64) = 4.16, p < .05. In addition, the angular disparity of the
170 K. Emmorey et al.
Mental Rotation
35w1
p
loo0 ! I I I I
0 90 135 180
Degrees of Rotation
-)- Hearing
._.. C+ Deaf
Figure 12. Mean response times for hearing and deaf subjects on the mental rotation task.
stimuli affected the two groups differently, F(3,192) = 4.77, p < .Ol, for the
interaction of angle and group. However, as is evident in Figure 12, the slopes of
the two functions did not differ (t< 1); thus, the deaf did not rotate objects in
images more quickly than hearing subjects. Rather, the overall fast response
times suggest that deaf signers were faster than hearing subjects at making mirror
image judgments. As Figure 12 illustrates, deaf subjects were faster than hearing
subjects even when no rotation was required (i.e., at 00).
Subjects generally required different amounts of time with the different angular
disparities, F(3,192) = 143.56, p < .OOl; as is evident in Figure 12, the response
times generally increased with increased angle of rotation. Subjects required more
time for the more complex figures, F(1,64) = 54.57, p < .OOl. Furthermore, the
effect of angular disparity depended on the complexity of the stimulus,
F(3,192) = 6.53, p < .OOl, for the appropriate interaction. Contrasts revealed that
complexity interacted with angular disparity only between 0” and 90”, F(1,64) =
14.43, p < .OOl; subjects evaluated complex figures oriented at 90” more slowly
than the corresponding simple figures.
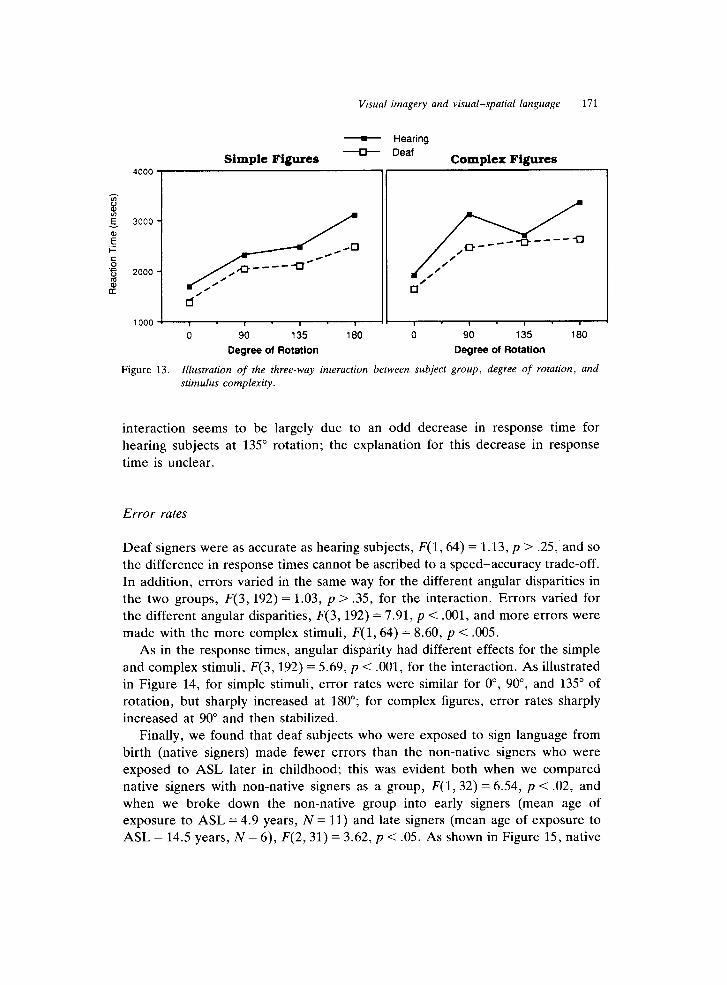
Finally, as is illustrated in Figure 13, the influence of complexity on the effects
of angular disparity varied for the two subject groups, as witnessed by a three-way
interaction of angular disparity, complexity, and subject group, F(3,192) = 3.17,
p < .05. For simple stimuli, hearing and deaf subjects showed a similar increase in
response time with increasing angular disparity, F(3,192) = 2.06, p > .ll, for the
interaction between subject group and angle of rotation. In contrast, for complex
stimuli, the effect of angular disparity was different for the two subject groups,
F(3,192) = 5.93, p < .OOl, for the interaction. As can be seen in Figure 13, this
Visual imagery and visual-spatial language 171
v Hearing
Simple Figures U Deaf
Compler Figures
4ooo Iii
1000 . 1 I I 8 I 1 I I
0 90 135 180 0 90 135 180
Degree of Flotation Degree of Rotation
Figure 13. Illustration of the three-way interaction between subject group, degree of rotation, and
stimulus complexity.
interaction seems to be largely due to an odd decrease in response time for
hearing subjects at 135” rotation; the explanation for this decrease in response
time is unclear.
Error rates
Deaf signers were as accurate as hearing subjects, F( 1,64) = 1.13, p > .25, and SO
the difference in response times cannot be ascribed to a speed-accuracy trade-off.
In addition, errors varied in the same way for the different angular disparities in
the two groups, F(3,192) = 1.03, p > .35, for the interaction. Errors varied for
the different angular disparities, F(3,192) = 7.91, p < .OOl, and more errors were
made with the more complex stimuli, F(1,64) = 8.60, p < .005.
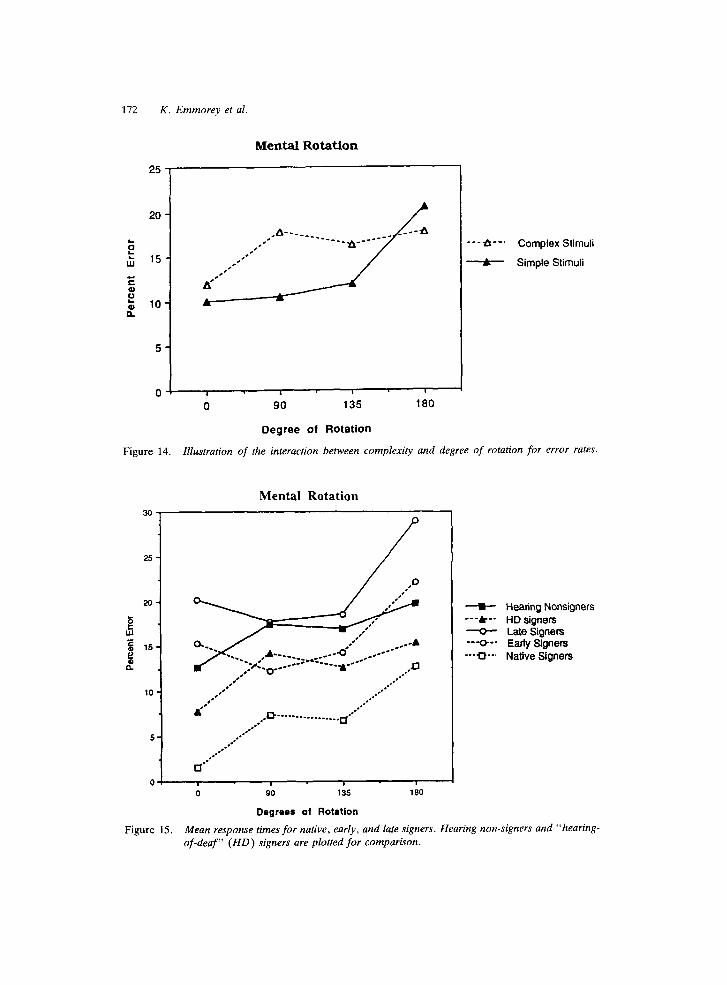
As in the response times, angular disparity had different effects for the simple
and complex stimuli, F(3,192) = 5.69, p < .OOl, for the interaction. As illustrated
in Figure 14, for simple stimuli, error rates were similar for o”, 90”, and 135” of
rotation, but sharply increased at 180”; for complex figures, error rates sharply
increased at 90” and then stabilized.
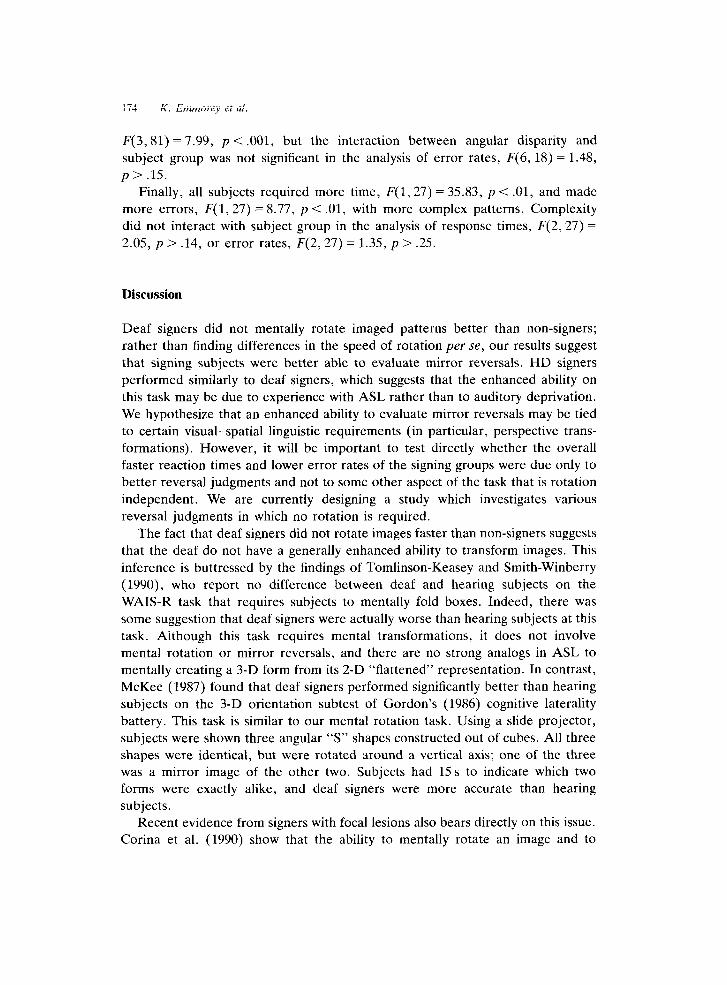
Finally, we found that deaf subjects who were exposed to sign language from
birth (native signers) made fewer errors than the non-native signers who were
exposed to ASL later in childhood; this was evident both when we compared
native signers with non-native signers as a group, F(1,32) = 6.54, p < .02, and
when we broke down the non-native group into early signers (mean age of
exposure to ASL = 4.9 years, N = 11) and late signers (mean age of exposure to
ASL = 14.5 years, N = 6), F(2,31) = 3.62, p < .05. As shown in Figure 15, native
172 K. Emmorey et al.
25
20
2
= w 15
E
0” t 10 P
5
0 l-
Mental Rotation
I I I I
0 90 135 180
---it--. Complex Stimuli
--f- Simple Stimuli
D e gr e e of R o t a t i o n
Figure 14. Illustration of the interaction between complexity and degree of rotation for error rates.
Mental Rotation
2 5 -
-t- Hearing Nonsigners _--&-_. HD signers
-O-- Late Signers
---O-- Early Signers
---i3- Native Signers
0 . I I I I ,
0 Q O 1 3 5 1 3 0
Degrees of Rotstion
Figure 15. Mean response times for native, early, and late signers. Hearing non-signers and “hearing-
of-deaf” (HD) signers are plotted for comparison.

Visual i ~agery and visual-spatial language 173
signers made fewer errors compared to both early signers, F(l, 26) = 4.85,
p < .05, and late signers, F(1,21) = 8.06, p < .Ol; the difference between early
and late signers was not significant (F < 1). The results from hearing non-signers
and HD signers are shown in Figure 15 as a comparison. There were no
interactions with age of sign acquisition, and the lower error rates for the native
signers were not due to a speed-accuracy trade-off because native and non-native
signers did not differ in reaction time, F(l, 32) = 1.29, p > .25.
Hearing-of-deaf comparison for mental rotation
As illustrated in Figure 16, HD signers responded like the deaf signers. In an
ANOVA including all three groups, there was clear evidence that the groups
differed, F(2,27) = 3.48, p < .05. Planned comparisons revealed that the deaf and
HD signers did not differ in their time to mentally rotate figures, F < 1, whereas
HD signers were faster than the hearing non-signers, F(l, 18) = 4.60, p < .05.
Again, this difference is not due to a speed-accuracy trade-off; we found no
differences in error rates between subject groups, F < 1 (note that the matched
group of deaf subjects included both native and non-native signers).
All subjects required different amounts of time with the increasing angular
disparity, F(3,Sl) = 67.70, p < .OOl. In addition, angular disparity interacted with
subject group, F(6, 81) = 3.04, p < .Ol. Again, this interaction may be due to the
odd decrease in response time for hearing subjects at 135” rotation.
Subjects also had different error rates depending upon the angular disparity,
Mental Rotation
w Hearing
* HD __-~__
Deaf
; 9b 1;s A Degree ot Rotatlon
Figure 16. Mean response times for hearing signers, “hearing-of-deaf” (HD) signers, and hearing
non-signers.
174 K. Emmorey et al.
F(3,Sl) = 7.99, p < .OOl, but the interaction between angular disparity and
subject group was not significant in the analysis of error rates, F(6,lS) = 1.48,
p > .15.
Finally, all subjects required more time, F(1,27) = 35.83, p < .Ol, and made
more errors, F(1,27) = 8.77, p < .Ol, with more complex patterns. Complexity
did not interact with subject group in the analysis of response times, F(2,27) =
2.05, p > .14, or error rates, F(2,27) = 1.35, p > .25.
Discussion
Deaf signers did not mentally rotate imaged patterns better than non-signers;
rather than finding differences in the speed of rotation per se, our results suggest
that signing subjects were better able to evaluate mirror reversals. HD signers
performed similarly to deaf signers, which suggests that the enhanced ability on
this task may be due to experience with ASL rather than to auditory deprivation.
We hypothesize that an enhanced ability to evaluate mirror reversals may be tied
to certain visual-spatial linguistic requirements (in particular, perspective trans-
formations). However, it will be important to test directly whether the overall
faster reaction times and lower error rates of the signing groups were due only to
better reversal judgments and not to some other aspect of the task that is rotation
independent. We are currently designing a study which investigates various
reversal judgments in which no rotation is required.
The fact that deaf signers did not rotate images faster than non-signers suggests
that the deaf do not have a generally enhanced ability to transform images. This
inference is buttressed by the findings of Tomlinson-Keasey and Smith-Winberry
(1990)) who report no difference between deaf and hearing subjects on the
WAIS-R task that requires subjects to mentally fold boxes. Indeed, there was
some suggestion that deaf signers were actually worse than hearing subjects at this
task. Although this task requires mental transformations, it does not involve
mental rotation or mirror reversals, and there are no strong analogs in ASL to
mentally creating a 3-D form from its 2-D “flattened” representation. In contrast,
McKee (1987) found that deaf signers performed significantly better than hearing
subjects on the 3-D orientation subtest of Gordon’s (1986) cognitive laterality
battery. This task is similar to our mental rotation task. Using a slide projector,
subjects were shown three angular “S” shapes constructed out of cubes. All three
shapes were identical, but were rotated around a vertical axis; one of the three
was a mirror image of the other two. Subjects had 15 s to indicate which two
forms were exactly alike, and deaf signers were more accurate than hearing
subjects.
Recent evidence from signers with focal lesions also bears directly on this issue.
Corina et al. (1990) show that the ability to mentally rotate an image and to

Visual imagery and visual-spatial language 175
understand perspective shift in ASL are linked. The patient they studied, D.N.,
was a young hearing signer (age 35) who was exposed to ASL early in life. Her
father was a native signer, and D.N. grew up with her deaf grandmother; she is
currently a certified interpreter for the deaf. D.N. suffered damage to the mesial
superior occipital-parietal area of the right hemisphere. The lesion was caused by
surgical evacuation of a parietal-occipital hematoma and an arteriovenous mal-
formation. D.N. was not aphasic for English or ASL. Tests of both English and
ASL phonology, morphology, and syntax revealed no linguistic deficits. Linguistic
analysis of her spontaneous signing revealed flawless use of the spatially organized
syntax of ASL at the sentential level. However, there was one specific area in
which she exhibited some problems: topological descriptions and perspective
shift.
As described earlier, topographic relationships are signed in relation to the
signer’s perspective. Corina et al. (1990) present evidence that this process is
disrupted in D.N. In contrast to normal signers, D.N. preferred topographic
descriptions signed in relation to her own frame of reference. That is, in the
example in Figure 10, if D.N. were the addressee she would prefer that the signer
describe the scene from her (D.N.‘s) perspective rather than from the signer’s
perspective. In this way, D.N. avoids the mental transformation required to alter
the signer’s perspective into her own. However, this type of description (from the
addressee’s perspective) is completely unnatural and marked in ASL.
The nature of D.N.‘s deficit was illuminated by the results of a paper-
and-pencil version of the mental rotation and image generation tasks described
here. On the image generation test, her score was nearly identical to the mean for
normal deaf signers. However, on the mental rotation task, she showed marked
impairment. Her score fell nearly two standard deviations below the mean for
normal deaf signers. The fact that she showed impairment on mental rotation
within the linguistic domain (perspective shift) and on a non-linguistic mental
rotation task suggests that these two abilities are associated.
Finally, native signers detected mirror reversals more accurately than subjects
who acquired ASL later in childhood. Is this increased accuracy due to practice
effects or to the fact that native signers began acquiring ASL from birth?
Although the late signers had been using ASL as their primary language for a
shorter period of time than native signers (a mean number of 13 years of signing
experience compared to 25 years for native signers), native and early signers had
roughly the same amount of practice with ASL (a mean number of 23 compared
to 25 years of experience for early and native signers, respectively). The fact that
native and early signers did not differ in the number of years of signing practice
suggests that the increased accuracy of native signers was due to exposure to a
visual-spatial language from birth. However, as Figure 15 shows, HD signers,
who were also exposed to ASL from birth, had error rates similar to the early
signers rather than to the native signers. This result suggests that it is the

176 K. Emmorey et al.
combination of auditory deprivation and exposure to a signed language from birth
that results in an enhanced ability to make accurate judgments of mirror reversal.
In summary, our results suggest that deaf and HD signers judge mirror reversal
faster than hearing subjects. These results, in conjunction with those in the
literature, suggest that signers do not show an overall enhancement of the ability
to transform mental images; rather, enhancement may be restricted to mental
rotation or mental reversals. We hypothesize that experience with shifting spatial
arrays and transforming perspectives in a visual-spatial language leads to this
superior performance.
GENERAL DISCUSSION
ASL signers are better than non-signers in specific aspects of visual mental
imagery. Indeed, we found that both deaf and hearing signers have an enhanced
ability to generate visual mental images; we also found that they were better able
to detect mirror reversal. In contrast, there were no group differences in the
ability to retain information in images for brief periods of time or to imagine
objects rotating. Signers’ enhanced visual imagery abilities may be tied to specific
linguistic requirements (e.g., referent visualization, perspective transformations).
As noted in the Introduction, although deaf signers use ASL as their primary
language in adulthood, they were first exposed to the language at varying points
in their lives. In each of our experiments, we addressed the question of whether
differences in visual imagery depended upon early exposure to sign language. The
age at which sign language was acquired did not influence signers’ ability to
generate mental images or to maintain an image in memory. However, native
signers were more accurate than non-native signers in the mental rotation task,
but both groups were faster than hearing non-signers in this task. Table 1 presents
summary data for response times and error rates for each of the three experi-
ments for native, early, and late signers and for hearing non-signers. The age of
exposure to sign language had only a small effect on non-linguistic visual imagery
abilities (affecting only accuracy on one task); in contrast, late exposure to
language has a very large effect on adult linguistic competence and processing.
For example, Newport and her colleagues have found that the later in life one
acquires sign language, the poorer is one’s grasp of its grammar (Newport, 1988,
1990, 1991; Newport & Supalla, 1990). Emmorey and her colleagues have found
similar results for on-line ASL processing (Emmorey, 1991; Emmorey, Bellugi,
Friederici, and Horn, 1992; Emmorey & Corina, 1990). These differences in
grammatical knowledge and processing were not due to practice effects; the
subjects had been signing for an equal number of years (generally, over 20 years).
Similarly, the increased accuracy of native signers on the mental rotation task
cannot be attributed to greater practice in signing. Rather, the maturational state

Table
1.
Mea
n
rea
ctio
n
tim
es (
ms)
a
nd
er
ror
rate
s (%
) fo
r th
e d
eaf
sub
ject
gr
ou
ps
an
d
hea
rin
g
no
n-s
ign
ers
for
Exp
erim
ents
1-
3
Ima
pe
Pen
era
tio
n
Subje
ct
gro
up
Sim
ple
st
imuli
C
om
ple
x
stim
uli
Nat
ive
signer
s 1345
(4%
) 1492
(7%
)
Ear
ly
signer
s 1350
(5%
) 1433
(13%
)
Lat
e si
gner
s 1197
(2%
) 1006
(8%
)
Hea
ring
non-s
igner
s 1262
(10%
) 1536
(4%
)
Ima
ge
ma
inte
na
nce
Subje
ct
gro
up
Nat
ive
signer
s
Ear
ly
signer
s
Lat
e si
gner
s
Hea
ring
non-s
igner
s
Men
tal
rota
tio
n
Short
del
ay
Long
del
ay
981(8
%)
1089
(8%
)
996
(14%
) 1048
(12%
)
834
(8%
) 917
(9%
)
9.5
0 (
6%
) 1047
(6%
)
Deg
rees
ro
tati
on
Subje
ct
gro
up
0
90
135
180
Nat
ive
signer
s 1436
(2%
) 2023
(7%
) 2209
(7%
) 2454
(13%
)
Ear
ly
signer
s 1587
(15%
) 2614
(12%
) 2558
(14%
) 2805
(22%
)
Lat
e si
gner
s 1500
(20%
) 2230
(18%
) 2245
(19%
) 2323
(29%
)
Hea
ring
non-s
igner
s 1795
(13%
) 2702
(17%
) 2575
(17%
) 3210
(20%
)

178 K. Emmorey et al.
of the brain at the time of exposure to signing may play a critical role in the way
signing affects adult visual processing. Furthermore, early auditory deprivation
appears to play a supplementary role in altering adult performance for this
non-linguistic visual task. HD signers (who are also native signers, exposed to
ASL from birth) were no more accurate on this task than hearing non-signers,
which suggests that native signers’ proficiency in detecting mirror reversals was
due to the combination of early deafness and exposure to ASL from birth. Many
researchers have argued that both the visual system (e.g., Hubel & Wiesel, 1963;
Sperry, 1951) and language (e.g., Curtiss, 1977; Lenneberg, 1967) have critical
periods for normal development. The populations of deaf and hearing individuals
studied here can provide unique insights into how these systems might interact
during maturation and how early experience can differentially affect adult cog-
nition.
In conclusion, these experiments reported here are a first exploration of how a
visual-spatial ability within one functional domain (language) may exert an
influence on a visual-spatial ability within a different functional domain
(imagery). Overall, our results indicate that deaf and hearing signers show
selective enhancement of certain visual abilities that may be recruited for ASL
processing. Our results are particularly interesting with respect to Fodor’s “modu-
larity of mind” hypothesis (Fodor, 1983). Fodor argues that linguistic processes
are “encapsulated” - insulated from other types of processes. Our findings sug-
gest that the processing that underlies one sort of human language is not entirely
modular. Image generation and reversal transformation appear to be deeply
embedded in using ASL, and these are not peripheral processes that must
obviously be involved in both visual imagery and ASL. Note that our results
indicate that visual imagery is involved in the processing of ASL; imagery may or
may not be related to the principles that underlie ASL grammar. The grammar of
ASL has been shown to conform to principles of universal grammar (see, for
example, Lillo-Martin, 1987/1990), and we may find that the principles that
underlie natural human language may be autonomous and not shared by other
cognitive modules. Nonetheless, our results indicate that central aspects of ASL
processing are not domain specific and are not insulated from other types of visual
processing. As Fodor himself has pointed out, the notion of modularity ought to
admit of degrees (Fodor, 1983, p. 37). In this article, we have presented evidence
for limits on the degree of modularity for human language processing and thus
constrained the theory of cognitive modularity.
References
American National Standards Institute (1969). American national standard specifications for audiome-
ters (ANSI S.6-1969). New York: American National Standards Institute.
Visual imagery and visual-spatial language 179
Bellugi, U. (1980). The structuring of language: Clues from the similarities between signed and
spoken language. In U. Bellugi & M. Studdert-Kennedy (Eds.), Signed and spoken language:
Biological constraints on linguistic form (pp. 115-140). WeinheimiDeerfied Beach, FL: Verlag
Chemie
Bellugi, U. (1988). The acquisition of a spatial language. In F. Kessel (Ed.), The development of
language and language researchers. Essays in honor of Roger Brown. Hillsdale, NJ: Erlbaum.
Bellugi, U., O’Grady, L., Lillo-Martin, D., O’Grady, M., van Hoek, K., & Corina, D. (1990).
Enhancement of spatial cognition in deaf children. In V. Volterra & C. Erting (Eds.), From
gesture to language in hearing and deaf children (pp. 278-298). New York: Springer-Verlag.
Bellugi, U., Poizner, P., & Klima E. (1989). Language, modality, and the brain. Trends in
Neurosciences 10, 380-388.
Bettger, J. (1992). The effects of experience on spatial cognition: Deafness and native knowledge of
ASL. Unpublished doctoral dissertation, University of Illinois, Urbana-Champaign, IL,
Brown, S. (1986). Etiological trends, characteristics. and distributions. In A. Schildroth & M.
Karchmer (Eds.), Deaf children in America. San Diego, CA: College-Hill Press.
Choi, S., & Bowerman, M. (1991). Learning to express motion events in English and Korean: The
influence of language-specific lexicalization patterns. Cognition, 41, 83-121.
Corina, D., Bellugi, U., Kritchevsky, M., O’Grady-Batch, L., & Norman, F. (1990). Spatial relations
in signed versus spoken language: Clues to right parietal functions. Paper presented at the
meeting of the Academy of Aphasia, Baltimore, MD.
Costin, D. (1988). MacLab: A Macintosh system for psychology labs. Behavior Research Methods,
Instruments, and Computers, 20(20), 197-200.
Coulter, G. (1979). American Sign Language Typology. Unpublished doctoral dissertation, University
of California, San Diego, CA.
Curtiss, S. (1977). Genie: A psycholinguistic study of a modern day “wild child”. New York:
Academic Press.
Emmorey, K. (1991). Repetition priming with aspect and agreement morphology in American Sign
Language. Journal of Psycholinguistic Research, 20(5), 365-388.
Emmorey, K., Bellugi, U., Friederici, A., & Horn, P. (1992). Effects of age of acquisition on
grammatical sensitivity: Evidence from on-line and off-line tasks. Language and Cognitive
Processes, manuscript under review
Emmorey, K., & Corina, D. (1990). Lexical recognition in sign language: Effects of phonetic structure
and morphology. Perceptual and Motor Skills, 71, 1227-1252.
Emmorey, K., Norman, F., & O’Grady, L. (1991). The activation of spatial antecedents from overt
pronouns in American Sign Language. Language and Cognitive Processes, 6(3), 207-228.
Farah, M. (1988). Is visual imagery really visual? Overlooked evidence from neuropsychology.
Psychological Review, 95(3), 307-317.
Finke. R.A., & Shepard, R.N. (1986). Visual functions of mental imagery. In K.R. Boff, L.
Kaufman, & J.P. Thomas (Eds.), Handbook of perception and human performance. New York:
Wiley-Interscience.
Fodor, J.A. (1983). The modularity of mind. Cambridge, MA: MIT Press.
Gordon, H. (1986). The cognitive laterality battery: Tests of specialized cognitive functions. Znterna-
tional Journal of Neuroscience, 29, 223-244.
Hanson, V.L., & Lichtenstein. E.H. (1990). Short-term memory coding by deaf signers: The primary
language coding hypothesis reconsidered. Cognitive Psychology, 22, 211-224.
Hubel, D., & Wiesel, T. (1963). Single-cell responses in striate cortex of kittens deprived of vision in
one eye. Journal of Neurophysiology, 26, 1003-1017.
Jackendoff, R., & Landau, B. (1991). Spatial language and spatial cognition, In D.J. Napoli & J. Keg1
(Eds.), Bridges between psychology and linguistics: A Swarthmore Festschrift for Lila Gleitman.
Hillsdale, NJ: Erlbaum.
Klima, E.S., & Bellugi, U. (1979). The signs of language. Cambridge, MA: Harvard University Press.
Klima, E.S., Tzeng, O.J.L., Fok, Y.Y.A., Bellugi, U., & Corina, D. (1991). From sign to script:
Effects of linguistic experience on perceptual categorization. Manuscript under review.
Kosslyn, S.M. (1980). Image and mind. Cambridge, MA: Harvard University Press.
180 K. Emmorey et al.
Kosslyn, S.M., Brunn, J.L., Cave, K.R., & Wallach, R.W. (1985). Individual differences in mental
imagery ability: A computational analysis. Cognition, 18, 195-243.
Kosslyn, S., Cave, C., Provost, D., & Von Gierke, S. (1988). Sequential processes in image
generation. Cognitive Psychology, 20, 319-343.
Kosslyn, S.M., & Dror, I. (1992). Towards a cognitive neuroscience of Alzheimer’s disease: What can
be learned from studies of visual imagery? In P. Churchland (Ed.), Neurophilosophy and
Alzheimer’s disease. New York: Springer-Verlag.
Kosslyn, S., Margolis, J., Barrett, A., Goldknopf, E., & Daly, P. (1990). Age differences in imagery
abilities. Child Development, 6I(4), 995-1010.
Lenneberg, E. (1967). Biological foundations of language, New York: Wiley.
Liddell, S. (1980). American Sign Language syntax. The Hague: Mouton.
Liddell, S. (1990). Four functions of a locus: Re-examining the structure of space in ASL. In C. Lucas
(Ed.), Sign language research: Theoretical issues (pp. 176-198). Washington, DC: Gallaudet
University Press.
Lillo-Martin, D. (198711990). Studies of American Sign Language syntax and the principles and
parameters of universal grammar. In W. Edmondson & F. Karlsson (Eds.), SLR ‘87: Papers
from the fourth international symposium on sign language research (pp. 86-93). Hamburg:
Signum-Verlag Press.
Lillo-Martin, D., & Klima, E. (1990). Pointing out differences: ASL pronouns in syntactic theory. In
S.D. Fischer & P. Siple (Eds.), Theoretical issues in sign language research, Chicago: University
of Chicago Press.
McKee, D. (1987). An analysis of specialized cognitive functions in deaf and hearing signers.
Unpublished doctoral dissertation, University of Pittsburgh.
Mills, C. (1985). Perception of visual temporal patterns by deaf and hearing adults. Bullefin of the
Psychonomic Society, 23(6), 483-486.
Neville, H. (1988). Cerebral organization for spatial attention. In J. Stiles-Davis, M. Kritchevsky, &
U. Bellugi (Eds.), Spatial cognition: Brain bases and development (pp. 327-341). Hillsdale, NJ:
Erlbaum.
Newport, E. (1988). Constraints on learning and their role in language acquisition: Studies of the
acquisition of American Sign Language. Language Sciences, 10, 147-172.
Newport, E. (1990). Maturational constraints on language learning. Cognitive Science, 14, 11-28.
Newport, E. (1991). Contrasting conceptions of the critical period for language. In S. Carey & R.
Gelman (Eds.), Epigenesis of mind: Essays in biology and cognition, Hillsdale, NJ: Erlbaum.
Newport, E., & Meier, R. (1985). The acquisition of American Sign Language. In D. Slobin (Ed.),
The crosslinguistic study of language acquisition, Vol. 1: The data. Hillsdale, NJ: Erlbaum.
Newport, E., & Supalla, T. (1990). A critical period effect in the acquisition of a primary language.
Unpublished manuscript, University of Rochester, Rochester, NY.
Podgorny, P., & Shepard, R.N. (1978). Functional representations common to visual perception and
imagination. Journal of Experimental Psychology: Human Perception and Performance, 4,
21-35.
Poizner, H. (1983). Perception of movement in American Sign Language: Effects of linguistic
structure and linguistic experience. Perception and Psychophysics, 33(3), 215-231.
Roth, J., & Kosslyn, S.M. (1988). Construction of the third dimension in mental imagery. Cognitive
Psychology, 20, 344-361.
Schein, J., & Delk, M. (1974). The deaf population of the United States. Silver Spring, MD: National
Association of the Deaf.
Shepard, R.N., & Cooper, L.A. (1982). Mental images and their transformations. Cambridge, MA:
MIT Press.
Shepard, R., & Mender, J. (1971). Mental rotation of three-dimensional objects. Science. 171,
701-703.
Sperry, R. (1951). Mechanisms of neural maturation. In S.S. Stevens (Ed.), Handbook of experimen-
tal psychology, New York: Wiley.
Supalla, T. (1986). The classifier system in American Sign Language. In C. Craig (Ed.), Noun
classification and categorization. Amsterdam: J. Benjamins North America.

Visual imagery and visual-spatial language 181
Supalla, T. (in press). Structure and acquisition of verbs of motion and location in American Sign
Language. Cambridge, MA: MIT Press/Bradford Books.
Tomlinson-Keasey, C., & Smith-Winberry, C. (1990). Cognitive consequences of congenital deafness.
Journal of Genetic Psychology, 15(l), 103-115.
van Hoek, K. (1989). Locus splitting in American Sign Language. In R. Carlson, S. DeLancey, S.
Gildea, D. Payne, & A. Saxena (Eds.), Proceedings of the Fourth Meeting of rhe Pacific
Linguistics Conference (pp. 239-255). Eugene, OR: University of Oregon Press.
van Hoek, K. (in press). Conceptual locations for referents in ASL. In E. Sweetser & G. Fauconnier
(Eds.), Mental spaces, grammar, and discourse.